Embed Size (px)
Citation preview
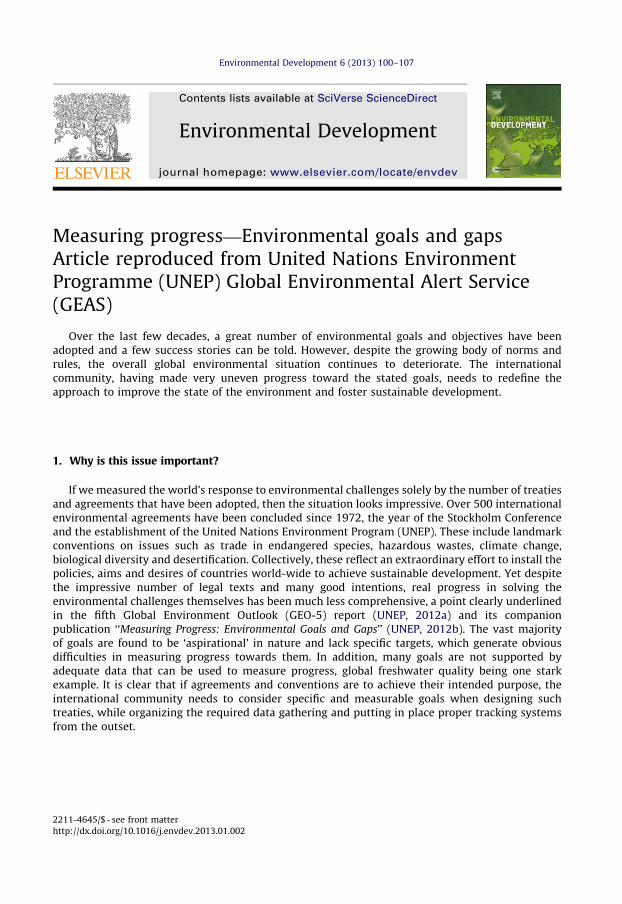
Contents lists available at SciVerse ScienceDirect
Environmental Development
Environmental Development 6 (2013) 100–107
2211-46
http://d
journal homepage: www.elsevier.com/locate/envdev
Measuring progress—Environmental goals and gapsArticle reproduced from United Nations EnvironmentProgramme (UNEP) Global Environmental Alert Service(GEAS)
Over the last few decades, a great number of environmental goals and objectives have beenadopted and a few success stories can be told. However, despite the growing body of norms andrules, the overall global environmental situation continues to deteriorate. The internationalcommunity, having made very uneven progress toward the stated goals, needs to redefine theapproach to improve the state of the environment and foster sustainable development.
1. Why is this issue important?
If we measured the world’s response to environmental challenges solely by the number of treatiesand agreements that have been adopted, then the situation looks impressive. Over 500 internationalenvironmental agreements have been concluded since 1972, the year of the Stockholm Conferenceand the establishment of the United Nations Environment Program (UNEP). These include landmarkconventions on issues such as trade in endangered species, hazardous wastes, climate change,biological diversity and desertification. Collectively, these reflect an extraordinary effort to install thepolicies, aims and desires of countries world-wide to achieve sustainable development. Yet despitethe impressive number of legal texts and many good intentions, real progress in solving theenvironmental challenges themselves has been much less comprehensive, a point clearly underlinedin the fifth Global Environment Outlook (GEO-5) report (UNEP, 2012a) and its companionpublication ‘‘Measuring Progress: Environmental Goals and Gaps’’ (UNEP, 2012b). The vast majorityof goals are found to be ‘aspirational’ in nature and lack specific targets, which generate obviousdifficulties in measuring progress towards them. In addition, many goals are not supported byadequate data that can be used to measure progress, global freshwater quality being one starkexample. It is clear that if agreements and conventions are to achieve their intended purpose, theinternational community needs to consider specific and measurable goals when designing suchtreaties, while organizing the required data gathering and putting in place proper tracking systemsfrom the outset.
45/$ - see front matter
x.doi.org/10.1016/j.envdev.2013.01.002
Measuring progress / Environmental Development 6 (2013) 100–107 101
2. Global environmental goals
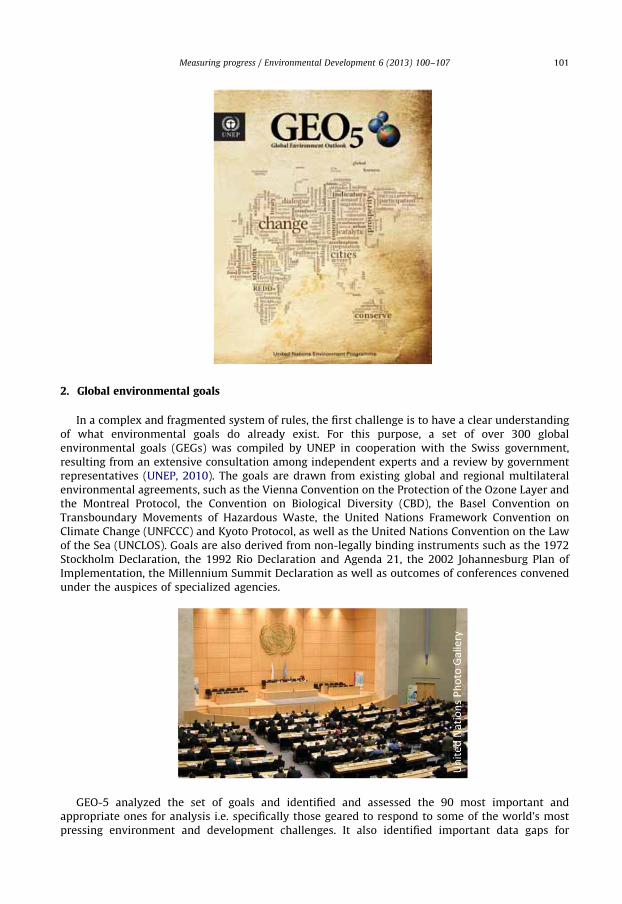
In a complex and fragmented system of rules, the first challenge is to have a clear understandingof what environmental goals do already exist. For this purpose, a set of over 300 globalenvironmental goals (GEGs) was compiled by UNEP in cooperation with the Swiss government,resulting from an extensive consultation among independent experts and a review by governmentrepresentatives (UNEP, 2010). The goals are drawn from existing global and regional multilateralenvironmental agreements, such as the Vienna Convention on the Protection of the Ozone Layer andthe Montreal Protocol, the Convention on Biological Diversity (CBD), the Basel Convention onTransboundary Movements of Hazardous Waste, the United Nations Framework Convention onClimate Change (UNFCCC) and Kyoto Protocol, as well as the United Nations Convention on the Lawof the Sea (UNCLOS). Goals are also derived from non-legally binding instruments such as the 1972Stockholm Declaration, the 1992 Rio Declaration and Agenda 21, the 2002 Johannesburg Plan ofImplementation, the Millennium Summit Declaration as well as outcomes of conferences convenedunder the auspices of specialized agencies.
GEO-5 analyzed the set of goals and identified and assessed the 90 most important andappropriate ones for analysis i.e. specifically those geared to respond to some of the world’s mostpressing environment and development challenges. It also identified important data gaps for
Measuring progress / Environmental Development 6 (2013) 100–107102
measuring progress and where possible an assessment of progress was provided, based on the bestavailable scientific findings.
3. Can we witness any progress to date?
Despite some notable successes, the international community has made very uneven progress inachieving global environmental goals and improving the state of the environment. There has beenlittle or no progress or further deterioration on about half of the goals and objectives analyzed underthe GEO-5 assessment. Environmental goals currently being addressed but with least successinclude:
�
F
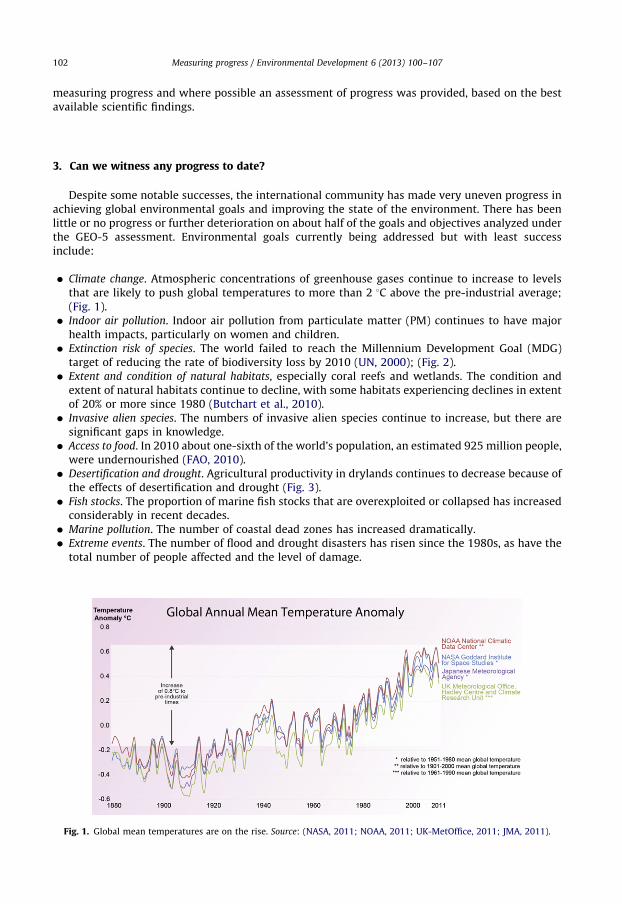
Climate change. Atmospheric concentrations of greenhouse gases continue to increase to levelsthat are likely to push global temperatures to more than 2 1C above the pre-industrial average;(Fig. 1).
� Indoor air pollution. Indoor air pollution from particulate matter (PM) continues to have majorhealth impacts, particularly on women and children.
� Extinction risk of species. The world failed to reach the Millennium Development Goal (MDG)target of reducing the rate of biodiversity loss by 2010 (UN, 2000); (Fig. 2).
� Extent and condition of natural habitats, especially coral reefs and wetlands. The condition andextent of natural habitats continue to decline, with some habitats experiencing declines in extentof 20% or more since 1980 (Butchart et al., 2010).
� Invasive alien species. The numbers of invasive alien species continue to increase, but there aresignificant gaps in knowledge.
� Access to food. In 2010 about one-sixth of the world’s population, an estimated 925 million people,were undernourished (FAO, 2010).
� Desertification and drought. Agricultural productivity in drylands continues to decrease because ofthe effects of desertification and drought (Fig. 3).
� Fish stocks. The proportion of marine fish stocks that are overexploited or collapsed has increasedconsiderably in recent decades.
� Marine pollution. The number of coastal dead zones has increased dramatically. � Extreme events. The number of flood and drought disasters has risen since the 1980s, as have thetotal number of people affected and the level of damage.
ig. 1. Global mean temperatures are on the rise. Source: (NASA, 2011; NOAA, 2011; UK-MetOffice, 2011; JMA, 2011).
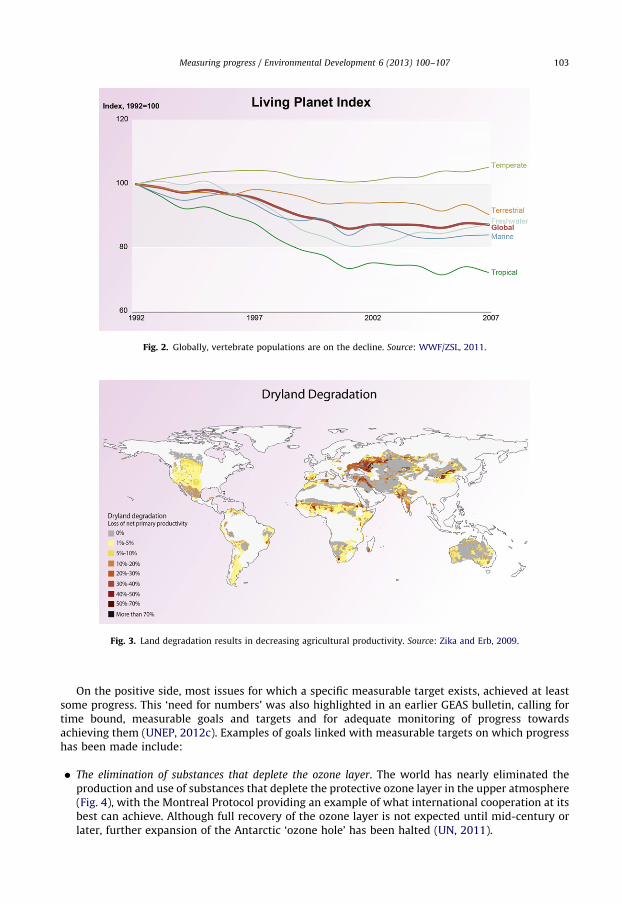
Fig. 2. Globally, vertebrate populations are on the decline. Source: WWF/ZSL, 2011.
Fig. 3. Land degradation results in decreasing agricultural productivity. Source: Zika and Erb, 2009.
Measuring progress / Environmental Development 6 (2013) 100–107 103
On the positive side, most issues for which a specific measurable target exists, achieved at leastsome progress. This ‘need for numbers’ was also highlighted in an earlier GEAS bulletin, calling fortime bound, measurable goals and targets and for adequate monitoring of progress towardsachieving them (UNEP, 2012c). Examples of goals linked with measurable targets on which progresshas been made include:
�
The elimination of substances that deplete the ozone layer. The world has nearly eliminated theproduction and use of substances that deplete the protective ozone layer in the upper atmosphere(Fig. 4), with the Montreal Protocol providing an example of what international cooperation at itsbest can achieve. Although full recovery of the ozone layer is not expected until mid-century orlater, further expansion of the Antarctic ‘ozone hole’ has been halted (UN, 2011).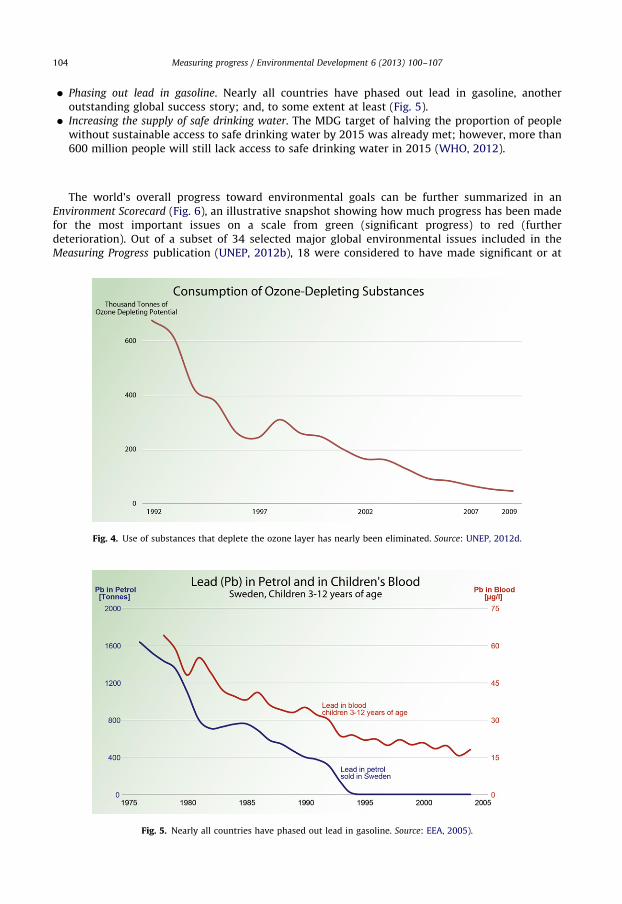
Measuring progress / Environmental Development 6 (2013) 100–107104
�
Phasing out lead in gasoline. Nearly all countries have phased out lead in gasoline, anotheroutstanding global success story; and, to some extent at least (Fig. 5). � Increasing the supply of safe drinking water. The MDG target of halving the proportion of peoplewithout sustainable access to safe drinking water by 2015 was already met; however, more than600 million people will still lack access to safe drinking water in 2015 (WHO, 2012).
The world’s overall progress toward environmental goals can be further summarized in anEnvironment Scorecard (Fig. 6), an illustrative snapshot showing how much progress has been madefor the most important issues on a scale from green (significant progress) to red (furtherdeterioration). Out of a subset of 34 selected major global environmental issues included in theMeasuring Progress publication (UNEP, 2012b), 18 were considered to have made significant or at
Fig. 4. Use of substances that deplete the ozone layer has nearly been eliminated. Source: UNEP, 2012d.
Fig. 5. Nearly all countries have phased out lead in gasoline. Source: EEA, 2005).

Fig. 6. Environment Scorecard 2012. Source: UNEP, 2012b.
Measuring progress / Environmental Development 6 (2013) 100–107 105
least some progress. For 11 issues it was considered that little or no progress was achieved, or evenfurther deterioration has taken place. Five issues could not properly be assessed due to lack of data.
The findings presented in Fig. 6 lend some support to the adage what is not measured cannot bemanaged—meaning to say that unless you measure something you do not know if it is getting betteror worse, and you cannot manage for improvement if you do not measure to see what is gettingbetter and what is not. This holds true in particular for many environmental challenges that can betackled only by a concerted international effort. The establishment of the Millennium DevelopmentGoals, following the Millennium Summit and its Millennium Declaration in 2000, shows how theadoption of specific, measurable targets can spur greater efforts to collect and coordinate data on theissues they cover. As the 2011 Millennium Development Goals report states:
‘As a result of recent efforts, more data are now available in the international series for theassessment of trends for all MDGs. In 2010, 119 countries had data for at least two points intime for 16–22 indicators; in contrast, only four countries had this data coverage in 2003.

Measuring progress / Environmental Development 6 (2013) 100–107106
These advances are the result of increased national capacity to venture into new data collectioninitiatives, as well as to increase the frequency of data collection.’ (UN, 2011).
The recent Rioþ20 Conference, focusing on ‘the future we want’, underscored the importance ofthe MDGs and called for a process to build on those and develop a broader set of sustainabledevelopment goals (SDGs), which should be ‘‘action-oriented, concise and easy to communicate,limited in number, aspirational, global in nature and universally applicable to all countries whiletaking into account different national realities, capacities and levels of development and respectingnational policies and priorities’’ (UN, 2012). It was also recognized that progress toward theachievement of the goals needs to be assessed and accompanied by targets and indicators whiletaking into account different national circumstances, and that there is a need for integrated andscientifically-based information on sustainable development. UNEP also pleads for more attentionand resources on improved monitoring and environmental data collection in order to providereliable and relevant information for decision-making. A new commitment to deal with persistentenvironmental problems and emerging issues calls for cooperation, flexibility and innovativesolutions (UNEP, 2011).
4. What can be done?
Many global environmental treaties and goals have been developed in a fragmented way, but theinterconnectedness between climate change, water resources, desertification and biodiversity loss,for example, makes isolated governance responses less effective. The fragmented internationalframework has also resulted in a heavy burden for some countries, in terms of reporting and fulfillingtheir obligations. Measurable targets can encourage the collection and coordination of data, therebyimproving our state of knowledge on the subjects they cover. In addition, it is often difficult tocompare the situation in different countries even when data are available, since many countriesfollow their own national guidelines when collecting them. For one, efforts should be made to makedata from different countries easier to compare, by promoting the use of international standards andframeworks such as the Framework for Development of Environment Statistics (FDES) currentlybeing revised by the United Nations and supporting the efforts to compile harmonized databases andmake data easily available and retrievable through dedicated information systems such as UNdata ,MDG Indicators or the proposed UNEPLive. Importantly, a considerable number of research and datagaps need to be addressed in order to track more accurately the state and trends of the globalenvironment. Collection of data needs to be strengthened for a good number of issues such asfreshwater quantity and quality, groundwater depletion, ecosystem services, land degradation andchemicals and waste.
In conclusion, the international community should consider establishing clear and measurabletargets covering a broader range of environmental challenges, particularly those currently beingaddressed with least success, those with more irreversible and imminent effects on humanlivelihoods, and overall those with greatest relevance to the achievement of sustainabledevelopment. Ongoing and future priorities include promoting, where possible, the use of commonstandards for data collection and analysis, increased data sharing, consistent time series ofenvironmental observations, capacity building to strengthen environment statistics and other data ina wider range of countries, and harnessing new technologies to communicate environmentalinformation effectively to policy makers and the public.
Acknowledgments
Written by: Jaap van Woerden (UNEP/DEWA/GRID-Geneva).

Measuring progress / Environmental Development 6 (2013) 100–107 107
Production and Outreach Team: Arshia Chander, Kim Giese, Lindsey Harriman, MichelleAnthony, and Reza Hussain (UNEP/GRID-Sioux Falls), Theuri Mwangi and Erick Litswa (UNEP/DEWA/Nairobi).
Special thanks to David Piper (UNEP/DTIE) and Jorn Scharlemann (UNEP/WCMC) for reviewingthis bulletin.
References
Butchart, S., Walpole, M., Collen, B., van Strien, A., Scharlemann, J., Almond, R., Baillie, J., Bomhard, B., Brown, C., Bruno, J.,Carpenter, K., Carr, G., Chanson, J., Chenery, A., Csirke, J., Davidson, N., Dentener, F., Foster, M., Galli, A., Galloway, J.,Genovesi, P., Gregory, R., Hockings, M., Kapos, V., Lamarque, J.-F., Leverington, F., Loh, J., McGeoch, M., McRae, L., Minasyan, A.,Hernandez Morcillo, M., Oldfield, T., Pauly, D., Quader, S., Revenga, C., Sauer, J., Skolnik, B., Spear, D., Stanwell-Smith, D., Stuart,S., Symes, A., Tierney, M., Tyrrell, T., Vie, J.-C., Watson, R., 2010. Global biodiversity: indicators of recent declines. Science 328,1164–1168.
EEA, 2005. Data and Maps, Maps and Graphs. /http://www.eea.europa.eu/data-and-maps/figures/lead-concentrations-in-childrens-blood-and-lead-in-petrol-tonne-sold-in-sweden-1976-2003S (accessed 18.12.12).
FAO, 2010. The State of Food Insecurity in the World: Addressing Food Insecurity in Protracted Crises. Food and AgricultureOrganization of the United Nations, Rome. /http://www.fao.org/docrep/013/i1683e/i1683e00.htmS (accessed 10.12.12).
JMA, 2011. Global Temperature in 2010. Tokyo Climate Center News—Tokyo climate Center, Japan Meteorological Agency./http://ds.data.jma.go.jp/tcc/tcc/news/tccnews23.pdfS (accessed 18.12.2012).
NASA, 2011. NASA Research Finds 2010 Tied for Warmest Year on Record. /http://www.giss.nasa.gov/research/news/20110112/S (accessed 18.12.12).
NOAA, 2011. National Climatic Data Center, State of the Climate: Annual 2010 Report—Global Analysis. Published onlineJanuary 2011. /http://www.ncdc.noaa.gov/sotc/2010/13S (accessed 18.12.12).
UK-MetOffice, 2011. 2010—a near record year. /http://www.metoffice.gov.uk/news/releases/archive/2011/2010-global-temperatureS (accessed 18.12.12).
UN, 2000. Millennium Development Goals. United Nations, New York. /http://www.un.org/millenniumgoals/S (accessed10.12.12).
UN, 2011. The Millennium Development Goals Report 2011. United Nations, New York. /http://www.un.org/millenniumgoals/11_MDG%20Report_EN.pdfS (accessed 10.12.12).
UN, 2012. The Future we Want. Outcome Document Adopted at Rioþ20. United Nations, New York. /http://www.uncsd2012.org/content/documents/727The%20Future%20We%20Want%2019%20June%201230pm.pdfS (accessed 10.12.12).
UNEP, 2010. Existing Internationally Agreed Environmental Goals and Objectives. Document UNEP/GC.25/INF/16. UnitedNations Environment Programme, Nairobi. /http://www.unep.org/gc/gc25/info-docs.aspS (accessed 10.12.12).
UNEP, 2011. Keeping Track of Our Changing Environment: From Rio to Rioþ20 (1992-2012). United Nations EnvironmentProgramme, Nairobi. /http://www.unep.org/geo/pdfs/Keeping_Track.pdfS (accessed 10.12.12).
UNEP, 2012a. Global Environment Outlook 5. Environment for the Future we Want. United Nations Environment Programme,Nairobi. /http://www.unep.org/geo/pdfs/geo5/GEO5_report_full_en.pdfS (accessed 10.12.12).
UNEP, 2012b. Measuring Progress: Environmental Goals and Gaps. United Nations Environment Programme, Nairobi. /http://www.unep.org/geo/pdfs/geo5/Measuring_progress.pdfS (accessed 10.12.12).
UNEP, 2012c. The Need for Numbers—Goals, Targets and Indicators for the Environment. GEAS Bulletin March 2012. UnitedNations Environment Programme, Nairobi. /http://www.unep.org/pdf/GEAS_Mar2012_Indicator.pdfS (accessed10.12.12).
UNEP, 2012d. The UNEP Environmental Data Explorer. /http://geodata.grid.unep.chS (accessed 18.12.12).WHO, 2012. WHO/UNICEF Joint Monitoring Programme (JMP) for water supply and sanitation: data resources and estimates.
World Health Organization, Geneva (accessed 10.12.12).WWF/ZSL, 2011. The Living Planet Report 2010. /http://awsassets.panda.org/downloads/wwf_lpr2010_lr_en.pdfS (accessed
18.12.12).Zika, M., Erb, K.H., 2009. The Global Loss of Net Primary Production Resulting From Human-Induced Soil Degradation in Drylands.
/http://www.uni-klu.ac.at/socec/downloads/7_2009_ZikaErb_SoilDegradation_EE_SpecIss_54.pdfS (accessed 18.12.12).