Embed Size (px)
Citation preview
Measuring Rapid Enzymatic Kinetics byElectrochemical Method in Droplet-BasedMicrofluidic Devices with Pneumatic Valves
Zuoyan Han,† Wentao Li,‡ Yanyi Huang,‡ and Bo Zheng*,†
Department of Chemistry, The Chinese University of Hong Kong, Shatin, Hong Kong, and Department of AdvancedMaterials and Nanotechnology, College of Engineering, Peking University, Beijing 100871, China
This paper describes a droplet-based microfluidic chipwith pneumatic valves for measuring millisecond enzymekinetics using amperometric detection method. Aqueousstreams containing reactants were injected to an oil flowto form droplets, and each droplet represented onemicroreactor. Pneumatic valves were used to control themoving distance and in turn the reaction time of thedroplets. The reaction time was also fine-tuned by varyingthe flow rate of the droplets in microchannels. A completeMichaelis-Menten kinetics of catalase was successfullymeasured by amperometric method in a single-run ex-periment, and the total consumption of reagents was lessthan 50 µL. In the current experiment, the best timeresolution was about 0.05 s, and the reaction timemeasured was from 0.05 to 25 s. This microfluidic systemis applicable to many biochemical reactions, as long asone of the reactants or products is electrochemicallyactive. With appropriate quenching method at the outlet,various detection methods can be integrated into themicrofluidic system, further extending the application ofthe combination of pneumatic valves and droplets inmicrochannels.
Rapid kinetics measurement is essential to understanding manybiological and chemical processes, such as protein and RNAfolding, protein-protein interaction, and enzymatic mechanism.For rapid kinetics within microseconds to seconds, stopped-flow1,2
and quenched-flow3,4 are the two most often used measurementmethods. In both methods, two or more reactant solutions arerapidly mixed in a mixing chamber. At desired reaction time,the flow is either stopped or quenched, and the reaction can bemonitored using an appropriate detection method. Both of thesetechniques provide fast mixing and short dead time for studyingrapid kinetics. However, the conventional instrumentation usingthese two methods consumes large volumes of samples, which
are not compatible with bioanalysis as the reagents are usuallyexpensive or in limited supply.
To solve the problem, various microfluidic platforms have beendeveloped. Microfluidics has the advantage of low sample con-sumption, therefore is an attractive platform for bioanalysis. Oneof the major difficulties in utilizing microfluidics for bioanalysis,especially for kinetics measurement, is to mix nanoliter ofsolutions rapidly.5 Several tricks have been played to enhancemixing in microfluidics.6-8 Knight et al. developed a flow focusingmicrofluidic device capable of squeezing the central stream tosubmicrometer in thickness, thus reducing the diffusive mixingtimes to less than 10 µs. The flow focusing device facilitated thestudy of fast reaction kinetics such as RNA folding on time scalesof hundreds of microseconds by monitoring the fluorescencesignal in the central stream.6,9,10 Song et al. demonstratedmillisecond kinetics measurement on a droplet-based microfluidicchip by moving the droplets through winding microchannels andinducing chaotic flow inside the droplets. Kinetics of the cleavageof a fluorogenic substrate by RNase A was studied by analysis ofthe fluorescent image of the microfluidic device.11 Droplet-basedmicrofluidic system is a powerful method for kinetics measure-ment with advantages such as no dispersion, rapid mixing andon-chip dilution.12,13 In both flow focusing and droplet-basedmicrofluidic systems, fluorescence detection is the most widelyused detection method, with excellent sensitivity and convenienceto implement by using fluorescence microscope. Since mostbiomolecules have no or extremely weak fluorescence, thesemolecules need to be labeled with fluorescence tags. The potentialissues of using fluorescence tags in kinetics measurement includephotobleaching of the fluorescence tag and interference of the
* Corresponding author.† The Chinese University of Hong Kong.‡ Peking University.
(1) Olson, S. T.; Bjork, I. J. Biol. Chem. 1991, 266, 6353–6364.(2) Khorasanizadeh, S.; Peters, I. D.; Butt, T. R.; Roder, H. Biochemistry 1993,
32, 7054–7063.(3) Eyles, S. J.; Radford, S. E.; Robinson, C. V.; Dobson, C. M. Biochemistry
1994, 33, 13038–13048.(4) Kane, D. J.; Fendler, K.; Grell, E.; Bamberg, E.; Taniguchi, K.; Froehlich,
J. P.; Clarke, R. J. Biochemistry 1997, 36, 13406–13420.
(5) Ottino, J. M.; Wiggins, S. Philos. Trans. R. Soc., A 2005, 362, 923–935.(6) Knight, J. B.; Vishwanath, A.; Brody, J. P.; Austin, R. H. Phys. Rev. Lett.
1998, 80, 3863–3866.(7) Song, H.; Tice, J. D.; Ismagilov, R. F. Angew. Chem., Int. Ed. 2003, 42,
768–772.(8) Stroock, A. D.; Dertinger, S. K. W.; Ajdari, A.; Mezic, I.; Stone, H. A.;
Whitesides, G. M. Science 2002, 295, 647–651.(9) Pollack, L.; Tate, M. W.; Darnton, N. C.; Knight, J. B.; Gruner, S. M.; Eaton,
W. A.; Austin, R. H. Proc. Natl. Acad. Sci. U. S. A. 1999, 96, 10115–10117.(10) Pollack, L.; Tate, M. W.; Finnefrock, A. C.; Kalidas, C.; Trotter, S.; Darnton,
N. C.; Lurio, L.; Austin, R. H.; Batt, C. A.; Gruner, S. M.; Mochrie, S. G. J.Phys. Rev. Lett. 2001, 86, 4962–4965.
(11) Song, H.; Ismagilov, R. F. J. Am. Chem. Soc. 2003, 125, 14613–14619.(12) Huebner, A.; Sharma, S.; Srisa-Art, M.; Hollfelder, F.; Edel, J. B.; Demello,
A. J. Lab Chip 2008, 8, 1244–1254.(13) Song, H.; Chen, D. L.; Ismagilov, R. F. Angew. Chem., Int. Ed. 2006, 45,
7336–7356.
Anal. Chem. 2009, 81, 5840–5845
10.1021/ac900811y CCC: $40.75 2009 American Chemical Society5840 Analytical Chemistry, Vol. 81, No. 14, July 15, 2009Published on Web 06/11/2009
Dow
nloa
ded
by B
EIJ
ING
UN
IV o
n Ju
ly 2
8, 2
009
Publ
ishe
d on
Jun
e 11
, 200
9 on
http
://pu
bs.a
cs.o
rg |
doi:
10.1
021/
ac90
0811
y
fluorescence tag with the kinetics or function of the targetmolecules.
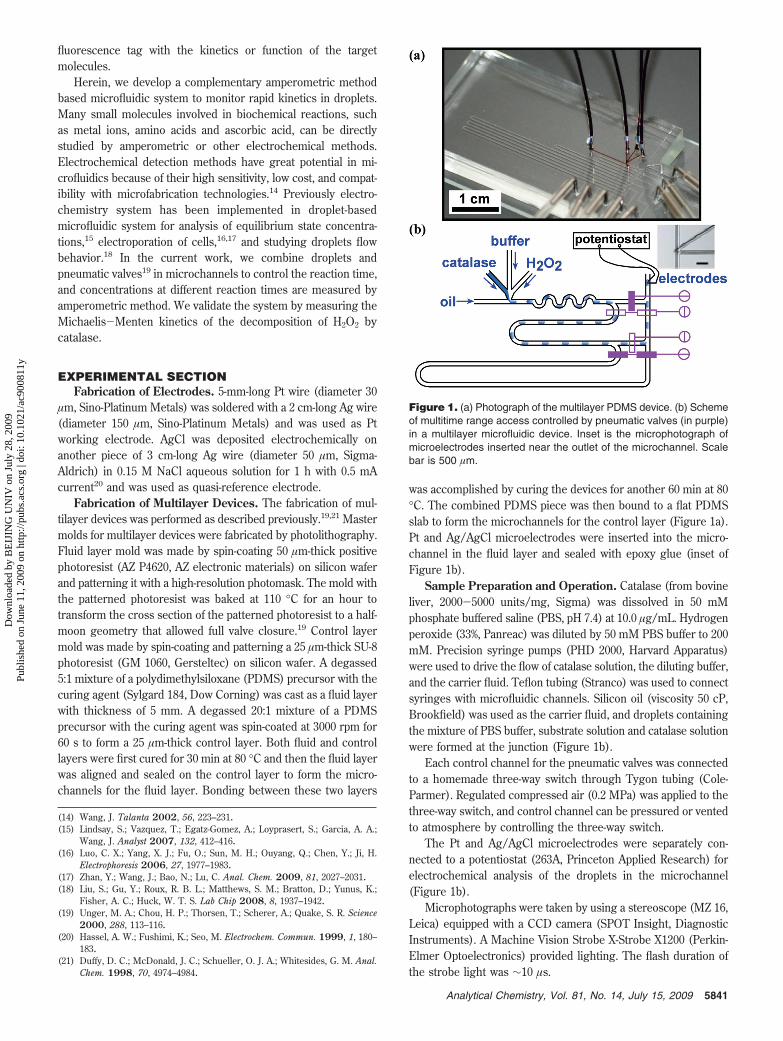
Herein, we develop a complementary amperometric methodbased microfluidic system to monitor rapid kinetics in droplets.Many small molecules involved in biochemical reactions, suchas metal ions, amino acids and ascorbic acid, can be directlystudied by amperometric or other electrochemical methods.Electrochemical detection methods have great potential in mi-crofluidics because of their high sensitivity, low cost, and compat-ibility with microfabrication technologies.14 Previously electro-chemistry system has been implemented in droplet-basedmicrofluidic system for analysis of equilibrium state concentra-tions,15 electroporation of cells,16,17 and studying droplets flowbehavior.18 In the current work, we combine droplets andpneumatic valves19 in microchannels to control the reaction time,and concentrations at different reaction times are measured byamperometric method. We validate the system by measuring theMichaelis-Menten kinetics of the decomposition of H2O2 bycatalase.
EXPERIMENTAL SECTIONFabrication of Electrodes. 5-mm-long Pt wire (diameter 30
µm, Sino-Platinum Metals) was soldered with a 2 cm-long Ag wire(diameter 150 µm, Sino-Platinum Metals) and was used as Ptworking electrode. AgCl was deposited electrochemically onanother piece of 3 cm-long Ag wire (diameter 50 µm, Sigma-Aldrich) in 0.15 M NaCl aqueous solution for 1 h with 0.5 mAcurrent20 and was used as quasi-reference electrode.
Fabrication of Multilayer Devices. The fabrication of mul-tilayer devices was performed as described previously.19,21 Mastermolds for multilayer devices were fabricated by photolithography.Fluid layer mold was made by spin-coating 50 µm-thick positivephotoresist (AZ P4620, AZ electronic materials) on silicon waferand patterning it with a high-resolution photomask. The mold withthe patterned photoresist was baked at 110 °C for an hour totransform the cross section of the patterned photoresist to a half-moon geometry that allowed full valve closure.19 Control layermold was made by spin-coating and patterning a 25 µm-thick SU-8photoresist (GM 1060, Gersteltec) on silicon wafer. A degassed5:1 mixture of a polydimethylsiloxane (PDMS) precursor with thecuring agent (Sylgard 184, Dow Corning) was cast as a fluid layerwith thickness of 5 mm. A degassed 20:1 mixture of a PDMSprecursor with the curing agent was spin-coated at 3000 rpm for60 s to form a 25 µm-thick control layer. Both fluid and controllayers were first cured for 30 min at 80 °C and then the fluid layerwas aligned and sealed on the control layer to form the micro-channels for the fluid layer. Bonding between these two layers
was accomplished by curing the devices for another 60 min at 80°C. The combined PDMS piece was then bound to a flat PDMSslab to form the microchannels for the control layer (Figure 1a).Pt and Ag/AgCl microelectrodes were inserted into the micro-channel in the fluid layer and sealed with epoxy glue (inset ofFigure 1b).
Sample Preparation and Operation. Catalase (from bovineliver, 2000-5000 units/mg, Sigma) was dissolved in 50 mMphosphate buffered saline (PBS, pH 7.4) at 10.0 µg/mL. Hydrogenperoxide (33%, Panreac) was diluted by 50 mM PBS buffer to 200mM. Precision syringe pumps (PHD 2000, Harvard Apparatus)were used to drive the flow of catalase solution, the diluting buffer,and the carrier fluid. Teflon tubing (Stranco) was used to connectsyringes with microfluidic channels. Silicon oil (viscosity 50 cP,Brookfield) was used as the carrier fluid, and droplets containingthe mixture of PBS buffer, substrate solution and catalase solutionwere formed at the junction (Figure 1b).
Each control channel for the pneumatic valves was connectedto a homemade three-way switch through Tygon tubing (Cole-Parmer). Regulated compressed air (0.2 MPa) was applied to thethree-way switch, and control channel can be pressured or ventedto atmosphere by controlling the three-way switch.
The Pt and Ag/AgCl microelectrodes were separately con-nected to a potentiostat (263A, Princeton Applied Research) forelectrochemical analysis of the droplets in the microchannel(Figure 1b).
Microphotographs were taken by using a stereoscope (MZ 16,Leica) equipped with a CCD camera (SPOT Insight, DiagnosticInstruments). A Machine Vision Strobe X-Strobe X1200 (Perkin-Elmer Optoelectronics) provided lighting. The flash duration ofthe strobe light was ∼10 µs.
(14) Wang, J. Talanta 2002, 56, 223–231.(15) Lindsay, S.; Vazquez, T.; Egatz-Gomez, A.; Loyprasert, S.; Garcia, A. A.;
Wang, J. Analyst 2007, 132, 412–416.(16) Luo, C. X.; Yang, X. J.; Fu, O.; Sun, M. H.; Ouyang, Q.; Chen, Y.; Ji, H.
Electrophoresis 2006, 27, 1977–1983.(17) Zhan, Y.; Wang, J.; Bao, N.; Lu, C. Anal. Chem. 2009, 81, 2027–2031.(18) Liu, S.; Gu, Y.; Roux, R. B. L.; Matthews, S. M.; Bratton, D.; Yunus, K.;
Fisher, A. C.; Huck, W. T. S. Lab Chip 2008, 8, 1937–1942.(19) Unger, M. A.; Chou, H. P.; Thorsen, T.; Scherer, A.; Quake, S. R. Science
2000, 288, 113–116.(20) Hassel, A. W.; Fushimi, K.; Seo, M. Electrochem. Commun. 1999, 1, 180–
183.(21) Duffy, D. C.; McDonald, J. C.; Schueller, O. J. A.; Whitesides, G. M. Anal.
Chem. 1998, 70, 4974–4984.
Figure 1. (a) Photograph of the multilayer PDMS device. (b) Schemeof multitime range access controlled by pneumatic valves (in purple)in a multilayer microfluidic device. Inset is the microphotograph ofmicroelectrodes inserted near the outlet of the microchannel. Scalebar is 500 µm.
5841Analytical Chemistry, Vol. 81, No. 14, July 15, 2009
Dow
nloa
ded
by B
EIJ
ING
UN
IV o
n Ju
ly 2
8, 2
009
Publ
ishe
d on
Jun
e 11
, 200
9 on
http
://pu
bs.a
cs.o
rg |
doi:
10.1
021/
ac90
0811
y

RESULTS AND DISCUSSIONControl of Reaction Time in Droplets. The reaction started
once the droplets were generated by combining the aqueousstreams and injecting them into the flow of silicone oil at thejunction of the microchannel (Figure 1b). The reaction time inthe droplets was the time that the droplets spent in the micro-channel until they arrived at the microelectrodes. There were twoways to vary the reaction time in the droplets in our microfluidicsystem: (1) changing the flow rate to tune the reaction time; (2)using the pneumatic valves to change the flow route and in turnthe travel time of the droplets (Figure 2).
When the flow rate was varied to tune the reaction time, themaximum flow rate was limited by the highest pressure allowedat the inlets of the PDMS device. On the other hand, low flowrate led to long droplets, which required long mixing time as thedroplets flowed through the winding microchannel.22 In ourexperiment, the flow rate varied between 10 and 100 mm/s. Sincemost reactions are of positive reaction order, it is necessary toobtain more data points in the initial stage of the reactions in thekinetics measurement. We varied the flow rates when the dropletsmoved in the shortest route (Figure 2a), and the reaction timeranged from 0.05 to 0.5 s. When the pneumatic valves were usedto vary the reaction time in the droplets, the flow rate of thedroplets was maintained constant at 10 mm/s. As a result, thecombined reaction time ranged from 0.05 s (in the shortest route)to 25 s (in the longest route).
Features of the Microfluidic Device. The time resolutionof the current device is 0.05 s, which is limited by the maximumtotal flow rate vmax (100 mm/s) and the distance between theT-junction for droplets formation and the microelectrodes (5mm). The segment of winding channel induced chaotic advec-
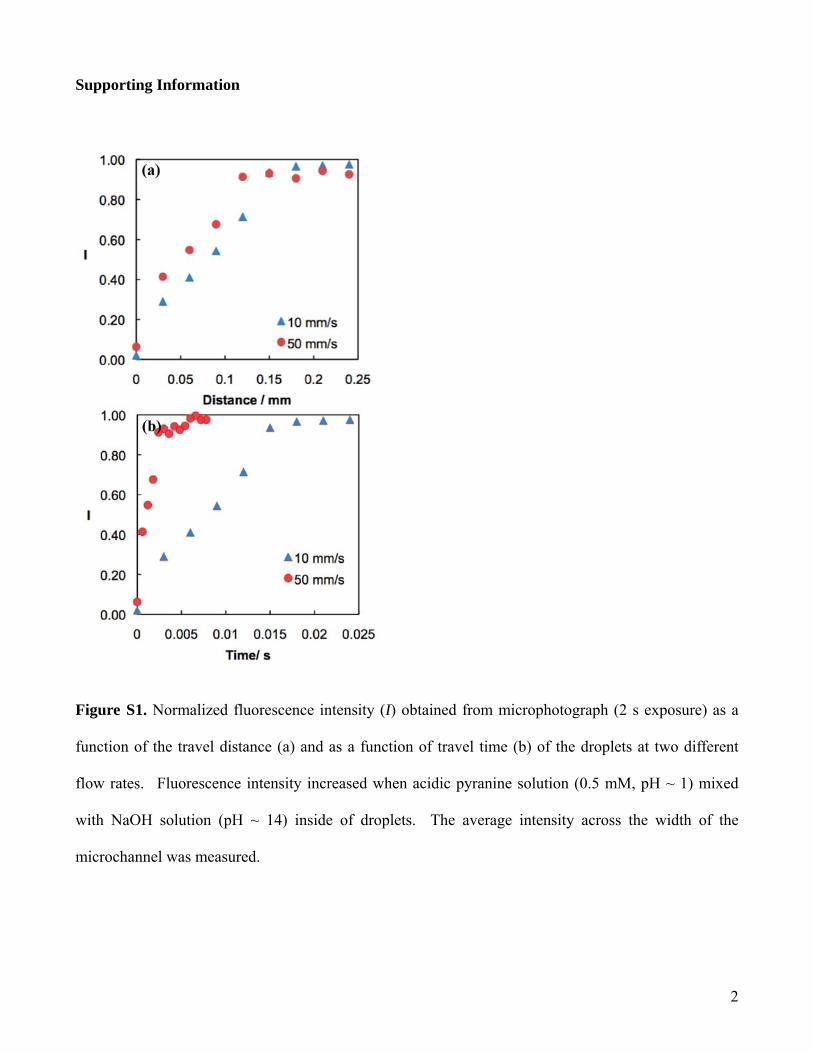
tion inside the droplets, which led to rapid mixing of thereagents in each droplet.7 It has been shown that efficientmixing can be achieved by driving the droplets through onlya short segment of such winding channel.23 We used pyranineto characterize the mixing time in our droplet-based microflu-idic system. Fluorescence intensity of pyranine increaseddramatically when the solution pH changed from acidic to basic.By monitoring the fluorescence change of the droplets contain-ing acidic pyranine solution (0.5 mM, pH ∼ 1) and NaOHsolution (pH ∼ 14), we found that the mixing was completedwithin 0.02 s in our experiment (Supporting Information (SI)Figure S1), which was shorter than the time resolution of thedevice.
The Selwyn’s test11,24 was performed in the droplet system todemonstrate that there was no denaturation of the enzyme. Inthis test, the kinetics of the substrate consumption was monitoredat different enzyme concentration. The resulting curves of thepercentage of converted H2O2 versus the product of catalaseconcentration and time were found superimposable (SI FigureS2), suggesting that there was no apparent denaturation of catalasein our microfluidic system.
We observed that some droplets were split after the dropletspassed by the Ag/AgCl electrode (Figure 3). Although thesplitting did not interfere with the electrochemical measurement,it would be desirable to control the splitting in case more studiesof the droplet content were required after the electrochemicalmeasurement. We found that the splitting could be avoided by
(22) Bringer, M. R.; Gerdts, C. J.; Song, H.; Tice, J. D.; Ismagilov, R. F. Philos.Trans. R. Soc. Lond. A 2004, 362, 1087–1104.
(23) Song, H.; Bringer, M. R.; Tice, J. D.; Gerdts, C. J.; Ismagilov, R. F. Appl.Phys. Lett. 2003, 83, 4664–4666.
(24) Selwyn, M. J. Biochim. Biophys. Acta 1965, 105, 193–195.
Figure 2. Microphotograph of the droplets moving along different routes controlled by pneumatic valves. (a) Droplets taking the shortest routeof ∼5 mm-long; (b) Droplets taking the second route of ∼20 mm-long; (c) Droplets taking the third route of ∼50 mm-long; (d) Droplets takingthe fourth route of ∼110 mm-long. The droplets contained Fe(SCN)x
(3-x)+ for better observation. The length of droplets was shorter at theposition where a valve was located, because the flexible PDMS membrane between the fluid channel and valve was forced to go down, increasingthe height of the fluid channel.
5842 Analytical Chemistry, Vol. 81, No. 14, July 15, 2009
Dow
nloa
ded
by B
EIJ
ING
UN
IV o
n Ju
ly 2
8, 2
009
Publ
ishe
d on
Jun
e 11
, 200
9 on
http
://pu
bs.a
cs.o
rg |
doi:
10.1
021/
ac90
0811
y
using smaller-sized microelectrodes (SI Figure S3). In addition,reducing the length of the microelectrodes presented in themicrochannel might also help prevent the droplets from splitting(SI Figure S4).
Five kinetic profiles were obtained at different concentrationsof H2O2 in a single run. Each kinetic profile was measuredwithin 1 min, consuming less than 10 µL of the combinedreagent solutions. Therefore the total consumption of samplefor a complete Michaelis-Menten kinetics with five differentsubstrate concentrations was less than 50 µL. We envision thatthe reagent consumption can be significantly reduced by auto-mating the flow rate control25 and using smaller microchannels.
Electrochemistry of Hydrogen Peroxide. H2O2 is oxidizedat the surface of metal electrodes such as platinum polarizedto 600 mV:26 H2O2 f 2H+ + O2 + 2e.
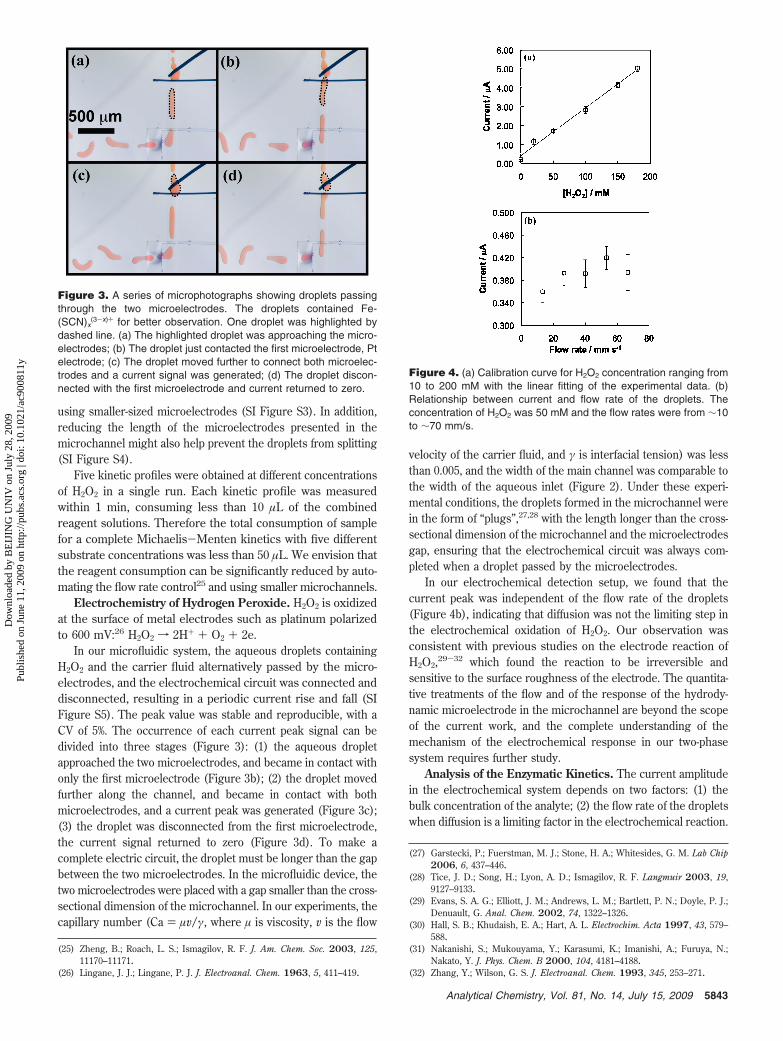
In our microfluidic system, the aqueous droplets containingH2O2 and the carrier fluid alternatively passed by the micro-electrodes, and the electrochemical circuit was connected anddisconnected, resulting in a periodic current rise and fall (SIFigure S5). The peak value was stable and reproducible, with aCV of 5%. The occurrence of each current peak signal can bedivided into three stages (Figure 3): (1) the aqueous dropletapproached the two microelectrodes, and became in contact withonly the first microelectrode (Figure 3b); (2) the droplet movedfurther along the channel, and became in contact with bothmicroelectrodes, and a current peak was generated (Figure 3c);(3) the droplet was disconnected from the first microelectrode,the current signal returned to zero (Figure 3d). To make acomplete electric circuit, the droplet must be longer than the gapbetween the two microelectrodes. In the microfluidic device, thetwo microelectrodes were placed with a gap smaller than the cross-sectional dimension of the microchannel. In our experiments, thecapillary number (Ca ) µv/γ, where µ is viscosity, v is the flow
velocity of the carrier fluid, and γ is interfacial tension) was lessthan 0.005, and the width of the main channel was comparable tothe width of the aqueous inlet (Figure 2). Under these experi-mental conditions, the droplets formed in the microchannel werein the form of “plugs”,27,28 with the length longer than the cross-sectional dimension of the microchannel and the microelectrodesgap, ensuring that the electrochemical circuit was always com-pleted when a droplet passed by the microelectrodes.
In our electrochemical detection setup, we found that thecurrent peak was independent of the flow rate of the droplets(Figure 4b), indicating that diffusion was not the limiting step inthe electrochemical oxidation of H2O2. Our observation wasconsistent with previous studies on the electrode reaction ofH2O2,29-32 which found the reaction to be irreversible andsensitive to the surface roughness of the electrode. The quantita-tive treatments of the flow and of the response of the hydrody-namic microelectrode in the microchannel are beyond the scopeof the current work, and the complete understanding of themechanism of the electrochemical response in our two-phasesystem requires further study.
Analysis of the Enzymatic Kinetics. The current amplitudein the electrochemical system depends on two factors: (1) thebulk concentration of the analyte; (2) the flow rate of the dropletswhen diffusion is a limiting factor in the electrochemical reaction.
(25) Zheng, B.; Roach, L. S.; Ismagilov, R. F. J. Am. Chem. Soc. 2003, 125,11170–11171.
(26) Lingane, J. J.; Lingane, P. J. J. Electroanal. Chem. 1963, 5, 411–419.
(27) Garstecki, P.; Fuerstman, M. J.; Stone, H. A.; Whitesides, G. M. Lab Chip2006, 6, 437–446.
(28) Tice, J. D.; Song, H.; Lyon, A. D.; Ismagilov, R. F. Langmuir 2003, 19,9127–9133.
(29) Evans, S. A. G.; Elliott, J. M.; Andrews, L. M.; Bartlett, P. N.; Doyle, P. J.;Denuault, G. Anal. Chem. 2002, 74, 1322–1326.
(30) Hall, S. B.; Khudaish, E. A.; Hart, A. L. Electrochim. Acta 1997, 43, 579–588.
(31) Nakanishi, S.; Mukouyama, Y.; Karasumi, K.; Imanishi, A.; Furuya, N.;Nakato, Y. J. Phys. Chem. B 2000, 104, 4181–4188.
(32) Zhang, Y.; Wilson, G. S. J. Electroanal. Chem. 1993, 345, 253–271.
Figure 3. A series of microphotographs showing droplets passingthrough the two microelectrodes. The droplets contained Fe-(SCN)x
(3-x)+ for better observation. One droplet was highlighted bydashed line. (a) The highlighted droplet was approaching the micro-electrodes; (b) The droplet just contacted the first microelectrode, Ptelectrode; (c) The droplet moved further to connect both microelec-trodes and a current signal was generated; (d) The droplet discon-nected with the first microelectrode and current returned to zero.
Figure 4. (a) Calibration curve for H2O2 concentration ranging from10 to 200 mM with the linear fitting of the experimental data. (b)Relationship between current and flow rate of the droplets. Theconcentration of H2O2 was 50 mM and the flow rates were from ∼10to ∼70 mm/s.
5843Analytical Chemistry, Vol. 81, No. 14, July 15, 2009
Dow
nloa
ded
by B
EIJ
ING
UN
IV o
n Ju
ly 2
8, 2
009
Publ
ishe
d on
Jun
e 11
, 200
9 on
http
://pu
bs.a
cs.o
rg |
doi:
10.1
021/
ac90
0811
y
Accordingly two calibration curves would be required for usingamperometric method to analyze the droplet content in the currentmicrofluidic system: (1) the current signal dependence on theconcentration of the electrochemically active molecule; (2) thecurrent signal dependence on the flow rate of the droplets. Bothcalibration curves could be obtained in a single experimental runby manipulating the individual flow rates of H2O2 stream, thediluting buffer stream, and the carrier fluid. The first calibrationcurve (Figure 4a) was established at varying concentration ofH2O2 in the droplets by changing the ratio of the flow rates ofthe buffer and H2O2 streams while maintaining the combinedflow rate constant. In the concentration range in our experimentfor enzyme activity measurement, the peak heights of thecurrent signal were linearly proportional to the concentrationof H2O2 in the droplets. The second calibration curve wasestablished by gradually increasing the flow rates of both H2O2
solution and the buffer, while the ratio of the two aqueousstreams was maintained constant (Figure 4b). As we mentionedin the previous section, the current signal of H2O2 oxidation wasindependent of the flow rate, therefore the second calibrationcurve was essentially a flat line in the case of electrochemicaloxidation of H2O2. As a result, the analysis of the current signalof H2O2 oxidation was simplified by referring to only thecalibration curve of the current versus the bulk concentrationof H2O2.
The calibration of the current signal versus H2O2 concentrationwas performed both before and after the Selwyn’s test. The twosuperimposable calibration curves suggested that there was noobvious adsorption of protein or other contaminants on the surfaceof the microelectrodes during the kinetics measurement (SI FigureS6).
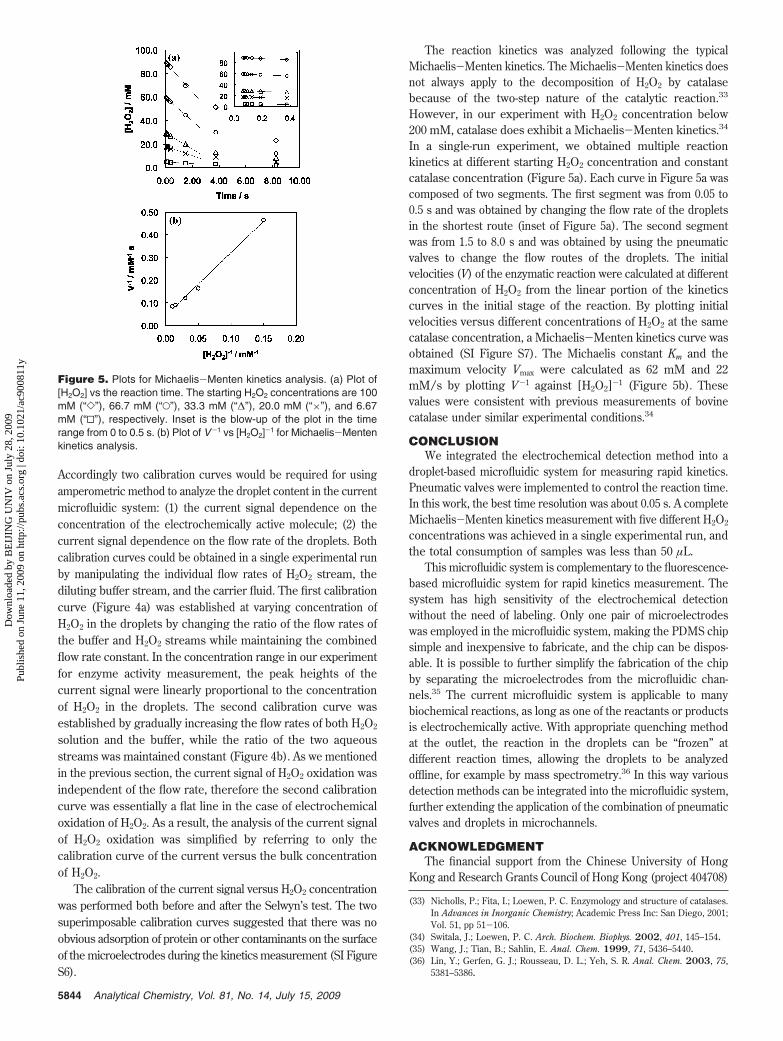
The reaction kinetics was analyzed following the typicalMichaelis-Menten kinetics. The Michaelis-Menten kinetics doesnot always apply to the decomposition of H2O2 by catalasebecause of the two-step nature of the catalytic reaction.33
However, in our experiment with H2O2 concentration below200 mM, catalase does exhibit a Michaelis-Menten kinetics.34
In a single-run experiment, we obtained multiple reactionkinetics at different starting H2O2 concentration and constantcatalase concentration (Figure 5a). Each curve in Figure 5a wascomposed of two segments. The first segment was from 0.05 to0.5 s and was obtained by changing the flow rate of the dropletsin the shortest route (inset of Figure 5a). The second segmentwas from 1.5 to 8.0 s and was obtained by using the pneumaticvalves to change the flow routes of the droplets. The initialvelocities (V) of the enzymatic reaction were calculated at differentconcentration of H2O2 from the linear portion of the kineticscurves in the initial stage of the reaction. By plotting initialvelocities versus different concentrations of H2O2 at the samecatalase concentration, a Michaelis-Menten kinetics curve wasobtained (SI Figure S7). The Michaelis constant Km and themaximum velocity Vmax were calculated as 62 mM and 22mM/s by plotting V-1 against [H2O2]-1 (Figure 5b). Thesevalues were consistent with previous measurements of bovinecatalase under similar experimental conditions.34
CONCLUSIONWe integrated the electrochemical detection method into a
droplet-based microfluidic system for measuring rapid kinetics.Pneumatic valves were implemented to control the reaction time.In this work, the best time resolution was about 0.05 s. A completeMichaelis-Menten kinetics measurement with five different H2O2
concentrations was achieved in a single experimental run, andthe total consumption of samples was less than 50 µL.
This microfluidic system is complementary to the fluorescence-based microfluidic system for rapid kinetics measurement. Thesystem has high sensitivity of the electrochemical detectionwithout the need of labeling. Only one pair of microelectrodeswas employed in the microfluidic system, making the PDMS chipsimple and inexpensive to fabricate, and the chip can be dispos-able. It is possible to further simplify the fabrication of the chipby separating the microelectrodes from the microfluidic chan-nels.35 The current microfluidic system is applicable to manybiochemical reactions, as long as one of the reactants or productsis electrochemically active. With appropriate quenching methodat the outlet, the reaction in the droplets can be “frozen” atdifferent reaction times, allowing the droplets to be analyzedoffline, for example by mass spectrometry.36 In this way variousdetection methods can be integrated into the microfluidic system,further extending the application of the combination of pneumaticvalves and droplets in microchannels.
ACKNOWLEDGMENTThe financial support from the Chinese University of Hong
Kong and Research Grants Council of Hong Kong (project 404708)
(33) Nicholls, P.; Fita, I.; Loewen, P. C. Enzymology and structure of catalases.In Advances in Inorganic Chemistry; Academic Press Inc: San Diego, 2001;Vol. 51, pp 51-106.
(34) Switala, J.; Loewen, P. C. Arch. Biochem. Biophys. 2002, 401, 145–154.(35) Wang, J.; Tian, B.; Sahlin, E. Anal. Chem. 1999, 71, 5436–5440.(36) Lin, Y.; Gerfen, G. J.; Rousseau, D. L.; Yeh, S. R. Anal. Chem. 2003, 75,
5381–5386.
Figure 5. Plots for Michaelis-Menten kinetics analysis. (a) Plot of[H2O2] vs the reaction time. The starting H2O2 concentrations are 100mM (“]”), 66.7 mM (“O”), 33.3 mM (“∆”), 20.0 mM (“×”), and 6.67mM (“0”), respectively. Inset is the blow-up of the plot in the timerange from 0 to 0.5 s. (b) Plot of V-1 vs [H2O2]-1 for Michaelis-Mentenkinetics analysis.
5844 Analytical Chemistry, Vol. 81, No. 14, July 15, 2009
Dow
nloa
ded
by B
EIJ
ING
UN
IV o
n Ju
ly 2
8, 2
009
Publ
ishe
d on
Jun
e 11
, 200
9 on
http
://pu
bs.a
cs.o
rg |
doi:
10.1
021/
ac90
0811
y
(to B.Z.), and from the National Natural Science Foundation ofChina (20705003, 20733001) (to Y.H.) is acknowledged. We thankYuanhua Shao for helpful discussion.
SUPPORTING INFORMATION AVAILABLEFigure S1 shows the fluorescence intensity of pyranine solution
during mixing the acidic pyranine solution with NaOH solution.Figure S2 shows the result of the Selwyn’s test. Figures S3 andS4 show the microphotographs of droplets passing by twomicroelectrodes of 20 µm in diameter without splitting. FigureS5 shows the current profile measured at 0.6 V (vs Ag/AgCl quasi-
reference electrode) for different H2O2 concentration. Figure S6shows the calibration curves of current versus H2O2 concentra-tion before and after the Selwyn’s test. Figure S7 shows theplot of initial velocity (V) vs different substrate concentrations([H2O2]) at the same catalase concentration. This material isavailable free of charge via the Internet at http://pubs.acs.org..
Received for review April 15, 2009. Accepted May 21,2009.
AC900811Y
5845Analytical Chemistry, Vol. 81, No. 14, July 15, 2009
Dow
nloa
ded
by B
EIJ
ING
UN
IV o
n Ju
ly 2
8, 2
009
Publ
ishe
d on
Jun
e 11
, 200
9 on
http
://pu
bs.a
cs.o
rg |
doi:
10.1
021/
ac90
0811
y
Supporting Information Measuring Rapid Enzymatic Kinetics by Electrochemical Method in
Droplet-Based Microfluidic Devices with Pneumatic Valves
Zuoyan Han,1 Wentao Li,2 Yanyi Huang,2 and Bo Zheng*,1
1Department of Chemistry, The Chinese University of Hong Kong, Shatin, Hong Kong
2Department of Advanced Materials and Nanotechnology, College of Engineering, Peking University,
Beijing 100871, China
Email: [email protected]
1
Supporting Information
Figure S1. Normalized fluorescence intensity (I) obtained from microphotograph (2 s exposure) as a
function of the travel distance (a) and as a function of travel time (b) of the droplets at two different
flow rates. Fluorescence intensity increased when acidic pyranine solution (0.5 mM, pH ~ 1) mixed
with NaOH solution (pH ~ 14) inside of droplets. The average intensity across the width of the
microchannel was measured.
2
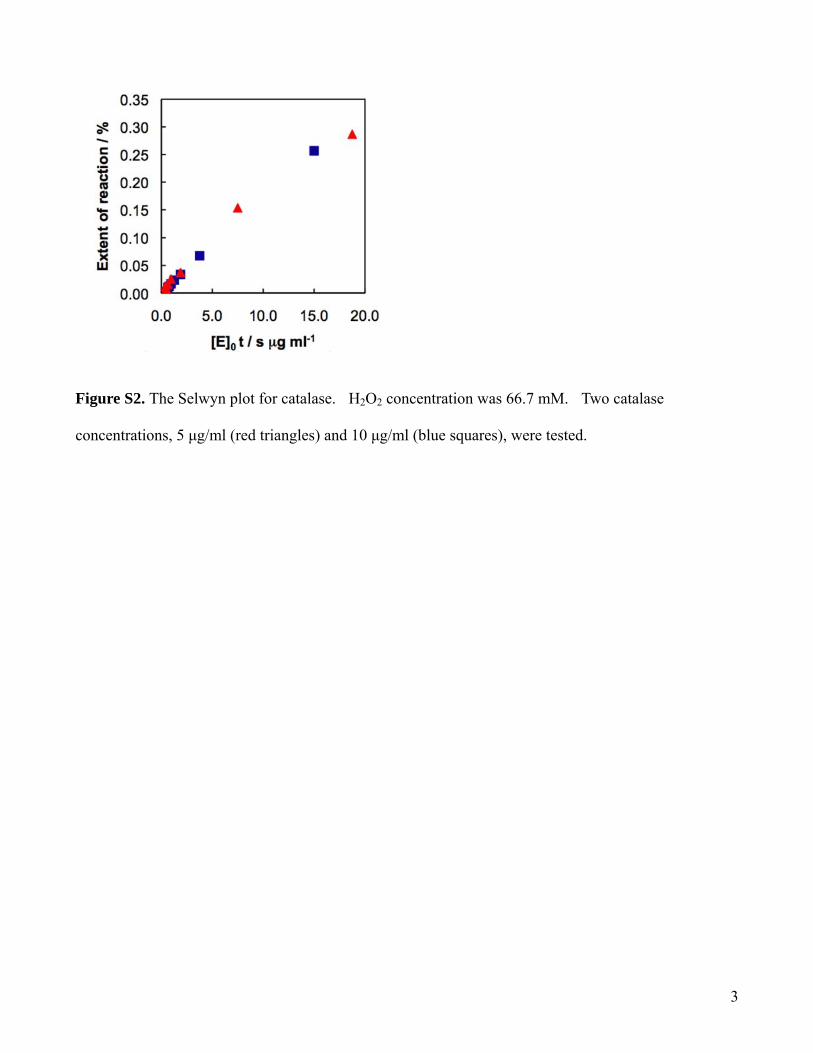
Figure S2. The Selwyn plot for catalase. H2O2 concentration was 66.7 mM. Two catalase
concentrations, 5 μg/ml (red triangles) and 10 μg/ml (blue squares), were tested.
3
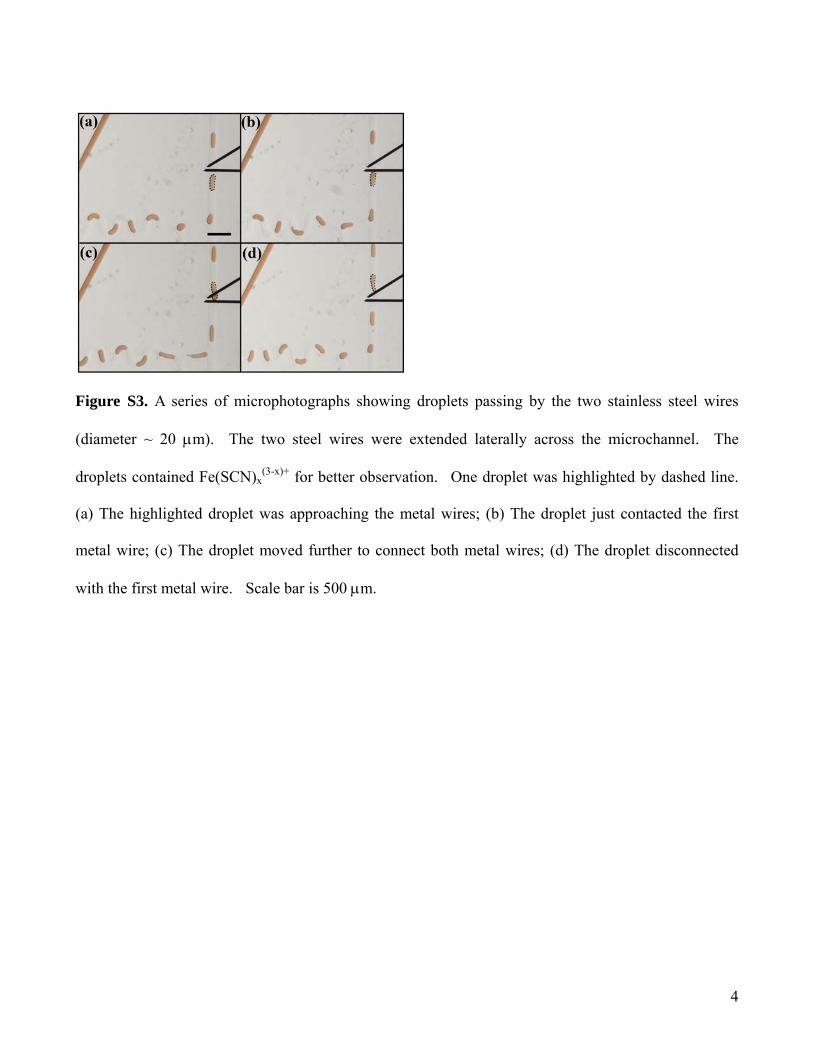
Figure S3. A series of microphotographs showing droplets passing by the two stainless steel wires
(diameter ~ 20 μm). The two steel wires were extended laterally across the microchannel. The
droplets contained Fe(SCN)x(3-x)+ for better observation. One droplet was highlighted by dashed line.
(a) The highlighted droplet was approaching the metal wires; (b) The droplet just contacted the first
metal wire; (c) The droplet moved further to connect both metal wires; (d) The droplet disconnected
with the first metal wire. Scale bar is 500 μm.
4
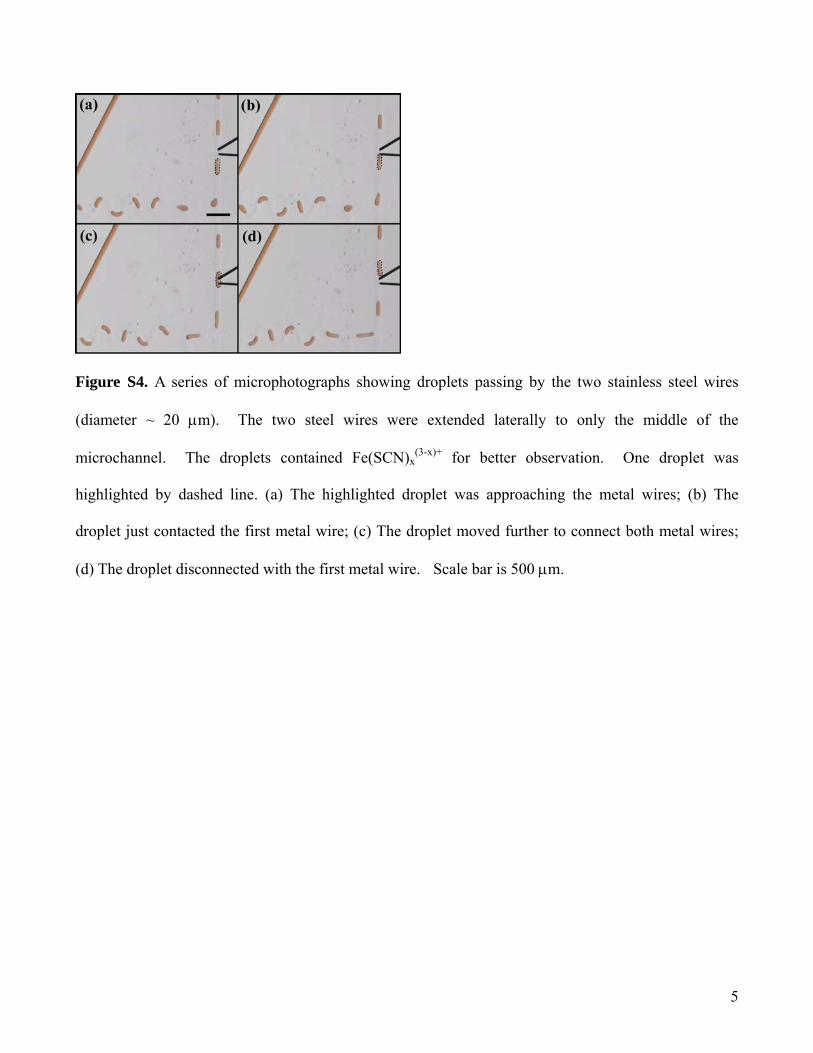
Figure S4. A series of microphotographs showing droplets passing by the two stainless steel wires
(diameter ~ 20 μm). The two steel wires were extended laterally to only the middle of the
microchannel. The droplets contained Fe(SCN)x(3-x)+ for better observation. One droplet was
highlighted by dashed line. (a) The highlighted droplet was approaching the metal wires; (b) The
droplet just contacted the first metal wire; (c) The droplet moved further to connect both metal wires;
(d) The droplet disconnected with the first metal wire. Scale bar is 500 μm.
5
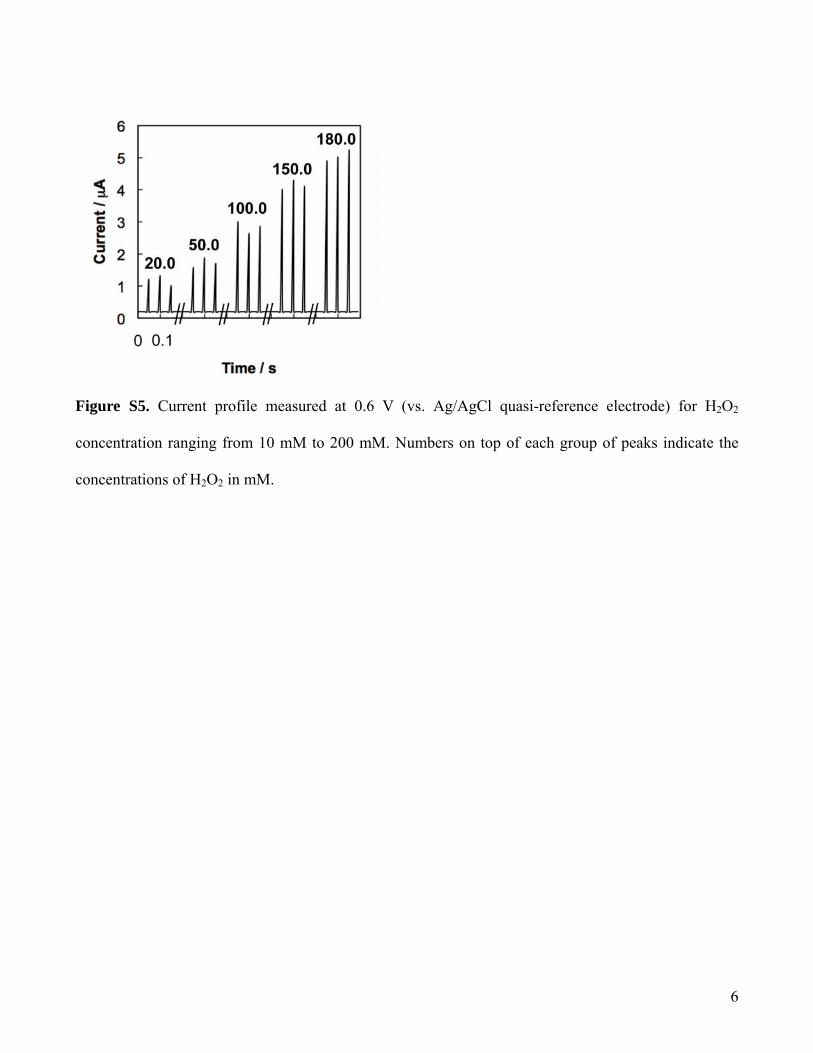
Figure S5. Current profile measured at 0.6 V (vs. Ag/AgCl quasi-reference electrode) for H2O2
concentration ranging from 10 mM to 200 mM. Numbers on top of each group of peaks indicate the
concentrations of H2O2 in mM.
6
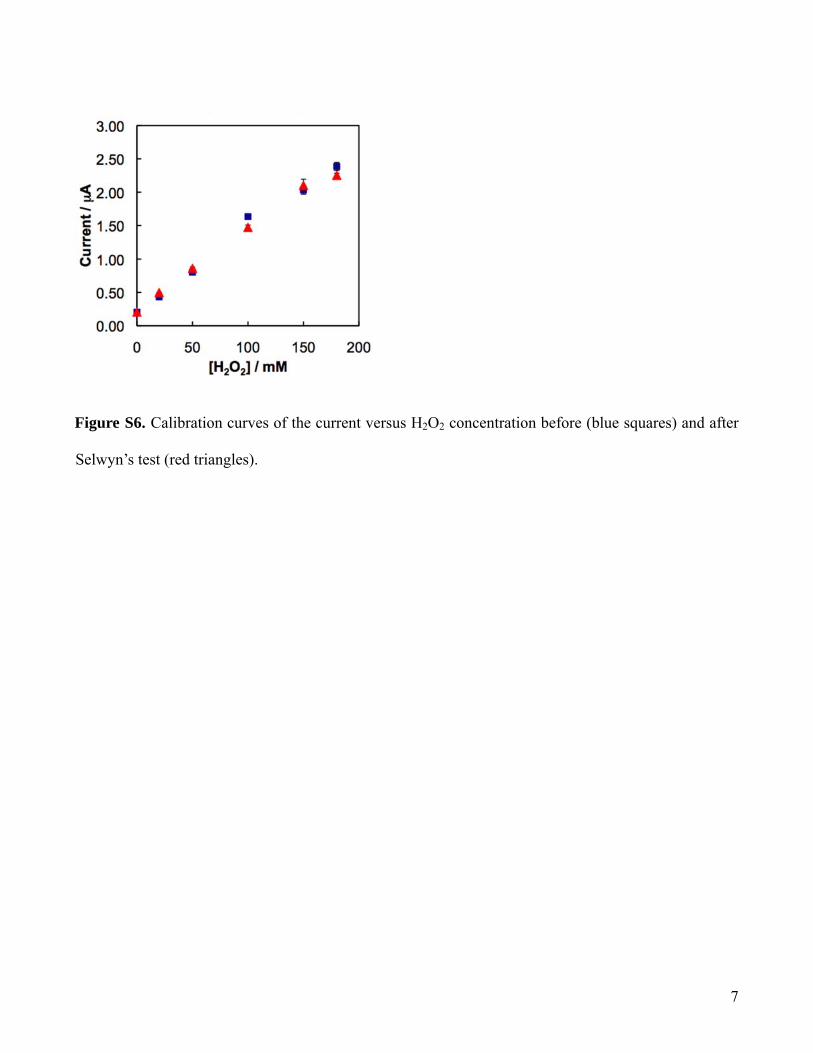
igure S6. Calibration curves of the current versus H2O2 concentration before (blue squares) and after
F
Selwyn’s test (red triangles).
7
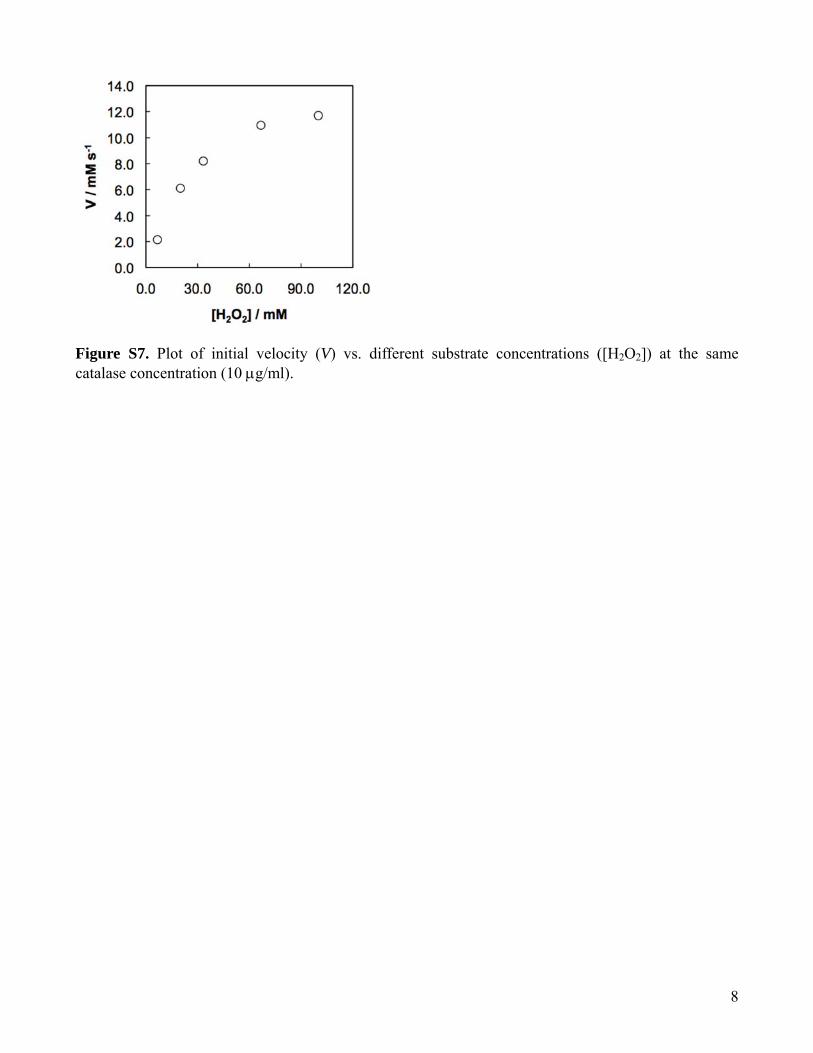
Figure S7. Plot of initial velocity (V) vs. different substrate concentrations ([H2O2]) at the same catalase concentration (10 μg/ml).
8