Embed Size (px)
Citation preview
Measuring return on investments
04/28/08
Ch. 5
2
Investment decision revisited
Acceptable projects are those that yield a return greater than the minimum acceptable hurdle rate with adjustments for project riskiness.
We know now how to calculate the acceptable hurdle rate (cost of capital)
Here we will understand how to evaluate projects. The focus will be on extending what you have learned in previous courses.
3
Project definition
Project – any proposal that will result in the use of a firm’s resources extension of business, acquisitions, new lines, etc.
The risks (to equity holders and debt holders) for projects should be determined by project-specific characteristics
Project cash flows are defined by: Length of project, Initial and subsequent investments required, and Cash inflows generated by the project
4
Why not use firm’s cost of equity or capital to evaluate all projects?
Ex., Ford has a cost of capital of 10% and is considering entering the software development industry. The rate of return it expects to earn on projects it undertakes is 13%. Should these projects be accepted?
5
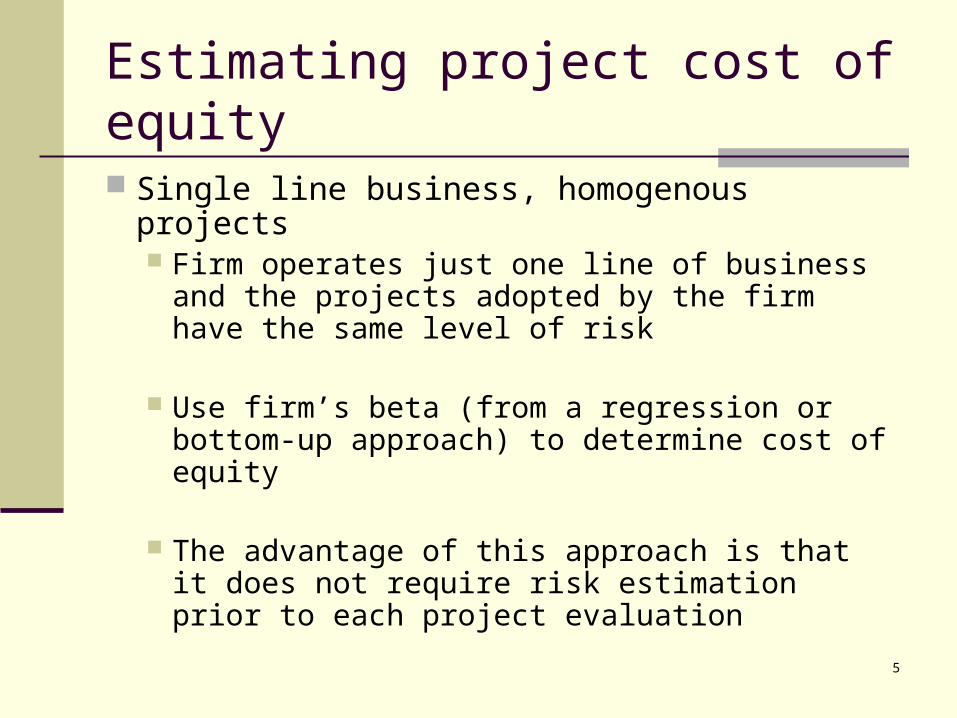
Estimating project cost of equity
Single line business, homogenous projects Firm operates just one line of business and
the projects adopted by the firm have the same level of risk
Use firm’s beta (from a regression or bottom-up approach) to determine cost of equity
The advantage of this approach is that it does not require risk estimation prior to each project evaluation
6
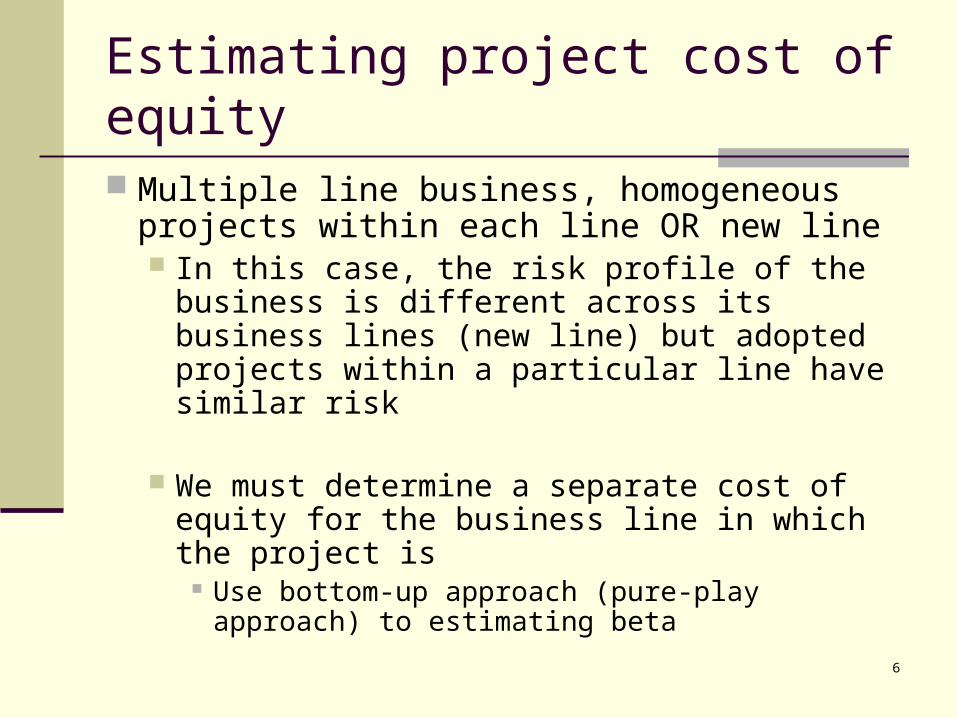
Estimating project cost of equity
Multiple line business, homogeneous projects within each line OR new line In this case, the risk profile of the business is
different across its business lines (new line) but adopted projects within a particular line have similar risk
We must determine a separate cost of equity for the business line in which the project is
Use bottom-up approach (pure-play approach) to estimating beta
7
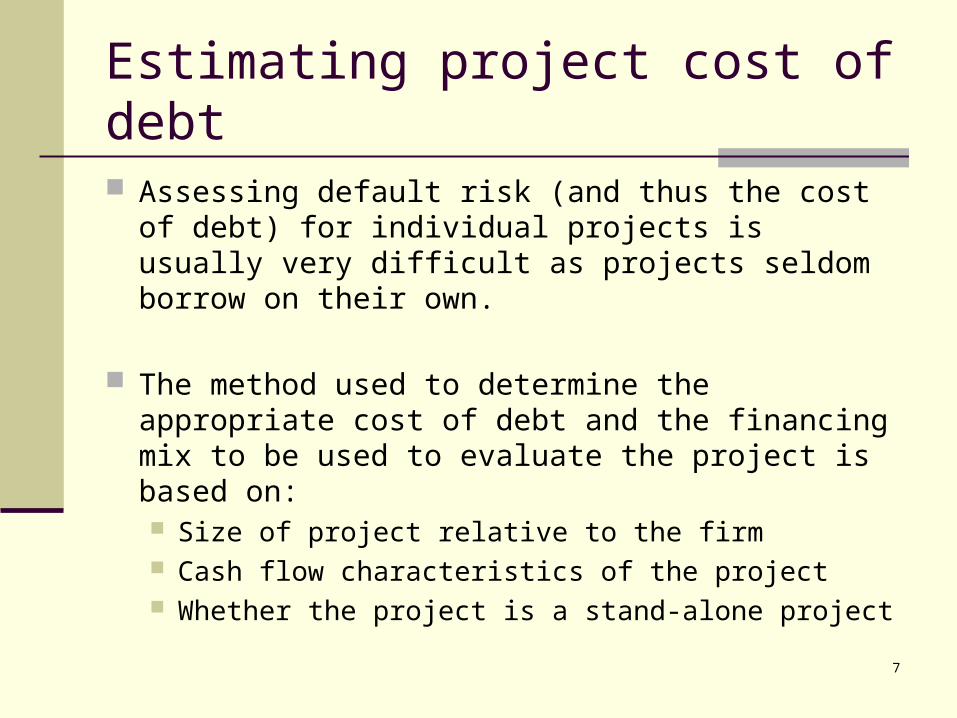
Estimating project cost of debt
Assessing default risk (and thus the cost of debt) for individual projects is usually very difficult as projects seldom borrow on their own.
The method used to determine the appropriate cost of debt and the financing mix to be used to evaluate the project is based on: Size of project relative to the firm Cash flow characteristics of the project Whether the project is a stand-alone project
8
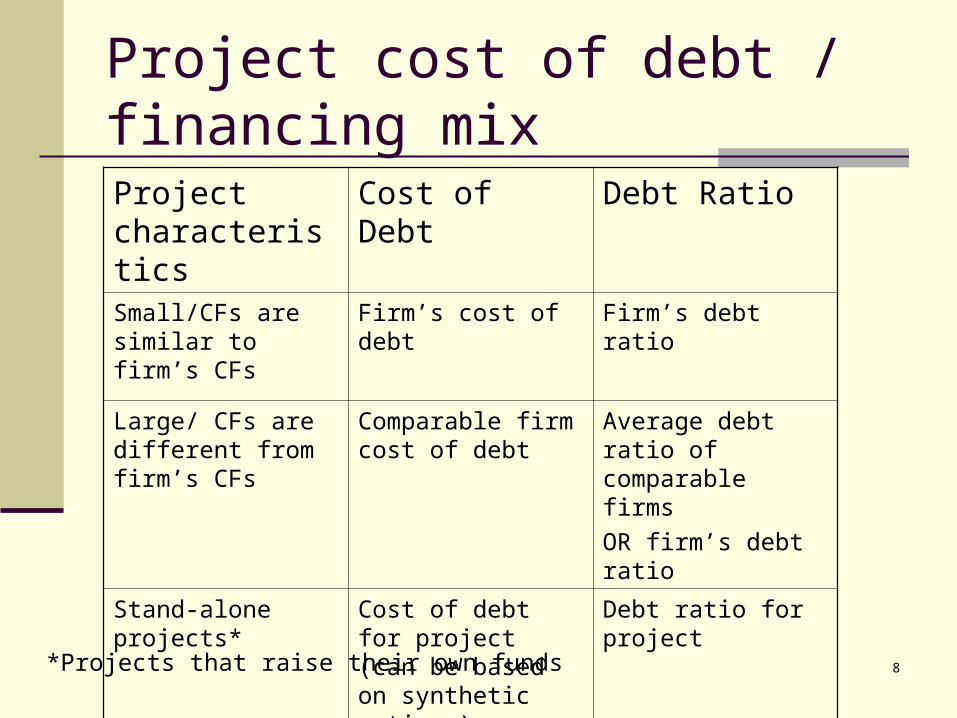
Project cost of debt / financing mix
Project characteristics
Cost of Debt Debt Ratio
Small/CFs are similar to firm’s CFs
Firm’s cost of debt Firm’s debt ratio
Large/ CFs are different from firm’s CFs
Comparable firm cost of debt
Average debt ratio of comparable firms
OR firm’s debt ratio
Stand-alone projects*
Cost of debt for project (can be based on synthetic ratings)
Debt ratio for project
*Projects that raise their own funds
9
Project cost of capital
Estimate an appropriate cost of equity Estimate an appropriate cost of debt
Calculate the weighted average cost of capital based on your estimates and an appropriate debt and equity mix
10
Accounting for project risk Adjust the cost of capital
Adjust cash flows – in practice this is primarily done subjectively
Problems with the latter approach Adjustment can vary depending on who is doing the analysis Risks that are diversifiable may be adjusted for There may be double adjustment of risks if the cost of capital
is also adjusted.
Risk adjustment techniques used: Subjective adjustment - 48% Cost of capital adjustment – 29% No adjustment – 14%
11
Project cash flows estimation
Estimating project cash flows requires: Estimating project revenues Allocating appropriate expenses Converting these projections into incremental cash
flows
We need to understand the differences between: Accounting earnings and cash flows, and cash flows and incremental cash flows.
12
Accounting earnings vs. cash flows
Accrual accounting requires the recognition of expenses during the period in which the related revenue is recognized. Cash flows may not coincide.
Capital expenditures are treated as if generated over multiple periods and expensed (depreciation or amortization) rather than subtracted from revenues when the occur.
Because of accrual accounting and capital expenditure accounting, accounting earnings can differ significantly from cash flows.
13
Accounting earnings vs. cash flows
To go from accounting earnings (EBIT) to cash flows, we must adjust for: Non-cash expenses, such as depreciation and
amortization, Capital expenditures, and working capital investment
14
Working capital investment Intuitively, money invested in inventory or in accounts receivable
cannot be used elsewhere. It, thus, represents a drain on cash flows
To the degree that some of these investments can be financed using suppliers credit (accounts payable) the cash flow drain is reduced.
Investments in working capital are thus cash outflows Any increase in working capital reduces cash flows in that
year Any decrease in working capital increases cash flows in that
year
To provide closure, working capital investments need to be salvaged at the end of the project life.
15
Cash flows vs. incremental cash flows The appropriate cash flows to consider in evaluating
whether a project makes a firm more valuable is the incremental cash flows generated by the project.
This can differ from total cash flows for three reasons: Sunk costs Opportunity costs Allocated costs that the firm would incur even if the
project was not accepted.
16
Sunk costs
Any expenditure that has already been incurred, and cannot be recovered (even if a project is rejected) is called a sunk cost
When analyzing a project, sunk costs should not be considered since they are not incremental
By this definition, market testing expenses and R&D expenses are both likely to be sunk costs before the projects that are based upon them are analyzed.
17
Opportunity costs
Opportunity costs are cash flows that could be realized from the best alternative use of the asset.
When analyzing a project, opportunity costs should be considered since they represent cash flows that the firm would have generated if the project is not accepted, but are lost if the project is accepted.
18
Allocated costs
Firms allocate costs to individual projects from a centralized pool (such as general and administrative expenses) based upon some characteristic of the project (sales is a common choice)
For large firms, these allocated costs can result in the rejection of projects
To the degree that these costs are not incremental (and would exist anyway), this makes the firm worse off. Thus, it is only the incremental component of allocated costs
that should show up in project analysis.
19
Project revenue estimation process
Experience and History: If a firm has invested in similar projects in the past, it can use this experience to estimate revenues and earnings on the project being analyzed.
Market Testing: If the investment is in a new market or business, you can use market testing to get a sense of the size of the market and potential profitability. Ex., Home Depot Expo Stores
Scenario Analysis: If the investment can be affected be a few external factors, the revenues and earnings can be analyzed across a series of scenarios and the expected values used in the analysis.
20
Scenario analysis
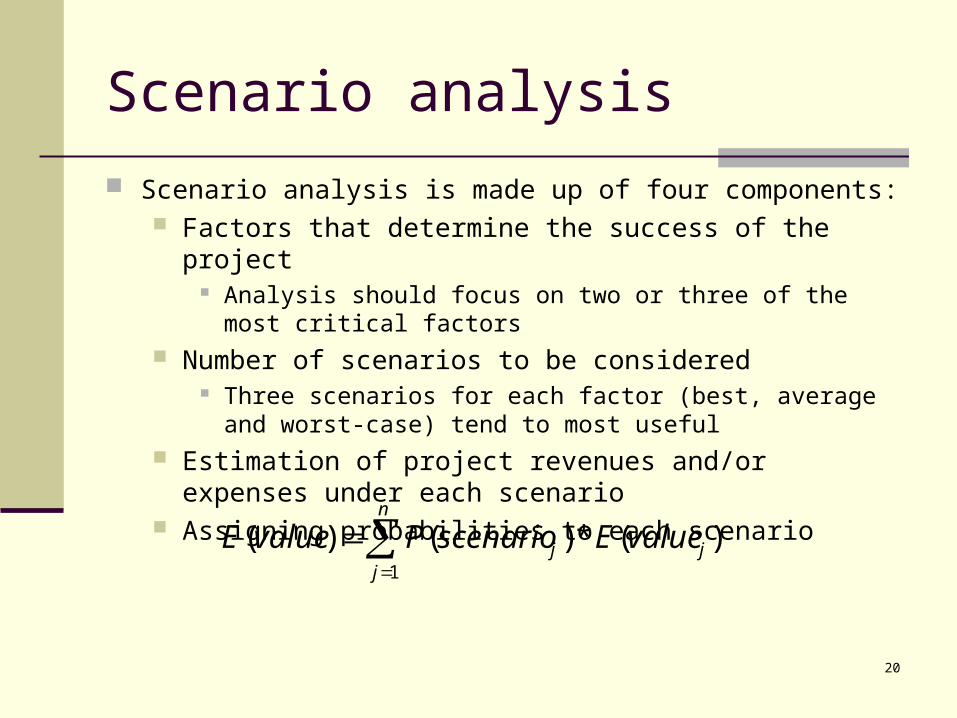
Scenario analysis is made up of four components: Factors that determine the success of the project
Analysis should focus on two or three of the most critical factors Number of scenarios to be considered
Three scenarios for each factor (best, average and worst-case) tend to most useful
Estimation of project revenues and/or expenses under each scenario
Assigning probabilities to each scenario
n
jjj valueEscenarioPvalueE
1
)(*)()(
21
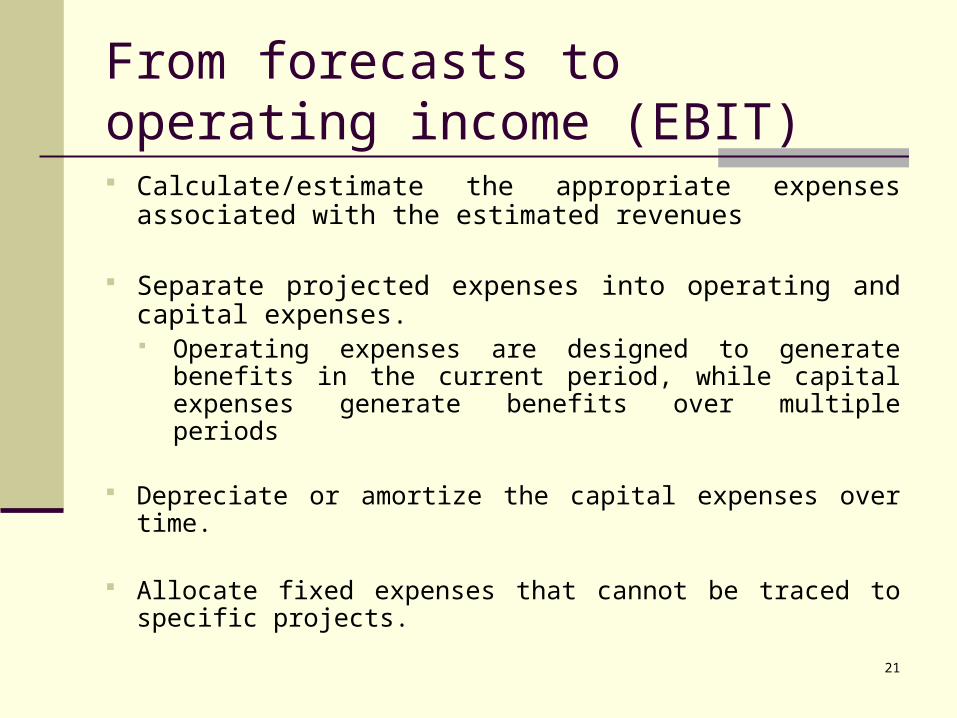
From forecasts to operating income (EBIT) Calculate/estimate the appropriate expenses
associated with the estimated revenues
Separate projected expenses into operating and capital expenses. Operating expenses are designed to generate benefits
in the current period, while capital expenses generate benefits over multiple periods
Depreciate or amortize the capital expenses over time.
Allocate fixed expenses that cannot be traced to specific projects.
22
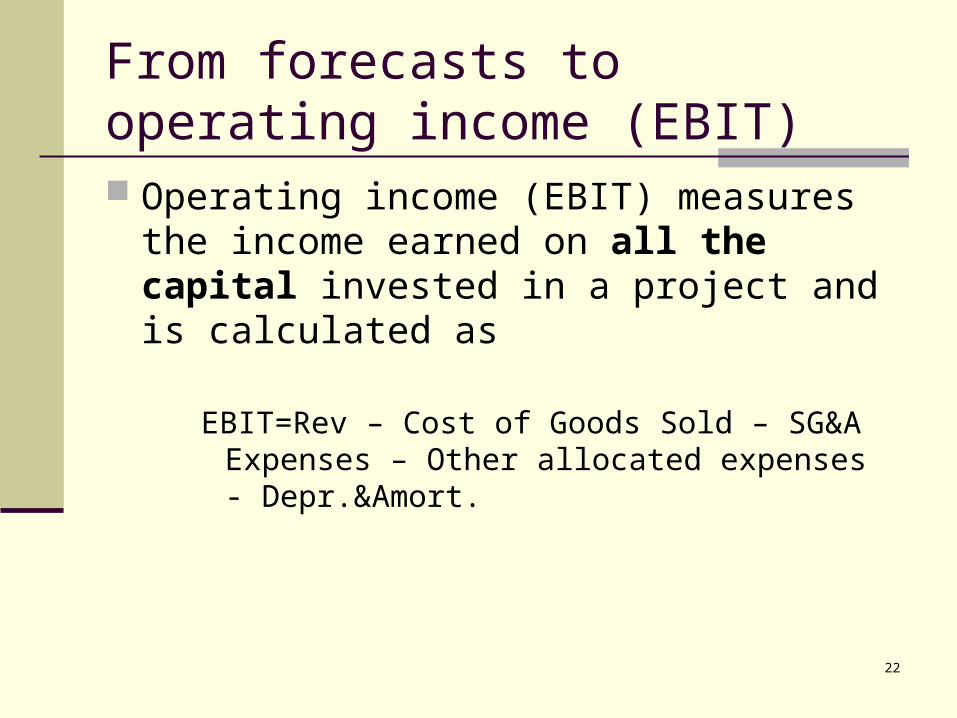
From forecasts to operating income (EBIT) Operating income (EBIT) measures the
income earned on all the capital invested in a project and is calculated as
EBIT=Rev – Cost of Goods Sold – SG&A Expenses – Other allocated expenses - Depr.&Amort.
23
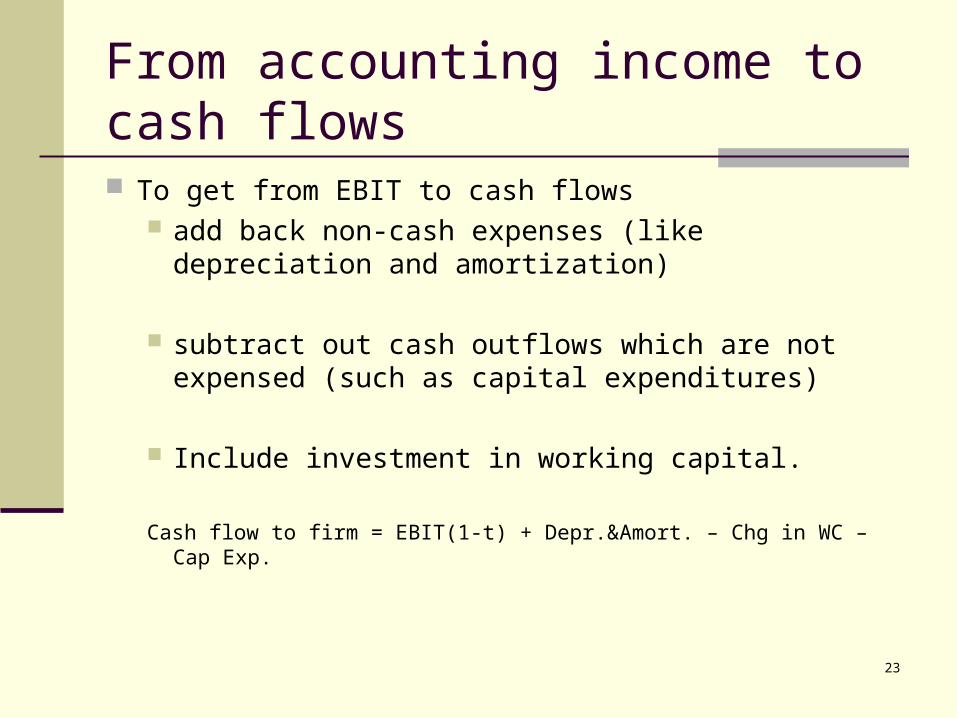
From accounting income to cash flows
To get from EBIT to cash flows add back non-cash expenses (like depreciation and
amortization)
subtract out cash outflows which are not expensed (such as capital expenditures)
Include investment in working capital.
Cash flow to firm = EBIT(1-t) + Depr.&Amort. – Chg in WC – Cap Exp.

24
Investment decision revisited
Acceptable projects are those that yield a return greater than the minimum acceptable hurdle rate with adjustments for project riskiness.
We know now how to calculate the acceptable hurdle rate (cost of capital), and relevant project cash flows.
The final step in the process is to evaluate the project. This entails understanding and applying the appropriate investment decision tools. We must also understand their benefits and drawbacks.
25
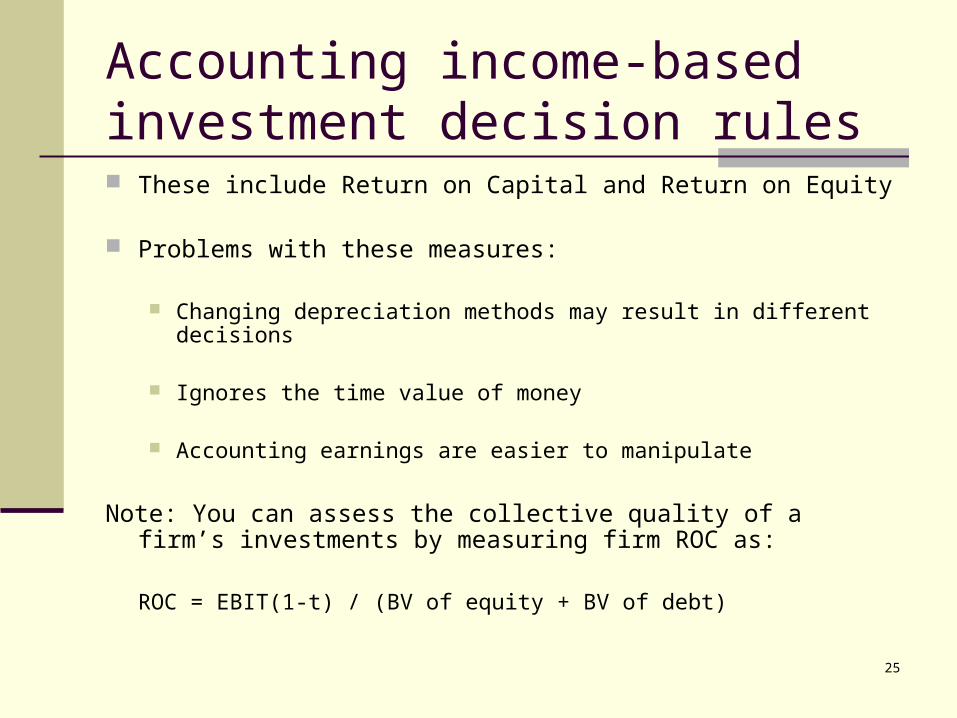
Accounting income-based investment decision rules These include Return on Capital and Return on Equity
Problems with these measures:
Changing depreciation methods may result in different decisions
Ignores the time value of money
Accounting earnings are easier to manipulate
Note: You can assess the collective quality of a firm’s investments by measuring firm ROC as:
ROC = EBIT(1-t) / (BV of equity + BV of debt)
26
Discounted cash flow measures of return Discounted cash flow measures of return address
the problems with accounting returns.
The most widely used measures are Net Present Value (NPV) and Internal Rate of Return (IRR).
27
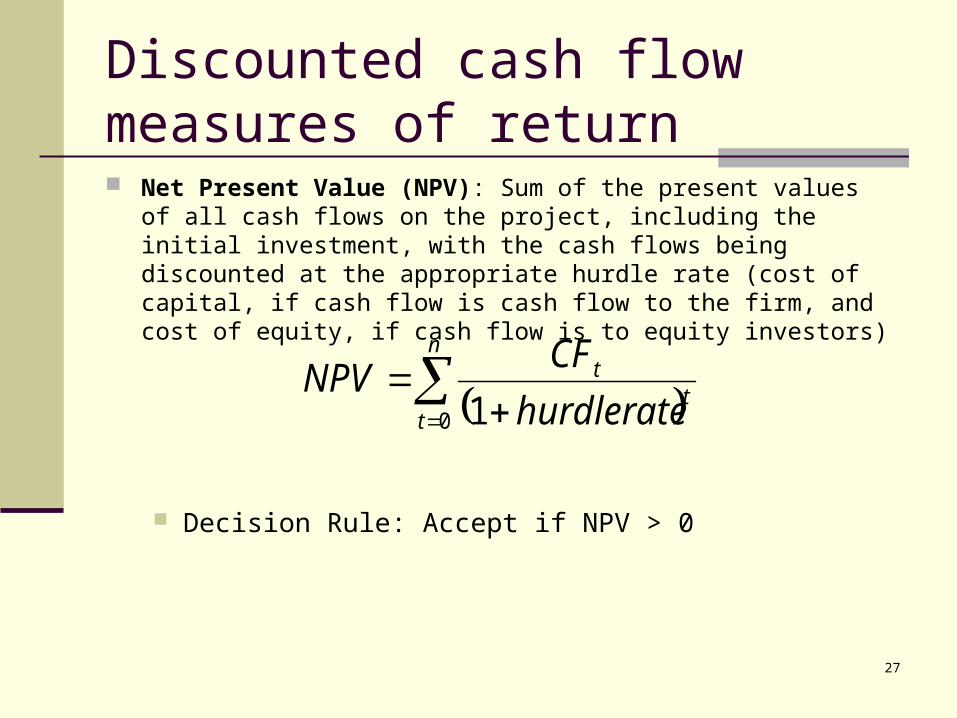
Discounted cash flow measures of return Net Present Value (NPV): Sum of the present values of all cash flows
on the project, including the initial investment, with the cash flows being discounted at the appropriate hurdle rate (cost of capital, if cash flow is cash flow to the firm, and cost of equity, if cash flow is to equity investors)
Decision Rule: Accept if NPV > 0
n
tt
t
hurdlerate
CFNPV
0 1
28
Discounted cash flow measures of return Attractive properties of NPV
NPVs are additive value of the firm is the NPV of all projects adopted by the firm The additional value to the firm of divestitures and acquisitions
can be calculated as Price – expected NPV
Intermediate CFs are reinvested at the hurdle rate
NPV calculations allow for changes in interest rates and hurdle rates
29
Discounted cash flow measures of return Why is NPV not used exclusively?
Managers are more comfortable talking about percentage returns than absolute returns
Capital rationing, the inability of firms to invest in all positive NPV projects, necessitates managers choosing the projects that add most value to the firm
30
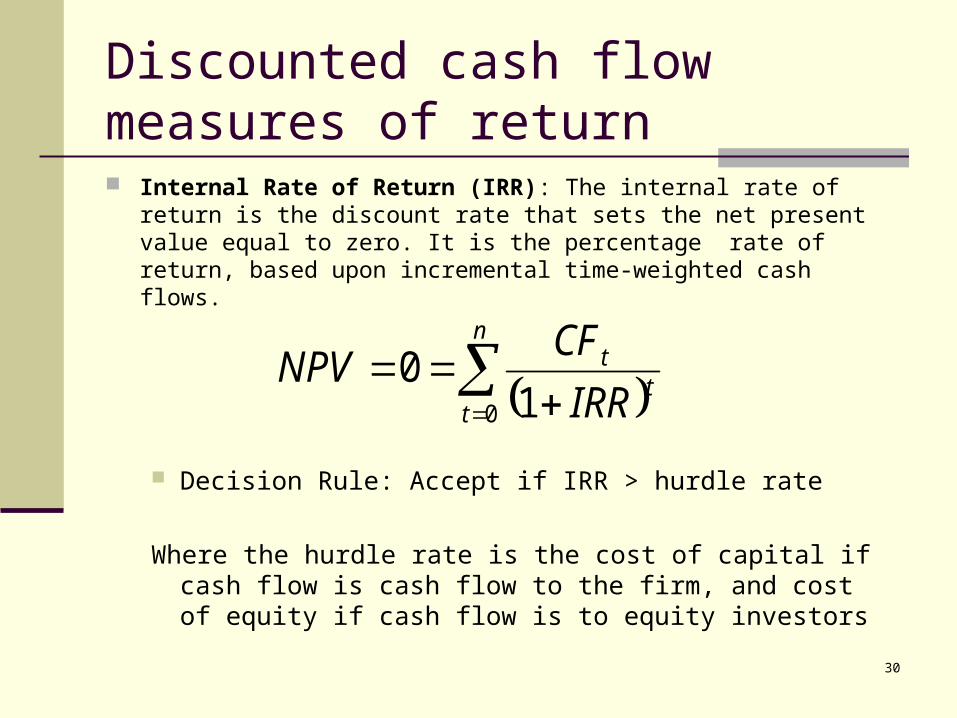
Discounted cash flow measures of return Internal Rate of Return (IRR): The internal rate of return is the
discount rate that sets the net present value equal to zero. It is the percentage rate of return, based upon incremental time-weighted cash flows.
Decision Rule: Accept if IRR > hurdle rate
Where the hurdle rate is the cost of capital if cash flow is cash flow to the firm, and cost of equity if cash flow is to equity investors
n
tt
t
IRR
CFNPV
0 10
31
Discounted cash flow measures of return The multiple IRR problem
The number of IRRs equals the number of sign changes in cash flows
Therefore, if the sign of cash flows changes more than once during the life of the project, multiple IRRs will result
32
Discounted cash flow measures of return NPV and IRR generally result in the same
decision about projects. However, when the projects are mutually
exclusive, differences can arise Differences in scale
Capital rationing may be a factor Difference in reinvestment rate assumption
33
Capital rationing and choosing a rule If a business has limited access to capital and has a stream of
surplus value projects, it is much more likely to use IRR as its decision rule.
Small, high-growth companies and private businesses are much more likely to use IRR.
If a business has substantial funds on hand, access to capital and limited surplus value projects, it is much more likely to use NPV as its decision rule.
As firms go public and grow, they are much more likely to gain from using NPV.
34
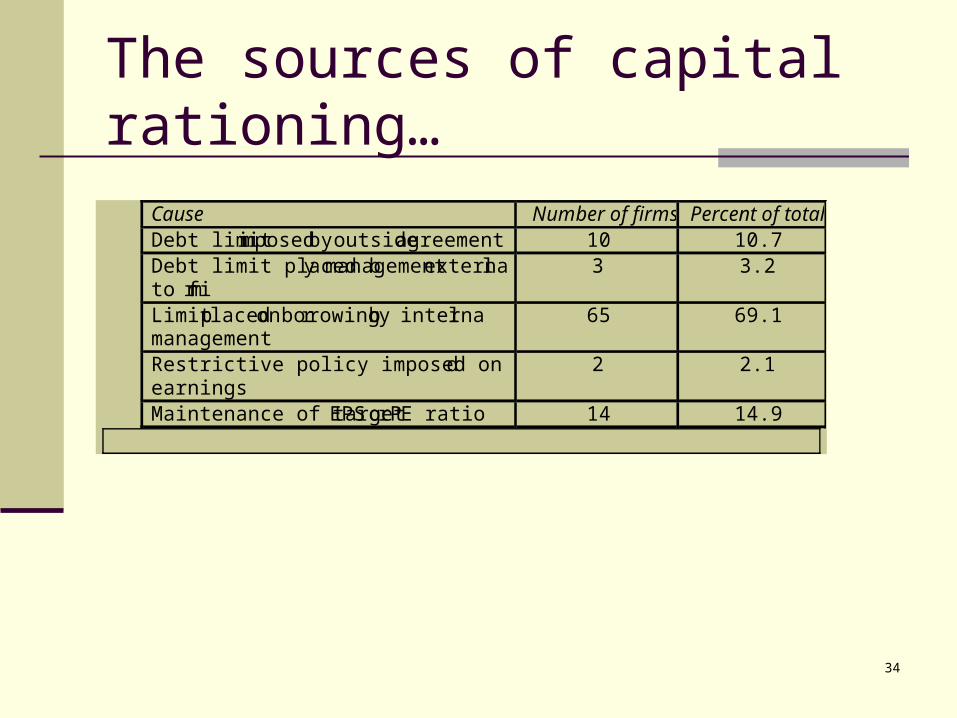
The sources of capital rationing…
Cause Number of firms Percent of total Debt limit imposed by outside agreement 10 10.7 Debt limit placed by management external to firm
3 3.2
Limit placed on borrowing by internal management
65 69.1
Restrictive policy imposed on retained earnings
2 2.1
Maintenance of target EPS or PE ratio 14 14.9
35
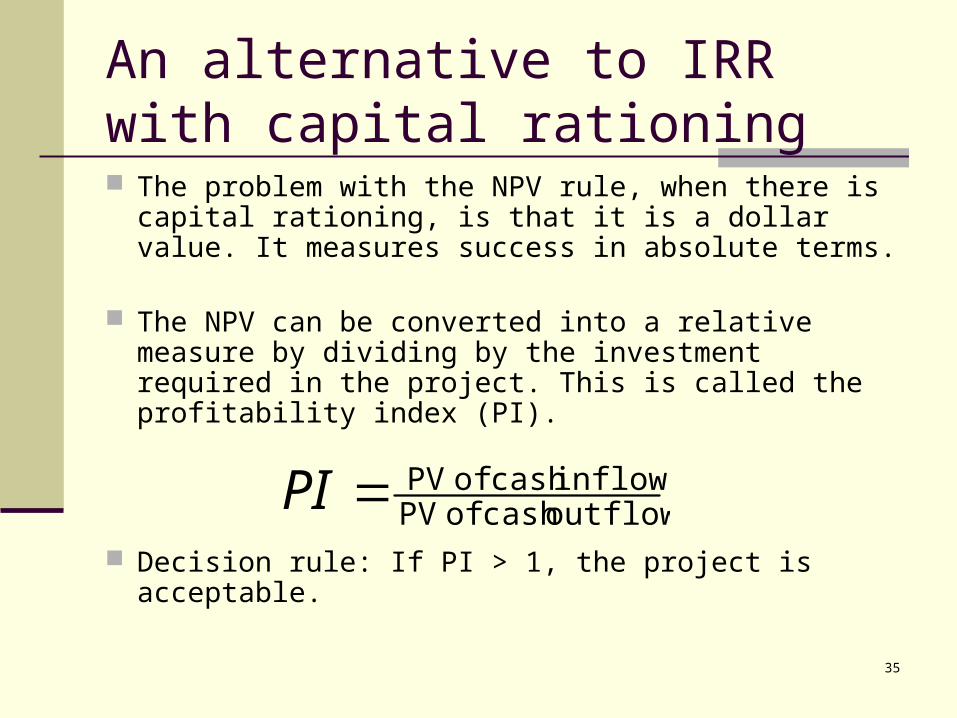
An alternative to IRR with capital rationing The problem with the NPV rule, when there is capital
rationing, is that it is a dollar value. It measures success in absolute terms.
The NPV can be converted into a relative measure by dividing by the investment required in the project. This is called the profitability index (PI).
Decision rule: If PI > 1, the project is acceptable.
outflowscash of PVinflowscash of PVPI
36
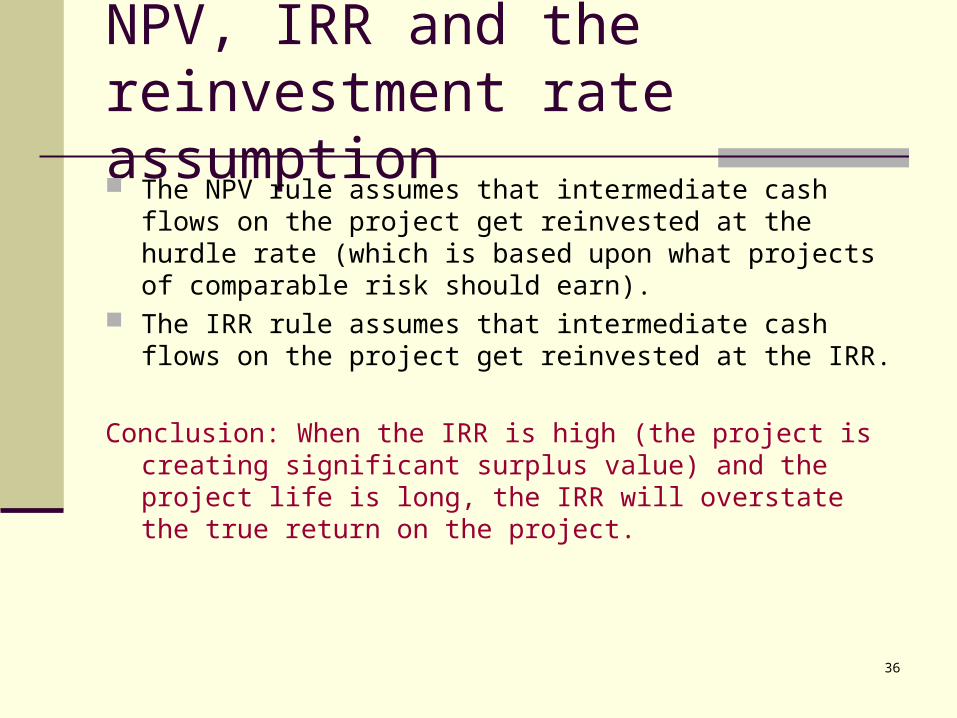
NPV, IRR and the reinvestment rate assumption The NPV rule assumes that intermediate cash flows on the
project get reinvested at the hurdle rate (which is based upon what projects of comparable risk should earn).
The IRR rule assumes that intermediate cash flows on the project get reinvested at the IRR.
Conclusion: When the IRR is high (the project is creating significant surplus value) and the project life is long, the IRR will overstate the true return on the project.
37
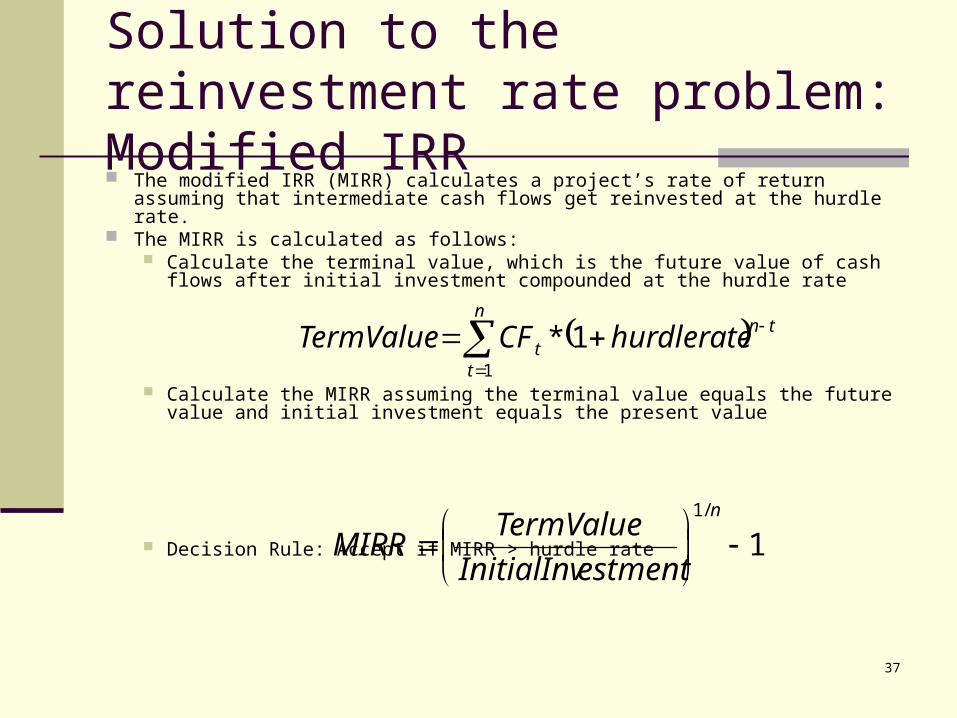
Solution to the reinvestment rate problem: Modified IRR The modified IRR (MIRR) calculates a project’s rate of return assuming that
intermediate cash flows get reinvested at the hurdle rate. The MIRR is calculated as follows:
Calculate the terminal value, which is the future value of cash flows after initial investment compounded at the hurdle rate
Calculate the MIRR assuming the terminal value equals the future value and initial investment equals the present value
Decision Rule: Accept if MIRR > hurdle rate
n
t
tnt hurdlerateCFTermValue
1
1*
1/1
n
estmentInitialInv
TermValueMIRR
38
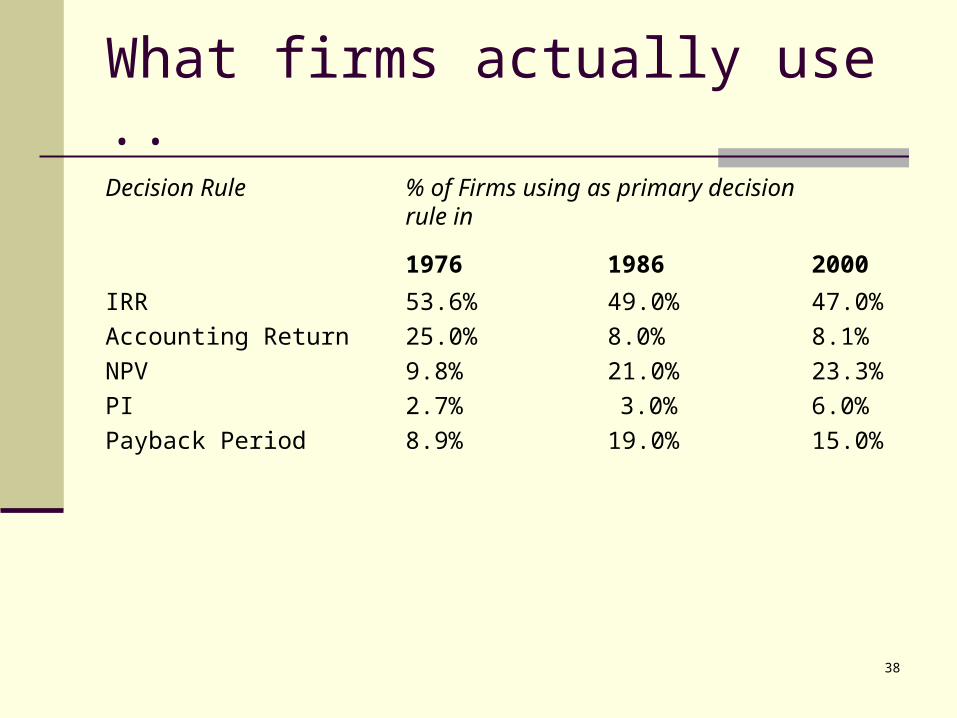
What firms actually use ..
Decision Rule % of Firms using as primary decision rule in
1976 1986 2000
IRR 53.6% 49.0% 47.0%
Accounting Return 25.0% 8.0% 8.1%
NPV 9.8% 21.0% 23.3%
PI 2.7% 3.0% 6.0%
Payback Period 8.9% 19.0% 15.0%
39
How to exploit good projects
We now know how to measure whether a project is worthwhile – it is if it generates excess returns.
However, in a competitive market we would expect these excess returns would dissipate over time unless there are barriers to new or existing competitors to generate the same project.
40
How to exploit good projects
Maintaining barriers.. Invest in projects that exploit economies of
scale Establish cost advantages Product differentiation Access to distribution channels Develop legal barriers (such as patents)