Embed Size (px)
Citation preview
Measuring Spectrum Similarity in DistributedRadio Monitoring Systems
Roberto Calvo-Palomino1,2, Domenico Giustiniano1 and Vincent Lenders3
1 IMDEA Networks Institute, Madrid, Spain,{roberto.calvo,domenico.giustiniano}@imdea.org,
2 Universidad Carlos III of Madrid, Spain3 Armasuisse, Thun, [email protected]
Abstract. The idea of distributed spectrum monitoring with RF front-ends of a few dollars is gaining attention to capture the real-time us-age of the wireless spectrum at large geographical scale. Yet the limitedhardware of these nodes hinders some of the applications that could beenvisioned. In this work, we exploit the fact that, because of its afford-able cost, massive deployments of spectrum sensors could be foreseenin the early future, where the radio signal of one wireless transmitter isreceived by multiple spectrum sensors in range and connected over thepublic Internet. We envision that nodes in this scenario may collabora-tively take decisions about which portion of the spectrum to monitoror not. A key problem for collaborative decision is to identify the con-ditions where the nodes receive the same spectrum data. We take aninitial step in this direction, presenting a collaborative system architec-ture, and investigating the challenges to correlate pre-processed data inthe backend, with key insights in the trade-offs in the system design interms of network bandwidth and type of over-the-air radio signals. Ourresults suggest that it is feasible to determinate in the backend if twosensors are reading the same analog/digital signal in the same frequency,only sampling during 200 milliseconds and sending just 1 Kbyte of dataper sensor to the backend.
1 Introduction
Networked and distributed infrastructure using spectrum analyzers connectedover the public Internet are emerging as an attractive alternative to traditionalmethods to monitor the spectrum usage based on expensive and specializedhardware of governmental agencies [1–3]. More recently, commoditized low-costRF front-end are allowing to trade-off radio devices with high sensitivity, low-sweeping time and small frequency offset with low-cost spectrum monitoringhardware and software-defined signal processing in order to build a pervasive andaffordable solution [4–7]. The main advantage of low-end distributed solutions isthat they may allow to create a wide-scale and real-time spectrum monitoringsystem. A common assumption of most of concepts proposed in the literatureis that they consider the different spectrum sensors as separate entities, each
2
responsible to monitor the spectrum in a given area and with fully autonomousdecisions [8].
However, in a crowded deployment, sensors may partially sense the samespectrum. We then envision a collaborative environment where a large numberof sensing nodes work together in a coordinated manner. Only recently, somework has shown that collaboration among sensors is possible, and transmittingI/Q samples to the backend, data can be decoded in the backend with a dis-tributed time-division scheduler [9]. The envisioned application in [9] requires ahigh network bandwidth load per device (in the order of a few or tens of Mb/s,depending on the number of sensors in range). Complementary to that work,we consider the goal of identify spectrum sensor nodes in coverage of the sametransmitter. This problem requires to find a solution that i) takes fast decisions,so that nodes may quickly verify if they are in range of the same transmitter,and ii) needs low network bandwidth to minimize the load on the network. Ap-plications of this knowledge could be several. For instance, collaboration to reacha common goal has the potential to reduce the time to monitor the spectrumusing low-cost hardware. This could alleviate a main problem of current low-costspectrum sensors deployments, that require between 40 and 70 seconds to sweepa spectrum of 1.7 GHz of bandwidth [7]. As a result of the frequency-dependentpropagation characteristics, two nodes measuring the same or similar spectrumcould then make a joint decision to avoid to both listening to the same portion ofthe spectrum, and instead spend more time on frequencies with little similaritywith other nodes. Another exemplary application is the one of a sensor that findsout an anomaly in the signal. Here the node may ask the help of other sensorsto confirm this anomaly.
In this work, we demonstrate and implement a system architecture able tocollect the sensor’s spectrum data and determine the similarity of the radio signalreceived at nearby locations by different sensing nodes. Our work provides thefollowing key contributions:
– We overcome the limitation of CPU resources of embedded nodes, whichdramatically reduce the time that a node can dedicate to gather spectrumsamples, by proposing a synchronous sampling process in the sensors todetermine the precise moment in time where multiple sensors can read thespectrum at the same time.
– We reduce the bandwidth used per each sensor by operating in the FastFourier Transform (FFT) domain and averaging the magnitude FFT on thesensors in order to send the minimum amount data needed to detect simi-larity to the backend.
– We evaluate and demonstrate a procedure to compute the spectrum cor-relation of the signals read by sensors, and apply it to analog and digitalchannels with spectrum resolution of 9.3 kHz.
We demonstrate that our system can reliably correlate real data spectrum(analog and digital signals) collected by different sensors sampling during 200milliseconds and sending only 1 Kbyte of data per sensor to the backend.
3
Spectrum monitoring
TUNER ADC
RF Front-end
Embedded machine 1
Spectrum monitoring
ADC
RF Front-end
Embedded machine N
FFT
Internet Backend
I/Q samples
I/Q samples
Sensor N
Sensor 1
Sampling,Segmentation,DC Removal,Windowing
Compression Transmission
Sampling,Segmentation,DC Removal,Windowing
Compression Transmission
Q1 Q2 Q3 Q4
Q1 Q2 Q3 Q4
FFTTUNER
EnvelopAveraging
EnvelopAveraging
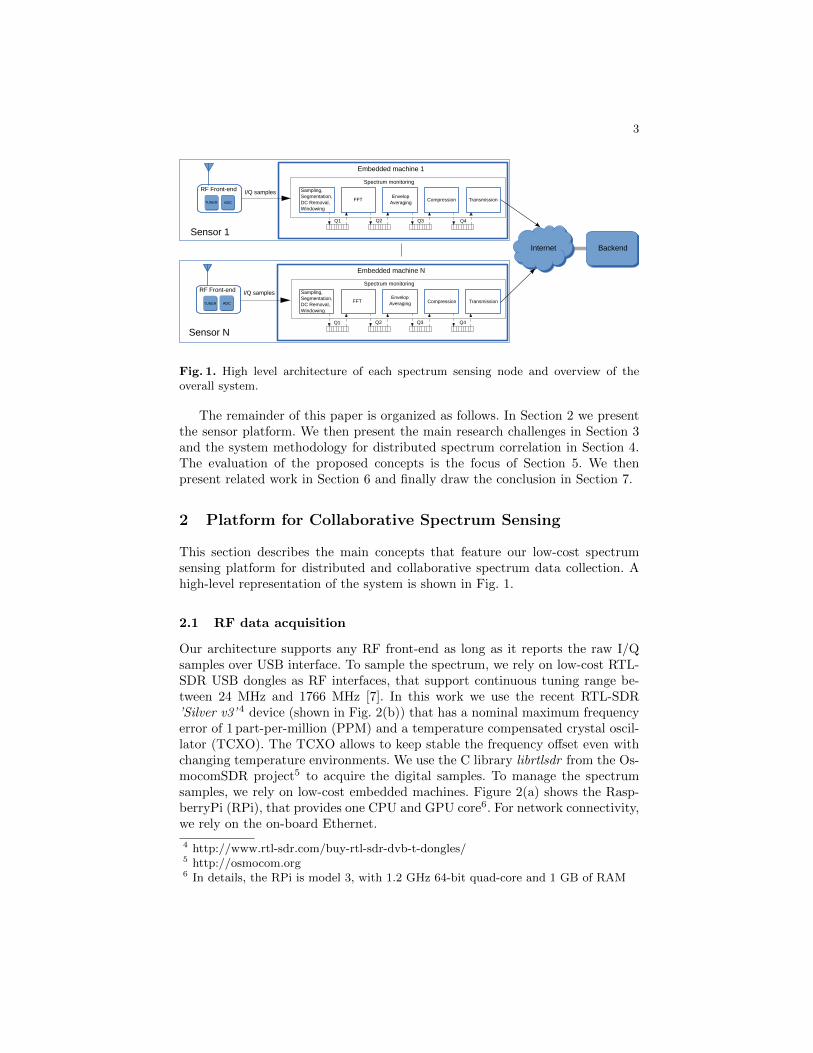
Fig. 1. High level architecture of each spectrum sensing node and overview of theoverall system.
The remainder of this paper is organized as follows. In Section 2 we presentthe sensor platform. We then present the main research challenges in Section 3and the system methodology for distributed spectrum correlation in Section 4.The evaluation of the proposed concepts is the focus of Section 5. We thenpresent related work in Section 6 and finally draw the conclusion in Section 7.
2 Platform for Collaborative Spectrum Sensing
This section describes the main concepts that feature our low-cost spectrumsensing platform for distributed and collaborative spectrum data collection. Ahigh-level representation of the system is shown in Fig. 1.
2.1 RF data acquisition
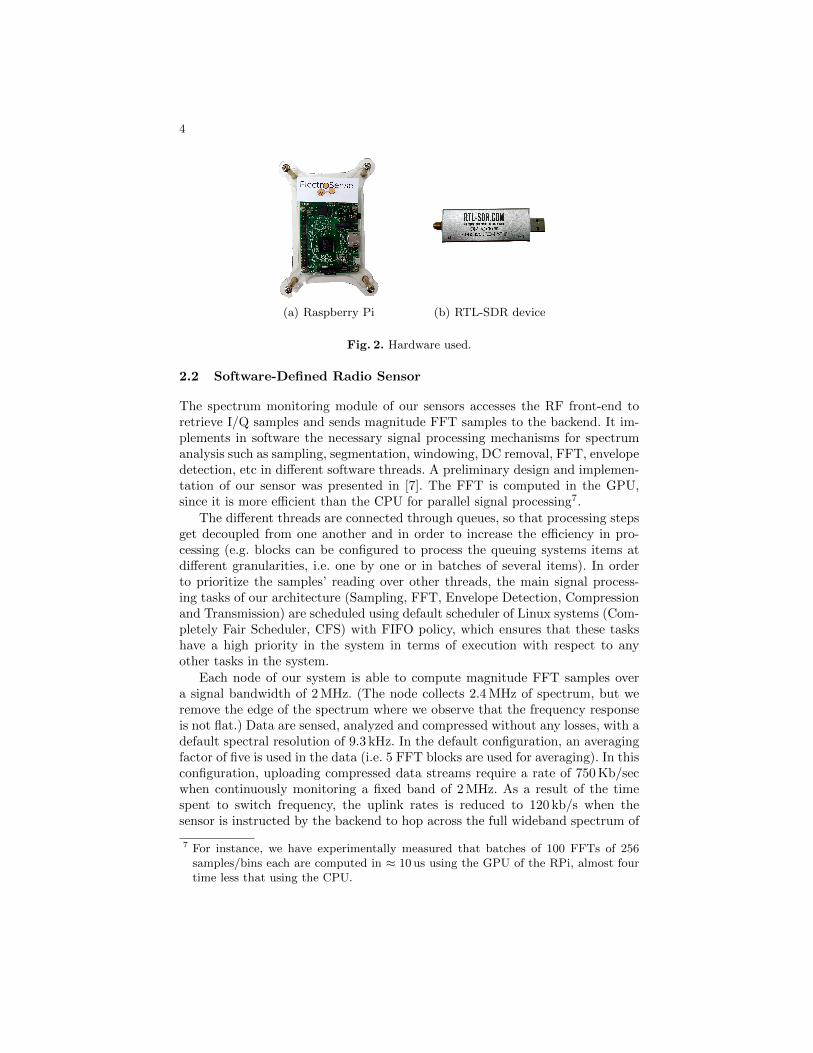
Our architecture supports any RF front-end as long as it reports the raw I/Qsamples over USB interface. To sample the spectrum, we rely on low-cost RTL-SDR USB dongles as RF interfaces, that support continuous tuning range be-tween 24 MHz and 1766 MHz [7]. In this work we use the recent RTL-SDR’Silver v3’ 4 device (shown in Fig. 2(b)) that has a nominal maximum frequencyerror of 1 part-per-million (PPM) and a temperature compensated crystal oscil-lator (TCXO). The TCXO allows to keep stable the frequency offset even withchanging temperature environments. We use the C library librtlsdr from the Os-mocomSDR project5 to acquire the digital samples. To manage the spectrumsamples, we rely on low-cost embedded machines. Figure 2(a) shows the Rasp-berryPi (RPi), that provides one CPU and GPU core6. For network connectivity,we rely on the on-board Ethernet.
4 http://www.rtl-sdr.com/buy-rtl-sdr-dvb-t-dongles/5 http://osmocom.org6 In details, the RPi is model 3, with 1.2 GHz 64-bit quad-core and 1 GB of RAM
4
(a) Raspberry Pi (b) RTL-SDR device
Fig. 2. Hardware used.
2.2 Software-Defined Radio Sensor
The spectrum monitoring module of our sensors accesses the RF front-end toretrieve I/Q samples and sends magnitude FFT samples to the backend. It im-plements in software the necessary signal processing mechanisms for spectrumanalysis such as sampling, segmentation, windowing, DC removal, FFT, envelopedetection, etc in different software threads. A preliminary design and implemen-tation of our sensor was presented in [7]. The FFT is computed in the GPU,since it is more efficient than the CPU for parallel signal processing7.
The different threads are connected through queues, so that processing stepsget decoupled from one another and in order to increase the efficiency in pro-cessing (e.g. blocks can be configured to process the queuing systems items atdifferent granularities, i.e. one by one or in batches of several items). In orderto prioritize the samples’ reading over other threads, the main signal process-ing tasks of our architecture (Sampling, FFT, Envelope Detection, Compressionand Transmission) are scheduled using default scheduler of Linux systems (Com-pletely Fair Scheduler, CFS) with FIFO policy, which ensures that these taskshave a high priority in the system in terms of execution with respect to anyother tasks in the system.
Each node of our system is able to compute magnitude FFT samples overa signal bandwidth of 2 MHz. (The node collects 2.4 MHz of spectrum, but weremove the edge of the spectrum where we observe that the frequency responseis not flat.) Data are sensed, analyzed and compressed without any losses, with adefault spectral resolution of 9.3 kHz. In the default configuration, an averagingfactor of five is used in the data (i.e. 5 FFT blocks are used for averaging). In thisconfiguration, uploading compressed data streams require a rate of 750 Kb/secwhen continuously monitoring a fixed band of 2 MHz. As a result of the timespent to switch frequency, the uplink rates is reduced to 120 kb/s when thesensor is instructed by the backend to hop across the full wideband spectrum of
7 For instance, we have experimentally measured that batches of 100 FFTs of 256samples/bins each are computed in ≈ 10 us using the GPU of the RPi, almost fourtime less that using the CPU.
5
1742 MHz. The code implemented in the sensors is available as open source ongithub8.
2.3 Backend
The backend is a server or set of servers with sufficient large storage and compu-tation capabilities. Its main responsibility is to control the sensors and store,process and decode data received from the sensors, and perform data post-processing.
3 Challenges
Measuring the similarity between data spectra collected by independent sensorsat different locations and connected to a backend over the Internet could allow usto explore intelligent collaborative decisions. For instance, the entire spectrumcould be monitored faster. In another application, sensors may collaborate todetect anomalies if they learn that they are in range of the same transmitter inthat specific frequency band. Also, sensors may decide to monitor a bandwidthlarger than the one of the single sensor (with each node sampling on a 2 MHzband only partially overlapped with other sensors in range) and then jointlyreconstruct the spectrum more efficiently in the backend.
In order to realize this vision, there are three fundamental challenges thatneed to be addressed with low-cost spectrum sensors:
– Challenge 1: Time Synchronization. Each node reads spectrum data,performs some pre-processing and sends it to the backend for post-processing.As nodes heavily relies on software-defined radios, delays are possible in thepre-processing in the sensors, which would adversely affect any attempt tocompare data from different sensors. Therefore, it is essential to have syn-chronized information in time.
– Challenge 2: Rapid decision making. The system should take quick de-cisions about if a set of spectrum sensors can work collaboratively to achievea common goal. The amount of analyzed data plays an important role toconverge to a decision in the shortest possible time.
– Challenge 3: Network bandwidth used. The sensors send spectrum datato the backend where a decision is taken in order to allow the collaborativeapproach. The more data sent, the better the performance in the backend.Yet the greater is the bandwidth used. The system should find the righttrade-off to provide enough context information to detect similarity in thespectrum using the minimum network bandwidth.
8 It can be downloaded at https://github.com/electrosense/es-sensor.
6
4 Measuring Spectrum Similarity
In this section, we describe the methodology proposed to address the challengespresented in Section 3. The methodology is composed by three main concepts.
First, the sensors have a coarse synchronization in time using Network TimeProtocol (NTP). The sensors can then read spectrum data with synchronizationwith millisecond precision over the public Internet, and better that one millisec-ond precision in local area networks (as measured in ad-hoc experiments). In ourarchitecture, each sensor synchronizes its internal clock with NTP server every60 seconds. A finer synchronization could be achieved using the time referenceprovided by an additional GPSDO module, as supposed by previous work in thisarea [9]. Yet, this may not be available in all the spectrum sensors, as they arerun by users of the community, with they own hardware.
Second, each spectrum sensor activates the sampling thread for a fixed period,and then executes the other threads. This period is the same for each sensor.The total time to execute the entire set of operations should be such that theembedded machine can send spectrum data with the minimum delay (i.e. thereare no other tasks pending).
Finally, in order to reduce the network bandwidth used, some operations needto be computed on the sensors as described in Section 2. Sensors should decidethe parameters such as averaging over larger set of FFT blocks, if the bandwidthshould be reduced further. This however comes at the cost of additional delay inthe decision making. In the following section we describe this problem in details.
4.1 Spectrum Correlation
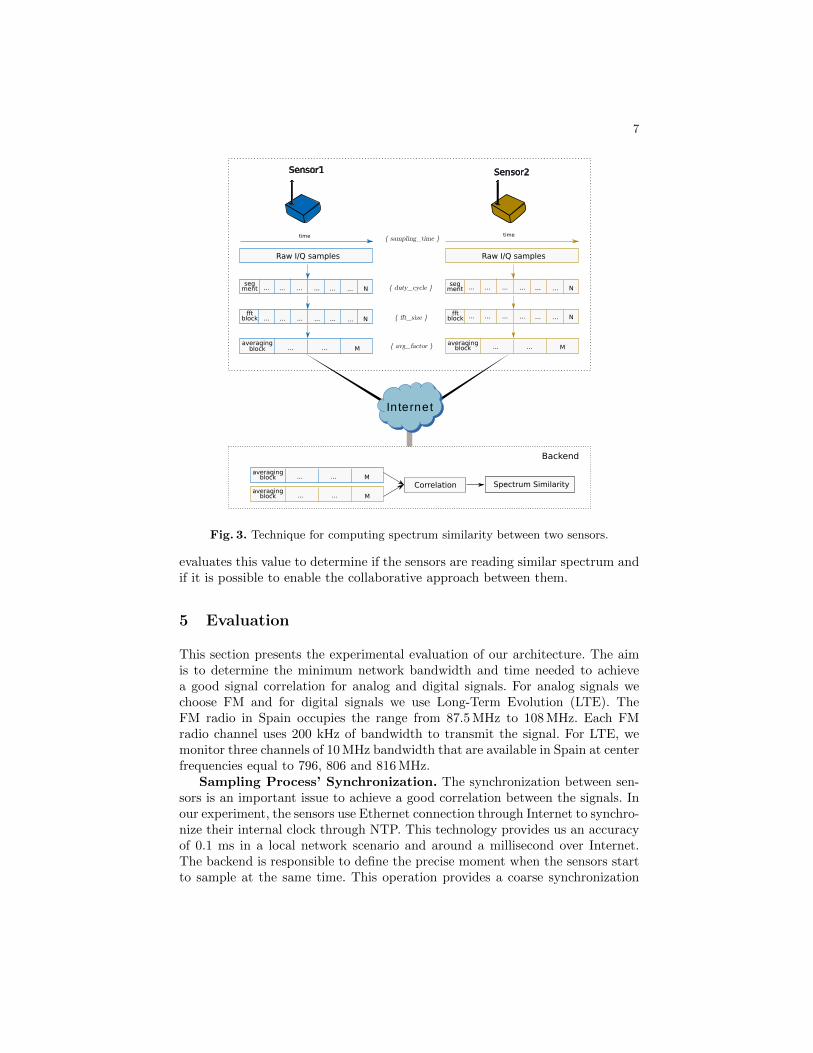
We perform signal correlation analysis in the backend to understand the sim-ilarity in the spectrum data collected by different sensors. Figure 3 shows theoverview of the architecture that is responsible to compute the spectrum simi-larity (it is presented for two sensors, but it could be generalized to any numberof sensors). First, the same center frequency and sampling time is set in bothsensors. During this sampling time the sensors continuously read the spectrum.After that, the raw data spectrum is split in N segments of duty cycle longeach one. For every segment, the FFT is computed according to the fft size(which defines the number of bins). Each fft block has the spectrum informationof 2.0 MHz bandwidth channel. Therefore, the FFT blocks contain frequencyinformation that is averaged using avg factor blocks to produce M averagingblocks. These averaging blocks are sent to the backend for every sensor involvedin the similarity spectrum evaluation. Tuning the different values of the system(sampling time, fft size and avg factor) the amount of data sent to the backend(bandwidth used) can be modulated depending of the needs.
The backend computes the Pearson correlation coefficient using the averagedFFT blocks received from every sensor. The correlation is computed for everypair of averaged FFT blocks coming for different sensors. Then, the average iscomputed using the correlation output for every averaging block. The system
7
Sensor1
Raw I/Q samples
time
segment
fftblock
averagingblock
Internet
Sensor2
Raw I/Q samples
segment
fftblock
averagingblock
time
Backend
Correlation
averagingblock
averagingblock
Spectrum Similarity
... ... ... ... ... ... N
... ... ... ... ... ... N
... ... M
... ... M
... ... M
... ... ... ... ... ... N
... ... ... ... ... ... N
... ... M
{ duty_cycle }
{ fft_size }
{ avg_factor }
{ sampling_time }
Fig. 3. Technique for computing spectrum similarity between two sensors.
evaluates this value to determine if the sensors are reading similar spectrum andif it is possible to enable the collaborative approach between them.
5 Evaluation
This section presents the experimental evaluation of our architecture. The aimis to determine the minimum network bandwidth and time needed to achievea good signal correlation for analog and digital signals. For analog signals wechoose FM and for digital signals we use Long-Term Evolution (LTE). TheFM radio in Spain occupies the range from 87.5 MHz to 108 MHz. Each FMradio channel uses 200 kHz of bandwidth to transmit the signal. For LTE, wemonitor three channels of 10 MHz bandwidth that are available in Spain at centerfrequencies equal to 796, 806 and 816 MHz.
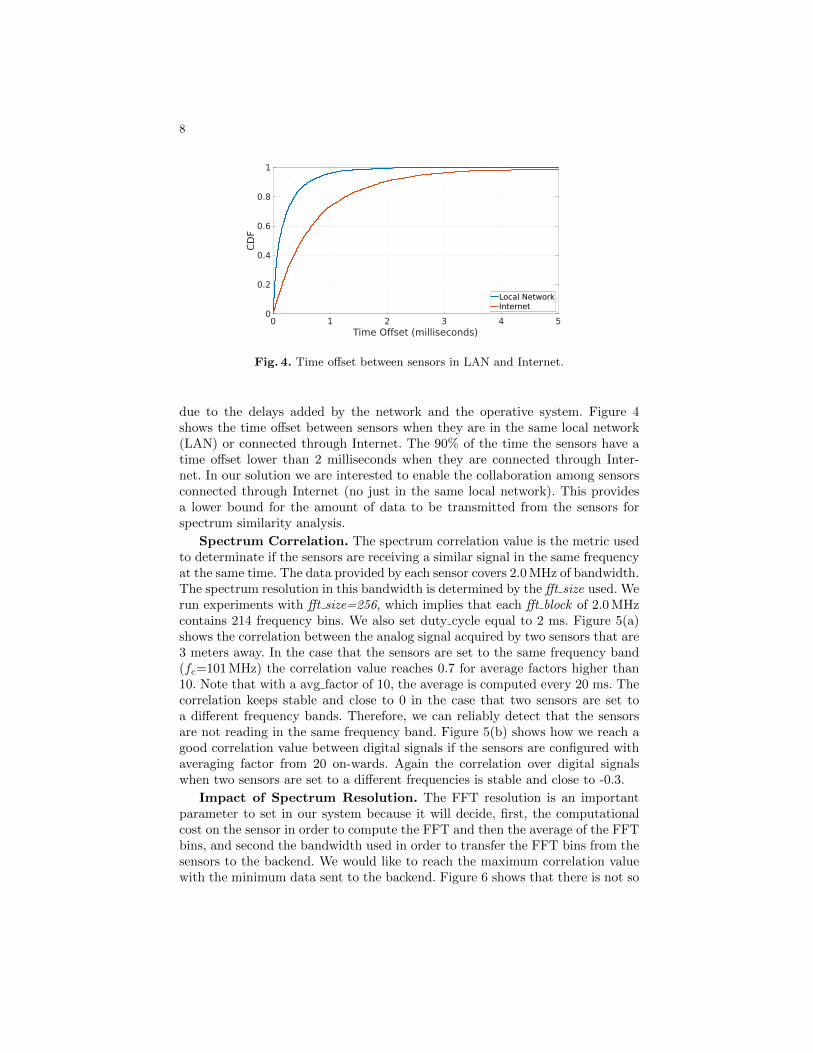
Sampling Process’ Synchronization. The synchronization between sen-sors is an important issue to achieve a good correlation between the signals. Inour experiment, the sensors use Ethernet connection through Internet to synchro-nize their internal clock through NTP. This technology provides us an accuracyof 0.1 ms in a local network scenario and around a millisecond over Internet.The backend is responsible to define the precise moment when the sensors startto sample at the same time. This operation provides a coarse synchronization
8
0 1 2 3 4 5Time Offset (milliseconds)
0
0.2
0.4
0.6
0.8
1
CD
F
Local NetworkInternet
Fig. 4. Time offset between sensors in LAN and Internet.
due to the delays added by the network and the operative system. Figure 4shows the time offset between sensors when they are in the same local network(LAN) or connected through Internet. The 90% of the time the sensors have atime offset lower than 2 milliseconds when they are connected through Inter-net. In our solution we are interested to enable the collaboration among sensorsconnected through Internet (no just in the same local network). This providesa lower bound for the amount of data to be transmitted from the sensors forspectrum similarity analysis.
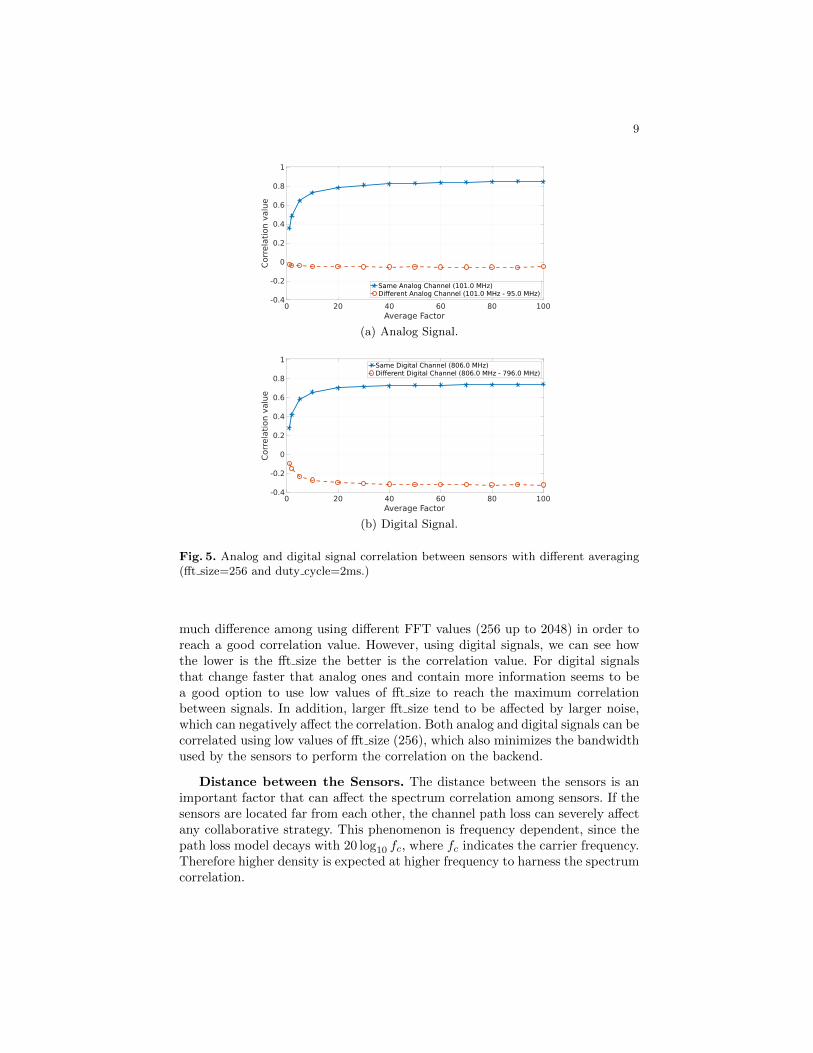
Spectrum Correlation. The spectrum correlation value is the metric usedto determinate if the sensors are receiving a similar signal in the same frequencyat the same time. The data provided by each sensor covers 2.0 MHz of bandwidth.The spectrum resolution in this bandwidth is determined by the fft size used. Werun experiments with fft size=256, which implies that each fft block of 2.0 MHzcontains 214 frequency bins. We also set duty cycle equal to 2 ms. Figure 5(a)shows the correlation between the analog signal acquired by two sensors that are3 meters away. In the case that the sensors are set to the same frequency band(fc=101 MHz) the correlation value reaches 0.7 for average factors higher than10. Note that with a avg factor of 10, the average is computed every 20 ms. Thecorrelation keeps stable and close to 0 in the case that two sensors are set toa different frequency bands. Therefore, we can reliably detect that the sensorsare not reading in the same frequency band. Figure 5(b) shows how we reach agood correlation value between digital signals if the sensors are configured withaveraging factor from 20 on-wards. Again the correlation over digital signalswhen two sensors are set to a different frequencies is stable and close to -0.3.
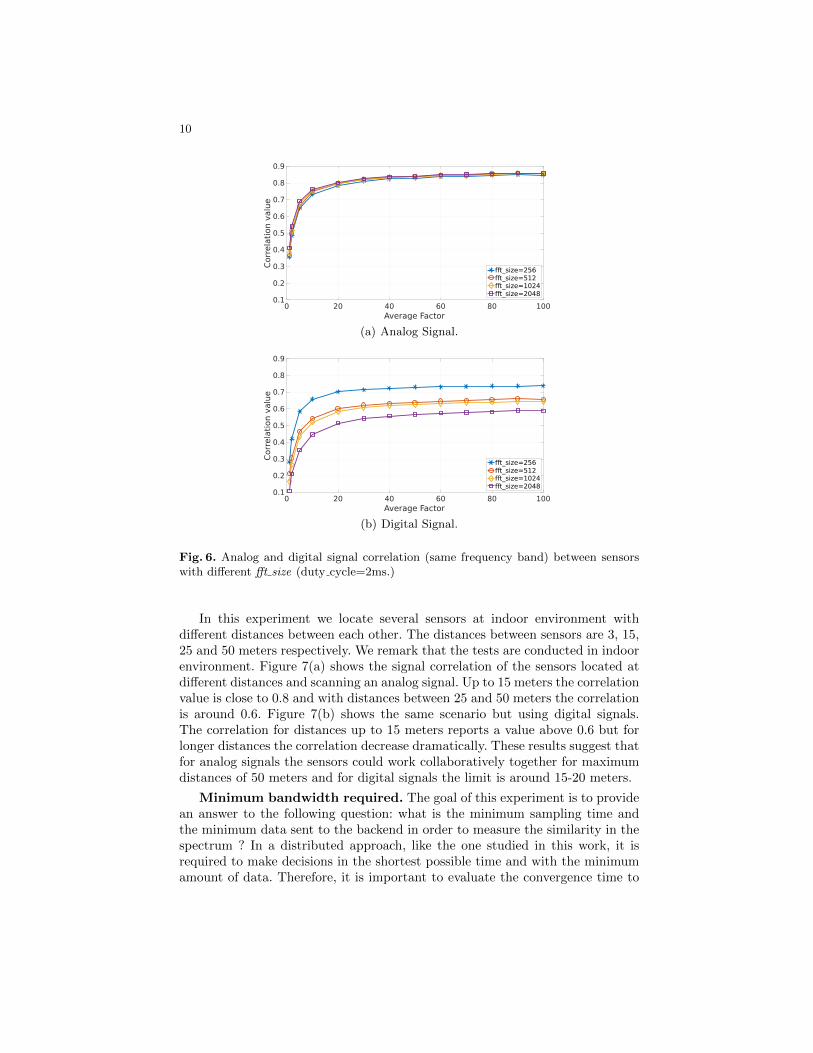
Impact of Spectrum Resolution. The FFT resolution is an importantparameter to set in our system because it will decide, first, the computationalcost on the sensor in order to compute the FFT and then the average of the FFTbins, and second the bandwidth used in order to transfer the FFT bins from thesensors to the backend. We would like to reach the maximum correlation valuewith the minimum data sent to the backend. Figure 6 shows that there is not so
9
0 20 40 60 80 100Average Factor
-0.4
-0.2
0
0.2
0.4
0.6
0.8
1
Corr
ela
tion v
alu
e
Same Analog Channel (101.0 MHz)Different Analog Channel (101.0 MHz - 95.0 MHz)
(a) Analog Signal.
0 20 40 60 80 100Average Factor
-0.4
-0.2
0
0.2
0.4
0.6
0.8
1
Corr
ela
tion v
alu
e
Same Digital Channel (806.0 MHz)Different Digital Channel (806.0 MHz - 796.0 MHz)
(b) Digital Signal.
Fig. 5. Analog and digital signal correlation between sensors with different averaging(fft size=256 and duty cycle=2ms.)
much difference among using different FFT values (256 up to 2048) in order toreach a good correlation value. However, using digital signals, we can see howthe lower is the fft size the better is the correlation value. For digital signalsthat change faster that analog ones and contain more information seems to bea good option to use low values of fft size to reach the maximum correlationbetween signals. In addition, larger fft size tend to be affected by larger noise,which can negatively affect the correlation. Both analog and digital signals can becorrelated using low values of fft size (256), which also minimizes the bandwidthused by the sensors to perform the correlation on the backend.
Distance between the Sensors. The distance between the sensors is animportant factor that can affect the spectrum correlation among sensors. If thesensors are located far from each other, the channel path loss can severely affectany collaborative strategy. This phenomenon is frequency dependent, since thepath loss model decays with 20 log10 fc, where fc indicates the carrier frequency.Therefore higher density is expected at higher frequency to harness the spectrumcorrelation.
10
0 20 40 60 80 100Average Factor
0.1
0.2
0.3
0.4
0.5
0.6
0.7
0.8
0.9
Corr
ela
tion v
alu
efft_size=256fft_size=512fft_size=1024fft_size=2048
(a) Analog Signal.
0 20 40 60 80 100Average Factor
0.1
0.2
0.3
0.4
0.5
0.6
0.7
0.8
0.9
Corr
ela
tion v
alu
e
fft_size=256fft_size=512fft_size=1024fft_size=2048
(b) Digital Signal.
Fig. 6. Analog and digital signal correlation (same frequency band) between sensorswith different fft size (duty cycle=2ms.)
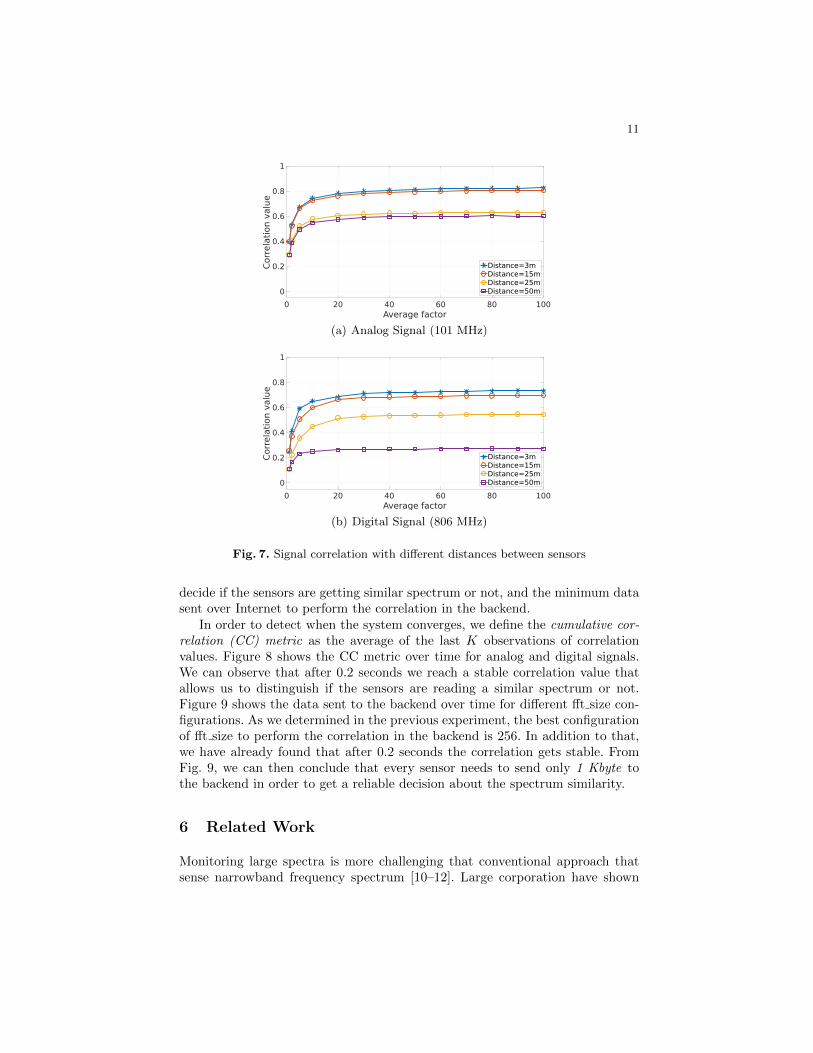
In this experiment we locate several sensors at indoor environment withdifferent distances between each other. The distances between sensors are 3, 15,25 and 50 meters respectively. We remark that the tests are conducted in indoorenvironment. Figure 7(a) shows the signal correlation of the sensors located atdifferent distances and scanning an analog signal. Up to 15 meters the correlationvalue is close to 0.8 and with distances between 25 and 50 meters the correlationis around 0.6. Figure 7(b) shows the same scenario but using digital signals.The correlation for distances up to 15 meters reports a value above 0.6 but forlonger distances the correlation decrease dramatically. These results suggest thatfor analog signals the sensors could work collaboratively together for maximumdistances of 50 meters and for digital signals the limit is around 15-20 meters.
Minimum bandwidth required. The goal of this experiment is to providean answer to the following question: what is the minimum sampling time andthe minimum data sent to the backend in order to measure the similarity in thespectrum ? In a distributed approach, like the one studied in this work, it isrequired to make decisions in the shortest possible time and with the minimumamount of data. Therefore, it is important to evaluate the convergence time to
11
0 20 40 60 80 100Average factor
0
0.2
0.4
0.6
0.8
1
Corr
ela
tion v
alu
eDistance=3mDistance=15mDistance=25mDistance=50m
(a) Analog Signal (101 MHz)
0 20 40 60 80 100Average factor
0
0.2
0.4
0.6
0.8
1
Corr
ela
tion v
alu
e
Distance=3mDistance=15mDistance=25mDistance=50m
(b) Digital Signal (806 MHz)
Fig. 7. Signal correlation with different distances between sensors
decide if the sensors are getting similar spectrum or not, and the minimum datasent over Internet to perform the correlation in the backend.
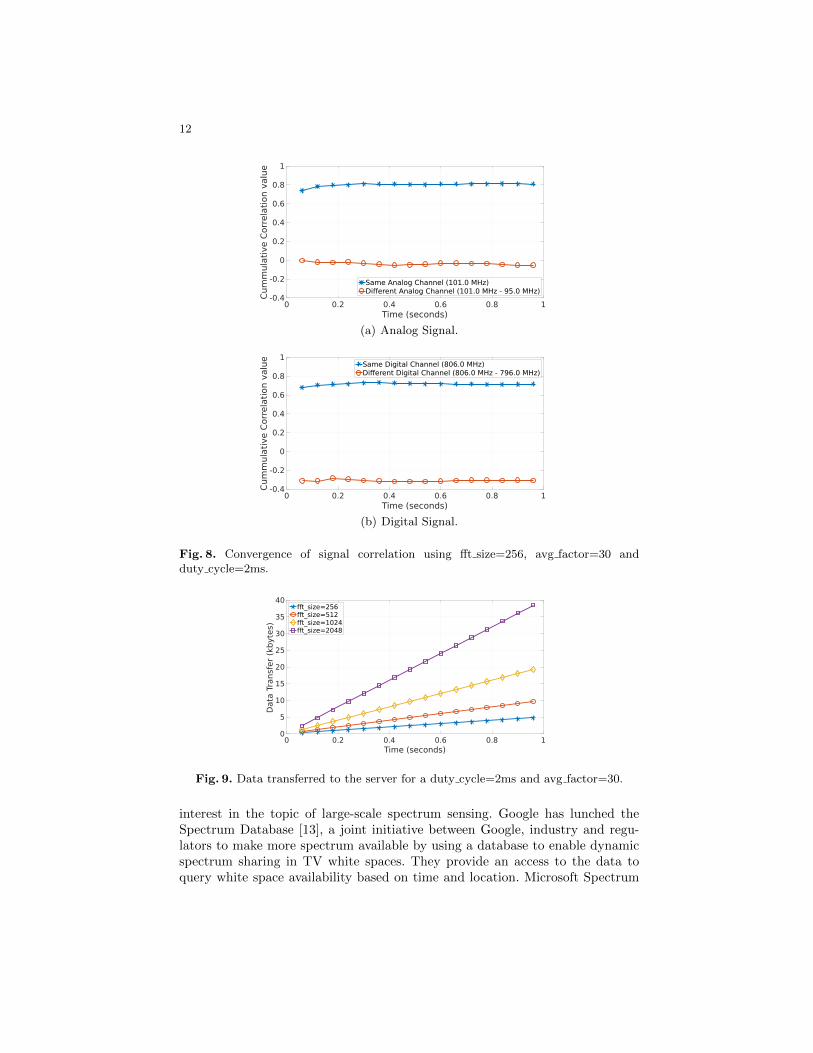
In order to detect when the system converges, we define the cumulative cor-relation (CC) metric as the average of the last K observations of correlationvalues. Figure 8 shows the CC metric over time for analog and digital signals.We can observe that after 0.2 seconds we reach a stable correlation value thatallows us to distinguish if the sensors are reading a similar spectrum or not.Figure 9 shows the data sent to the backend over time for different fft size con-figurations. As we determined in the previous experiment, the best configurationof fft size to perform the correlation in the backend is 256. In addition to that,we have already found that after 0.2 seconds the correlation gets stable. FromFig. 9, we can then conclude that every sensor needs to send only 1 Kbyte tothe backend in order to get a reliable decision about the spectrum similarity.
6 Related Work
Monitoring large spectra is more challenging that conventional approach thatsense narrowband frequency spectrum [10–12]. Large corporation have shown
12
0 0.2 0.4 0.6 0.8 1Time (seconds)
-0.4
-0.2
0
0.2
0.4
0.6
0.8
1
Cum
mula
tive C
orr
ela
tion v
alu
e
Same Analog Channel (101.0 MHz)Different Analog Channel (101.0 MHz - 95.0 MHz)
(a) Analog Signal.
0 0.2 0.4 0.6 0.8 1Time (seconds)
-0.4
-0.2
0
0.2
0.4
0.6
0.8
1
Cum
mula
tive C
orr
ela
tion v
alu
e
Same Digital Channel (806.0 MHz)Different Digital Channel (806.0 MHz - 796.0 MHz)
(b) Digital Signal.
Fig. 8. Convergence of signal correlation using fft size=256, avg factor=30 andduty cycle=2ms.
0 0.2 0.4 0.6 0.8 1Time (seconds)
0
5
10
15
20
25
30
35
40
Data
Tra
nsf
er
(kb
yte
s)
fft_size=256fft_size=512fft_size=1024fft_size=2048
Fig. 9. Data transferred to the server for a duty cycle=2ms and avg factor=30.
interest in the topic of large-scale spectrum sensing. Google has lunched theSpectrum Database [13], a joint initiative between Google, industry and regu-lators to make more spectrum available by using a database to enable dynamicspectrum sharing in TV white spaces. They provide an access to the data toquery white space availability based on time and location. Microsoft Spectrum
13
Observatory [1] is a platform with cost of approximately 5000 dollars that iscurrently operating in a few locations worldwide. Using data collected with theSpectrum Observatory, [14] proposed a system that identifies transmitters fromraw spectrum measurements without prior knowledge of transmitter signatures.It harnesses the observation that wireless signal fading follows a Rayleigh dis-tribution and applies a novel machine learning algorithm and experimentallyidentifies transmitters robustly. SpecNet [3] is a platform developed by MicrosoftResearch that allows researches to conduct spectrum measurements studies re-motely in real-time for opportunistic spectrum access.In their recent work, [8] described the implementation and evaluation of a real-time, centralized spectrum monitoring and alert system. These controllers relyon real-time awareness of spectrum activity. However, the analysis is conductedusing binary vectors, by comparing each power value in the received power vectorto a user-defined threshold. Cooperative sensing has been introduced in [15], andit describes a scenario with sensing nodes that distributively monitor a frequencyspectrum. In [16], they proposed to use a cooperative environment to distinguishbetween an unused band and deep fade due to shadowing or fading effects. Theworks above did not complement the proposed simulation environment with asystem-level design and implementation. [17, 18] employ correlation techniquesin different environments, but the study is based on simulations only. No systemarchitecture problems were studied in these work for their actual implementa-tion.SpecInsight was introduced in [19] and is a system for acquiring 4 GHz of spec-trum in real-time using USRP radios with tens of MHz in 7 locations in theUS. SpecInsight applies a multi-armed bandit game to the problem of selectingthe frequency bands to monitor. Because of the high-end platform used in thework, there are little opportunities for pervasive deployments. In the contextof low-cost spectrum sensing systems, [7] and [6] use Raspberry Pi embeddedhardware and DVB-T receivers with only 2 MHz of band to monitor 1.7 GHz ofspectrum with software defined radio capabilities and implement low-complexityalgorithms for distributed spectrum sensing. In addition, [7] proposed differentfrequency hopping strategies to overcome the hardware limitations of low-cost ra-dios and incorporates different analysis and error/noise correction techniques forflexible and configurable remote wide-spectrum monitoring. In [4], the authorsperformed an initial feasibility study to verify the efficiency of using RTL-SDRUSB dongles connected to laptop or smartphone devices to build a low-costcommoditized spectrum analysis system.
7 Conclusion
We have addressed the compute in the backend the similarity in the spectrumof data collected by low-cost sensors in range of the same transmitter. We haveproposed various methods to achieve reliable correlation in presence of noisydata both for analog and digital signals. We have proved that our architectureprovides good spectrum correlation for sensors in radio range. We have then
14
studied problems such as how the spectrum correlation varies with the distancebetween sensors. Our system can reliably correlate the spectrum of analog anddigital signals of different sensors using data collected during 200 ms and sendingonly 1 Kbyte of data per sensor to the backend. Our results are promising andcan allow intelligent collaborative decisions among sensors in different locations,even when there is only a coarse information of the physical location of thesensors.
Limitations of the current approach and directions of research
In this work we have shown the feasibility of correlating the spectrum datareceived by independent sensors. In particular, the study has considered bothanalog and digital signals, yet with unique transmitter sources (cell tower of FMradio and LTE signal). More in general, medium access protocols and topologicalissues may require more signal processing and intelligent logic. In particular,multiple transmitters, all of them placed in different locations, may share thesame spectrum, yet being in range of the same spectrum sensor. The spectrumsensor could declare high spectrum similarity or not depending on a) the mediumaccess protocol (which transmitter is using the spectrum at a given moment intime) and b) its relative position with respect to the sensors. Possible directionsof research to solve this problem are to identify the transmitter, e.g. detecting aspecific signature, its signal strength, or even estimating both spectrum similarityand the position of the transmitter. Conclusions could then be drawn aboutthe probability of spectrum similarity based on the spectrum activity of eachtransmitter.
Acknowledgments
This work has been funded in part by the TIGRE5-CM program (S2013/ICE-2919). We thank the anonymous reviewers for their valuable comments and sug-gestions.
References
1. “Microsoft spectrum observatory,” http://observatory.microsoftspectrum.com/.2. J. Naganawa, H. Kim, S. Saruwatari, H. Onaga, and H. Morikawa, “Distributed
spectrum sensing utilizing heterogeneous wireless devices and measurement equip-ment,” in New Frontiers in Dynamic Spectrum Access Networks (DySPAN), 2011IEEE Symposium on, May 2011, pp. 173–184.
3. A. Iyer, K. K. Chintalapudi, V. Navda, R. Ramjee, V. Padmanabhan, andC. Murthy, “Specnet: Spectrum sensing sans frontieres,” in 8th USENIX Sym-posium on Networked Systems Design and Implementation (NSDI). USENIX,March 2011.
4. A. Nika, Z. Zhang, X. Zhou, B. Y. Zhao, and H. Zheng, “Towards commoditizedreal-time spectrum monitoring,” in Proceedings of the 1st ACM Workshop on HotTopics in Wireless, ser. HotWireless ’14. New York, NY, USA: ACM, 2014, pp.25–30.
15
5. A. Arcia-Moret, E. Pietrosemoli, and M. Zennaro, “WhispPi: White space mon-itoring with Raspberry Pi,” Global Information Infrastructure Symposium, GIIS2013, 2013.
6. S. Grnroos, K. Nybom, J. Bjrkqvist, J. Hallio, J. Auranen, and R. Ekman, “Dis-tributed spectrum sensing using low cost hardware,” Journal of Signal ProcessingSystems for Signal Image and Video Technology, p. 113, 2015.
7. D. Pfammatter, D. Giustiniano, and V. Lenders, “A Software-defined Sensor Ar-chitecture for Large-scale Wideband Spectrum Monitoring,” in Proceedings of the14th International Symposium on Information Processing in Sensor Networks, ser.IPSN ’15, Seattle, WA, USA, April, pp. 71–82.
8. M. Souryal, M. Ranganathan, J. Mink, , and N. E. Ouni, “Real-time centralizedspectrum monitoring: Feasibility, architecture, and latency,” in Dynamic SpectrumAccess Networks (DySPAN), 2015 IEEE Symposium on, September 2015.
9. R. Calvo-Palomino, D. Giustiniano, , and V. Lenders, “Electrosense: Crowdsourc-ing spectrum monitoring,” in 2017 IEEE International Conference on ComputerCommunications (Infocom), May 2017.
10. I. F. Akyildiz, W.-Y. Lee, M. C. Vuran, and S. Mohanty, “Next generation/dynamicspectrum access/cognitive radio wireless networks: A survey,” Comput. Netw.,vol. 50, no. 13, pp. 2127–2159, Sep. 2006.
11. E. Axell, G. Leus, E. Larsson, and H. Poor, “Spectrum sensing for cognitive radio :State-of-the-art and recent advances,” Signal Processing Magazine, IEEE, vol. 29,no. 3, pp. 101–116, May 2012.
12. Z. Q. Z. Quan, S. C. S. Cui, a.H. Sayed, and H. Poor, “Wideband SpectrumSensing in Cognitive Radio Networks,” 2008 IEEE International Conference onCommunications, 2008.
13. “Google spectrum database,” https://www.google.com/get/spectrumdatabase/.14. M. Zheleva, R. Chandra, A. Chowdhery, A. Kapoor, and P. Garnett, “Txminer:
Identifying transmitters in real-world spectrum measurements,” in Dynamic Spec-trum Access Networks (DySPAN), 2015 IEEE Symposium on, September 2015.
15. S. Mishra, A. Sahai, and R. Brodersen, “Cooperative Sensing among CognitiveRadios,” 2006 IEEE International Conference on Communications, pp. 1658–1663,2006.
16. A. Ghasemi and E. S. Sousa, “Collaborative spectrum sensing for opportunisticaccess in fading environments,” 2005 1st IEEE International Symposium on NewFrontiers in Dynamic Spectrum Access Networks, DySPAN 2005, pp. 131–136,2005.
17. A. S. Cacciapuoti, I. F. Akyildiz, and L. Paura, “Correlation-aware user selec-tion for cooperative spectrum sensing in cognitive radio ad hoc networks,” IEEEJournal on Selected Areas in Communications, vol. 30, no. 2, pp. 297–306, 2012.
18. M. Sampietro, G. Accomoando, L. G. Fasoli, G. Ferrari, and E. C. Gatti, “High Sen-sitivity Noise Measurement with a Correlation Spectrum Analyzer,” IEEE Trans-actions on Instrumentation and Measurement, vol. 49, no. 4, pp. 1–3, 2000.
19. L. Shi, P. Bahl, and D. Katabi, “Beyond sensing: Multi-ghz realtime spectrumanalytics,” in 12th USENIX Symposium on Networked Systems Design and Im-plementation (NSDI 15). Oakland, CA: USENIX Association, May 2015, pp.159–172.