Embed Size (px)
Citation preview
1
Measuring Strategic Data Manipulation: Evidence from a World Bank Project
Abstract
We develop new statistical tests to uncover strategic data manipulation consistent with
fraud. While the digits of naturally occurring data follow the Benford’s Law distribution,
human-produced data instead reflect behavioral biases and incentives to misreport. Our new
tests distinguish intentional manipulation from benign misreporting and also improve the
statistical power of digit analysis. We apply this method to a World Bank development aid
project in Kenya that suffered from high levels of impropriety. Our evidence is consistent with
higher levels of fraud in harder to monitor sectors and in a Kenyan election year when graft also
had political value. The results are externally validated by a large-scale forensic audit conducted
by the World Bank. Our new digit analysis tests are an effective way to detect falsified cost
reports and facilitate monitoring in difficult-to-audit circumstances.
(JEL Codes: H83, M42, C49, D73, O22)
2
1. Introduction
Firms and governments around the world incur large financial losses at the hands of fraudsters
within their midst. Organizations rely on the financial reporting of their agents, who can exploit
asymmetric information to divert financial resources. This asymmetry can arise between a
firm’s owners and their employees, between regulators and firms, or between the public and the
bureaucrats who serve them. Abundant resources are devoted to closing these information gaps
and improving the quality of reported data, including disclosure regulation, audits, monitoring,
whistleblowing and, increasingly, tests of the data themselves to determine their quality. All
reported data contain both information about the underlying true values, and also signals about
quality or distortions within the report (Leuz & Wysocki, 2016). We explore these signals.
In this paper, we present new statistical tests for detecting aberrant patterns that arise when
humans fabricate data. Our tests rely on the fact that humanly generated data are different from
naturally occurring data: humans face incentives to manipulate the data, as well as behavioral
biases when producing data. In contrast, naturally occurring data are governed by Benford’s
Law, and we build upon earlier digit analysis work to improve statistical power and present tests
that better reveal suspected intent to defraud. We apply these statistical tests to data from a
World Bank development aid project in Kenya that was subject to high levels of graft. Our digit-
based method for uncovering fraud is complementary to other popular forms of anti-fraud
machine learning, which have focused on reported values such as the debt-to-equity ratio, or
institutional details like the presence of a Big 4 auditor (Perols, 2011). Therefore, we anticipate
that this method will have wide applicability for both measuring earnings fidelity as well as
detecting fraud.
3
Naturally-occurring data follow the Benford’s Law distribution, while human-produced
data are different along a number of dimensions. Humans face behavioral limitations in
producing numbers, have incentives to pad values, and respond to the economic and political
environments in which they manipulate data. We advance the existing digit analysis and
Benford’s Law literatures in several ways. First, we expand the statistical power of Benford’s
Law goodness of fit testing, which checks whether digits conform to the appropriate statistical
distribution overall. Our test increases sample size by allowing the use of all digit places rather
than just one or two, as is the norm. By improving statistical power, we allow for the
disaggregation and triangulation of data categories, which is crucial to pinpointing fraud.
Second, the existing Benford’s Law literature has focused on aberrant patterns, but has failed to
distinguish between strategic misreporting, which seeks to gain profit for the fraudster and
subvert detection, and benign misreporting or error. This issue is driven by the fact that
Benford’s Law predicts digits distributions from the front of the number (e.g. first digit, second
digit), irrespective of the number’s value (i.e. one thousand versus one hundred thousand). We
have developed a strong test that overcomes this issue and allows us to distinguish patterns
consistent with profitable misreporting. Third, previous studies have largely identified aberrant
patterns, but are not able to validate their findings with external measures of fraud because doing
so requires follow-up investigation and auditing. We supplement our 2 novel tests with 8 other
tests that capture economic and political incentives to steal, as well as the behavioral patterns that
arise when humans fabricate data. With these 10 tests we are able to validate our digit analysis
against an independent forensic audit.
To the best of our knowledge, this paper presents the first external validation of a digit
analysis. An independent forensic audit was conducted on transaction-level data supporting the
4
expenditure totals that we analyze. One outcome of our method, which is the number of tests
failed, is statistically significantly correlated with the level of suspected fraudulent and
questionable transactions from the forensic audit.1 We augment our external validity with
qualitative data about the context, incentives, and techniques that facilitated fraud in this World
Bank project. Hundreds of interviews with project employees, staff, and beneficiaries provide
insight into the design and management flaws of the World Bank project that contributed to
misaligned incentives, inadequate monitoring, and flawed auditing.
The data for our paper are from a large World Bank development project in Kenya and
contain details about development aid expenditures and numbers of beneficiaries. Qualitative
information based on hundreds of interviews also points to high levels of graft from this project.
In response to an external complaint, the World Bank conducted a two-year forensic audit of the
project (World Bank Integrity Vice Presidency, 2011). The forensic audit revealed that the
Bank’s financial controls, monitoring, and existing audit mechanisms were not capturing the
extreme level of suspected fraud that existed.
We expect that our statistical tests will prove especially useful in other settings where
monitoring is challenging, such as investment in developing markets. Indeed, the SEC has
recently warned that investors in emerging markets face risk due to limited and unreliable
financial reporting (U.S. Securities and Exchange Commission, 2020). Our method can be used
for ongoing monitoring to achieve early detection of irregularities, and to assist audits by guiding
sample selection for deeper investigation. This method also has the advantage that it does not
require collaboration with potentially uncooperative auditees.
Our work reveals 3 important substantive findings. First, we find significant inflation of
expenditures during the 2007 Kenyan presidential election year. This is consistent with our
5
qualitative data that World Bank funds were being syphoned into the Kenyan presidential
election campaign of 2007, which is widely accepted to have been a stolen election (Gibson &
Long, 2009). Second, all of our tests point to a high level of embezzlement from the project.
Our digit tests show a failure rate across Kenyan districts ranging from 3/10 to 8/10. This tracks
the findings for the same districts from the World Bank forensic audit, which shows 44 to 75
percent suspected fraudulent or questionable transactions.1 Third, our tests reveal higher levels
of manipulation in harder-to-monitor types of spending, all consistent with rational crime theory
(Becker, 1968) and previous empirical results (see, e.g. (Olken B. A., 2007)).
Our method relates to the widespread, but previously underpowered use of digit analysis
for the detection of anomalies and fraud, and we expect that our method can improve upon
existing applications of digit analysis. Digit analysis has been used throughout accounting, such
as to measure financial statement errors (Amiram, Bozanic, & Rouen, 2015), as well as in
forensic auditing, where it is used for targeting deeper investigation (Nigrini & Mittermaier,
1997; Durtschi, Hillison, & Pacini, 2004). However, these applications rely on simple single-
digit-place comparisons, often in the first, second, or last digit, which limits statistical power and
can run into sample size concerns. Barabesi et al. (2018) apply digit analysis tests to detecting
customs fraud, while Cerioli et al. (2019) apply a similar method to international trade data. In
both of these papers, the authors test conformance to the Benford distribution using advanced
statistical procedures; our work complements those studies by also considering the political
incentives to divert funds, the behavioral limitations of those fabricating data, and the financial
incentives to pad values in valuable digit places.
1 The World Bank flagged 66% of the district transactions as suspicious; of these, 49% were
classified as suspected fraudulent and 17% as questionable.
6
Digit analysis has also had widespread application to other areas where there is value in
detecting data manipulation. Digit analysis has been used extensively in the detection of election
fraud (Mebane, 2008; Beber & Scacco, 2012; Mack & Stoetzer, 2019). Other areas where digit
analysis has been successfully used include in the detection of IMF data manipulation (Michalski
& Stoltz, 2013), campaign finance fraud (Cho & Gaines, 2012), scientific data fabrication
(Diekmann, 2007), and enumerator integrity during survey research (Bredl, Winker, & Kötschau,
2012; Judge & Schechter, 2009; Schräpler, 2011). The ever increasing value of data leads to
greater incentives to manipulate that data, and has led researchers to use digit analysis in a
variety of new settings.
Our analysis also contributes to the accounting and economics literature focused on
monitoring, anomaly detection, and the measurement of data quality. Du et al. (2020) measure
the fidelity of firms’ reported earnings using a hidden Markov model and show that this can
predict external indicators of bad accounting, specifically Security and Exchange Commission
comment letters and earnings restatements. Perols et al. (2017) provide a novel method for fraud
detection using data analytic methods. These authors use the reported values from accounting
statements of known fraudulent firms to classify other firms as suspected fraudulent. Our method
complements these existing studies; while these papers rely on the values of self-reported data,
our method relies instead on the patterns of such data. As such, we expect that our measurement
could be incorporated into broader models of earnings fidelity in future accounting studies. In its
focus on pattern analysis, our work is similar also to Purda and Skillicorn (2015), who analyze
the text of annual and interim corporate reports and show that language patterns can be used for
statistical detection of fraud.
7
Our work relates to a large body of literature that has addressed audit quality, the
organizational economics of fraud, and the incentives of auditors. Auditing faces the challenge
that it is costly, and also that auditors are often employed by the very people that they monitor,
generating conflicting incentives to report suspected impropriety. Goldman and Barlev (1974)
discuss threats to auditor independence and the conflicts of interest they face, particularly from
management that controls their employment and wants a favorable report. Their paper came
early in a large literature on auditor independence, which has since paid much attention to the
financial and public sectors, but less to international aid flows, where the problem is arguably
more dire. Our paper also sheds some light on the problem of audit quality in weak institutional
environments Krishnan et al. (2006) show that misreporting among nonprofits is driven by
managerial incentives and disciplined by the use of outside accountants. In a recent paper on
auditor and client relationships, Cook et al. (2020) demonstrate that the reputations of auditors
tend to match with the reputations of the clients they serve. Lamoreaux et al. (2015) find that
World Bank development aid loans are higher for countries with better accounting quality, while
accounting issues are overlooked in areas of strategic importance for U.S. interests; this work
providing micro-foundation for those macro results. In other related work, Duflo et al. (2013)
provide an example of auditor capture in the developing world and show that monitoring of
monitors is an effective way to combat fraud. Our method addresses the limitations of auditing
that these literatures identify. Our method alleviates some of the monitoring burden in such
challenging environments because it is a scalable, low-cost monitoring procedure that can act as
a counter check on local auditors who may be compromised. It also has the added advantage that
it does not require the cooperation of those who may be implicated in fraud.

8
The remainder of this paper is organized as follows. Section II describes our dataset and the
context of the World Bank project. Section III motivates our digit analysis tests with a
discussion of the economics of data manipulation and an overview of the mathematical
principles that govern digit distributions. Section IV presents our statistical tests and results.
Section V validates our results by comparison to the World Bank forensic audit and qualitative
evidence from the same project. Section VI concludes.
2. Setting and Data
We analyze data from the Kenyan Arid Lands Resource Management Project (World Bank,
2003). This World Bank project ran from 1993 to 2010, eventually serving 11 original arid
districts and 17 semi-arid districts that were added after 2003. This community driven
development project spent $224 million USD targeting the most impoverished people in the
heavily drought-prone regions of Kenya. It funded small infrastructure (such as schools,
dispensaries, and water systems), income-generating activities (such as goat restocking), drought
and natural resource initiatives, and training exercises for villagers.
The flow of funds for this project followed the standard World Bank model. The loan was
made from the World Bank to the Kenyan government. The Kenyan government set up a
national headquarters office and 28 district offices to run the project; over 400 Kenyans were on
staff. The entire project was overseen by a full-time World Bank permanent staff member based
either in Washington or Nairobi. The money flowed from the World Bank to the Kenyan
Treasury in tranches approved by the World Bank following review of financial statements.
Within Kenya, the headquarters office approved district level budgets (where the majority of the
money was spent). Districts spent many of their funds themselves on operations, development
9
projects administered by the district staff, and training exercises. Districts also gave grants for
village projects, and the villages submitted their accounts to the district offices. The data used in
these analyses are from the original 11 arid districts that received funds from the project and
cover the years 2003 to 2009. These districts were all subject to the same project rules and the
same level of monitoring. They also share many similar characteristics: their economies depend
primarily upon livestock and they are among the poorest in Kenya; they are remote from centers
of power, sparsely supplied with infrastructure (roads, schools, health services, access to clean
water, and electricity); and their populations are largely uneducated. These similarities are
important because they allow us to make the assumption that there were no legitimate reasons to
expect differences in digit patterns across districts.
The expenditure and participant data used in these analyses were extracted from quarterly
electronic project reports produced by each of the 11 districts. These reports break out the
expenditures and numbers of male and female participants associated with most activities
undertaken by the project in a given district and year. Each line item expenditure represents the
total expenditures for that project, for example: a classroom, a goat restocking project, or a well
rehabilitation.
Interview data with project staff indicate that usually only 1 or 2 individuals from a district
were involved in reporting the data for a specific project component—usually the district head of
that component and the head of the district office. Components included natural resources and
drought management, community driven development, and support for local development.
10
These district officers had considerable latitude over the number and magnitude of expenditures
per line item within their budget categories.2
2 The digit data for the World Bank Arid Lands Project were extracted from quarterly project
reports for each district and year. These reports were downloaded from the project website
(www.aridland.go.ke) on December 10, 2009; the project and the website were closed in
December 2010. Each Kenyan district served by the project produced quarterly reports detailing
how their budget was spent and how many local beneficiaries benefitted from each micro-project
expenditure. There was variation within and between districts in the amount of additional
information included, but they typically included a description of the activity (for example, a
training exercise), the village location of the expenditure, the dates of the expenditure, the project
sector from which the funds came, and the number of participants broken down by gender. The
data were compiled into one dataset for all districts in a universal format. Expenditures were
sometimes duplicated in a report because they appeared in two sections of the report. For
example, a training exercise for community driven development might appear in the community
development section and again in the training section. The data were meticulously cleared of
duplications. This was an easy process because of all the descriptive data included in the tables.
Data from one sector of the project were also eliminated from the dataset because they do not
meet the requirements of Benford’s Law. Benford’s Law does not apply to data that are subject
to caps. The community driven development projects were typically capped at about $8000;
these projects were eliminated from the dataset. The training exercises associated with these
projects, however, were not subject to caps, varied by an order of magnitude within and between
districts, and were used in the analysis. Projects for communities that were contracted and
supervised by the district offices were also not subject to caps and were included in the analysis.
11
The project had several tiers of monitoring oversight. The district staff was subject to
oversight from both project headquarters in Nairobi and to a lesser extent from the World Bank
official overseeing the project. The World Bank official periodically brought in a team of
foreign experts for a supervisory mission that visited offices and toured some of the micro-
development projects. All district offices and the headquarters office were audited at least
annually by the Kenya National Audit Office. In addition, the World Bank supervisor
occasionally hired an external Kenyan auditor to review the accounts of selected districts. All
financial reports were reviewed by the Kenyan Treasury, the World Bank project supervisor, and
the World Bank administration in Washington.
Despite standard World Bank monitoring procedures, there are strong reasons to believe
that embezzlers perceived the probability of detection was low. Over the many years that the
project ran, monitoring missions consistently rated project financial management “satisfactory,”
right up to the beginning of the forensic audit. The project renewal document (World Bank,
2003, p. 84) labelled the financial management and performance of the project “exemplary.”
Further, its financial management system was used as a model for another project (World Bank,
2007). The annual audits by the Kenya National Audit Office did point to relatively minor
financial irregularities from time to time, but nothing that caused much trouble for the project or
staff. In short, a potential embezzler could have arrived at the conclusion that there was little
chance of getting caught, and that if one did get caught, there were few or no consequences.
That was the situation up until 2009. Neither the World Bank’s standard monitoring procedures,
nor the Kenyan government’s audits, would have lead an embezzler to anticipate the scrutiny the
project eventually received.
12
In 2009, following an external complaint, the World Bank’s Integrity Vice Presidency
(INT) began a broad forensic audit of the project that lasted 2 years and culminated in a public
report (World Bank Integrity Vice Presidency, 2011).3 Auditors sampled 2 years’ worth of
receipts for 7 districts, 5 of which were arid districts examined in this analysis. They examined
28,000 transactions. The auditors worked from actual project receipts and supporting
documents, such as cashbooks, bank statements, and vehicle logs. They also travelled to the
districts to conduct interviews with suppliers to verify the legitimacy of suspicious transactions.
We conduct digit analysis on the reported total expenditures for each of these transactions, such
as the total cost of a training exercise, while the forensic auditors investigated the underlying
individual receipts for the same transactions.
According to the then head of anti-corruption investigations at the World Bank (Stefanovic,
2018), no other field-verified, transaction-based, forensic audit of this scope has taken place for
any World Bank project before or since this one.4
Two characteristics of the structure of the project’s self-reported data facilitate our
analyses. First, we have data from 11 arid districts with similar demographics, livelihoods, and
3 The World Bank referred the Arid Lands case to the Kenyan Anti-Corruption Commission after
completing a joint review together with the Kenya National Audit Office, which confirmed the
findings and resulted in the Kenyan government’s agreement to repay the World Bank $4 million
USD for disallowed charges (World Bank Integrity Vice Presidency and Internal Audit
Department, Treasury, Government of Kenya, 2011). It is noteworthy that despite this action, no
one from the senior management of this project was prosecuted or fired, and this speaks to the
probability of consequences in the current Kenyan context.
4 This is the only such audit on the World Bank INT website.
13
ecological conditions, reporting on similar activities, and subject to the same monitoring,
reporting, and project rules. We proceed from the null hypothesis that digit distributions will be
similar across districts. Second, we have data on the number of reported participants in hundreds
of activities, which are often a count of people who responded to an open invitation for a village
training exercise. This allows for comparisons of the digit patterns in financial data with the
patterns in beneficiary data. When the same pattern of deviations from theoretical distributions
appears in both the expenditure and the participant datasets, it is strongly indicative of human
tampering.
3. Research Method: Theory and Motivation
We motivate our statistical testing with a theoretical framework for the incentives of those
who are tasked with producing expenditure reports. Those who report, typically bureaucrats,
face a decision either to accurately report spending or to fabricate such data. The statistical
properties of the observed data result from this decision, and this theoretical framework provides
predictions of the differences between legitimate and fabricated data.
3.1 The Statistical Properties of Truthfully Reported Data
Using a set of receipts dedicated to a single transaction, such as the construction of a
classroom, an honest bureaucrat calculates the sum of all the construction related receipts and
enters the total in the report. These data follow the digit patterns of natural data, as they
accurately reflect the data without human interference. Across the socio-economically and
ecologically similar regions of this World Bank project, we expect similar patterns in the
financial data when reporting is conducted honestly.
14
Benford’s Law describes the natural distribution of digits in financial data. Benford’s Law
is given mathematically by (Hill, 1995):
We have, for example, the probability that the first 3 digits are “452”:
In the first digit place, Benford’s Law produces an expected frequency of 30.1 percent of
digit 1 and 4.6 percent of digit 9. In later digit places, this curve flattens, and by the 4th digit
place the distribution is nearly identical to the uniform distribution, with expected frequency
10.01 percent of digit 1 and 9.98 percent frequency of digit 9 (Hill, 1995) (Nigrini &
Mittermaier, 1997). Table 1 shows the full digit-by-digit place table of expected frequencies
under Benford’s Law. Datasets known to follow Benford’s Law include financial data and
population data, but also everything from scientific coefficients to baseball statistics (Amiram,
Bozanic, & Rouen, 2015; Diekmann, 2007; Hill, 1995) (Nigrini & Mittermaier, 1997).
[Table 1 here]
The intuition behind Benford’s Law is revealed if one imagines it as a piling-up effect:
increasing a first digit from 1 to 2 requires a 100 percent increase, while increase from a first
digit of 8 to 9 requires a 12 percent increase (Nigrini & Mittermaier, 1997). Furthermore,
Benford’s Law arises from data drawn as random samples from random distributions (Hill,
1995). Because numbers that have been repeatedly multiplied or divided will limit to the
P(D1 = d1,...,Dk = dk ) = log10 1+1di ×10
k−i
i=1
k∑
$
%
&&
'
(
))
P(D1 = 4,D2 = 5,D3 = 2) = log10 1+ 1452
!
"#
$
%&
15
Benford distribution (Boyle, 1994), financial data can be expected to follow this natural
phenomenon (Hill, 1995) (Nigrini & Mittermaier, 1997).
The appropriateness of Benford’s Law for analysis of our data set is confirmed by the
conformance of the first digits to the Benford distribution, as we show later. The nature of our
expenditure data, which are based upon sums of numerous receipts that in turn include sums and
multiplication of price times quantity, provides a theoretical basis for why we can expect
Benford’s Law to be the appropriate null hypothesis distribution. In our analyses, we
consistently performed robustness checks by also comparing our observed data to the uniform
distribution. The statistical significance under the uniform distribution was even greater than
those reported here. Finally, regardless of Benford’s Law, tests of later digit places, particularly
last digits, should be uniformly distributed under most conditions, and we perform these
statistical tests as well.5
3.2 The Statistical Patterns of Manipulated Data
Bureaucrats have an incentive to falsify expenditure data and embezzle both for personal
gain as well as to satisfy kickback demands from superiors. Embezzlers weigh the costs and
benefits of such behavior, including the probability of getting caught and the size of the penalty,
5 In the study of elections, the use of Benford’s Law has been contested based on concerns over
the distributions of data that produce voting counts (Mebane, 2011; Deckert, Myagkov, &
Ordeshook, 2011; Beber & Scacco, 2012). However, these criticisms do not extend to our
financial dataset or individual participant counts, both of which come from distributions that can
be expected to conform to Benford’s Law. Specific auditing guidelines over which types of data
conform to Benford’s Law includes these types of data (Durtschi, Hillison, & Pacini, 2004).
16
in line with a rational decision to commit crime (Becker, 1968). The costs of getting caught may
include payoffs to auditors or others who detect their fraud, or career consequences for those
who are sanctioned. There may also be career consequences for refusing to participate in fraud
perpetrated by one’s superiors. Cheating behavior may however be inhibited by personal or
social values that provide disutility to dishonest behavior.
When a bureaucrat decides to fabricate data, we expect that they will manipulate the data to
maximize payout and minimize the probability of detection. This can consist of a variety of
behaviors. Bureaucrats falsifying reports are often subject to budget constraints within categories
of expenditure but have flexibility over the value of each activity within that category; this was
true in the World Bank project we analyzed. Money can be skimmed either by adding line items
that were never paid out (for example, ghost employees or trainings that never happened), or by
padding the line items of genuine activities. Padding can take many forms, including over-
invoicing arrangements with contractors, in which case the outside party was aware, or by
inflating the final expense in the report, which puts a premium upon keeping the reporting secret
so that the contractors, beneficiaries, and other potential whistle blowers never know the official
expenditure claimed for a project.6 In line with a rational decision to commit fraud, we can
6 There was a premium placed upon keeping reporting data private in this project, even from
high level project officers working in the district offices. One of the authors spent 2 years
negotiating with the World Bank for access to these reports and was granted access only after
intervention from the Board of the Bank on the grounds that the original project document
promised that these data would be made public (World Bank, 2003). Even so, only about 2/3 of
the reports were ever released. It is possible that the data in the missing reports would have
pointed to even more data manipulation than we see here.
17
expect that reporters increase data tampering in response to greater incentives to steal, and
attempt to produce data that appear random to subvert detection. Furthermore, we expect that
bureaucrats expend lower effort in subverting detection for data that are less likely to be
monitored.
Bureaucrats who choose to produce false data face behavioral limitations on their ability to
successfully do so. When experimental subjects are asked to produce random numbers, studies
consistently show patterns of human digit preferences. In a study where students were asked to
make up strings of 25 digits, their results followed neither the Benford distribution nor the
uniform distribution (Boland & Hutchinson, 2000). The patterns produced by the subjects varied
greatly, with individuals exhibiting different preferences for certain digits. Other experiments
have shown similar results of individual digit preferences, confirming the inability of humans to
produce random digits (Chapanis, 1995; Rath, 1966).
It is possible that specific digit preferences are culturally influenced, in which case it is
instructive to have a culturally representative baseline for comparison. Evidence of specific digit
preferences from Africa comes from an overview of African census data. A phenomenon known
as age heaping occurs when people are approximating their age; demographic records show a
preference for certain ages. Many Africans of older generations do not know their exact age, and
their responses to census takers represent their best approximation. This is an example of
humanly generated data that shows specific digit preferences. Among the African censuses, we
see a strong preference for the digits 0 and 5, with secondary strong preferences for 2 and 8, and
disuse of 1 and 9 (Nagi, Stockwell, & Snavley, 1973; UN Economic and Social Council
Economic Comission for Africa, 1986). These same digit patterns occur in our data; both 0 and
18
5 are so heavily overrepresented that we omit them in many of our analyses and analyze only
digits 1-4 and 6-9.
4. Digit Tests and Results
We provide a set of non-overlapping tests that capture different ways in which data can be
manipulated. Our tests fall into four categories: a novel test to increase statistical power, tests of
strategic intent to deceive, tests that measure responses to incentives, and robustness checks that
include standard tests from the literature. To account for multiple tests, we use a Bonferroni
correction: we divide our desired significance level (.05) by the number of tests (10) and set a
significant level of p = .005, used throughout our analyses.
4.1. Increasing Statistical Power: All Digit Places Beyond the First
A simple, powerful test of data manipulation is conformance of the observed digits to
Benford’s Law. Such tests are frequently performed in a single digit place, using the first,
second, or last digit place (Diekmann, 2007; Beber & Scacco, 2012). In implementing our test,
we take 2 novel approaches. First, we test multiple digit places simultaneously. Compared with
single digit place tests, a simultaneous analysis of multiple digit places increases sample size for
statistical testing and therefore vastly increases statistical power.7 The increase in sample size
afforded by simultaneous digit place analysis is especially helpful when analysis can benefit
from data disaggregation, resulting in low n. Second, we omit the first digit when conducting
7 Individual digit place analyses beyond the first in existing literature include second and last
digit analysis. (Beber & Scacco, 2012; Diekmann, 2007). However, testing individual digit
places results in multiple-hypothesis testing issues, which a two-way chi square test avoids.
19
this analysis, because individuals tampering with data may not have complete control over the
leading digit or may avoid changing it to subvert detection. This has the potential of a more
powerful fraud detector because the noise of the first digit, which may have been left clean
strategically, is eliminated. The first digit test is presented as a robustness check later.
We use a two-way chi square test to compare the contingency table of all digit places
beyond the first against the Benford distribution. We omit 0 and 5 from this analysis, which may
be subject to rounding for legitimate reasons, and which we handle separately in a test for excess
rounding. For each digit place (2nd digit, 3rd digit, etc.), the frequency of each digit (1, 2, 3, 4, 6,
7, 8, and 9) is compared with the expected frequencies given in Table 1.
Figures 1 and 2 present the data of all digit places beyond the first for expenditure (Figure 1)
and participant data (Figure 2). The data are projected onto one axis for visualization. Among
the expenditure data for all districts in Figure 1, we see a strong preference for digits 2 and 8,
underreporting of 1 and 9, and overall non-conformance to the expected Benford distribution (p
= 3.9 × 10⁻¹⁵). Strikingly, these same digit patterns appear in the participant data (Figure 2), and
the result for all district data combined is again highly significant (p = 5.7 × 10-51). This pattern
is also consistent with the humanly generated African census pattern described earlier.
In 8 of our 11 districts we reject the null hypothesis that all digit places conform to
Benford’s Law for both the expenditure data and the participant data at the p < 0.005 level.
[Figure 1 Here]
[Figure 2 Here]
20
The lack of conformance to the expected distribution, consistency with known humanly
generated data from African census studies, and similar patterns across both expenditure and
participant data, are strong indicators that these data have been tampered with.8
4.2. Strategic Intent: Padding Valuable Digit Places
The first test demonstrates that the data do not conform to Benford’s Law, but does not
demonstrate the directionality of how people are manipulating the digits. Evidence that data are
being fabricated consistently in the direction of increasing payment to the embezzlers is
important evidence of intentionality. While there may be a strong correlation between firms and
individuals whose paperwork is sometimes incomplete or missing, and actual embezzlement, it is
not necessarily the case that sloppy bookkeepers are misappropriating funds. For this reason,
evidence that points to consistently profitable deviations from expected digit distributions, or
evidence of strategic efforts to avoid detection, bring us a step closer to deducing intent to
defraud.
As discussed in Section 3.2, bureaucrats falsifying data can be expected to inflate values in
order to receive greater illicit reimbursement. We identify padding of expenditures by measuring
overuse of high digits based on the monetary value of the digit place. We hypothesize that
8 We do not include a test of the last digit place among our 10 tests because it is technically
subsumed under this test, and we wish to avoid non-independence across our tests. Benford’s
Law predicts a uniform distribution in digit places beyond the fourth; that is, there is no reason
that more data should end with a 4 instead of a 3. For comparison to other studies, we include
the results of last digit analysis in the Appendix. In the last digit test, both the expenditure and
the participant data diverge significantly from the predicted distributions. We do not include the
last digit in the final tally of tests (discussed later) to preserve independence of tests.
21
individuals fabricating data do so strategically, and therefore place additional high digits in the
more valuable digit places.
Benford’s Law governs the distribution of digits by the number of positions from the left (1st
digit, 2nd digit). However, the value of a digit depends on the digit’s position from the right (e.g.
1s, 10s, 100s place), and this value determines the incentive to manipulate a digit. Therefore,
basic tests of conformance to Benford’s law are not sensitive to the value of the digit being
manipulated.
To overcome this limitation, we compute the expected mean under Benford’s Law by digit
place from the right (10s, 100s), using the length of the numbers in our dataset to match left-
aligned digit places and right-aligned digit places. We compare the observed mean of our data to
the expected mean under Benford’s Law. This is the difference of means statistic, for which a
positive value indicates a mean greater than the expected mean under Benford’s Law. We then
perform a Monte Carlo simulation of 100,000 Benford-distributed digits in each digit place,
compare the difference-of-means statistic of the project data to the simulated data, and find the
probability of observing our results under the Benford distribution. Appendix A contains
technical details of this process.
Figure 3 shows the project data against the Benford expected distribution. The 0 line
indicates the Benford mean; anything above the line represents an overuse of high digits, and
anything below the line represents an underuse. The project data in the 10,000s place exceed
100 percent of the 100,000 simulated Benford-conforming datasets (p = 1.0 × 10⁻⁵). We also see
a significantly high mean (p = 2.3 × 10⁻⁴) in the thousands place. At the district level there is
statistically significant evidence of padding in the 10,000’s place for 8 of 11 districts. Ten
thousand Kenyan shillings was worth approximately $150 USD in 2007.
22
[Figure 3 here]
Perhaps the most interesting finding in Figure 3, which points to intention to conceal, is the
decline in the use of high digits as one goes from the 10,000s to the 1,000s, 100s, 10s, and 1s
places. This is consistent with a strategy of padding extra high digits in the high value places
and compensating by underutilizing high numbers in the low digit places. The human data
generators may have been trying to avoid detection from an auditor or supervisor, who might
otherwise have noticed the overuse of high numbers in any given table in the report.
Next, we test for response to incentives. We begin with political incentives to embezzle
additional money in a presidential election year. We then turn to two examples consistent with
the hypothesis that embezzlers divert their cheating behavior to places where they are less likely
to be detected.
4.3. Response to Incentives: Election Year Effects
Interview data frequently cited the connection between syphoned project funds and the
controversial presidential political campaign of 2007. The association between corruption and
political campaigns has also been noted in other studies (Claessens, Feijen, & Laeven, 2008).
The next test partitions our data by project year to examine whether the evidence is consistent
with higher rates of embezzlement in the presidential election year 2007. We look for padding
of high digit numbers by project year by analyzing the proportion of high to low digits (6, 7, 8,
and 9 versus 1, 2, 3, and 4) in all digit places beyond the first. We conduct a chi-square test on
the contingency table of high versus low digits in each digit place. We expect that the
probabilities of high and low digits should follow the total probability of those digits from
23
Benford’s Law in each digit place. We project this contingency table onto one axis for
visualization.
As we see in Figure 4, while all other years slightly underused high digits on average, in
2007 (the only presidential election year) there was a statistically significant overuse of high
digits (p = 6.5 × 10⁻⁶). This is consistent with a greater incentive to embezzle during a
presidential election year to support political campaigns.
[Figure 4 here]
4.4. Response to Incentives: Sector Effects
Economic theory (Becker, 1968) and empirical work e.g. (Olken B. A., 2007) indicate that
individuals are more likely to cheat when there is a lower risk of detection. The training and
transport sectors of this (travel, fuel, and vehicle maintenance) provided greater opportunities for
individuals to pad expenditures when compared to the civil works and goods and equipment
sectors, because the latter left physical evidence of spending, while the former did not. For
example, tracking down nomads who were reported as present for a training exercise in a remote
village 2 years prior to an audit is all but impossible. Similarly, project fuel can be diverted to
private vehicles while leaving no trace. Therefore, we predict that individuals fabricating data
for these sectors may do so with less effort expended on deception. To detect this, we look for
evidence of a greater incidence of repeated numbers among training, travel and vehicle
expenditures. We plot the percentage of repeated line items that match year, district, and
amount, for each of the districts by sector. Figure 5 shows this result.
[Figure 5 here]
24
For each district, we conduct a Welch’s unequal variance t-test of the number of repeats in
the training and transport sector versus the civil works and goods and equipment sectors
combined. Seven of 11 districts and the all district test have statistically higher repeats in that
sector. Turkana, Garissa, and Tana River Districts, where other sectors have higher percentages
of repeats, provide evidence that there is no structural reason for this phenomenon. Given that
most of these line items are at least 5 digits, exact digit repetition is not likely to be common, yet
we find that exact repeats in the training sector make up 55 percent of line items in Baringo, but
only 5 percent in Turkana. While we don’t know what the empirically honest level of repeating
should be, there is no known legitimate reason for there to be more repeated line items in some
districts than others.
The difference in rates of repeating across districts likely reflects differences in
vulnerability to monitoring among different political territories. For example, Baringo is the
home of former President Moi, who was still immensely powerful and may have provided
political cover from project oversight. While measurement of political “protection” is beyond
the scope of this paper, our tests explore the extent to which districts vary in their response to
monitoring.
4.5. Response to Incentives: Unpacking Rounded Numbers
Project staff had an incentive to inflate the number of participants in training activities
because they claimed food expenses for each participant at 100 Kenyan Shillings (about $1.50
USD) per person, per day. The authors of the annual district reports also had reason to expect
that participant data would not be as carefully scrutinized as expenditure data. First, the impact
of participants on expenditures was obscured because it was only one component of the full costs
25
of a single training exercise, and second, training exercises in remote villages are notoriously
difficult to verify. With the threat of oversight reduced, we speculate that less effort was devoted
to covering up data fabrication.
We further surmise that officers fabricating participant data may have begun with an
embezzlement target in mind, which they converted to a round number of participants. This total
number of participants was then split into males and females, as was required for reporting.
Therefore, we expect greater indicators of data fabrication when the total number of male and
female participants sums to a round number.
To test this, we analyze the distribution of all but first digits of numbers of total participants
(males and females) when their sum ends in a 0 versus a non-0 digit. We perform a chi-square
test on the contingency table of digits in digit places beyond the first, versus Benford’s Law.
Theoretically, the breakout of participant data by gender should show statistically identical digit
distributions between these conditions. However, we see a much higher instance of 2s and 8s
and low incidence of 1s and 9s when the gender specific data come from a pooled number that
ends in 0 (Figure 6A). This pattern is consistent with humanly generated data and not with
naturally occurring data. There is still evidence of human generation in the data when the gender
total is not round, Figure 6B (p = 1.9 × 10⁻⁶), but the statistical significance is even higher in the
rounded data, Figure 6A (p = 2.6 × 10-64 in the sample of all districts). For 8 out of 11 districts,
we reject the null hypothesis that the total of male and female participant data are Benford
conforming (p < 0.005).
[Figure 6AB here]
26
Our remaining 4 tests are adapted and modified from existing literature. These tests
encompass a set of digit analytic techniques common in the forensic analysis literature but with
improved statistical power due to small innovations in how our tests are conducted. We include
them to demonstrate robustness and to simultaneously add additional dimensions to our multiple
test analysis prior to our exploration of its external validity.
4.6. Robustness Checks: Comparisons of District Patterns in Rounding and Repeating
Our next 2 tests uncover patterns consistent with human tampering, as evidenced by
substantial variation across districts without a plausible, naturally occurring explanation. It is
common for auditors to look for both high levels of rounded and repeated data, and these are
often viewed as potential evidence of human tampering (Nigrini & Mittermaier, 1997; Nigrini,
Benford's Law, 2012). In the absence of theoretically acceptable levels of rounding and
repeating, we compare districts to each other, as there is no known reason to expect differences
among them.
The Kenyan shilling was 66 to $1 USD in 2008. Its value was low enough that many
receipt data would legitimately show high levels of 0s and 5s in the terminal digit places.
However, one must bear in mind that these expenditure data represent sums of many receipts; it
takes only one receipt ending in a non-0 or 5 to create a different terminal digit for the entire
transaction, and it is these transaction totals that we are examining.
We count the number of rounded digits, tallying the number of trailing 0s (0, 00, 000, etc.),
or digits in terminal strings of 5, 50, or 500, as a fraction of the number of digits in each line
item. For example: the number 30,000 has 4 rounded digits out of 5 (80%); the number 12,350
has 2 rounded digits out of 5 (40%); and the number 11,371 has 0 rounded digits. Rather than
27
indicating individual line items, counting rounded digits is a more sensitive indicator because it
penalizes use of numbers such as 10,000 (4 rounded digits) more than the use of a number such
as 10,600 (2 rounded digits).
Figure 7 shows the average percentage of rounded digits by district:
[Figure 7 Here]
While we don’t know the empirically honest level of rounding that should occur in the
dataset, there is good reason to expect that the same type of retailers, servicing the same type of
contracts in economically and demographically similar districts, practiced the same rates of
rounding. In the absence of an expected level of rounding, we compare districts to each other.
For each district, we conduct a Welch’s unequal variances t-test to compare the mean percentage
rounding to all other districts. For example, the statistical test for Baringo compare the level of
rounding in Baringo to the level of rounding in the 10 other districts combined. We conduct a
one-tailed test to check for excessive rounding and define statistical significance at p < 0.005.
Exactly repeated numbers are also a red flag for auditors (Nigrini & Mittermaier, 1997). Our
hypothesis is that embezzlers expended less effort in data fabrication when there was less reason
to expect scrutiny. Repeated values are consistent with low-effort data fabrication. One such
example is remote training exercises, which are particularly hard to verify, as we discussed
earlier.
A specific example from the Tana District Report of 2003-6 illustrates the problem of
repeated data (Republic of Kenya, 2006). On page 49, we find 8 training exercises listed that
took place in different villages for 3 weeks, each from March 5-27. The district had neither
enough vehicles, nor enough training staff to run 8 simultaneous trainings. Among the 8
expenditures listed, we find the identical cost (245,392 Kenyan Shillings) listed for 3 different
28
trainings, and another number (249,447) exactly repeated twice. Trainings are the summed costs
of the per diems for 4-5 trainers and 1 driver (at different rates), the cost of fuel to the
destination, stationary for the seminar, and 100 Kenyan Shillings per day, per trainee, for food
costs. The number of trainees for each of these seminars is listed, and they range from 51 to 172.
The expenses reported do not track the estimated food costs, as one would expect; indeed, the
cost of training for 172 trainees should have exceeded all of the amounts listed.
In our calculations, repeating numbers refer to the use of identical expenditure amounts for
completely different activities. We define an exact repeat to be an expenditure matching year,
district, sector, and expenditure value. There is no correction for rounding in the repeating data,
as we wish to maintain the independence of our tests for rounding and repeating.
Figure 8 shows the results for the percentage of line items that repeat exactly. As with
rounding, the empirically truthful level of repeating is unknown but there is no reason for
patterns across districts to differ. We compare each district’s average amount of rounding to all
other districts, using a Welch’s unequal variance t-test, and conduct a one-tailed test for
excessive rounding as compared to all other districts. We see wide variation across districts:
Baringo approaches 50 percent, while Turkana repeats about 5 percent. Figures 7 and 8 flag
different districts in rounding and repeating behavior, indicating that these 2 tests pick up
different signals. This test also differs from the test of repeats by sector: the sector test compared
differences in repeating within a district, with the assumption that repeating should be constant
across sectors. This test explicitly compares the number of repeats across districts, on the basis
that repeating should be constant in different geographical regions.
[Figure 8 here]
29
4.7. Robustness Checks: First Digits
Next, we test conformance to the Benford distribution in the first digit place of the
expenditure data, where we expect digits to follow (Hill, 1995):
Figure 9A plots this distribution as a solid line and shows the conformance of the first digits
to Benford’s Law. Data from the full sample of districts are not statistically significantly
different from the expected distribution (p = 0.089) under a chi-square test. This supports the
hypothesis that Benford’s Law is the appropriate theoretical distribution for our dataset.
Importantly, this does not necessarily mean that all of the first digit data are unmanipulated.
First, people may resist tampering with the first digit to avoid detection. Second, pooled data
may cancel out different individual signatures of manipulation and replicate Benford’s Law
(Diekmann, 2007). This becomes evident when we look at the data from individual districts
where the reports were constructed. Figure 9B shows the first digits from Ijara district, with p =
2.3 × 10⁻¹³. Ijara District uses the digit 2 in the first digit place almost twice as often as
predicted. Seven of our 11 districts are significantly different from Benford’s Law at the p <
0.005 level.
[Figure 9AB here]
4.8. Robustness Checks: Digit Pairs
Underuse of digit pairs, e.g. 11, 22…99, is a common feature of humanly produced data
(Boland & Hutchinson, 2000; Chapanis, 1995). Other applications of digit analysis examine the
last 2 digits (Nigrini, 2012), or explicitly test for digit pairs (Beber & Scacco, 2012).
P(First Digit = d) = log10 1+1d
!
"#
$
%&
30
Among the participant data, we expect a uniform distribution of terminal pairs, 9 of 99 pairs.
We omit the pair 00, in case it is affected by rounding. We compare the observed number of
digit pairs against the expected proportion using a binomial test, where the number of trials is the
total combination of terminal digits observed. These data most typically record the number of
women and men (listed separately) who showed up in response to an open invitation to appear
for a training exercise in their village. To avoid use of first digits, we use participant data only if
it has 3 or more digit places. This test is performed on the sum of male and female participants.
A digit pair analysis of participant data is shown in Figure 10. Five of the 11 districts
significantly underuse final digit pairs in the participant data at p < 0.005 significance, as does
the combined sample of all districts (p = 2.5 × 10⁻¹⁰).
[Figure 10 here]
Due to the low value of the Kenyan shilling, rounding in the last digit places may be
legitimate in expenditure data. Therefore, an equivalent analysis of expenditure data is not
justified, as an underuse of digit pairs (e.g. 22) is confounded by a legitimate use of rounding
(e.g. 20). For this reason, we confine our analysis to the beneficiary data, where there is no
legitimate reason for rounding in the ones place, as participant data are reported as exact counts
of people who show up.
4.9. Summary: Application of Digit Tests
These 10 tests, taken together, comprise a set of largely non-overlapping analyses along
different dimensions of potential data manipulation. We expect that our new tests, especially the
powerful test using all digit places, and our second test, which can capture strategic padding of
high digit places, should prove useful in many contexts. By facilitating the full use of our

31
attribute data, this battery of tests helps reveal the magnitude of potential fraud in this project, as
well as the important finding that aid funds were very likely being diverted to campaign coffers
during a highly controversial presidential election year that lead to extreme violence (Gibson &
Long, 2009).
This exact battery of tests is not a turnkey system for digit analysis in all circumstances.
Some characteristics of this dataset, such as the comparison of expenditure to beneficiary tests,
are particular to these data. The exact set of tests that can be performed on other datasets
depends on both the incentives for manipulation in that dataset, as well as the specifics of the
attribute data that are available. Our 10 tests serve as an example of the power one can achieve
with these techniques.
5. Establishing External Validity: Comparing Digit Analysis to The World Bank Forensic
Audit and to Qualitative Data from the Field
The existence of both an independent forensic audit for this World Bank project and rich
qualitative data from the field, provides us with a unique opportunity to establish the external
validity of our new tests and of digit analysis in general.
5.1 The World Bank Forensic Audit
Table 2 compiles the results of 10 tests for each district. To address type 1 error due to the
number of tests we conduct, we perform a Bonferroni correction and divide our desired
significance level (0.05) by the number of tests (10). This sets a significance level of 0.005.
These 10 tests avoid almost all overlap and pinpoint different aspects of data manipulation. In
32
the bottom row, we sum the number of failed tests by district, which averages 5.4 out of 10 and
ranges from 3 to 8.
[Table 2 here]
The results of our method are statistically significantly correlated with the results of the
World Bank’s forensic audit. In Table 3 we compare the results of our digit analyses by district
to the results of the World Bank forensic auditors (World Bank Integrity Vice Presidency, 2011).
The World Bank audit found that 4 of the 5 districts for which we have both digit and audit
results had 62-75 percent suspected fraudulent or questionable expenditures. In our digit
analysis, we rejected the null hypotheses for those same 4 districts in 5 to 6 of our 10 digit tests.
The remaining district, Tana River, had lower levels of suspected fraud in the audit than the other
districts (44 percent), and we rejected the null on 3 of our 10 digit tests. A Pearson’s correlation
test of the 5 districts for which we have both digit tests and the World Bank audit shows a
correlation of .984, and a 95% confidence interval of [.784, .999]. We reject the null hypothesis
of no correlation at the 5% significance level, with p = 0.0022. The World Bank’s forensic audit
confirms the findings from our digit analysis tests.
[Table 3 here]
We also find significant digit violations in all of the unaudited districts we examine, which
is consistent with the conclusions of the auditors that these problems were systemic throughout
all sectors and all districts of the project. Of the remaining 6 districts that were not audited by
the World Bank, we see that half (Mandera, Ijara, Baringo) have among the highest number of
digit analysis violations (8, 7, and 6) in our sample. This underscores the potential gains of using
digit analysis as a diagnostic for targeting costly auditing techniques to ensure that the worst
offenders are not missed.
33
5.2 Qualitative Data from the Field
Qualitative research has the advantage that it can provide the substantive details
necessary to understand how complex systems work. It provides the context to identify
conflicting incentives and design flaws exacerbating the risk of fraud. While forensic audits and
digit analysis help us identify specific instances and levels of likely fraud, they do not provide all
the information required to design better monitoring systems to control future fraud. This section
draws from thousands of pages of interviews with people familiar with this project’s operation.
To understand how the project operated on the ground, we draw upon the insider knowledge of
project employees and beneficiaries, contractors, consultants, civil servants, World Bank
employees, investigative reporters, politicians, and members of civil society (see Ensminger,
2017 for more details).
The Arid Lands project functioned within the corrupt institutional environment of Kenya.
In 2009, the Transparency International Corruption Perceptions Index ranked Kenya 146th out of
180 countries (Transparency International, 2009). Both then and now, Kenya qualifies as a
systemically corrupt country: corruption and impunity are the norm, and the political system
facilitates the theft of government resources, including those from projects such as this one.
34
Independent interviews and the INT forensic audit provide cross-corroborating details pointing
to high-level government complicity in this theft.9
The specified flow of project funds was from the Kenyan Treasury to the project
headquarters to districts and then villages. According to diverse sources, the reality was that
there were kickbacks flowing up and out at every level. Demands for kickbacks began with
senior government officials external to the project. It is alleged that headquarters staff met some
of those demands with funds embezzled from their headquarters budget. However, the project
specified that the bulk of the funds had to be wired to the districts, which posed a challenge for
headquarters staff to get that money back. Interviewees report that this occurred in the form of
9 The relationship between the Arid Lands project and the Kenya Commercial Bank (KCB), a
partially government-owned bank, serves to illustrate the kind of relationship that existed
between the project and the Kenyan government. Most of the accounts of the project were held
at KCB offices all over the country. The INT audit report details numerous ways in which the
Kenya Commercial Bank appeared to be complicit with project staff in defrauding the program.
The KCB also refused to turn over 49% of the cleared checks requested by the auditors, even
though the terms of agreement between the Kenyan Government and the World Bank required
cooperation with the World Bank’s auditors. Among the checks that were turned over to the
auditors there were many irregularities. The KCB cashed numerous checks made out to
“Commissioner of VAT” that were never presented to VAT (World Bank Integrity Vice
Presidency, 2011, pp. 6-7). In these cases, the original payee’s name had been crossed out on the
face of the check and another was substituted (World Bank Integrity Vice Presidency, 2011, p.
35). Several branches of the KCB provided altered bank statements to the auditors in which the
words “cash withdrawal” were removed from the transaction description field.
35
monthly “envelopes” sent from districts back to headquarters as kickbacks. Some districts were
able to avoid many such requests from headquarters because their districts were home to
powerful national political actors who provided protection. But in many cases, this did not mean
less embezzlement, just different recipients.
Even accounting for the corrupt environment in which this project operated, the fraud risk
of this project was exacerbated by poor design. Two of these design flaws can be directly linked
to resulting weakness in the monitoring systems: staff hiring and staff discretion in the choice of
which villages received projects.
It is often said that the “tone at the top” matters. This is arguable even more the case when
the surrounding institutional environment is systemically corrupt. Many of the senior staff in the
Arid Lands project were seconded from their permanent ministry jobs, to which they expected to
return, thus creating conflicts of interest and dual loyalty. This arrangement produced pressure
to engage in fraud in collaboration with their home ministries. The project was effectively
plugged directly into existing corruption networks that syphoned funds from the project upward
to senior politicians and government civil servants. These features differentiate the project from
a more successful World Bank community-driven development project in Indonesia (the KDP).
Specifically, because the designers of the Indonesian project understood that they were operating
in a similarly corrupt institutional environment, they went out of their way to create recruitment
mechanisms independent of corruption centers in the government (Guggenheim, 2006).
Given the pressure on the top layer of Arid Lands management to kick funds upward, in
addition to their desire for personal accumulation, it was important that they have obedient
36
subordinate staff beneath them, especially in the districts.10 According to numerous sources, this
was achieved by hiring staff who were underqualified for their jobs. Many did not have the
minimum educational qualifications required for their jobs and were not subjected to competitive
selection. Their high opportunity costs meant that they were more likely to comply with corrupt
demands from headquarters.
10 Interviewees consistently report that many Arid Lands staff at all levels were implicated in
embezzlement, but they also note that not everyone participated or benefitted. Some staff and
former staff were deeply troubled by what they knew was going on. Some chose to leave if they
could find reasonable employment elsewhere. Others stayed but paid a steep price in terms of
career advancement as a consequence of refusing to participate in the fraud. Many more were
unwilling partners who were asked to do things like sign duplicate travel receipts even though
they did not receive double reimbursement. The INT audit also found evidence of such double
dipping. Receipts for the same activities were being submitted to both the projects and the UN
and even other World Bank projects that were also collaborating with the project (World Bank
Integrity Vice Presidency, 2011).
37
A second design flaw resulted from granting the district officers nearly complete discretion
over the selection of villages receiving projects.11 Project guidelines specified that selected
villages would choose their own committees to manage the finances and monitor the project. In
reality, the district officers were often approached by savvy villagers who agreed to collaborate
with the officers in exchange for negotiated kickbacks from the village project (see Ensminger
(2017) for details). As co-conspirators with the district offices, the village oversight committees
aligned with the district staff against the interests of their own villagers. Many alternative
designs would have improved upon this one. For example, the more successful Indonesian KDP
project employed a competitive village selection model for projects (Chavis, 2010).
The design flaws in staffing and village selection contributed to many of the monitoring
issues in the project. Village committees were tasked with monitoring their own projects,
together with district project staff, but as we have noted, they were collaborating in the fraud.
Villagers themselves faced information asymmetries and incentives that hindered
11 In theory, there was a district steering committee (DSG) that also supervised project selection
and project monitoring. Civil works projects were also supervised by government engineers who
had to sign off on the plans and the work progress. According sources, including members of the
DSG and contractors from many different districts, both the DSG and the government offices
that signed off on projects were compromised and ineffective (see Ensminger (2017) for more
details).
38
whistleblowing.12 First, it was not in the interest of either the district officers or the village
committee to share the project specifications with the community. Without knowing what they
were supposed to be receiving, it was impossible for villagers to know if funds were being
misused. Second, the villagers were easily intimidated. The intended beneficiaries of these
micro projects were truly the world’s poorest citizens living on less than $2 per day. They were
grateful for any benefits from the project. It took years for individual villagers to begin to
protest, but given the extent of complicity in the project, who were they going to complain to?
Villagers who did complain were often bought off cheaply. If they persisted, the village was
threatened that it would be cut-off from all future projects. This was the result of vesting
monopoly discretion for the allocation of projects with the district offices; their leverage over
villagers was all but absolute.
Given all of the alleged embezzlement in this project, it is worth exploring how the World
Bank’s internal supervision processes failed to catch the ongoing fraud. Numerous Kenyan
government and World Bank offices signed off on regular financial reviews. A task team leader
12 Senior staff in the Indonesian KDP project deployed several mechanisms to encourage both
internal and external criticism of the project’s performance, including on corruption. They
designed an innovative mechanism for independent journalists to investigate and report on
corruption in the project (Guggenheim, 2006) (Wong, 2003); academics were also invited to
research and report on corruption (Olken B. A., 2007; Olken B. A., 2009). Finally, they
commissioned a number of World Bank reports on corruption that were made public
(Woodhouse, 2002) (Woodhouse, 2012). They used this research to inform their experimentation
with different mechanisms of project design. This contrasted markedly from the secretive
climate that interviewees described for the Arid Lands.
39
(TTL) from the World Bank was assigned to overall supervision, and the TTL brought in regular
oversight missions of oversees experts. The Kenya National Audit Office conducted annual
audits of all of the project’s offices, and the TTL also commissioned special audits from the
Nairobi branch of international audit firms for subsets of districts.
One explanation for poor World Bank supervision is misaligned incentives. World Bank
financial management staff, task team leaders, and outside missions are resource and time
constrained. World Bank project managers themselves perceive that the Bank does not create
the right incentives for them to engage in monitoring and evaluation (Berkman, 2008)(Mansuri
& Rao, 2013, p. 302). To the extent that task team leaders are rewarded by the size of their
project portfolios, finding evidence of large-scale fraud in one’s own projects is not likely to be a
career-advancing move. Conflicts of interest were also present in the task team leader’s
management of the outside experts brought in to provide periodic oversight. Many staff on this
project commented that the same experts appeared time and again to oversee the project; they
felt that fresh eyes that were less friendly with project management would have been more likely
to see the problems. Outside experts may also face conflicts of interest, including real or
perceived pressure to give positive evaluations in order to continue their relationship with the
task team leader and to stay in good graces with the World Bank. These conflicts of interest are
analogous to those between firms and outside auditors.
Both standard internal and external auditing of this project failed to catch most of the kinds
of abuses flagged by the World Bank’s forensic audit. Numerous interviewees described the
friendly relations enjoyed between the project staff and the regular Kenyan auditors who visited
headquarters and the districts annually. As described, there was more socializing than
examination of accounts, and the same auditors returned year after year. The project officers
40
were less worried about professional or legal ramifications if the auditors found issues than they
were that this would increase the leverage that auditors had over the office to extract a higher
bribe. A particularly compelling report about the bribing of auditors came from a petrol station
owner in a district capital: he explained that he always knew ahead of time when the project’s
auditors were about to arrive in town. He did business with the project and had large cash
holdings. Just before the auditors arrived, the project staff would visit him to collect 200,000
Kenyan shillings (about $3000) to pay the auditors. These funds were repaid in over-invoiced
petrol. The World Bank task team leader also ordered periodic audits of select districts from
international firms in Nairobi. According to interviewees who were closely involved, those
audits were just as unsatisfactory as the ones run by the Kenyan National Audit Office.
The qualitative investigation of this project points to many ways in which project design
contributed to fraud risk and the reasons why standard World Bank supervision failed to catch it.
What happened with the findings of the forensic audit speaks volumes about the enduring
systemic nature of corruption in Kenyan institutions. Upon completion of their audit, the
Integrity Vice-Presidency of the World Bank filed their report (World Bank Integrity Vice
Presidency, 2011), conducted a joint exercise with the Kenya National Audit Office to validate
their results, and also made that report public (World Bank Integrity Vice Presidency and
Internal Audit Department, Treasury, Government of Kenya, 2011). In a highly unusual action,
the Kenyan Government was required to repay $3.8 million USD of the inappropriately
accounted funds from their sample. The World Bank closed the project, also unusual for a
project that already had a board date set for its 5 year renewal. INT then submitted their
supporting audit evidence to the Kenyan Anti-Corruption Agency (KACC) for follow-up
investigation. To the best of our knowledge, no further investigation was undertaken and no one
41
from the project was indicted or prosecuted. Most senior staff are still in their posts and several
of the most senior were immediately promoted to higher level Presidental appointments.
6. Conclusion
We present new methods to detect data tampering and demonstrate their use on data from a
World Bank project in Kenya. In circumstances where auditing is difficult, high levels of fraud
can persist, driven by the information asymmetry between those administering money and those
providing the funds. Our statistical tests rely on expenditure reports to find patterns consistent
with profitable misreporting and attempts to evade detection. An independent forensic audit of
the same project correlates with our digit analysis results, lending external validity to the method
and the substantive findings. This approach helps close the gap of information that allows such
misreporting.
Our method involves new statistical tests that will be broadly applicable to the study of
misreported data. Our new test of overuse of high digits in valuable digit places relates aberrant
digit patterns to the monetary value of the digit place and uncovers patterns consistent with
profitable deviations as well as attempts to evade detection. This test has the potential to
differentiate intent to defraud from benign error. Another of our new tests, employing Benford’s
Law to analyze multiple digit places simultaneously, provides a statistically powerful test
applicable to even relatively small datasets. The ability to work on smaller sample sizes allows
more multi-dimensional analyses, such as our comparisons across districts, years, and sectors.
The substantive findings of this project attest to the need for, and importance of, better
measures and identification of fraud. The forensic auditors determined that 66% of the district
transactions they examined were suspected fraudulent or questionable. Similarly, the districts we
42
examined fail between 3 and 8 of the 10 digit tests that capture different dimensions of data
manipulation. We demonstrate that more suspicious patterns emerge in a presidential election
year, consistent with allegations that World Bank funds were illegally diverted to fund political
campaigns. Tools such as ours that help facilitate monitoring are critical to help prevent similar
issues in the future.
This method works even when traditional forms of monitoring are challenging or expensive,
as is often the case in the developing world. Our method could have been used to conduct real
time monitoring of this project to reduce potential fraud, or in the forensic audit of this project to
identify and target the worst offending districts, 3 of which were missed in the World Bank audit
sample. In addition, it requires minimal cooperation from those inside the organization or
government, who may have an incentive to impede an investigation.13 Auditors and monitors,
particularly those operating in contexts with weak oversight and institutional barriers to fraud,
will benefit from the use of this method.
13 Readers may be concerned that publication of these methods will provide potential fraudsters
with the means to beat the monitors. They need not worry. Engineering a Benford-conforming
dataset is a more challenging statistical exercise than is ensuring that digits are uniformly
distributed. It would also require centralization across an organization, and matching of all
supporting documentation, such as coordination of date-stamped receipts, cashbooks, vehicle
logs, cancelled checks, and bank statements. Furthermore, each individual instructed to fabricate
data would still face the same incentive to self-deal, which would undercut efforts to produce
aggregate results consistent with Benford’s Law. Such coordination would also expose
leadership to high risk of detection.
43
We foresee the use of our method in a variety of new applications. Firms that invest in
developing markets may choose to use our method to conduct their own form of monitoring.
This method can also be used to test the authenticity of data supplied by governments in
compliance with international environmental and financial agreements, or to verify pollution and
labor data supplied for treaty compliance. In the modern world, where big data proliferates,
stronger tools to analyze these data for signs of strategic and profitable manipulation are
necessary.
44
Bibliography Amiram, D., Bozanic, Z., & Rouen, E. (2015). Financial statement errors: Evidence from the distributional
properties of financial statement numbers. Review of Accounting Studies, 20, 1540-1593. doi:10.2139/ssrn.2374093
Barabesi, L., Cerasa, A., Cerioli, A., & Perrotta, D. (2018, April). Goodness-of-Fit Testing for the Newcomb-Benford Law With Application to the Detection of Customs Fraud . Journal of Business and Economic Statistics, 36(2), 346-358.
Beber, B., & Scacco, A. (2012). What the numbers say: A digit-based test for election fraud. Political Analysis, 20, 211-234. doi:10.1093/pan/mps003
Becker, G. S. (1968). Crime and punishment: An economic approach. Journal of Political Economy, 76, 169-217. doi:10.2307/1830482
Boland, P., & Hutchinson, K. (2000). Student selection of random digits. The Statistician, 49, 519-529. Boyle, J. (1994). An application of Fourier series to the most significant digit problem. The American Mathematical
Monthly, 101, 879-886. Bredl, S., Winker, P., & Kötschau, K. (2012). A statistical approach to detect interviewer falsification of survey
data. Survey Methodology, 38, 1-10. Cerioli, A., Barabesi, L., Cerasa, A., Menegatti, M., & Perrotta, D. (2019, January 2). Newcomb–Benford law and
the detection of frauds in international trade. Proceedings of the National Academies of Science, 116(1), 106-115.
Chapanis, A. (1995). Human production of "random" numbers. Perceptual and Motor Skills, 81, 1347-1363. Chavis, L. (2010, November). Decentralizing development. Allocating public goods via competition.”. Journal of
Development Economics 93 (2): 264-74., 93(2), 264-274. Cho, W. K., & Gaines, B. J. (2012). Breaking the (Benford) Law: Statistical Fraud Detection in Campaign Finance.
The American Statistician, 61, 218-223. Claessens, S., Feijen, E., & Laeven, L. (2008). Political connections and preferential access to finance: The role of
campaign contributions. Journal of Financial Economics, 88(3), 554-580. Debowski, L. (2003). Benford's Law Number Generator. Polish Academy of Sciences, Institute of Computer
Sciences. Deckert, J., Myagkov, M., & Ordeshook, P. (2011). Benford's Law and the detection of election fraud. Political
Analysis, 19, 245-268. doi:10.1093/pan/mpr014 DeFond, M., & Zhang, J. (2014, November-December). A review of archival auditing research. Journal of
Accounting and Economics, 275-326. Diekmann, A. (2007). Not the first digit! Using Benford's Law to detect fraudulent scientific data. Journal of
Applied Statistics, 34, 321-329. Du, K., Huddart, S., Xue, L., & Zhang, Y. (2020, April-May). Using a Hidden Markov Model to Measure Earnings
Quality. Journal of Accounting and Economics, 69(2-3). Duflo, E., Greenstone, M., Pande, R., & Ryan, N. (2013). Truth-telling by third-party auditors and the response of
polluting firms: Experimental evidence from India. The Quarterly Journal of Economics, 128, 1499-1545. doi:10.1093/qje/qjt024
Durtschi, C., Hillison, W., & Pacini, C. (2004). The effective use of Benford's Law to assist in detecting fraud in accounting data. Journal of Forensic Accounting, V, 17-34.
Ensminger, J. (2017). Corruption in Community Driven Development: A Kenyan Case Study with Insights from Indonesia. U-4 Anti-corruption Resource Centre. Bergen, Norway: Chr. Michelsen Institute.
Fang, H., & Gong, Q. (2017). Detecting Potential Overbilling in Medicare Reimbursement via Hours Worked. American Economic Review , 107(2), 562–591.
Gibson, C. C., & Long, J. D. (2009, September). The presidential and parliamentary elections in Kenya, December 2007. Electoral Studies, 28(3), 497-502.
Goldman, A., & Barlev , B. (1974, Oct). The Auditor-Firm Conflict of Interests: Its Implications for Independence . The Accounting Review , 49(4).
Guggenheim, S. (2006). Crises and Contradictions: Understanding the Origins of a Community Development Project in Indonesia. In A. Bebbington, M. Woolcock, S. Guggenheim, & E. Olson, The Search for
45
Empowerment: Social Capital as Idea and Practice at the World Bank (pp. 111-44). Bloomfield, CT: Kumarian Press.
Guggenheim, S., & Wong, S. (2005). Community-Driven Development: Decentralization’s accountability challenge. In East Asia decentralizes: Making local government work (pp. 253-67). World Bank: Washington, DC.
Hill, T. P. (1995). A statistical derivation of the significant-digit law. Statistical Science, 10, 354-363. doi:10.1214/ss/1177009869
Judge, G., & Schechter, L. (2009). Detecting problems in survey data using Benford’s Law. Journal of Human Resources, 44, 1-24.
Mack, V., & Stoetzer, L. (2019, April). Election fraud, digit tests and how humans fabricate vote counts - An experimental approach. Electoral Studies, 58, 31-47.
Mansuri, G., & Rao, V. (2013). Localizing Development: Does Participation Work? Washington, DC: World Bank. Mebane, W. (2008). Election Forensics: The Second-Digit Benford’s Law Test and Recent American Presidential
Elections. In R. Alvarez, T. Hall, & S. Hyde, Election Fraud: Detecting and Deterring Electoral Manipulation. Brookings Institution Press. Retrieved from http://www.jstor.org/stable/10.7864/j.ctt6wpf99
Mebane, W. (2011). Comment on "Benford's Law and the Detection of Election Fraud". Political Analysis(19), 269-272.
Michalski, T., & Stoltz, G. (2013). Do Countries Falsify Economic Data Strategically? Some Evidence That They Might. The Review of Economics and Statistics, 95, 591-616.
Nagi, M. H., Stockwell, E. G., & Snavley, L. M. (1973). Digit preference and avoidance in the age statistics of some recent African censuses: Some patterns and correlates. International Statistical Review, 41, 165-174. doi:10.2307/1402833
Nigrini, M. (2012). Benford's Law. Hoboken, New, Jersey: John Wiley & Sons, Inc. Nigrini, M., & Mittermaier, L. (1997). The use of Benford's Law as an aid in analytic procedures. Auditing: A
Journal of Practice and Theory, 16. Olken, B. A. (2007). Monitoring corruption: Evidence from a field experiment in Indonesia. Journal of Political
Economy, 115, 200-249. doi:10.1086/517935 Olken, B. A. (2009). Corruption Perceptions vs. Corruption Reality. Journal of Public Economics, 93(7-8), 950-64. Perols, J. (2011, May). Financial Statement Fraud Detection: An Analysis of Statistical and Machine Learning
Algorithms. Auditing: A Journal of Practice & Theory, 30(2), 19-50. Perols, J., Bowen, R., Zimmermann, C., & Samba, B. (2017). Finding Needles in a Haystack: Using Data Analytics
to Improve Fraud Prediction . The Accounting Review, 92(2), 221-245. Purda, L., & Skillicorn, D. (2015, Fall). Accounting Variables, Deception, and a Bag of Words: Assessing the Tools
of Fraud Detection. Contemporary Accounting Research, 32(3), 1193-1223. Rath, G. J. (1966). Randomization by humans. The American Journal of Psychology, 79, 97-103. Republic of Kenya. (2006). Arid Lands Resource Management Project (Phase II) Tana River District Progress
Report 2003-2006. Schräpler, J.-P. (2011). Benford's Law as an instrument for fraud detection in surveys using the data of the Socio-
Economic Panel (SOEP). Journal of Economics and Statistics, 231, 685-718. doi:10.2139/ssrn.1562574 Stefanovic, M. (2018). Former Manager of World Bank's External Investigations Unit, Integrity Vice Presidency. (J.
Ensminger, Interviewer) Transparency International. (2009). Corruption Perceptions Index. Retrieved August 10, 2020, from
https://www.transparency.org/en/cpi/2009# U.S. Securities and Exchange Commission. (2020, April 21). Emerging Market Investments Entail Significant
Disclosure, Financial Reporting and Other Risks; Remedies are Limited. Retrieved July 30, 2020, from SEC Public Statements: https://www.sec.gov/news/public-statement/emerging-market-investments-disclosure-reporting
UN Economic and Social Council Economic Comission for Africa. (1986). Adjustment of Errors in the Reported Age-Sex Data from African Censuses . Joint Conference of African Planners, Statisticians and Demographers. Addis Ababa, Ethiopia.
Wong, S. (2003). Indonesia Kecamatan Development Program. Building a monitoring and evaluation system for a large-scale community-driven development program. Washington, DC: World Bank.
Woodhouse, A. (2002). Village corruption in Indonesia: Fighting corruption in the World Bank’s Kecamatan Development Program.”. Washington, D.C.: World Bank.
Woodhouse, A. (2012). Governance Review of PNPM Rural, Community level analysis. Jakarta, Indonesia: World Bank Indonesia.
46
World Bank. (2003). Project Appraisal Document on a Proposed Credit in the Amount of Sdr 43.6 Million (US $60m Equivalent) to the Republic ofKenya for the Arid Lands Resource Management Project Phase Two. C.D. Eastern and Southern African Rural Development Operations, Africa Region, 31.
World Bank. (2007). Project Appraisal Document on a Proposed Credit in the Amount of Sdr 57.8 Million (US $86.0 Million Equivalent) to the Goverment of Kenya for a Western Kenya Community Driven Development and Flood Mitigation Project.
World Bank Integrity Vice Presidency. (2011). Forensic Audit Report: Arid Lands Resource Management Project -- Phase II -- Redacted Report. World Bank.
World Bank Integrity Vice Presidency and Internal Audit Department, Treasury, Government of Kenya. (2011). Redacted Joint Review to Quantify Ineligible Expenditures for the Seven Districts and Headquarters of the Arid Lands Resource Management Program Phase II (ALRMP II) for FY07 & FY08. Washington, DC: World Bank.
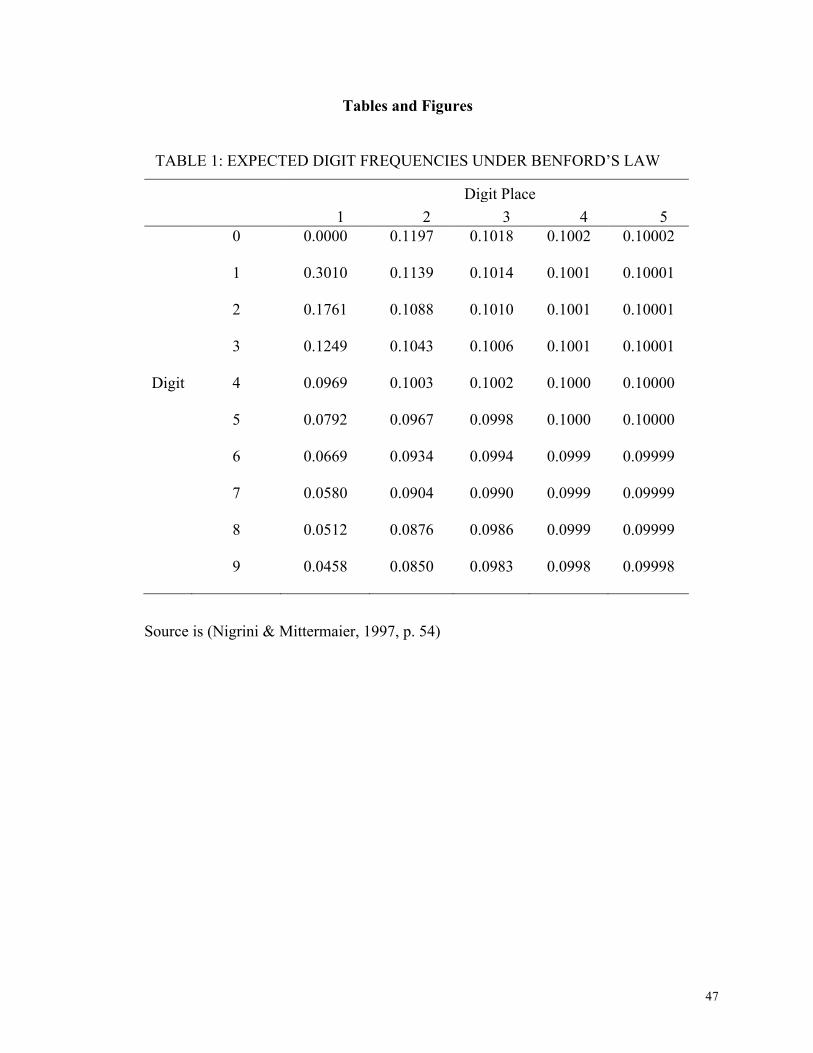
47
Tables and Figures
TABLE 1: EXPECTED DIGIT FREQUENCIES UNDER BENFORD’S LAW
Digit Place
1 2 3 4 5 0 0.0000 0.1197 0.1018 0.1002 0.10002
1 0.3010 0.1139 0.1014 0.1001 0.10001
2 0.1761 0.1088 0.1010 0.1001 0.10001
3 0.1249 0.1043 0.1006 0.1001 0.10001
Digit 4 0.0969 0.1003 0.1002 0.1000 0.10000
5 0.0792 0.0967 0.0998 0.1000 0.10000
6 0.0669 0.0934 0.0994 0.0999 0.09999
7 0.0580 0.0904 0.0990 0.0999 0.09999
8 0.0512 0.0876 0.0986 0.0999 0.09999
9 0.0458 0.0850 0.0983 0.0998 0.09998
Source is (Nigrini & Mittermaier, 1997, p. 54)
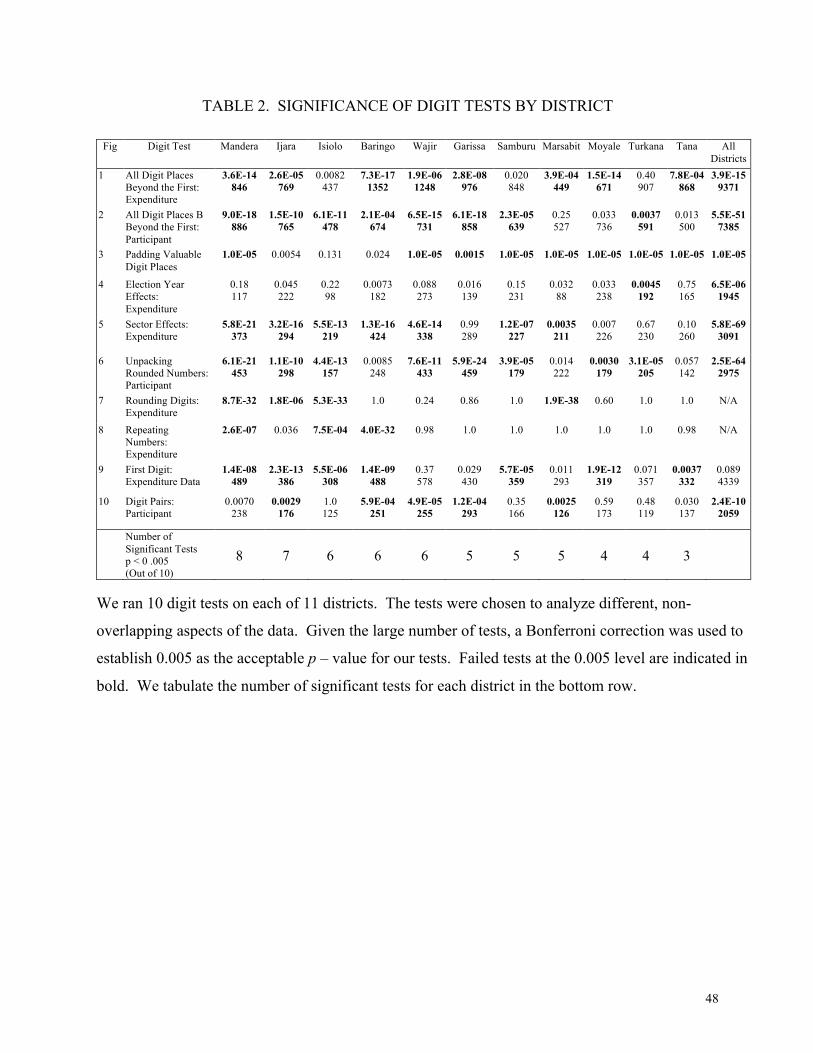
48
TABLE 2. SIGNIFICANCE OF DIGIT TESTS BY DISTRICT
Fig Digit Test Mandera Ijara Isiolo Baringo Wajir Garissa Samburu Marsabit Moyale Turkana Tana All Districts
1 All Digit Places Beyond the First: Expenditure
3.6E-14 846
2.6E-05 769
0.0082 437
7.3E-17 1352
1.9E-06 1248
2.8E-08 976
0.020 848
3.9E-04 449
1.5E-14 671
0.40 907
7.8E-04 868
3.9E-15 9371
2 All Digit Places B Beyond the First: Participant
9.0E-18 886
1.5E-10 765
6.1E-11 478
2.1E-04 674
6.5E-15 731
6.1E-18 858
2.3E-05 639
0.25 527
0.033 736
0.0037 591
0.013 500
5.5E-51 7385
3 Padding Valuable Digit Places
1.0E-05 0.0054 0.131 0.024 1.0E-05 0.0015 1.0E-05 1.0E-05 1.0E-05 1.0E-05 1.0E-05 1.0E-05
4 Election Year Effects: Expenditure
0.18 117
0.045 222
0.22 98
0.0073 182
0.088 273
0.016 139
0.15 231
0.032 88
0.033 238
0.0045 192
0.75 165
6.5E-06 1945
5 Sector Effects: Expenditure
5.8E-21 373
3.2E-16 294
5.5E-13 219
1.3E-16 424
4.6E-14 338
0.99 289
1.2E-07 227
0.0035 211
0.007 226
0.67 230
0.10 260
5.8E-69 3091
6 Unpacking
Rounded Numbers: Participant
6.1E-21 453
1.1E-10 298
4.4E-13 157
0.0085 248
7.6E-11 433
5.9E-24 459
3.9E-05 179
0.014 222
0.0030 179
3.1E-05 205
0.057 142
2.5E-64 2975
7 Rounding Digits: Expenditure
8.7E-32 1.8E-06 5.3E-33 1.0 0.24 0.86 1.0 1.9E-38 0.60 1.0 1.0 N/A
8 Repeating Numbers: Expenditure
2.6E-07 0.036 7.5E-04 4.0E-32 0.98 1.0 1.0 1.0 1.0 1.0 0.98 N/A
9 First Digit: Expenditure Data
1.4E-08 489
2.3E-13 386
5.5E-06 308
1.4E-09 488
0.37 578
0.029 430
5.7E-05 359
0.011 293
1.9E-12 319
0.071 357
0.0037 332
0.089 4339
10 Digit Pairs: Participant
0.0070 238
0.0029 176
1.0 125
5.9E-04 251
4.9E-05 255
1.2E-04 293
0.35 166
0.0025 126
0.59 173
0.48 119
0.030 137
2.4E-10 2059
Number of Significant Tests p < 0 .005 (Out of 10)
8
7
6
6
6
5
5
5
4
4
3
We ran 10 digit tests on each of 11 districts. The tests were chosen to analyze different, non-
overlapping aspects of the data. Given the large number of tests, a Bonferroni correction was used to
establish 0.005 as the acceptable p – value for our tests. Failed tests at the 0.005 level are indicated in
bold. We tabulate the number of significant tests for each district in the bottom row.
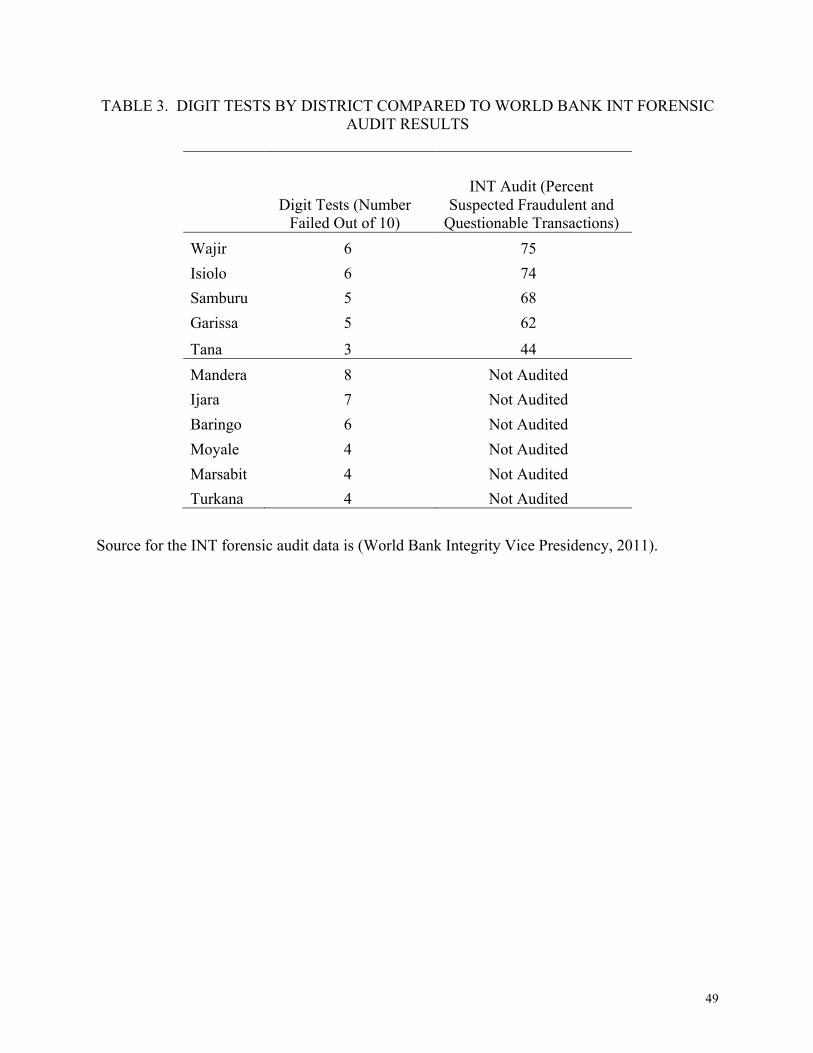
49
TABLE 3. DIGIT TESTS BY DISTRICT COMPARED TO WORLD BANK INT FORENSIC AUDIT RESULTS
ict Digit Tests (Number
Failed Out of 10)
INT Audit (Percent Suspected Fraudulent and
Questionable Transactions) Wajir 6 75 Isiolo 6 74 Samburu 5 68 Garissa 5 62
Tana 3 44 Mandera 8 Not Audited Ijara 7 Not Audited Baringo 6 Not Audited Moyale 4 Not Audited Marsabit 4 Not Audited Turkana 4 Not Audited
Source for the INT forensic audit data is (World Bank Integrity Vice Presidency, 2011).
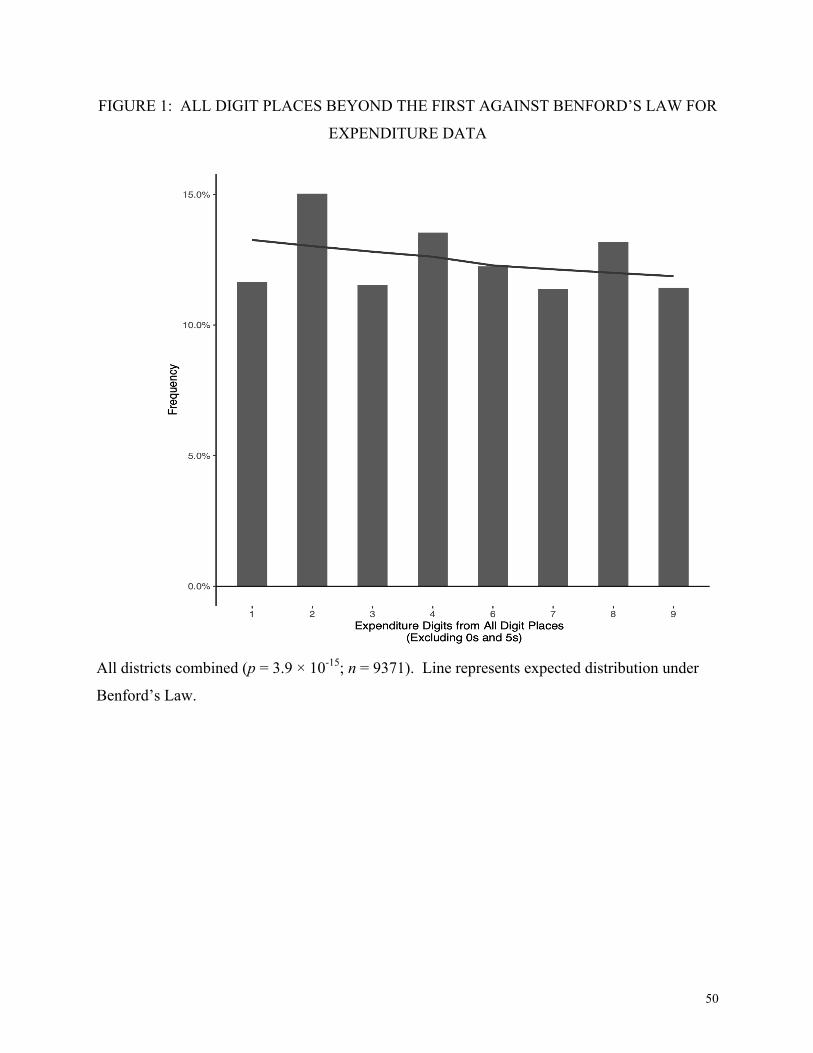
50
FIGURE 1: ALL DIGIT PLACES BEYOND THE FIRST AGAINST BENFORD’S LAW FOR
EXPENDITURE DATA
All districts combined (p = 3.9 × 10⁻¹⁵; n = 9371). Line represents expected distribution under
Benford’s Law.
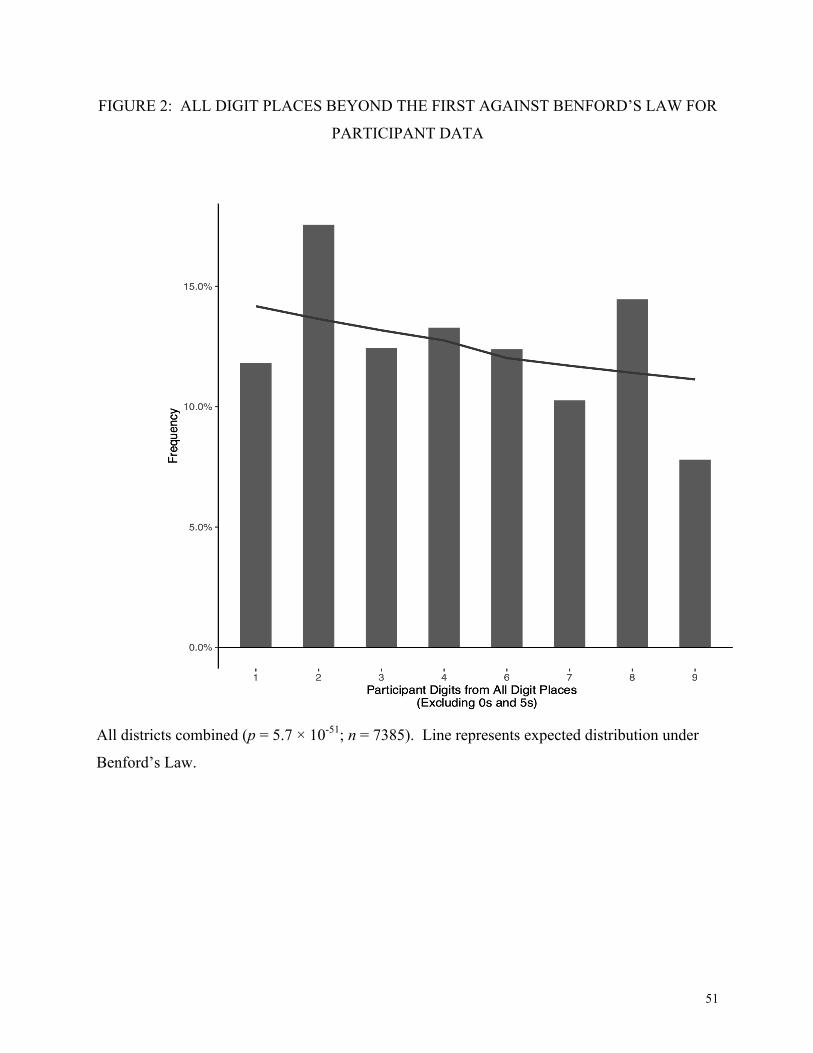
51
FIGURE 2: ALL DIGIT PLACES BEYOND THE FIRST AGAINST BENFORD’S LAW FOR
PARTICIPANT DATA
All districts combined (p = 5.7 × 10-51; n = 7385). Line represents expected distribution under
Benford’s Law.
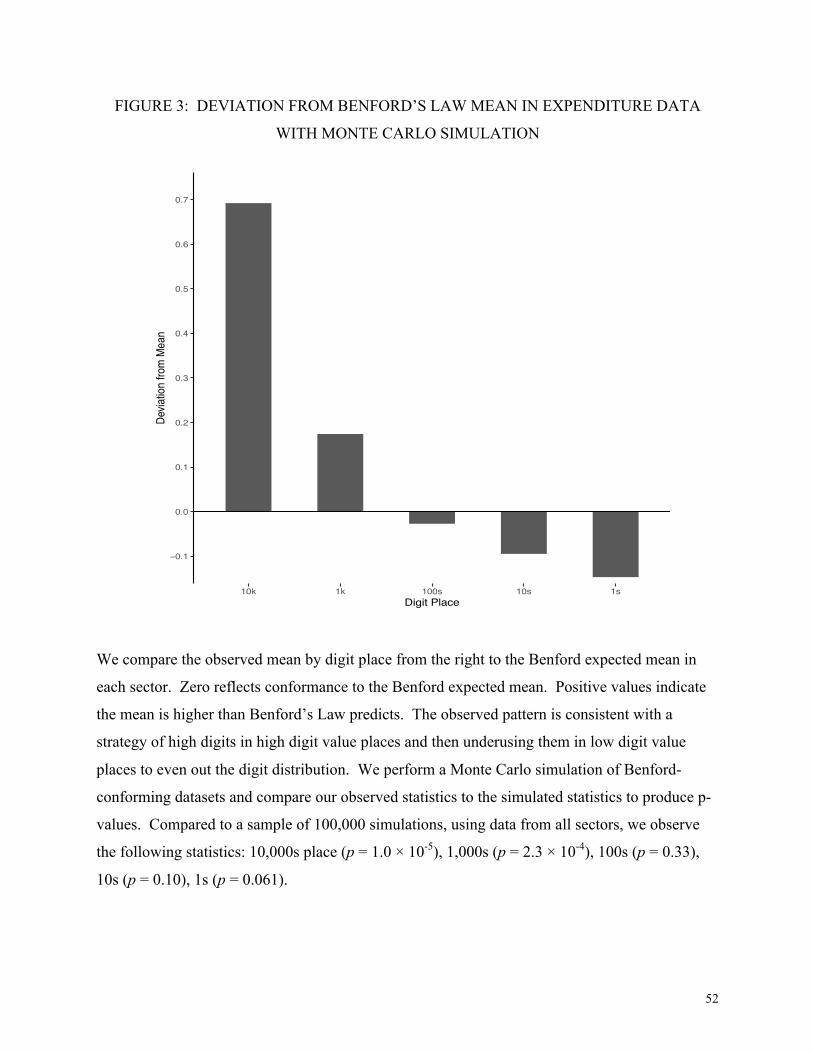
52
FIGURE 3: DEVIATION FROM BENFORD’S LAW MEAN IN EXPENDITURE DATA
WITH MONTE CARLO SIMULATION
We compare the observed mean by digit place from the right to the Benford expected mean in
each sector. Zero reflects conformance to the Benford expected mean. Positive values indicate
the mean is higher than Benford’s Law predicts. The observed pattern is consistent with a
strategy of high digits in high digit value places and then underusing them in low digit value
places to even out the digit distribution. We perform a Monte Carlo simulation of Benford-
conforming datasets and compare our observed statistics to the simulated statistics to produce p-
values. Compared to a sample of 100,000 simulations, using data from all sectors, we observe
the following statistics: 10,000s place (p = 1.0 × 10⁻⁵), 1,000s (p = 2.3 × 10⁻⁴), 100s (p = 0.33),
10s (p = 0.10), 1s (p = 0.061).
−0.1
0.0
0.1
0.2
0.3
0.4
0.5
0.6
0.7
10k 1k 100s 10s 1sDigit Place
Devia
tion
from
Mea
n
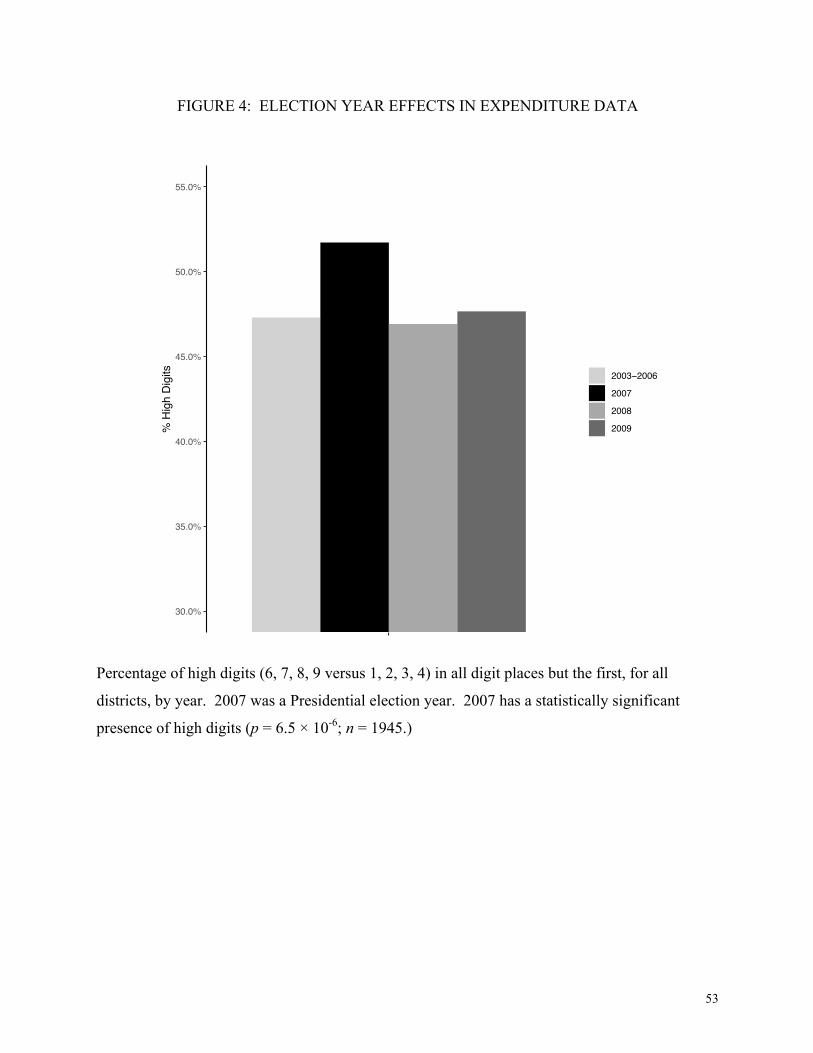
53
FIGURE 4: ELECTION YEAR EFFECTS IN EXPENDITURE DATA
Percentage of high digits (6, 7, 8, 9 versus 1, 2, 3, 4) in all digit places but the first, for all
districts, by year. 2007 was a Presidential election year. 2007 has a statistically significant
presence of high digits (p = 6.5 × 10⁻⁶; n = 1945.)
30.0%
35.0%
40.0%
45.0%
50.0%
55.0%
% H
igh
Dig
its 2003−2006
2007
2008
2009
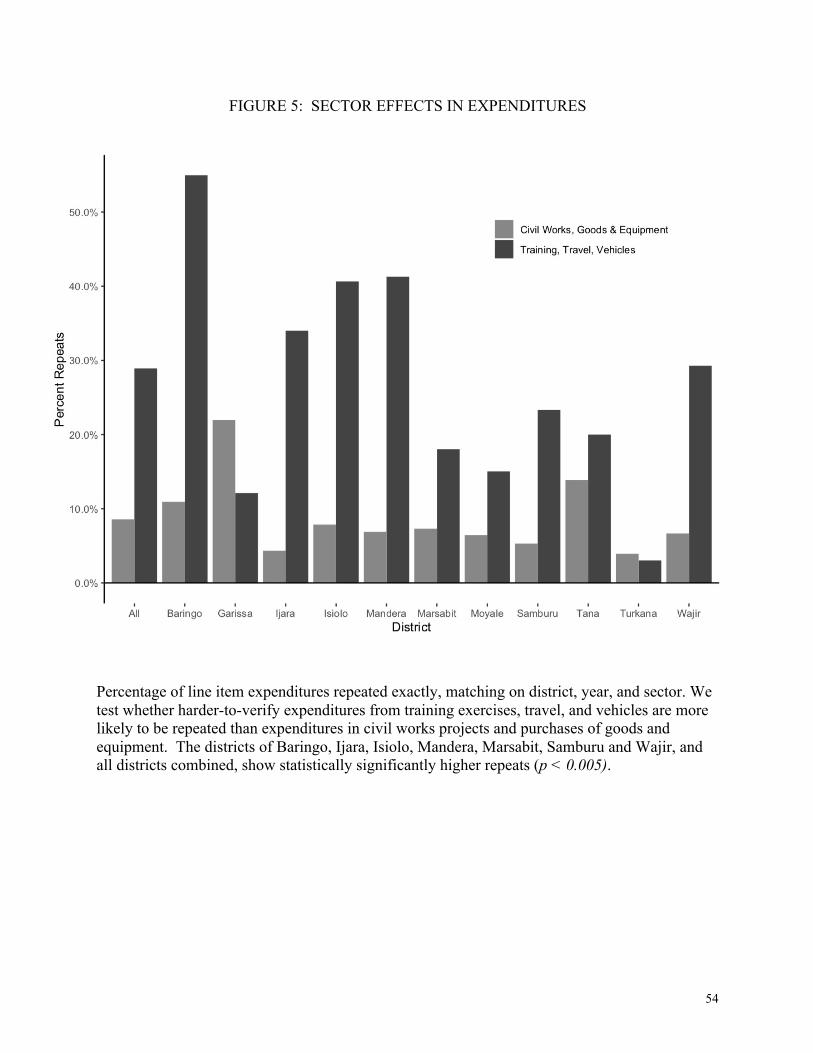
54
FIGURE 5: SECTOR EFFECTS IN EXPENDITURES
Percentage of line item expenditures repeated exactly, matching on district, year, and sector. We test whether harder-to-verify expenditures from training exercises, travel, and vehicles are more likely to be repeated than expenditures in civil works projects and purchases of goods and equipment. The districts of Baringo, Ijara, Isiolo, Mandera, Marsabit, Samburu and Wajir, and all districts combined, show statistically significantly higher repeats (p < 0.005).
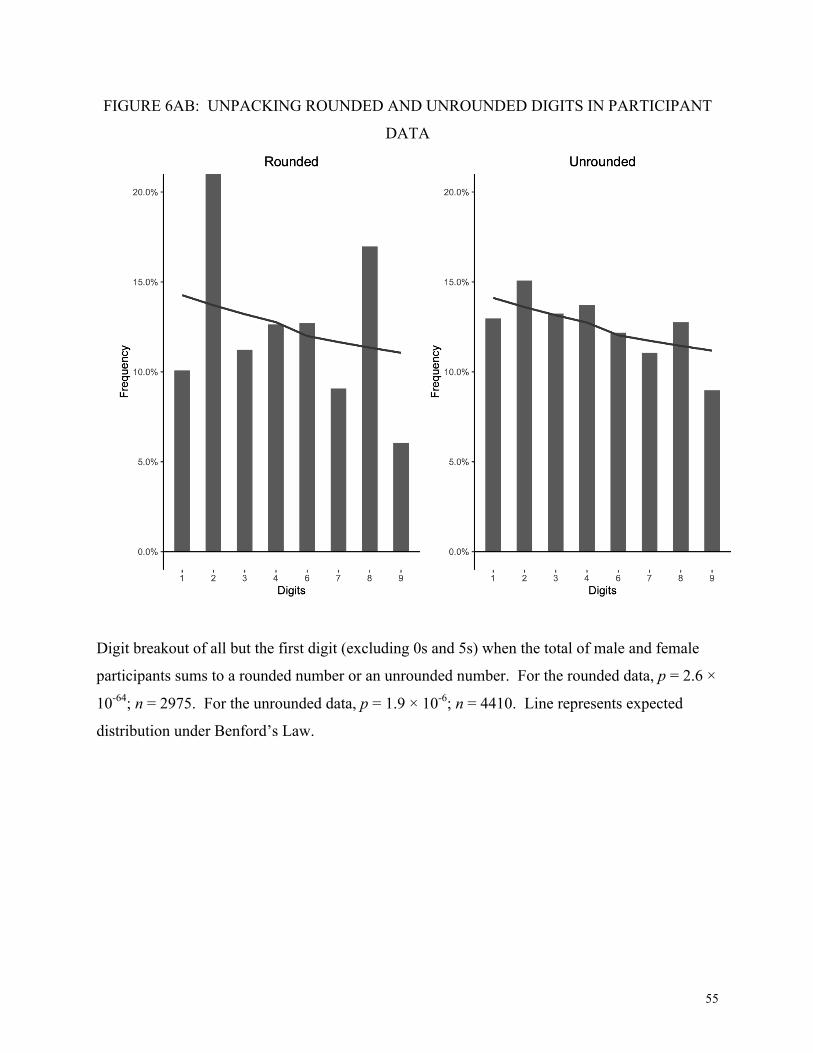
55
FIGURE 6AB: UNPACKING ROUNDED AND UNROUNDED DIGITS IN PARTICIPANT
DATA
Digit breakout of all but the first digit (excluding 0s and 5s) when the total of male and female
participants sums to a rounded number or an unrounded number. For the rounded data, p = 2.6 ×
10-64; n = 2975. For the unrounded data, p = 1.9 × 10⁻⁶; n = 4410. Line represents expected
distribution under Benford’s Law.
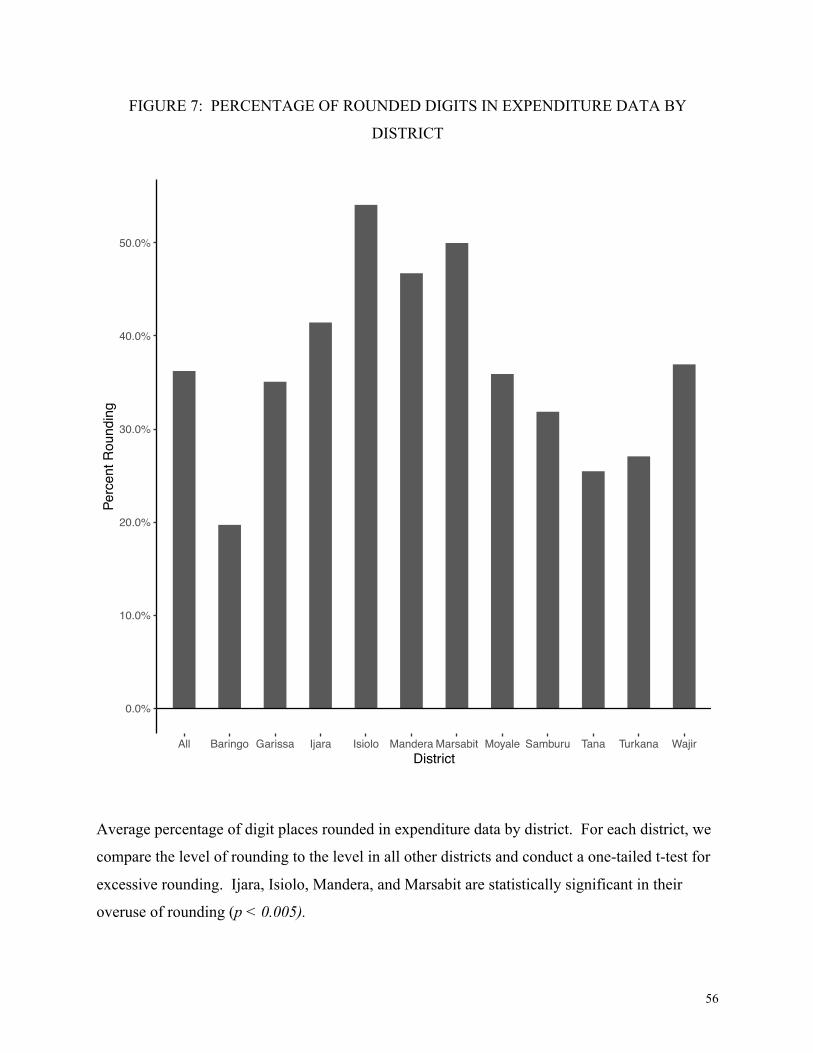
56
FIGURE 7: PERCENTAGE OF ROUNDED DIGITS IN EXPENDITURE DATA BY
DISTRICT
Average percentage of digit places rounded in expenditure data by district. For each district, we
compare the level of rounding to the level in all other districts and conduct a one-tailed t-test for
excessive rounding. Ijara, Isiolo, Mandera, and Marsabit are statistically significant in their
overuse of rounding (p < 0.005).
0.0%
10.0%
20.0%
30.0%
40.0%
50.0%
All Baringo Garissa Ijara Isiolo Mandera Marsabit Moyale Samburu Tana Turkana WajirDistrict
Perc
ent R
ound
ing
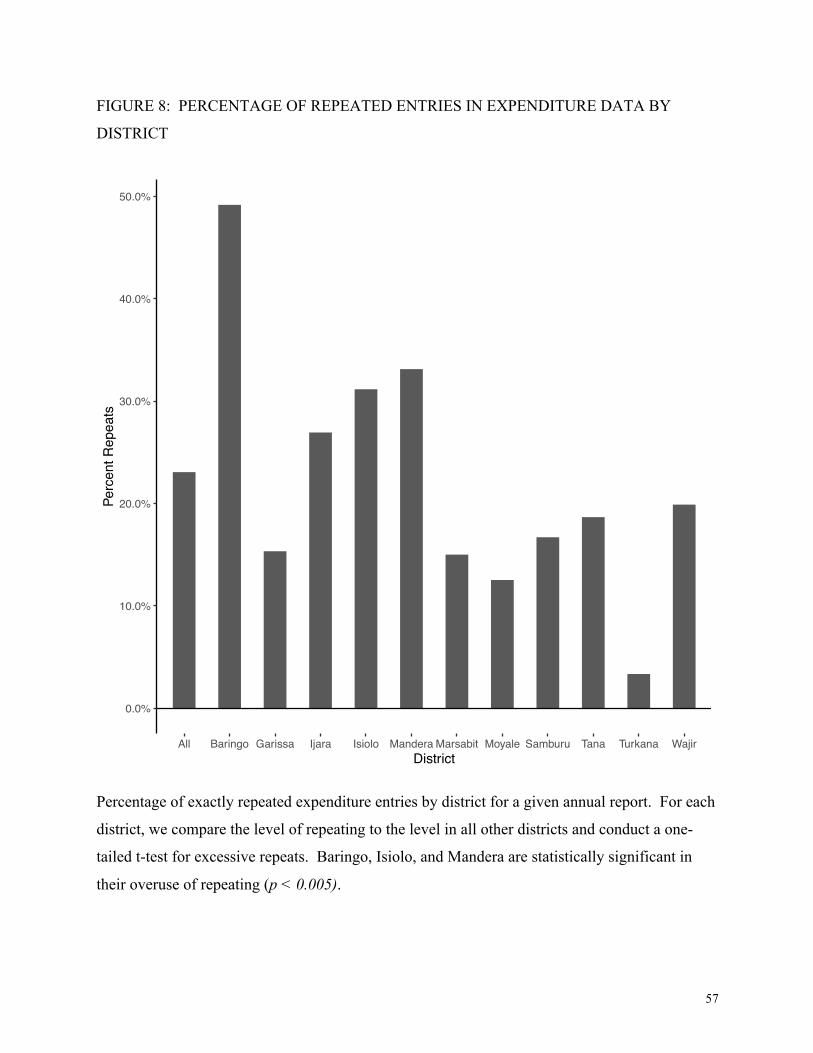
57
FIGURE 8: PERCENTAGE OF REPEATED ENTRIES IN EXPENDITURE DATA BY
DISTRICT
Percentage of exactly repeated expenditure entries by district for a given annual report. For each
district, we compare the level of repeating to the level in all other districts and conduct a one-
tailed t-test for excessive repeats. Baringo, Isiolo, and Mandera are statistically significant in
their overuse of repeating (p < 0.005).
0.0%
10.0%
20.0%
30.0%
40.0%
50.0%
All Baringo Garissa Ijara Isiolo Mandera Marsabit Moyale Samburu Tana Turkana WajirDistrict
Perc
ent R
epea
ts
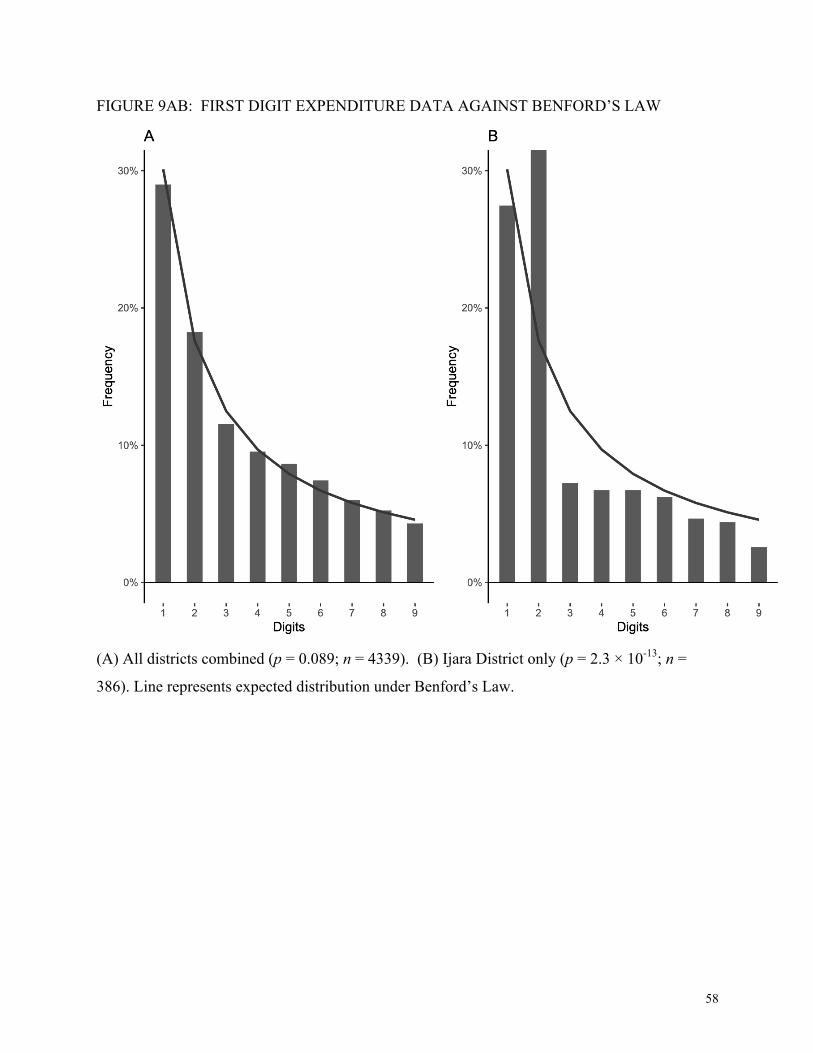
58
FIGURE 9AB: FIRST DIGIT EXPENDITURE DATA AGAINST BENFORD’S LAW
(A) All districts combined (p = 0.089; n = 4339). (B) Ijara District only (p = 2.3 × 10⁻¹³; n =
386). Line represents expected distribution under Benford’s Law.
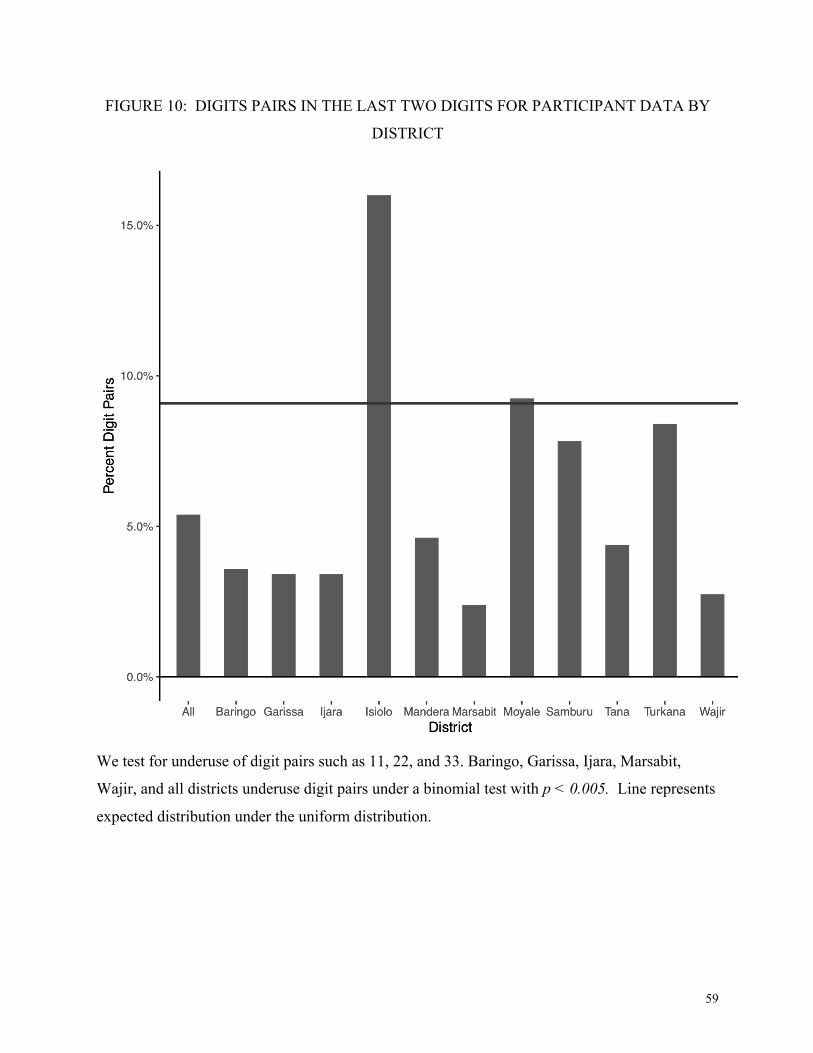
59
FIGURE 10: DIGITS PAIRS IN THE LAST TWO DIGITS FOR PARTICIPANT DATA BY
DISTRICT
We test for underuse of digit pairs such as 11, 22, and 33. Baringo, Garissa, Ijara, Marsabit,
Wajir, and all districts underuse digit pairs under a binomial test with p < 0.005. Line represents
expected distribution under the uniform distribution.
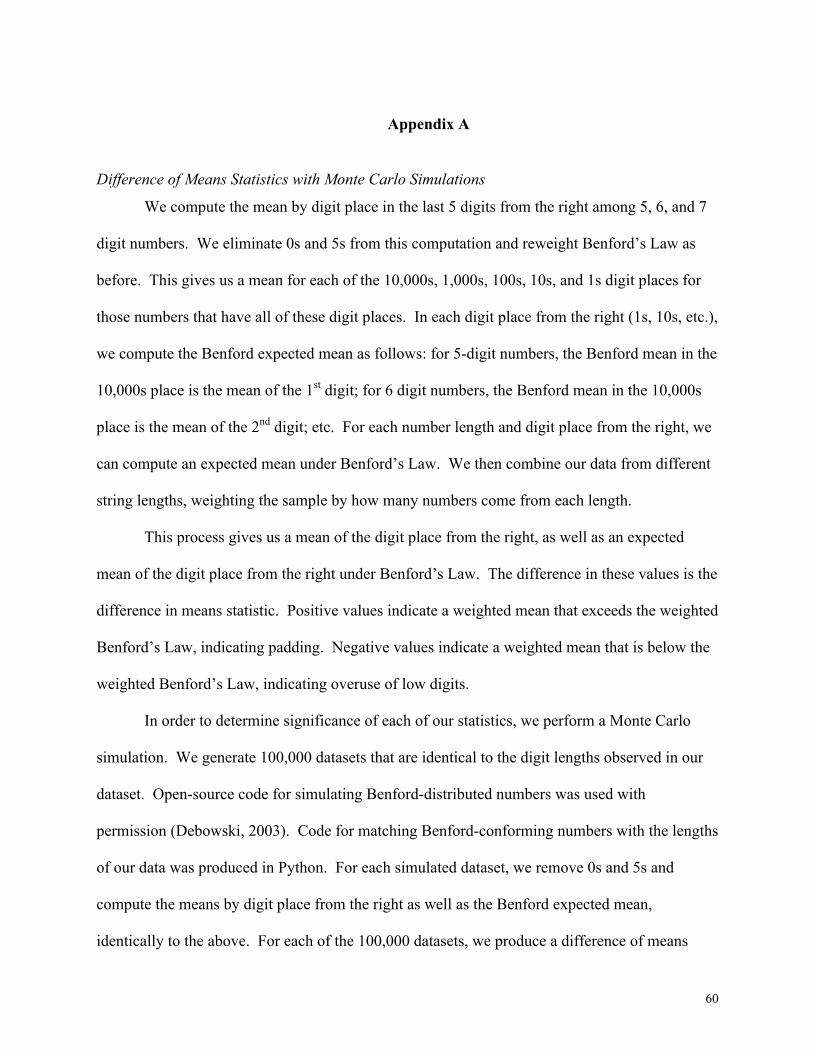
60
Appendix A
Difference of Means Statistics with Monte Carlo Simulations
We compute the mean by digit place in the last 5 digits from the right among 5, 6, and 7
digit numbers. We eliminate 0s and 5s from this computation and reweight Benford’s Law as
before. This gives us a mean for each of the 10,000s, 1,000s, 100s, 10s, and 1s digit places for
those numbers that have all of these digit places. In each digit place from the right (1s, 10s, etc.),
we compute the Benford expected mean as follows: for 5-digit numbers, the Benford mean in the
10,000s place is the mean of the 1st digit; for 6 digit numbers, the Benford mean in the 10,000s
place is the mean of the 2nd digit; etc. For each number length and digit place from the right, we
can compute an expected mean under Benford’s Law. We then combine our data from different
string lengths, weighting the sample by how many numbers come from each length.
This process gives us a mean of the digit place from the right, as well as an expected
mean of the digit place from the right under Benford’s Law. The difference in these values is the
difference in means statistic. Positive values indicate a weighted mean that exceeds the weighted
Benford’s Law, indicating padding. Negative values indicate a weighted mean that is below the
weighted Benford’s Law, indicating overuse of low digits.
In order to determine significance of each of our statistics, we perform a Monte Carlo
simulation. We generate 100,000 datasets that are identical to the digit lengths observed in our
dataset. Open-source code for simulating Benford-distributed numbers was used with
permission (Debowski, 2003). Code for matching Benford-conforming numbers with the lengths
of our data was produced in Python. For each simulated dataset, we remove 0s and 5s and
compute the means by digit place from the right as well as the Benford expected mean,
identically to the above. For each of the 100,000 datasets, we produce a difference of means
61
statistic. We then compare our observed difference of means statistic to these simulations. The
p-values reported are the empirical cumulative distribution function (CDF) of our difference of
means among the simulated statistics. That is, if our statistic exceeds 90% of the simulated
values, its p-value is 0.10. Because there are 100,000 samples, there is a minimum p-value of 1
in 100,000.
Last Digits
The literatures on both forensic auditing and election fraud emphasize analysis of the
terminal digits, which should be uniformly distributed if they represent the fourth digit place or
beyond (Nigrini & Mittermaier, 1997; Beber & Scacco, 2012). Results on the terminal digit are
presented in Appendix Figure 1AB and show exceptional statistical significance for both
expenditure and participant data. We exclude this test from our aggregate analysis later because
it is by the test of conformance to Benford’s Law in our test of all digit places beyond the first
and we wish to maintain independence in our test set.
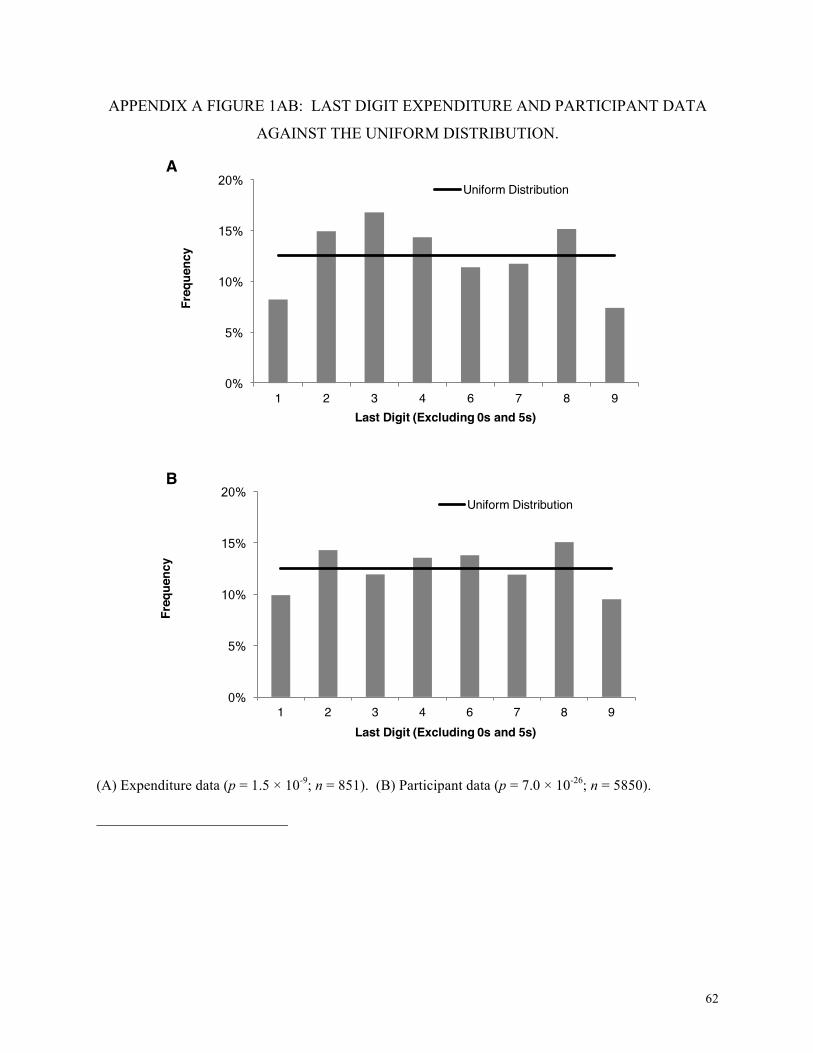
62
APPENDIX A FIGURE 1AB: LAST DIGIT EXPENDITURE AND PARTICIPANT DATA
AGAINST THE UNIFORM DISTRIBUTION.
(A) Expenditure data (p = 1.5 × 10⁻⁹; n = 851). (B) Participant data (p = 7.0 × 10⁻²⁶; n = 5850).
0%
5%
10%
15%
20%
1 2 3 4 6 7 8 9
Freq
uenc
y
Last Digit (Excluding 0s and 5s)
Uniform Distribution
A
0%
5%
10%
15%
20%
1 2 3 4 6 7 8 9
Freq
uenc
y
Last Digit (Excluding 0s and 5s)
Uniform Distribution
B