Embed Size (px)
Citation preview
Measuring Systemic Risk in the European Banking and
Sovereign Network 15 August, Sao Paulo
Frank Betz* European Investment Bank
Tuomas Peltonen*
European Central Bank
Nikolaus Hautsch University of Vienna
Melanie Schienle
Leibniz University Hannover
*The views and results presented here are those of the authors and may not represent those of the ECB or the EIB
Systemic risk contributions 2
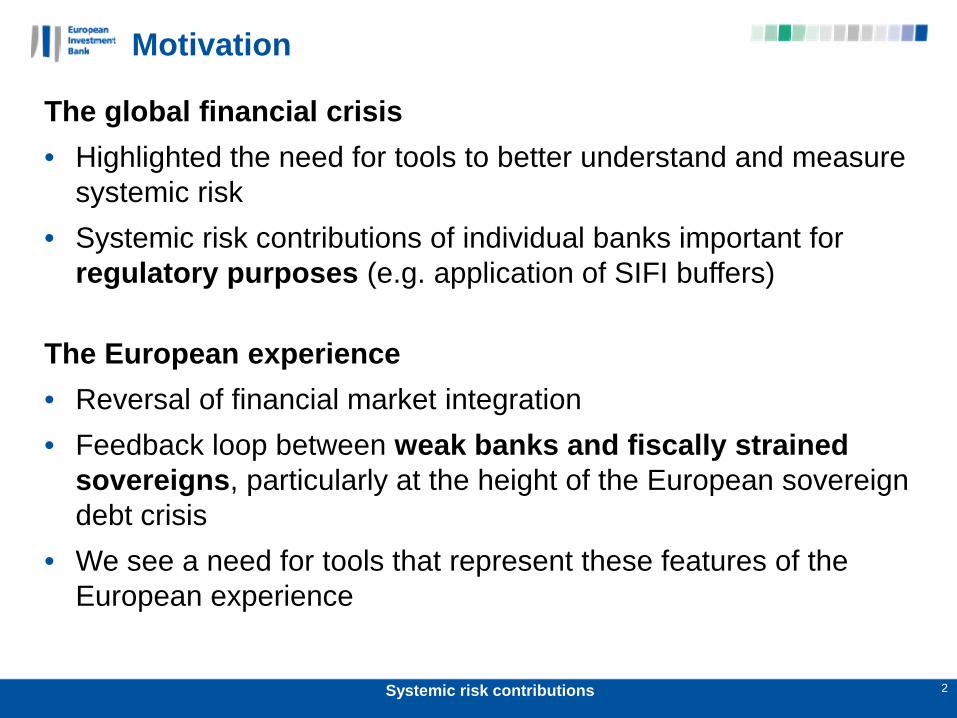
Motivation
The global financial crisis • Highlighted the need for tools to better understand and measure
systemic risk • Systemic risk contributions of individual banks important for
regulatory purposes (e.g. application of SIFI buffers)
The European experience • Reversal of financial market integration • Feedback loop between weak banks and fiscally strained
sovereigns, particularly at the height of the European sovereign debt crisis
• We see a need for tools that represent these features of the European experience
Systemic risk contributions 3
This project…
• Provides a framework for estimating time-varying systemic risk
contributions of individual banks based on tail dependence in asset prices
• The systemic risk contributions explicitly take into account the interconnectedness of banks.
• Represents interconnectedness via time-varying tail risk networks that are determined in a fully data-driven way
• Tail dependence networks as surveillance tool to track banking sector fragmentation and sovereign-bank interaction during the European sovereign debt crisis
Systemic risk contributions 4
Related literature
Data-driven econometric assessment of network linkages • Hautsch, Schaumburg, and Schienle (2014a,b) ; Billio et al. (2012);
Diebold, Yilmaz (2013) Measurement of systemic risk contributions • Acharya, Pedersen, Philippon, and Richardson (2010); Adrian and
Brunnermeier (2011); Brownlees and Engle (2012),… Sovereign-bank interaction • Ejsing and Lemke (2011), Alter and Schüler (2012), Arnold (2012),
Bruyckere, Gerhardt, Schepens, and Vennet (2013), Alter and Beyer (2014), and Correa, Lee, Sapriza, and Suarez (2014)
Introduction
Data
Methodology
Results
Conluding remarks
Systemic risk contributions 5
Outline
Systemic risk contributions 6
Data definitions and sources
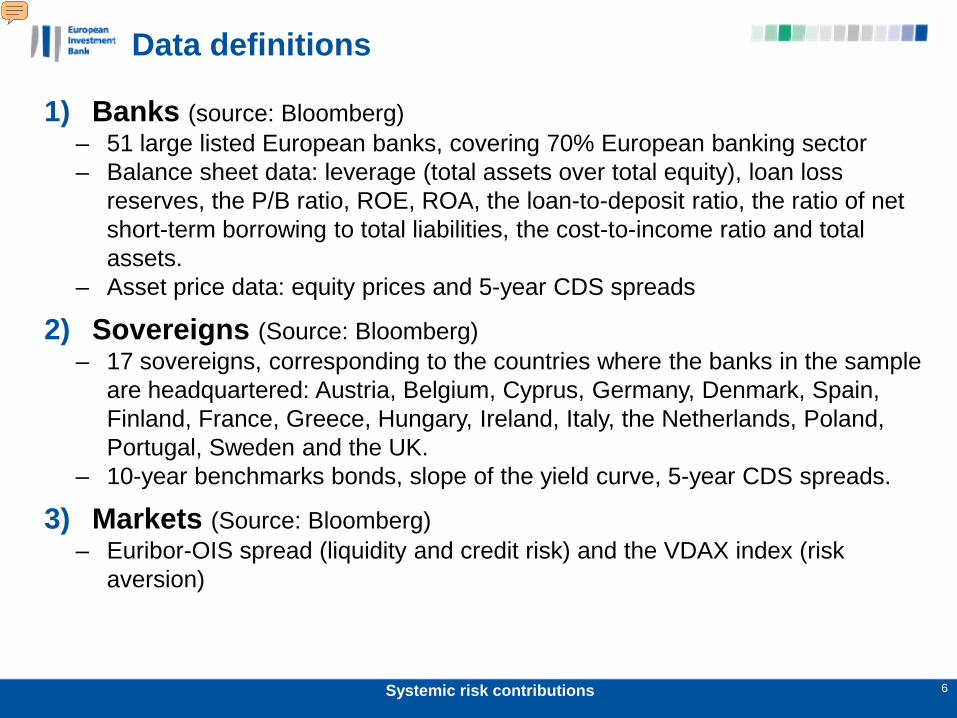
1) Banks (source: Bloomberg) – 51 large listed European banks, covering 70% European banking sector – Balance sheet data: leverage (total assets over total equity), loan loss
reserves, the P/B ratio, ROE, ROA, the loan-to-deposit ratio, the ratio of net short-term borrowing to total liabilities, the cost-to-income ratio and total assets.
– Asset price data: equity prices and 5-year CDS spreads
2) Sovereigns (Source: Bloomberg) – 17 sovereigns, corresponding to the countries where the banks in the sample
are headquartered: Austria, Belgium, Cyprus, Germany, Denmark, Spain, Finland, France, Greece, Hungary, Ireland, Italy, the Netherlands, Poland, Portugal, Sweden and the UK.
– 10-year benchmarks bonds, slope of the yield curve, 5-year CDS spreads.
3) Markets (Source: Bloomberg) – Euribor-OIS spread (liquidity and credit risk) and the VDAX index (risk
aversion)
Introduction
Data
Methodology
Results
Conluding remarks
Systemic risk contributions 7
Outline
Systemic risk contributions 8
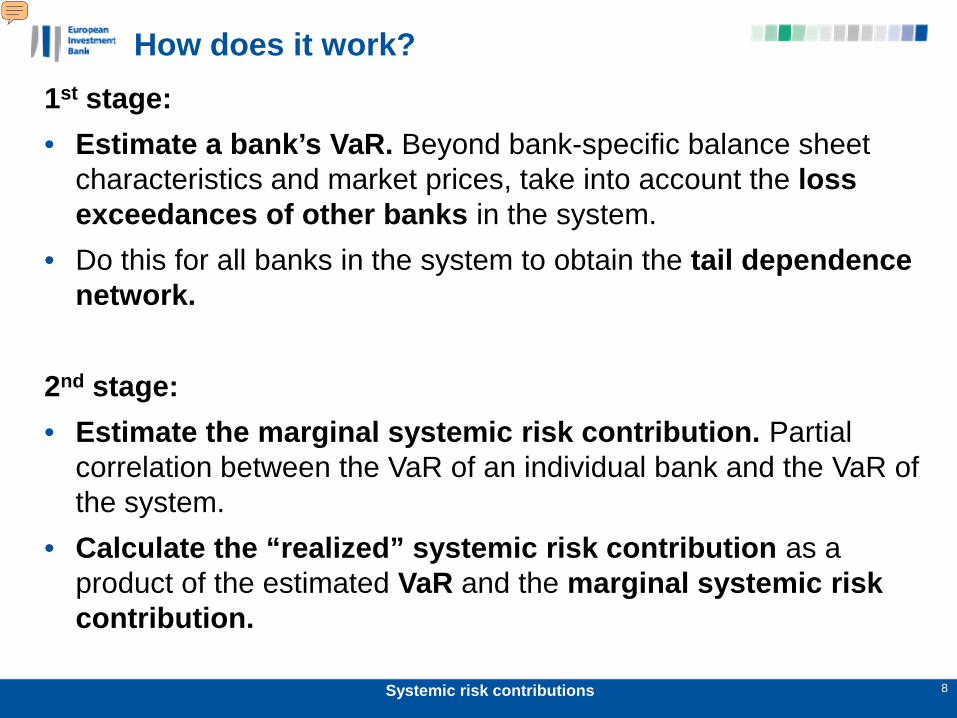
How does it work? 1st stage: • Estimate a bank’s VaR. Beyond bank-specific balance sheet
characteristics and market prices, take into account the loss exceedances of other banks in the system.
• Do this for all banks in the system to obtain the tail dependence network.
2nd stage: • Estimate the marginal systemic risk contribution. Partial
correlation between the VaR of an individual bank and the VaR of the system.
• Calculate the “realized” systemic risk contribution as a product of the estimated VaR and the marginal systemic risk contribution.
Systemic risk contributions 9
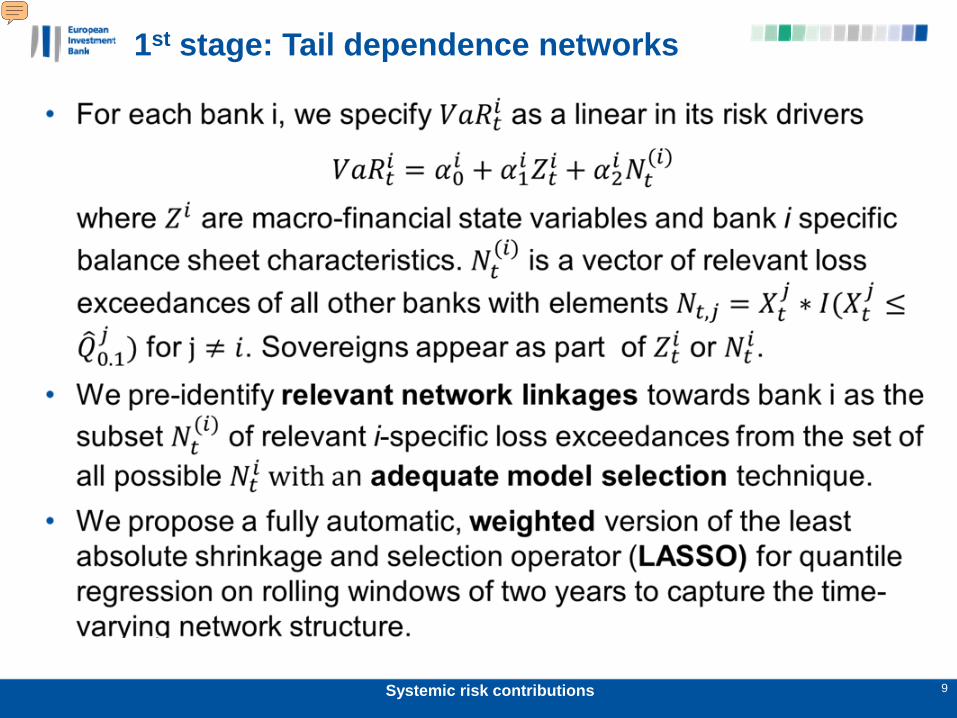
1st stage: Tail dependence networks
Systemic risk contributions 10
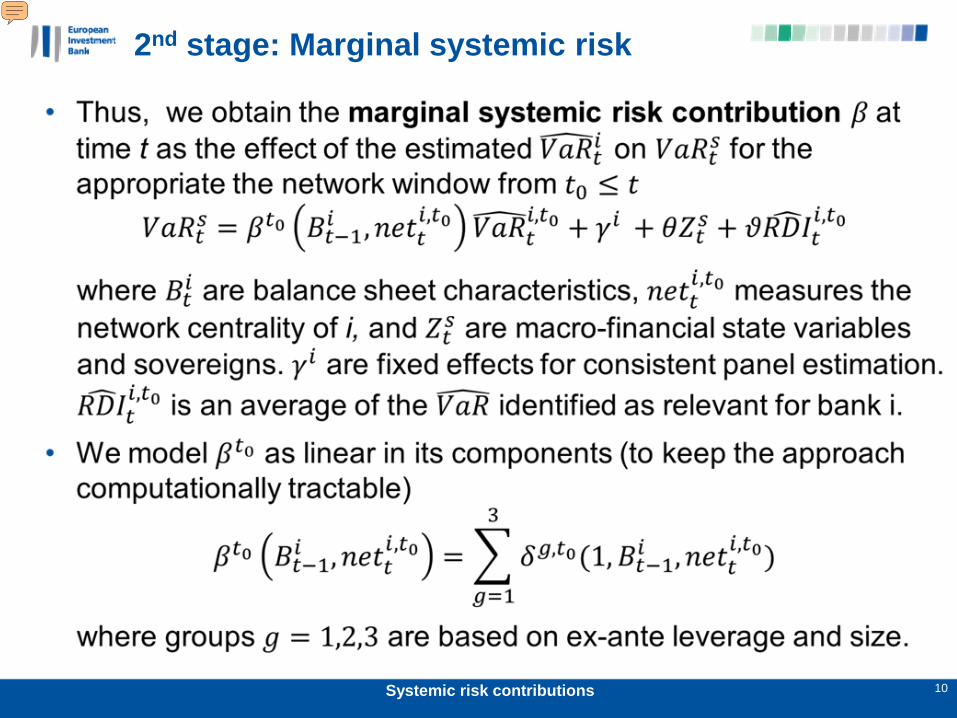
2nd stage: Marginal systemic risk
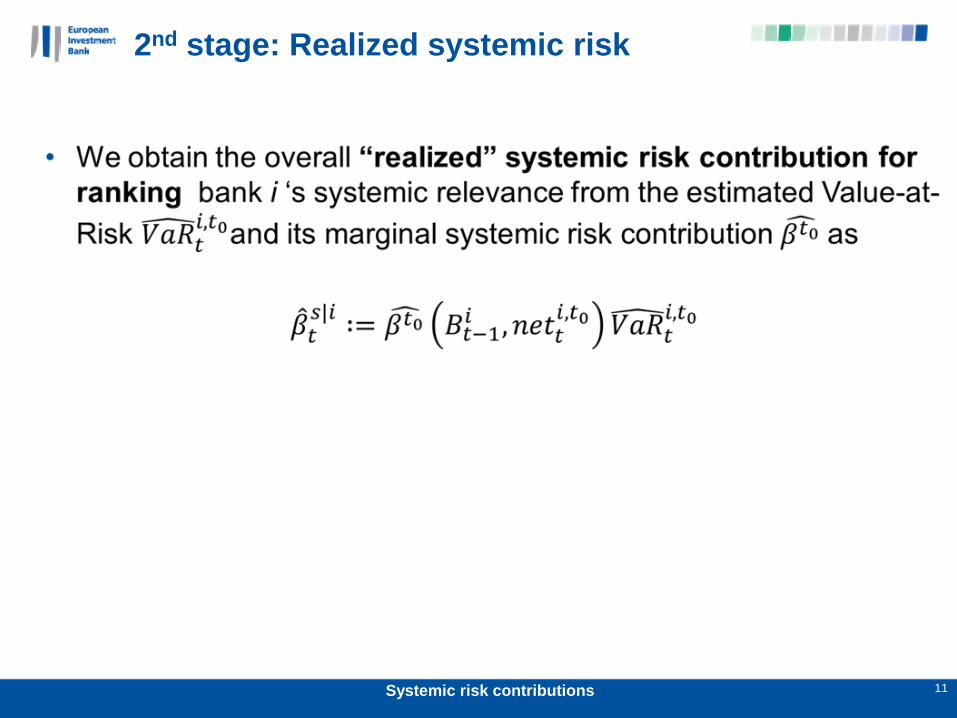
Systemic risk contributions 11
2nd stage: Realized systemic risk
Introduction
Data
Methodology
Results
Conluding remarks
Systemic risk contributions 12
Outline
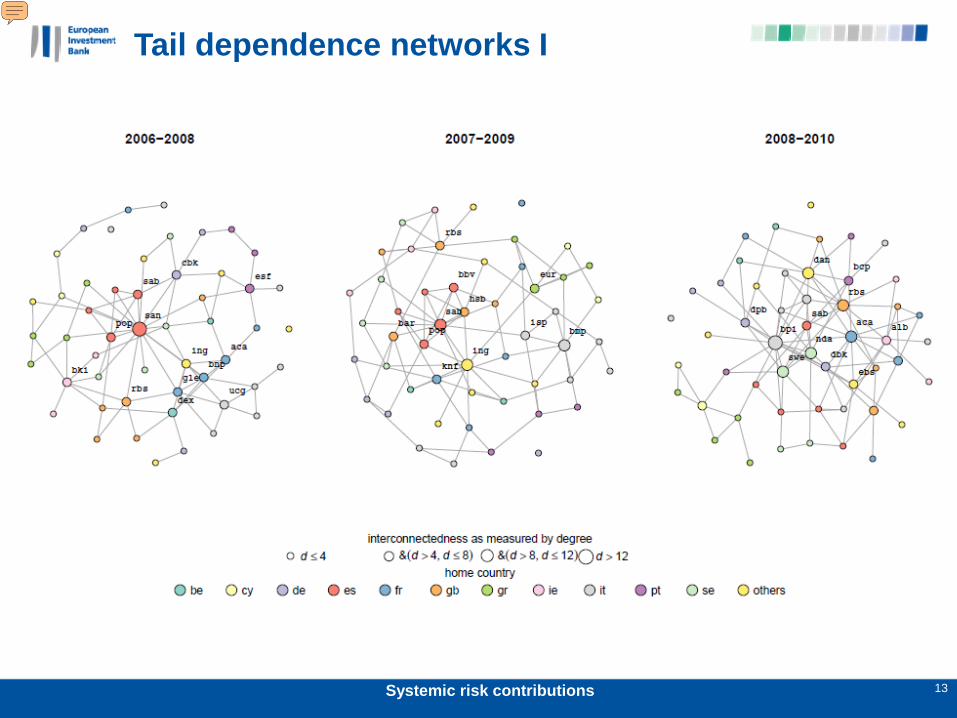
Systemic risk contributions 13
Tail dependence networks I2006-10
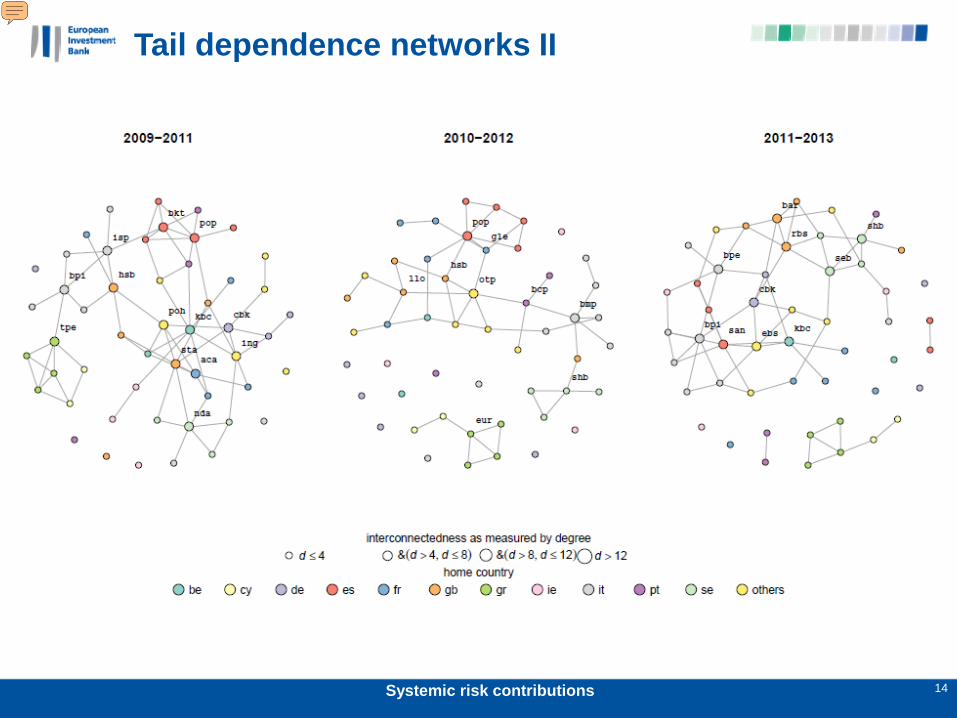
Systemic risk contributions 14
Tail dependence networks II, 2009-13
Systemic risk contributions 15
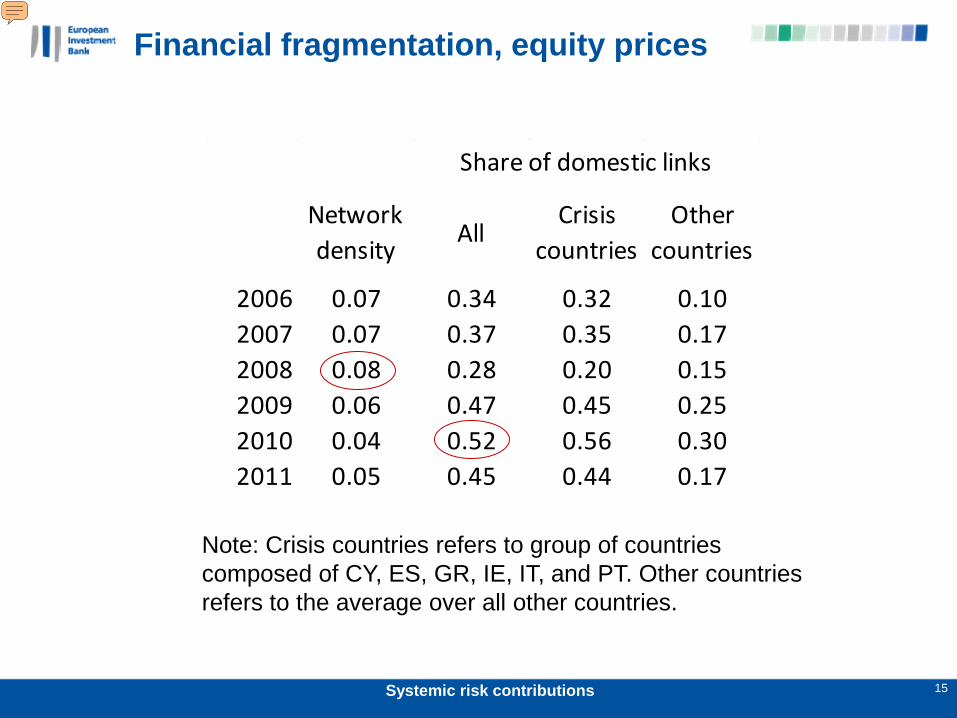
Financial fragmentation, equity prices
Network density All
Crisis countries
Other countries
2006 0.07 0.34 0.32 0.102007 0.07 0.37 0.35 0.172008 0.08 0.28 0.20 0.152009 0.06 0.47 0.45 0.252010 0.04 0.52 0.56 0.302011 0.05 0.45 0.44 0.17
Share of domestic links
Note: Crisis countries refers to group of countries composed of CY, ES, GR, IE, IT, and PT. Other countries refers to the average over all other countries.
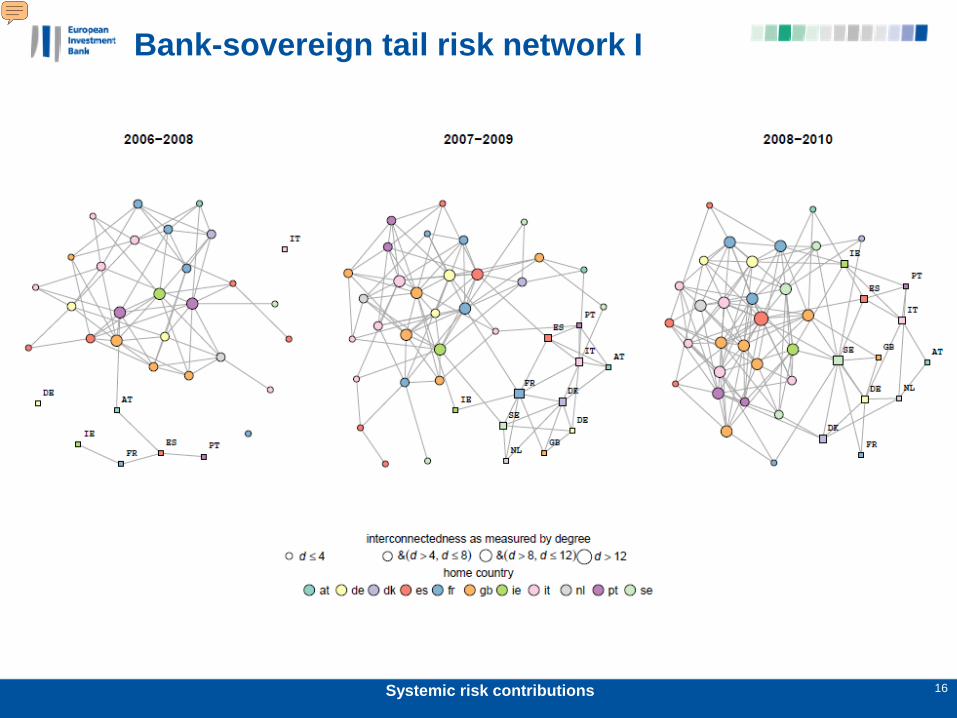
Systemic risk contributions 16
Bank-sovereign tail risk network I
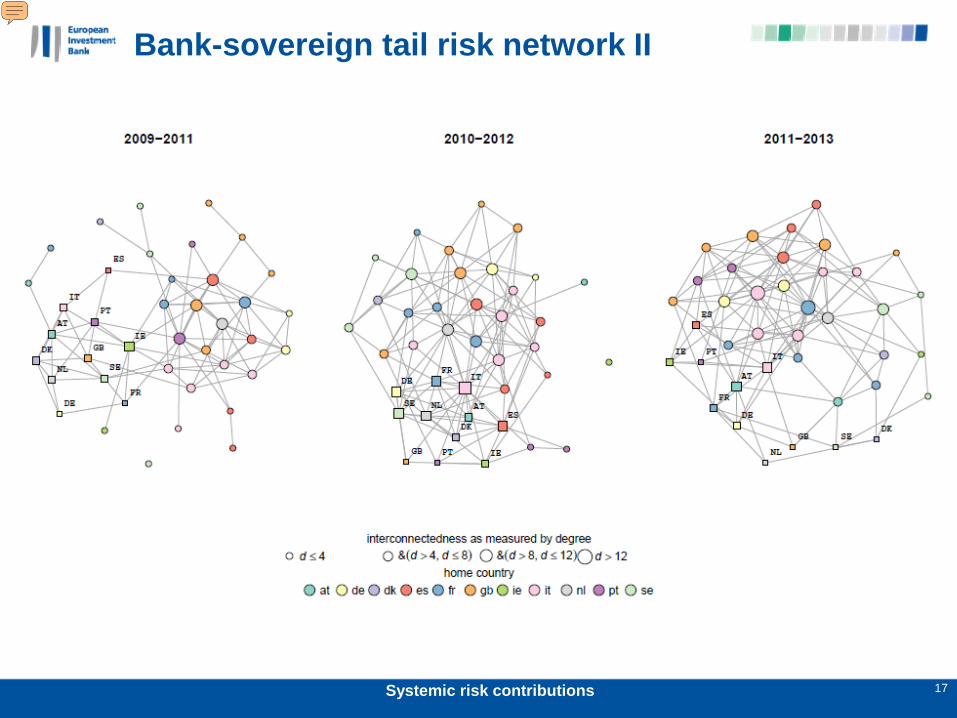
Systemic risk contributions 17
Bank-sovereign tail risk network II
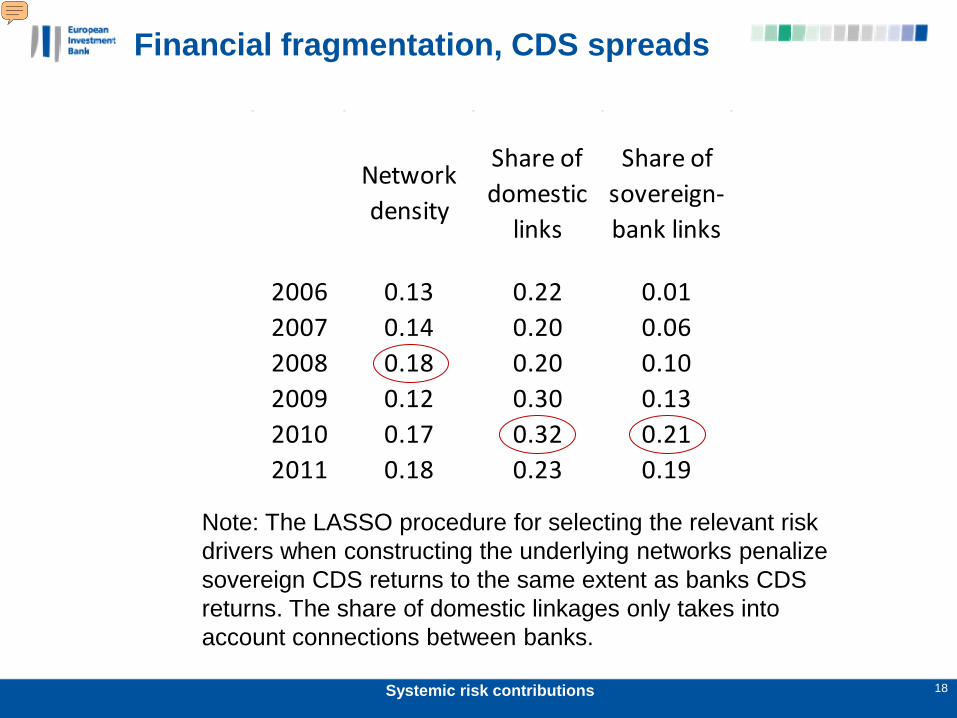
Network density
Share of domestic
links
Share of sovereign-bank links
2006 0.13 0.22 0.012007 0.14 0.20 0.062008 0.18 0.20 0.102009 0.12 0.30 0.132010 0.17 0.32 0.212011 0.18 0.23 0.19
Systemic risk contributions 18
Financial fragmentation, CDS spreads
Note: The LASSO procedure for selecting the relevant risk drivers when constructing the underlying networks penalize sovereign CDS returns to the same extent as banks CDS returns. The share of domestic linkages only takes into account connections between banks.
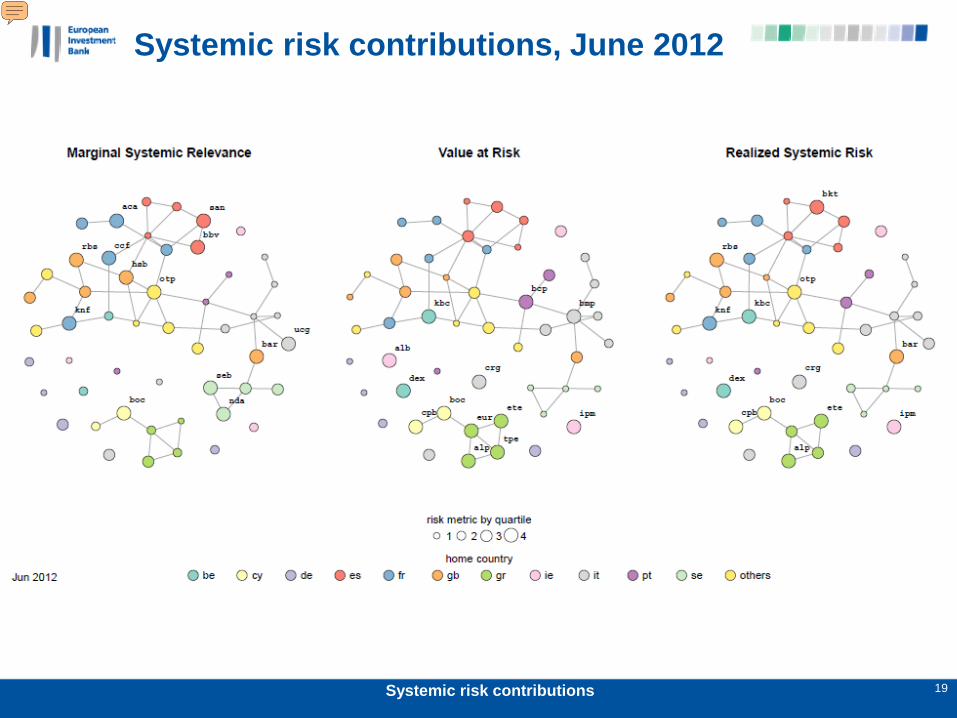
Systemic risk contributions 19
Systemic risk contributions, June 2012
Systemic risk contributions 20
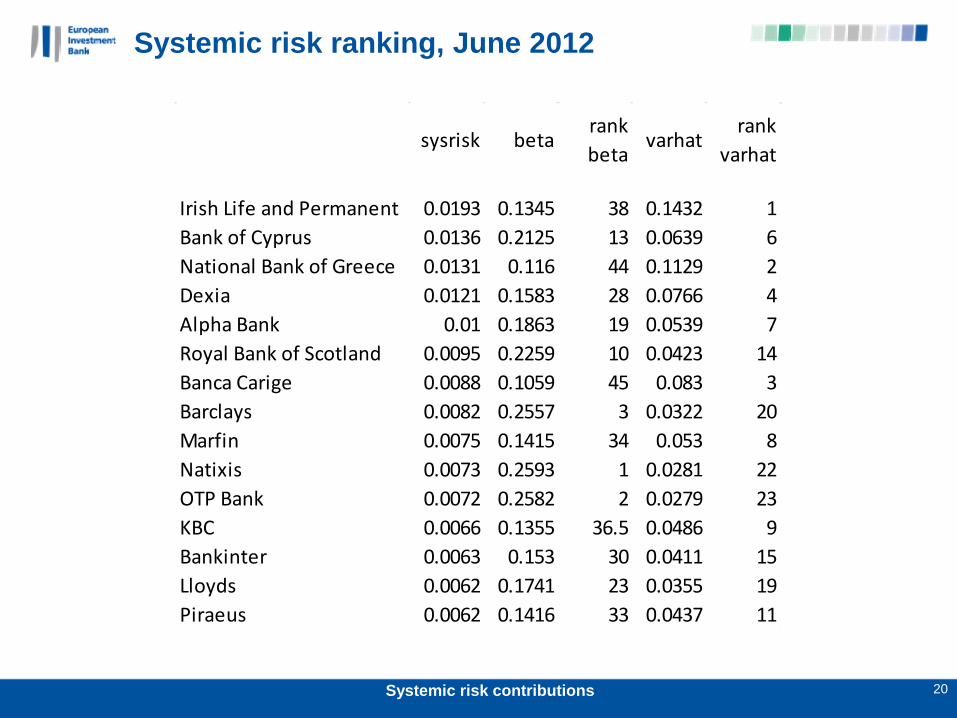
Systemic risk ranking, June 2012
sysrisk betarank beta
varhatrank
varhat
Irish Life and Permanent 0.0193 0.1345 38 0.1432 1Bank of Cyprus 0.0136 0.2125 13 0.0639 6National Bank of Greece 0.0131 0.116 44 0.1129 2Dexia 0.0121 0.1583 28 0.0766 4Alpha Bank 0.01 0.1863 19 0.0539 7Royal Bank of Scotland 0.0095 0.2259 10 0.0423 14Banca Carige 0.0088 0.1059 45 0.083 3Barclays 0.0082 0.2557 3 0.0322 20Marfin 0.0075 0.1415 34 0.053 8Natixis 0.0073 0.2593 1 0.0281 22OTP Bank 0.0072 0.2582 2 0.0279 23KBC 0.0066 0.1355 36.5 0.0486 9Bankinter 0.0063 0.153 30 0.0411 15Lloyds 0.0062 0.1741 23 0.0355 19Piraeus 0.0062 0.1416 33 0.0437 11
Introduction
Data
Methodology
Results
Conluding remarks
Systemic risk contributions 21
Outline
Systemic risk contributions 22
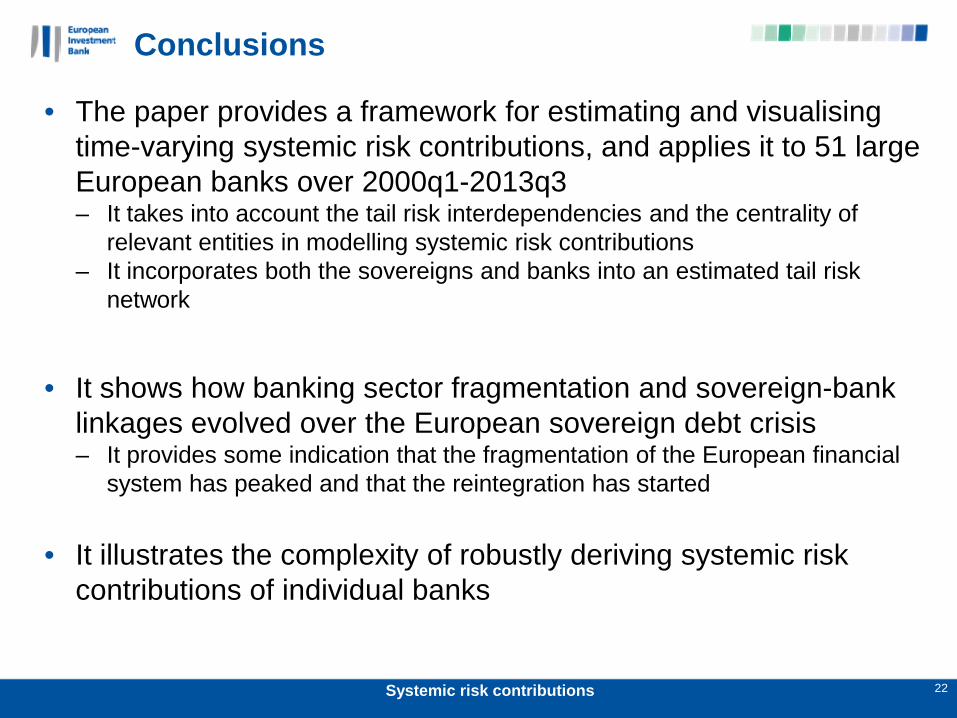
Conclusions
• The paper provides a framework for estimating and visualising time-varying systemic risk contributions, and applies it to 51 large European banks over 2000q1-2013q3 – It takes into account the tail risk interdependencies and the centrality of
relevant entities in modelling systemic risk contributions – It incorporates both the sovereigns and banks into an estimated tail risk
network
• It shows how banking sector fragmentation and sovereign-bank
linkages evolved over the European sovereign debt crisis – It provides some indication that the fragmentation of the European financial
system has peaked and that the reintegration has started
• It illustrates the complexity of robustly deriving systemic risk contributions of individual banks
Thank you
Systemic risk contributions 23
Systemic risk contributions 24
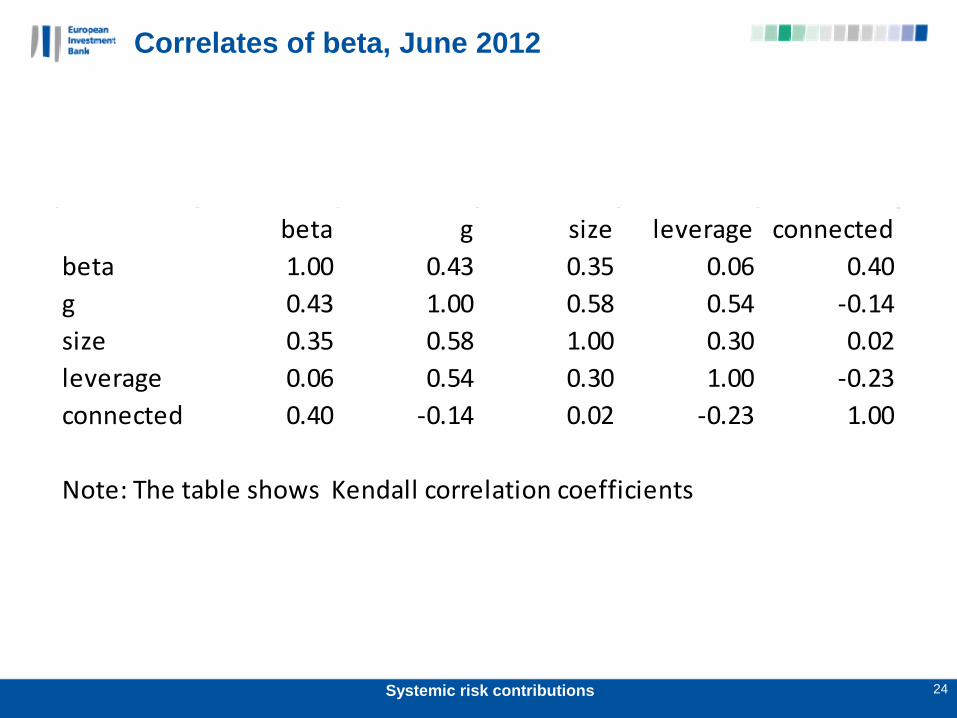
Correlates of beta, June 2012
beta g size leverage connectedbeta 1.00 0.43 0.35 0.06 0.40g 0.43 1.00 0.58 0.54 -0.14size 0.35 0.58 1.00 0.30 0.02leverage 0.06 0.54 0.30 1.00 -0.23connected 0.40 -0.14 0.02 -0.23 1.00
Note: The table shows Kendall correlation coefficients