Embed Size (px)
Citation preview

Measuring the contributions of Chinese scholarsto the research field of systems biology from 2005 to 2013
Yawen Zou1,2 • Manfred D. Laubichler1
Received: 16 October 2016� Akademiai Kiado, Budapest, Hungary 2016
Abstract Systems biology is a new field of biology that has great implications for agri-
culture, medicine, and sustainability. In this article we explore the contributions of Chinese
authors to systems biology through analysis of the metadata of more than 9000 articles on
systems biology. Our big-data approach includes scientometric analysis, GIS analysis, co-
word network analysis, and comparative analysis. By 2013 China has become second in the
number of publications on systems biology. Similar to previous studies on Chinese science,
we find an unequal distribution of research power in China, favoring big cities and coastal
cities. Overall, 75% of the articles in systems biology were published by scholars from
universities, 15% by scholars from the Chinese of Academy of Sciences institutions, and
9% from other institutions. Many Chinese scholars’ research topics are similar to those in
the US, Japan, and Germany, but one salient difference is that traditional Chinese medicine
is an important topic among Chinese systems biologists. 25% of Chinese systems biolo-
gists cooperate with scientists abroad, suggesting that they take advantage of the opening-
up policy. From the year 2011–2013, the average impact factor of the journals that Chinese
scholars publish in is generally lower than that of their counterparts in the US, but the trend
points to a gradual increase in impact.
Keywords Systems biology � Chinese scholars � Scientometrics � Network analysis �GIS analysis � Comparative analysis
Mathematic Subject Classification 92C42 � 97D10 � 01-08
& Yawen [email protected]
Manfred D. [email protected]
1 Arizona State University, Tempe, AZ, USA
2 School of Humanities and Social Science, The Chinese University of Hong Kong, Shenzhen,Shenzhen, China
123
ScientometricsDOI 10.1007/s11192-016-2213-x

Introduction
Along with the economic liberalization of China, the scientific impact of the country is also
increasing. According to a report by the Nature Publishing Group, China’s total expen-
diture on research and development in 2014 was 207 billion US dollars, second only to the
US. In 2014 there are 213,000 scientific papers originating from China in Thomson
Reuters’ SCI database, which represents 15% of the world’s total (Nature Publishing
Group 2015). However, it is often criticized that the average quality of Chinese scholars’
work is not as compelling as the quantity of their work. According to the SCImago Journal
and Country Rank, which uses data from the Scopus database, the overall citations of
citable documents by Chinese authors from 1996 to 2014 is 19,110,353, ranking No. 6 in
the world; the citations per citable document is 7.44, below the world average.1 This means
that the quality of Chinese scholars’ work is generally lower than the world average.
However, some scholars also point to the unequal research strength among different dis-
ciplines in China, using scientometric methods to show that China is stronger in areas
related to physics, engineering, and chemistry than in other disciplines (Zhou and Ley-
desdorff 2006).
In this article, we focus on the development of systems biology and explore the con-
tribution of Chinese authors to this area. Systems biology is a burgeoning discipline of
biology that involves studying biological systems at a holistic level, combining big data
generated from high-through technologies and mathematical modeling. The director of the
Institute of Systems Biology in Seattle, Leroy Hood, remarked in 2003 that biology in the
twenty-first century will be dominated by systems biology (Hood 2003). Systems biology
has great potential in health care, synthetic biology, and agriculture (Hood et al. 2004;
Church 2005). For example, synthetic biology requires the comprehensive understanding
of cellular systems to model molecular interactions, which is also the goal of systems
biology. Systems biology can shed light on the redesigning process of synthetic biology
and synthetic biology can illuminate the knowledge of existing systems (Barrett et al.
2006).
Systems biology, along with genomics, bioinformatics, computational biology, is what
philosopher of biology Werner Callebaut (2012) called big data biology (BDB), which
benefits greatly from genome sequencing and post-genome analysis. China is one of the
countries that participated in the Human Genome Project (International Human Genome
Sequencing Consortium 2001). Since then, the Ministry of Science and Technology in
China has been investing heavily in establishing institutions that are dedicated to post-
genomics studies, such as the Beijing Genomics Institute and the Chinese National Human
Genome Center, to name a few (Wu et al. 2011). These infrastructure investments pave the
way for advancements in genomics, informatics, and systems biology in China. Also,
according to the National Guidelines on the Planning of Midterm and Long Term
Development of Science and Technology (2006–2020), one of the most high-profile doc-
uments that influence policy making in science, systems biology is listed as one of the
research fronts in the basic research, which means that systems biology research is put on
the priority list of the Chinese State Council (State Council of China 2006).
Goldman (2014) studied the field of systems biology through bibliometrics. Her
research examined bipartite networks of journals and subject categories and subject cat-
egory co-occurrence networks to reveal the diffusion of knowledge between different
1 For the rankings of more countries, see http://www.scimagojr.com/countryrank.php.
Scientometrics
123

disciplines. Her method allowed her to identify the core disciplines of systems biology
such as computer science and biophysics. Previously there have been studies on various
disciplines of biology in China; for example, bibliographic analysis of biochemistry and
molecular biology, and surveys about the plant biotechnology in China (He et al. 2005;
Huang et al. 2002). However, since systems biology is relatively new, there has not yet
been any historical research on systems biology in China as far as we know. We intend to
fill this gap for systems biology in China. We asked the following questions:
1. What percentage of systems biologists are from China over time?
2. Where do Chinese authors come from in terms of their geographical locations and
institutional affiliations?
3. Do Chinese systems biologists share the same research topics as authors from other
countries?
4. Do Chinese systems biologists work in a closed environment or an open environment
where international cooperation is abundant?
5. How high is the quality of Chinese systems biologists’ work in contrast with the
quantity of their work?
Methods
Our research utilized a variety of computational methods to analyze the metadata of
systems biology articles, including scientometric analysis, geographic information system
(GIS) analysis, and network analysis. Our metadata are the bibliographic data of 9923
articles published between 1997 and 2013. Our research is also a comparative study to
reveal the differences in terms of country, region, institution type, and research topic, and
research quality.
Data collection
In January 2014, we searched for articles that have the term ‘‘systems biology’’ in the
‘‘topics,’’ which include ‘‘titles,’’ ‘‘abstracts,’’ and ‘‘keywords,’’ and published from 1900
to 2013 in the Web of Science (WoS) database. Systems biology is highly interdisciplinary,
with scientists from a broad range of disciplines publishing research on system biology:
molecular biologists, evolutionary biologists, physicists, engineers, and computer scien-
tists, to name a few. Our definition of systems biologists reflects this broad spread: simply
put, we consider all authors who publish articles that fit our search criteria. The search
returned 9923 articles. We then downloaded the metadata of those articles. From our data,
we discovered that 2005 is the first year when Chinese authors started to publish articles on
systems biology. Therefore, this study examines the contribution of Chinese scholars to
systems biology from 2005 to 2013.
The WoS database has been developed by the Institute of Scientific Information (ISI) of
Thomson Reuters. ISI is famous for its publication of Journal Citation Report (JCR) and
the analysis of journal impact factor (IF), which evaluates the influence of publications
through citation counts (Russ-Eft 2008). Its science citation index (SCI), social sciences
citation index (SSCI), and other indexes are widely used to assess the quality of journals
and the articles in them, especially in China (Xue 2008). We chose the WoS database for
the following reasons: first, the WoS database is a successful commercial database, well
Scientometrics
123

maintained and updated, and with higher accuracy than the Google Scholar database
(Falagas et al. 2008). Second, for each article that is included in the Web of Science
database, it exports the title, keywords, author, publication name, publishing year, author
address, and other useful metadata using different field tags. The output file itself is a big
data file that can be analyzed using computational approach to get meaningful results.
The percentage of articles published by Chinese authors
How did we determine whether a paper was published by a Chinese author? We used the
straightforward criterion that the paper must have a Chinese address as the reprint address.
That precludes two situations: first, many Chinese scholars go abroad to study and do not
use a Chinese address, or a Chinese author participates in the research for a paper but is not
its reprint author (also known as corresponding author). In those two scenarios, we do not
consider that the credit of those publications should be given to China. In the following
sections, when we say Chinese scholars, we refer only to authors who have a Chinese
address as a reprint author. We used Python code to get the addresses of reprint authors of
the articles, and we broke down each address into institution, city, and country. We then
analyzed the country of all the reprint authors and compared the percentage of articles
written by reprint authors coming from different countries.
Geographical and institutional analysis of Chinese authors
For Chinese authors we analyzed the provinces that they come from, and the institutions
with which they are affiliated. We aimed to shed light on the distribution of research power
among different provinces through analysis of the number of publications. We used Google
Fusion Table, a widely used GIS tool developed by Google, to geocode the addresses of
Chinese authors and visualize their locations on maps. By geocode, we mean that Google
Fusion Table uses its state-of-the-art cloud-computing service to transform physical
locations into KML (formerly Keyhole Markup Language) format, which is an XML-based
format that enables mapping a location on maps (Google 2016). Google Fusion Table also
allowed us to visualize the number of papers published by authors coming from each
province using the heatmap function.
We classified three types of institutions in China: universities, Chinese Academy of
Sciences (CAS) institutions, and other institutions such as institutions of the Chinese
Academy of Medical Sciences or hospitals. As of 2010, CAS governed 97 research
institutions in over 20 provinces around the country and has top-tier researchers across all
of China, many of whom are recruited from abroad (Liu and Zhi 2010). CAS is the fourth
largest funding agency in the country, second only to the National Natural Science
Foundation of China, which is an equivalent of National Science Foundation of the US, the
Ministry of Science and Technology, and the Ministry of Education (NPG 2015). We
examined the percentage of Chinese authors from those three types of institutions.
Comparing the keywords of Chinese authors and authors from othercountries
Because different countries have different research strategies and traditions, we wanted to
know whether Chinese authors have the same research topics, whether they lag behind, or
whether they have totally different topics than their western counterparts. Keywords, which
Scientometrics
123

are identified by authors, are indications of the research topics, and many previous bib-
liometric studies have examined the keywords of literature to understand the topics of
different disciplines (Su and Lee 2010). We retrieved the keywords as formally defined in
the literature, and ranked them according to how many times they appear in the publica-
tions for each country. We then compared the keywords of Chinese authors with those of
publications from the US, Japanese, and German authors.
By comparing the ranks of the top 30 keywords for the four countries, we aimed to
investigate the difference in the research interests of each country. We also used a network
approach to visualize the connections between keywords. If two keywords co-occur in the
Keywords section of a paper, it indicates a relationship between those two keywords. We
visualized the co-word network of keywords in Cytoscape (Shannon et al. 2003). We
looked at the co-word network because networks can highlight words with high
betweenness centrality.
Analyzing the cooperation of Chinese institutions with foreign institutions
For more than 30 years, China has adopted a policy of opening up and learning from the
West after Mao Zedong’s reign, in which international cooperation was not encouraged
(Zhou and Glanzel 2010). Chinese authors not only needed to overcome the difficulties of
using English as a second language, but also needed to keep up with the latest trends in
areas of study in the English-speaking community. The best way to learn from the West is
cooperating with the West. According to a report by the British Royal Society, over 35% of
papers that were published in international journals in the year 2008 for the whole world
were a result of international cooperation; that number was just 25% in 1996 (The Royal
Society 2011). Another study examines the percentage of internationally co-authored
publications among all international publications in several countries between 1997 and
2007 (Zhou and Glanzel 2010). From 1997 to 2007, the percentage of internationally co-
authored papers in the US increased from 18 to 28.9%; for the UK, the number increased
from 27.7 to 45.5%; China’s number decreased from 24 to 21.9%. According to the authors
of that study, it was because the denominator, the number of international publications
increased. Therefore, it is interesting to see whether for systems biologists in China
international cooperation increased or decreased.
Coauthoring a paper is an indication of cooperation. Although analyzing coauthor
information is not a comprehensive indication of all types of cooperation happening
between scholars—others include email exchanges, communicating through conferences,
or inviting foreign scholars to give guest lectures—it is used as a proxy for evaluating
cooperation in many previous studies and coauthor information can be easily retrieved
compared with documenting other forms of cooperation (Wang et al. 2005). We retrieved
the information of coauthors with Chinese authors and identified the nationality of their
coauthors. Next we identified the highest-ranking international countries in terms of the
number of co-authored papers.
Analyzing the quality of journals of Chinese authors
This study explores the quality of journals that Chinese researchers publish in compared
with their US counterparts. Evaluating the quality of research is a difficult task and we
chose to use IF to do so. Garfield (1955) first proposed the use of IF. A journal’s IF for a
specific year is the average number of citations of all articles published in that journal in a
certain period, usually 2 years before that year (Garfield 2006). Impact factors from
Scientometrics
123

Thomson Reuters’ Journal of Citation Report (JCR) and SCImago Journal Ranking are the
most widely used ones; the former is based on the WoS database, and the latter based on
Scopus database.
There are some debates about using IF to assess the quality of a research study (Saha
et al. 2003). For example, some argue that the IF of a journal is not representative of an
individual article because when authors choose a journal for submitting their work, they do
not just consider the IF of that journal alone, but also other factors (Seglen 1997). On the
other hand, some claim that citation count and IF are the most commonly used approach to
measure the quality of papers (Wang 2016).
We concede that the IF of a journal is not a predictor of the actual citations for a paper
in that journal, but our research does not aim to examine the quality of one article or one
author, but rather to examine many papers together. Therefore, we think that the average IF
can be used to assess the quality of many publications for a country. Another reason is that
IF are conveniently obtained compared to other factors such as the H index for all authors,
which would require enormous amount of work. Actually, funding agencies in China often
use IF to assess the quality of Chinese scientists’ work for promotion, for instance, using
the number of articles published in journals included in the JCR with a cut-off IF as a
method of evaluation (Xue 2008). This is not unique to China; the same evaluation
scheme is used in Italy and some Nordic countries as well (Seglen 1997).
We obtained the IFs of more than 10,000 journals from JCR for the years 2011, 2012,
and 2013. We analyzed the IF of a journal that an article was published in, which is the IF
of the journal for the publication year of the article. We then compared the average IF of
journals in which Chinese scholars published with that of their US counterparts. We also
counted the number of articles that were published in journals with IF higher than 8 and
journals with IF smaller than 8. What is considered a high-impact journal depends on the
field (Leydesdorff 2007). In some fields, for example, in medical field, impact factor of 10
might not be a high impact journal. However, in other fields, 5 could be considered a high
impact factor. In our case, we picked the impact factor of 8 as a threshold because with this
threshold 20% of the articles authored by the US authors are high-impact articles.
Results
The results are organized into five sub-sections, each of which corresponds to our five
driving questions and methods.
The numbers of publications for various countries
We compared China to four countries: the US, the UK, Germany, and Japan. We selected
these countries because they are among the top ten countries with the highest scientific
impacts according to Scimago Country Rank, which includes the USA, China, Japan,
Germany, South Korea, India, France, the UK, Russia, and Canada.
Figure 1 shows pie charts listing the total percentages of research papers that have
reprint authors from the four countries as well as all other countries grouped together in
2005 and 2013, respectively. Because in different years, the number of publications is
different, what we compared here is the percentage. It suggests that China contributed only
a small fraction of the pie chart in 2005, but contributed a significant portion in 2013.
Scientometrics
123

Figure 2 shows that the line representing China has a steep slope and has exceeded that
of Japan, the UK, and Germany in 2013. The x axis stands for the year and the y axis stands
for the number of articles published in that year for a country. In 2005, only 1.54% of
papers (7 papers) have reprint authors from China; in 2013, this number has jumped to
9.03% (129 papers), showing steady growth (The annual growth rate from 2005 to 2013 is
43.94%). For the US, in 2005, it has 189 articles and that number for 2013 is 445, and the
annual growth rate is 11.30%.
The geographical and institutional analysis of Chinese authors
To give an example of the distribution of research power across different regions of China,
we mapped the number of papers published in 2013 onto a map of China. Figure 3 shows
that Shanghai (33 papers), Beijing (23 papers), and Heilongjiang province (12 papers) have
the highest numbers of publications. It is not surprising that Beijing and Shanghai are two
hot spots because they are the most developed regions in China, but Heilongjiang province
caught our attention because it is not an economically prosperous area. We discovered that
many of papers from Heilongjiang province were published by scholars at the Heilongjiang
University of Chinese Medicine and some of those articles argue that traditional Chinese
medicine is, in essence, systems medicine. For example, there is a review article in
Complementary Therapies in Medicine arguing that traditional Chinese medicine values a
holistic approach, just like systems medicine. One essence of traditional Chinese medicine
is treating the body as a whole, instead of just treating a body part. That article also
Fig. 1 The comparison of the percentage of papers for each country
Fig. 2 The number of the papers from the US, China, Germany, the UK and Japan from 2000 to 2013
Scientometrics
123

discusses how traditional Chinese medicine incorporated modern systems biology plat-
forms to reform itself (Zhang et al. 2012).
We also noticed the unequal distribution of publications: in many provinces, not a single
paper was produced, especially cities in the northern and western regions, where the
economy is not as advanced as other parts of China. It could be that systems biology is still
a new discipline, so no paper was published. However, it might be more likely due to the
unequal distribution of research resources. Therefore, we explored the research resource
distribution in China. Zhi and Meng (2015) report that in the life sciences sectors resources
are distributed unevenly in China, mainly favoring the eastern coastal areas and big cities
like Beijing and Shanghai. The areas with zero publications are areas that are economically
less developed regions in China. We reproduced a figure from that article, as shown in
Fig. 4, and we found that the unequal distribution of resources matches the unequal dis-
tribution of publications on systems biology.
The analysis of the types of Chinese institutions shows that from 2005 to 2013, most
papers on systems biology were produced by universities (75.30%), followed by CAS
institutions (15.26%), and then by other institutions (9.44%; See Table 1).
According to the China National Bureau of Statistics, in 2013, the national spending in
R&D was 11,866 billion Chinese Yuan (roughly 189.54 billion US dollars), and CAS
institutions got 43.80 billion Yuan from the government (roughly 7 billion US dollars),
which accounted for 3.69% of the government’s total funding (Ministry of Science and
Technology of the People’s Republic of China 2014; Chinese Academy of Sciences 2014).
In the field of systems biology, CAS institutions produced on average 15% of the papers
published from 2005 to 2013, which exceeds the expectations if we assume that the amount
of overall funding is proportional to the amount of funding for systems biology alone. One
of the reasons might be the human resources reform of the CAS, which gives it an
advantage in terms of recruiting researchers from abroad over other universities through its
‘‘One Hundred Talents Program’’ that offers more competitive salaries than universities
and other institutions (Liu and Zhi 2010).
Although CAS institutes have been outperforming average universities and other
institutes in China, its input–output efficiency still lags behind many of its counterparts in
Fig. 3 The numbers of papers produced by each province in 2013
Scientometrics
123

the developed countries, for example the Max Planck Society. According to its official
website, the Max Planck Society has 83 research institutions and 17,284 employees as of
January 2015, and the annual spending of the society is 1.7 billion euros.2 The society has
fewer researchers than the CAS, and less R&D spending, but produced nearly twice the
Fig. 4 National Natural Science Foundation of China funding allocation in the life sciences at the city level(2006–2010). The legend shows the number of projects supported by the foundation. The darker the blue coloris for a city, the more projects that city has. Reproduced from Zhi and Meng (2015). (Color figure online)
Table 1 The number of articlesproduced by three types ofinstitutions
Year CAS institutions Other institutions Universities
2005 1 0 6
2006 2 1 13
2007 3 3 12
2008 9 5 21
2009 8 6 18
2010 11 0 58
2011 14 0 66
2012 19 14 79
2013 9 18 102
Total 76 46 375
Percentage 15.26% 9.44% 75.30%
2 For more information about the personnel and finances of the Max Planck Institute, see https://www.mpg.de/facts-and-figures.
Scientometrics
123

numbers of publications on systems biology than CAS in the period from 2005 to 2013
(153 for Max Planck Society vs. 76 for CAS).
Keywords differences between countries
We compared the keywords ranked according to their frequencies in articles for four
countries, China, the US, Japan, and Germany, from 2005 to 2013. The top 30 keywords in
Table 2 Comparing the keywords of four countries
US China Japan Gerany
Systems biology Systems biology Systems biology Systems biology
Proteomics Metabolomics Metabolomics Metabolomics
Biology Metabonomics Database Proteomics
Genomics Traditional chinesemedicinea
Bioinformatics Biology
Systems Network Microarray Systems
Bioinformatics Proteomics Transcriptome Bioinformatics
Metabolomics Biomarkers Simulation Mathematical modeling
Microarray Biology Analysis Apoptosis
Mass spectrometry Bioinformatics Metabolome Transcriptomics
Modeling Metabolic network Omics Cancer
Computational biology Systems Systems Transcriptome
Gene expression Mass spectrometry Arabidopsis thaliana Modeling
Networks Genomics Feedback loop Analysis
Biomarkers Networks Gastric cancer Mass spectrometry
Cancer Review Synthetic biology Signal transduction
Synthetic biology Omics Biology Gene expression
Metabolism Cancer Cell cycle Protein
Inflammation Proteome Notch Parameter estimation
Genetics Nmr Toxicogenomics Mathematical model
Mathematicalmodeling
Liver regeneration Cancer Genomics
Signal transduction System biology Escherichia coli Network
Protein Stability Stochasticity Metabolic networks
Metabolic engineering Rat genome 230 2.0 array Computer simulation Arabidopsis thaliana
Transcriptomics Time delay Metabolicengineering
Metabolism
Evolution Metabolites Personalizedmedicine
Mathematicalmodelling
Biomarker Regulatory network Reaction Gene regulation
Drug discovery Gc–ms Biomarker Arabidopsis
Gene regulation Tuberculosis Network Simulation
Simulation Chemometrics Drug discovery Computational biology
Regulation Herbal medicine Wnt Microarray
a The words in bold are words that are unique to systems biology in China
Scientometrics
123
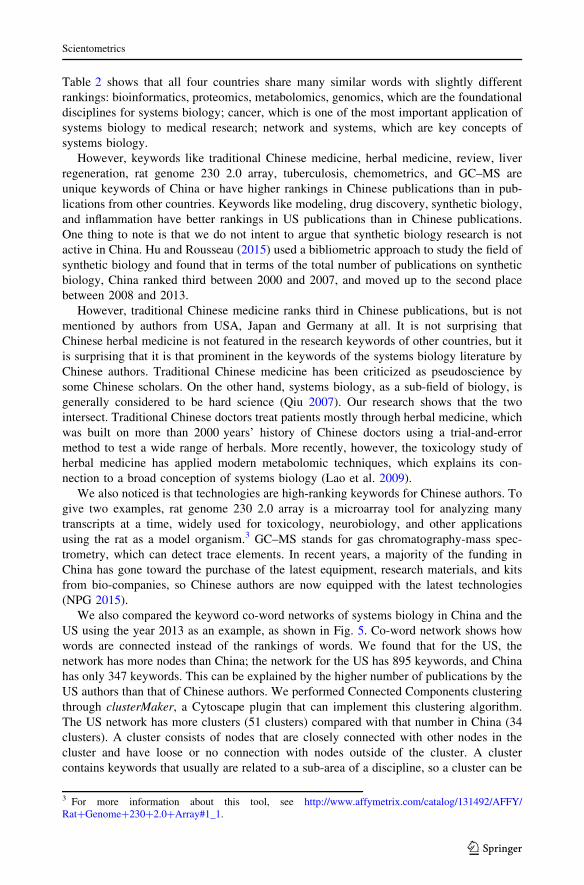
Table 2 shows that all four countries share many similar words with slightly different
rankings: bioinformatics, proteomics, metabolomics, genomics, which are the foundational
disciplines for systems biology; cancer, which is one of the most important application of
systems biology to medical research; network and systems, which are key concepts of
systems biology.
However, keywords like traditional Chinese medicine, herbal medicine, review, liver
regeneration, rat genome 230 2.0 array, tuberculosis, chemometrics, and GC–MS are
unique keywords of China or have higher rankings in Chinese publications than in pub-
lications from other countries. Keywords like modeling, drug discovery, synthetic biology,
and inflammation have better rankings in US publications than in Chinese publications.
One thing to note is that we do not intent to argue that synthetic biology research is not
active in China. Hu and Rousseau (2015) used a bibliometric approach to study the field of
synthetic biology and found that in terms of the total number of publications on synthetic
biology, China ranked third between 2000 and 2007, and moved up to the second place
between 2008 and 2013.
However, traditional Chinese medicine ranks third in Chinese publications, but is not
mentioned by authors from USA, Japan and Germany at all. It is not surprising that
Chinese herbal medicine is not featured in the research keywords of other countries, but it
is surprising that it is that prominent in the keywords of the systems biology literature by
Chinese authors. Traditional Chinese medicine has been criticized as pseudoscience by
some Chinese scholars. On the other hand, systems biology, as a sub-field of biology, is
generally considered to be hard science (Qiu 2007). Our research shows that the two
intersect. Traditional Chinese doctors treat patients mostly through herbal medicine, which
was built on more than 2000 years’ history of Chinese doctors using a trial-and-error
method to test a wide range of herbals. More recently, however, the toxicology study of
herbal medicine has applied modern metabolomic techniques, which explains its con-
nection to a broad conception of systems biology (Lao et al. 2009).
We also noticed is that technologies are high-ranking keywords for Chinese authors. To
give two examples, rat genome 230 2.0 array is a microarray tool for analyzing many
transcripts at a time, widely used for toxicology, neurobiology, and other applications
using the rat as a model organism.3 GC–MS stands for gas chromatography-mass spec-
trometry, which can detect trace elements. In recent years, a majority of the funding in
China has gone toward the purchase of the latest equipment, research materials, and kits
from bio-companies, so Chinese authors are now equipped with the latest technologies
(NPG 2015).
We also compared the keyword co-word networks of systems biology in China and the
US using the year 2013 as an example, as shown in Fig. 5. Co-word network shows how
words are connected instead of the rankings of words. We found that for the US, the
network has more nodes than China; the network for the US has 895 keywords, and China
has only 347 keywords. This can be explained by the higher number of publications by the
US authors than that of Chinese authors. We performed Connected Components clustering
through clusterMaker, a Cytoscape plugin that can implement this clustering algorithm.
The US network has more clusters (51 clusters) compared with that number in China (34
clusters). A cluster consists of nodes that are closely connected with other nodes in the
cluster and have loose or no connection with nodes outside of the cluster. A cluster
contains keywords that usually are related to a sub-area of a discipline, so a cluster can be
3 For more information about this tool, see http://www.affymetrix.com/catalog/131492/AFFY/Rat?Genome?230?2.0?Array#1_1.
Scientometrics
123

Fig. 5 The keyword co-word network of the US (top figure) and China (bottom figure) in 2013
Scientometrics
123

interpreted as a sub-area of research (He 1999). The results suggest that research in the US
is more mature and diversified.
We highlighted keywords that connect different sub-areas of research by measuring
their betweenness centrality, which is the number of shortest paths from all nodes to all
others that pass through that node (Leydesdorff 2007). Nodes with high betweenness
centrality serve as ‘‘bridges’’ that connect different clusters together, and the implication is
that those keywords connects different research topics or sub-area together. According to
Chen (2006), nodes with high betweenness centrality can also be used to predict emerging
trends in scientific literature. Figure 5 and Table 2 show two different aspects of keywords
analysis, one focusing on the keywords that have higher frequency and the other focusing
on keywords with higher betweenness centrality.
Comparing the nodes with high betweenness centrality, we found that some of these
keywords are unique to the US or China. In the network for the US, we can see keywords
like ‘‘obesity,’’ ‘‘ovary,’’ ‘‘inflammation,’’ and ‘‘calcium’’ highlighted. In the network for
China, we can see keywords like ‘‘gut microbiota,’’ ‘‘tuberculosis,’’ and ‘‘breast cancer’’
highlighted. For example, the keyword ‘‘obesity’’ is unique to the network of the US, and
‘‘tuberculosis’’ is unique to the network of China. This is interesting because obesity is a
big issue in the US, and although China’s rate of obesity is increasing, but it does not show
up in the co-word network of China (Levine 2011). As for tuberculosis, it is a major public
health problem in China but not so much in the US because drug-resistant tuberculosis has
led to increasing number of cases in China (Hu and Sun 2013). It has been argued that a
systems biology approach is better than the traditional antibiotic prescriptions in treating
drug-resistant forms of TB (Young et al. 2008).
The international cooperation of Chinese systems biologists with othercountries
Among articles published from 2005 to 2013, on average, 25.70% of papers arose from
international cooperation, and 730% are independent Chinese studies, as shown in Table 3.
By independent, we mean that the publication has only Chinese authors, without authors
from another country. The sheer number of internationally co-authored papers has
increased over time, but there was not a clear trend of increase or decrease for the per-
centage of internationally co-authored papers.
Table 3 The number of papers produced by independent study and international cooperation
Year Total Independent study International cooperation Percentage of cooperation (%)
2005 7 5 2 28.57
2006 16 11 5 31.25
2007 18 13 5 27.78
2008 35 24 11 31.43
2009 32 26 6 18.75
2010 69 41 28 40.58
2011 80 63 17 21.25
2012 112 92 20 17.86
2013 129 95 34 26.36
Total 498 370 128 25.70
Scientometrics
123

Chinese systems biologists have developed cooperation with authors from a total of 19
countries from 2005 to 2013. Chinese authors did not only cooperate with authors from
developed countries in the North America and Europe, but also with scholars from
developing countries in Asia and Africa. Table 4 shows that from 2005 to 2013, not
surprisingly, the US is the biggest country where Chinese scientists’ collaborators come
from, followed by Japan and the UK. Note that Germany authors ranked second in pro-
ducing the publications of systems biology until 2012, but in terms of cooperation with
Chinese authors, it fell behind Japan, England, and Canada. We infer that Japan is second
because it is a country that is near China geographically, and England and Canada have a
language advantage over Germany because English is a universal language that many
Chinese scholars speak compared with German, which makes these countries more
attractive destinations for Chinese scientists. Other countries include Netherlands, Italy,
Thailand, South Korea, Finland, Saudi Arabia, Ireland, South Africa, Philippines, Sweden,
France, and Scotland.
The quality of journals in which Chinese authors published
Table 5 shows that the average IFs of the journals that Chinese authors publishing in is
lower compared with US authors in three consecutive years, and not stable. The IFs for
articles by US authors over the 3 years are relatively stable. It should be noted that the
number of publications from China increased over time while the US did not.
We also compared the situation for high impact journals. The percentage of articles
published in high-impact journals (with IF C 8) for China is quite low and not stable,
whereas that percentage for the USA stayed stable. Our data shows that it is difficult for
Chinese authors to publish in high-impact journals like Cell, Nature, or Lancet.
Conclusions and discussion
Our comparative study focusing on publications in systems biology by Chinese authors
offers a number of suggestions for science policy in China. As China aims to transform
itself from a manufacturing power into an innovation power, and from a labor-based
economy into a knowledge-based economy (Dahlman and Aubert 2001; Zhou and Ley-
desdorff 2006), a data driven science policy is needed.
Our research shows that although Chinese scholars did not have publications on systems
biology in our metadata until 2005, Chinese scholars produce about 10% of all articles by
2013, and that number has grown rapidly. China has become the second-largest publisher
Table 4 The top countries ofcooperation with China
Ranking Countries Number of coauthored papers
1 USA 63
2 Japan 23
3 England 14
4 Canada 6
5 Australia 6
6 Germany 5
7 Singapore 5
Scientometrics
123

of scientific articles on systems biology after the US by 2013. If China continues to put
systems biology on its priority list as laid out in the National Guidelines mentioned earlier,
this increase in output is likely to continue.
There has been an inequality in China’s research strength, and Chinese funding agencies
should pay attention not just to its coastal and big cities, but also to other inner provinces.
Given enough resources, a province usually considered not as affluent as costal cities such
as Heilongjiang was able to produce a number of publications and focus on a unique
approach to systems biology. Also, the type of institution has an influence on the input–
output efficiency, with CAS being more efficient than the average. Nonetheless, CAS
institutes still lag behind its counterparts in the developed world like the Max Planck
Society.
In terms of research areas, this study suggests that Chinese systems biologists are
largely aligned with Western systems biologists, but they also have generated unique type
areas of study, such as research related to traditional Chinese medicine. Our study suggests
that traditional Chinese medicine may not be as ‘‘traditional’’ as we used to think because
of its incorporation of latest technologies used by systems biologists. Also, our research
shows that Chinese systems biology is linked to treatments of complex diseases such as
drug resistant tuberculosis. Therefore, as a general strategy for doctors and researchers in
China, it might make sense to incorporate more systems biology approaches into various
aspects of their research.
Over the years that we examined around 25% of papers that had a Chinese corre-
sponding author resulted from international cooperation. This is still lower than the world
average. The Chinese government thus should continue to support research collaborations,
either by sending out more scholars to other countries, or allocating additional funding to
invite more foreign scholars to come to China for work or study. Previous research sug-
gests that China spent a small percentage on human resource expenditures (\15%) com-
pared with those of developed countries (usually 40%; NPG 2015). This suggests that
Chinese institutions should increase their efforts to recruit and retain researchers. The fact
that CAS, due to its policy of recruiting scholars from abroad, has a higher impact than
other Chinese institutions proves this point.
At the same time, we show that from 2011 to 2013, despite the increase of numbers of
publications, Chinese authors generally published in journals that have lower average IFs
than their US counterparts. Therefore, the Chinese government could increase incentives
for Chinese scientists to publish in high-impact journals, because articles published in
Table 5 The comparison of IFs of journals between China and the US
Average IF Total Journal with IF C 8 Ratio of high IF journals
China
2011 3.303 80 6 0.075
2012 2.784 112 1 0.009
2013 3.342 129 6 0.047
US
2011 5.935 458 97 0.212
2012 5.701 464 102 0.220
2013 5.876 445 102 0.229
Scientometrics
123

those journals often receive more scrutiny throughout the publishing process, and can raise
the profile of an author and the country that author belongs to.
Our study, while inclusive vis-a-vis available data, cannot claim completeness. As we
used the term ‘‘systems biology’’ as a search query, we concede that some publications
might not have fit our research, yet still pertains to systems biology research. In addition,
our research examines publications in the WoS database, and only those published in
English. It does not examine the publications in journals published in Chinese, so this
research is mainly about systems biology in China as perceived from abroad. In the future,
we would like to examine a Chinese database such as the China Scientific and Technical
Papers and Citation Database to see if there is a similar pattern.
Acknowledgements The authors would like to thank many people who have contributed to this project,including Jane Maienschein, Erick Peirson, Julia Damerow, Kenneth D. Aiello, and Deryc Painter, andanonymous reviewers for their suggestions. The authors also would like to acknowledge financial supportfrom National Science Foundation (SES 1243575), China Scholarship Council (2011635028), and the ASU-SFI Center for Biosocial Complex Systems.
References
Barrett, C. L., Kim, T. Y., Kim, H. U., Palsson, B. Ø., & Lee, S. Y. (2006). Systems biology as a foundationfor genome-scale synthetic biology. Current Opinion in Biotechnology, 17(5), 488–492.
Callebaut, W. (2012). Scientific perspectivism: A philosopher of science’s response to the challenge of bigdata biology. Studies in History and Philosophy of Biological and Biomedical Sciences, 43(1), 69–80.
Chen, C. (2006). CiteSpace II: Detecting and visualizing emerging trends and transient patterns in scientificliterature. Journal of the American Society for Information Science and Technology, 57(3), 359–377.
Chinese Academy of Sciences. (2014). Annual budget of Chinese academy of sciences. Available at http://www.cas.cn/xxgkml/zgkxyyb/czjf/ysjs/201407/P020140718685723194826.pdf. (Accessed Dec 1,2016).
Church, G. M. (2005). From systems biology to synthetic biology. Molecular Systems Biology, 1(1):E1–E2.Dahlman, C. J., & Aubert, J. E. (2001). China and the knowledge economy: Seizing the 21st century.
Washington, DC: World Bank Publications.Falagas, M. E., Pitsouni, E. I., Malietzis, G. A., & Pappas, G. (2008). Comparison of PubMed, Scopus, web
of science, and Google scholar: Strengths and weaknesses. The FASEB Biology Journal, 22(2),338–342.
Garfield, E. (1955). Citation indexes for science. Science, 122(3159), 108–111.Garfield, E. (2006). The history and meaning of the journal impact factor. JAMA, 295(1), 90–93.Goldman, A. W. (2014). Conceptualizing the interdisciplinary diffusion and evolution of emerging fields:
The case of systems biology. Journal of Informetrics, 8(1), 43–58.Google. (2016). Google fusion table web page. Available online: https://fusiontables.google.com/
data?dsrcid=implicit. (Accessed Dec 1, 2016).He, Q. (1999). Knowledge discovery through co-word analysis. Library Trends, 48(1), 133–159.He, T., Zhang, J., & Teng, L. (2005). Basic research in biochemistry and molecular biology in China: A
bibliometric analysis. Scientometrics, 62(2), 249–259.Hood, L. (2003). Systems biology: Integrating technology, biology, and computation. Mechanisms of Ageing
and Development, 124(1), 9–16.Hood, L., Heath, J. R., Phelps, M. E., & Lin, B. (2004). Systems biology and new technologies enable
predictive and preventative medicine. Science, 306(5696), 640–643.Hu, X., & Rousseau, R. (2015). From a word to a world: The current situation in the interdisciplinary field of
synthetic biology. PeerJ, 3, e728.Hu, T., & Sun, W. (2013). Tuberculosis in China. Journal of Tuberculosis Research, 1(02), 9.Huang, J., Rozelle, S., Pray, C., & Wang, Q. (2002). Plant biotechnology in China. Science, 295(5555),
674–676.International Human Genome Sequencing Consortium. (2001). Initial sequencing and analysis of the human
genome. Nature, 409(6822), 860–921.
Scientometrics
123

Lao, Y. M., Jiang, J. G., & Yan, L. (2009). Application of metabonomic analytical techniques in themodernization and toxicology research of traditional Chinese medicine. British Journal of Pharma-cology, 157(7), 1128–1141.
Levine, J. A. (2011). Poverty and obesity in the US. Diabetes, 60(11), 2667–2668.Leydesdorff, L. (2007). Betweenness centrality as an indicator of the interdisciplinarity of scientific journals.
Journal of the American Society for Information Science and Technology, 58(9), 1303–1319.Liu, X., & Zhi, T. (2010). China is catching up in science and innovation: The experience of the Chinese
Academy of Sciences. Science and Public Policy, 37(5), 331–342.Ministry of Science and Technology of the People’s Republic of China (MSTPRC). (2014). National
science and technology funding statistics bulletin. http://www.most.gov.cn/tztg/201410/t20141030_116370.htm.
Nature Publishing Group. (2015). Turning point: Chinese science in transition. London: Nature PublishingGroup.
Qiu, J. (2007). China plans to modernize traditional medicine. Nature, 446(7136), 590–591.Russ-Eft, D. (2008). SSCI, ISI, JCR, JIF, IF, and journal quality. Human Resource Development Quarterly,
19(3), 185–189.Saha, S., Saint, S., & Christakis, D. (2003). Impact factor: A valid measure of journal quality? Journal of the
Medical Library Association, 91, 42–46.Seglen, P. O. (1997). Why the impact factor of journals should not be used for evaluating research. BMJ
British Medical Journal, 314(7079), 498.Shannon, P., Markiel, A., Ozier, O., Baliga, N. S., Wang, J. T., Ramage, D., et al. (2003). Cytoscape: A
software environment for integrated models of biomolecular interaction networks. Genome Research,13(11), 2498–2504.
State Council of China. (2006). National guidelines on the planning of midterm and long term developmentof science and technology (2006 to 2020). http://www.gov.cn/gongbao/content/2006/content_240244.htm.
Su, H. N., & Lee, P. C. (2010). Mapping knowledge structure by keyword co-occurrence: A first look atjournal papers in Technology Foresight. Scientometrics, 85(1), 65–79.
The Royal Society. (2011). Knowledge, networks and nations: Global scientific collaboration in the 21stcentury. London: The Royal Society.
Wang, L. (2016). The structure and comparative advantages of China’s scientific research: Quantitative andqualitative perspectives. Scientometrics, 106(1), 435–452.
Wang, Y., Wu, Y., Pan, Y., Ma, Z., & Rousseau, R. (2005). Scientific collaboration in China as reflected inco-authorship. Scientometrics, 62(2), 183–198.
Wu, J., Xiao, J., Zhang, R., & Yu, J. (2011). DNA sequencing leads to genomics progress in China. ScienceChina Life Sciences, 54(3), 290–292.
Xue, L. (2008). China: The prizes and pitfalls of progress. Nature, 454(7203), 398–401.Young, D., Stark, J., & Kirschner, D. (2008). Systems biology of persistent infection: Tuberculosis as a case
study. Nature Review Microbiology, 6(7), 520–528.Zhang, A., Sun, H., Wang, P., Han, Y., & Wang, X. (2012). Future perspectives of personalized medicine in
traditional Chinese medicine: A systems biology approach. Complementary Therapies in Medicine,20(1), 93–99.
Zhi, Q., & Meng, T. (2015). Funding allocation, inequality, and scientific research output: An empiricalstudy based on the life science sector of Natural Science Foundation of China. Scientometrics, 106(2),1–26.
Zhou, P., & Glanzel, W. (2010). In-depth analysis on China’s international cooperation in science. Scien-tometrics, 82(3), 597–612.
Zhou, P., & Leydesdorff, L. (2006). The emergence of China as a leading nation in science. ResearchPolicy, 35(1), 83–104.
Scientometrics
123