Embed Size (px)
Citation preview

Measuring the effects of human performance on safety, environmental
and economic outputs using Flight Data Monitoring. HumP-FDM.
Trond-Eirik Strand, MD, PhDSjeflege / Leder human factors
Luftfartstilsynet

Agenda
IntroduksjonStudie designResultaterVeien videre

Definisjon fatigue
“A physiological state of reduced mental or physical performance capability resulting from sleep loss or extended wakefulness, circadian phase, or workload (mental and/or physical activity) that can impair a crew member ’s alertness and ability to safely operate an aircraft or perform safety related duties.”

ALERT
SLEEPY
Karolinska sleepiness scale (KSS)
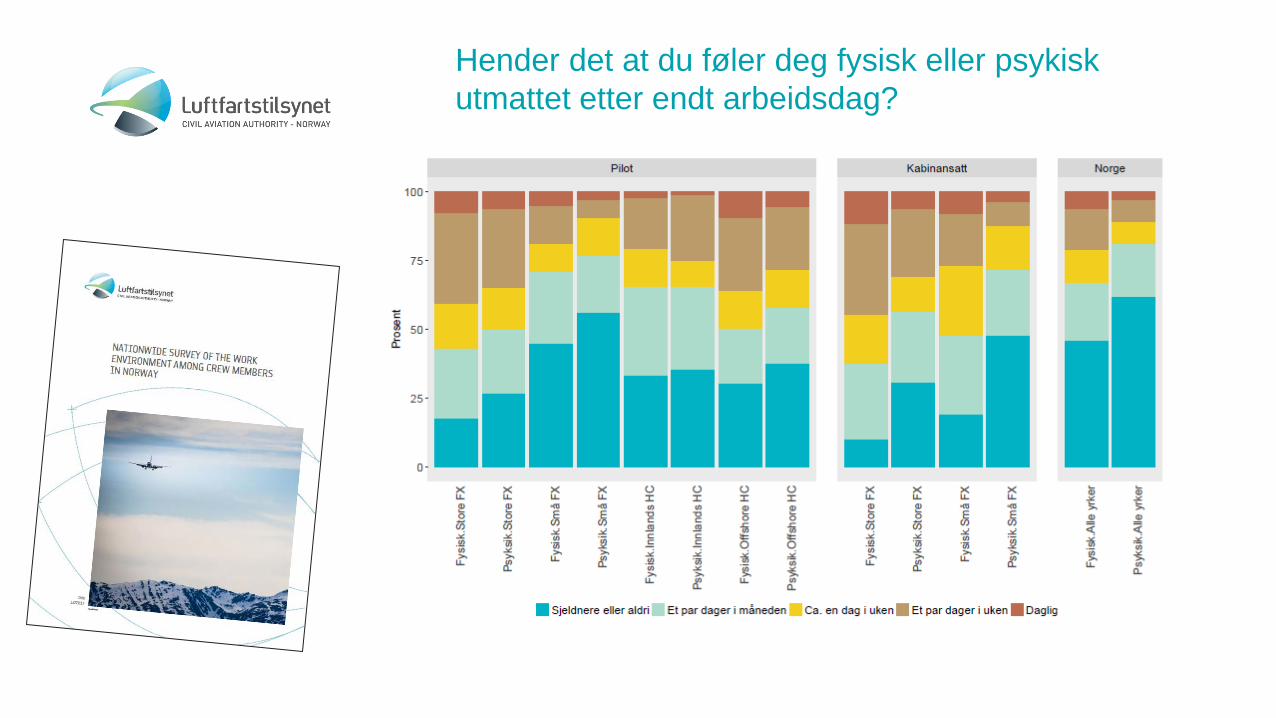
Hender det at du føler deg fysisk eller psykisk utmattet etter endt arbeidsdag?

Sikkerhetsteam - Fatigue
• Safety promotion
• Rapportering
• Fokuserte FTL inspeksjoner
• Regelverksutvikling


*Hazard identification
*Safety risk assessment and mitigation


Ross Philips (PhD)
Prof Stian Antonsen (PhD)Tor-Erik Evjemo (PhD)
Dr Trond-Eirik Strand
Capt Stein Arne Lien
Project team – Trippel helix
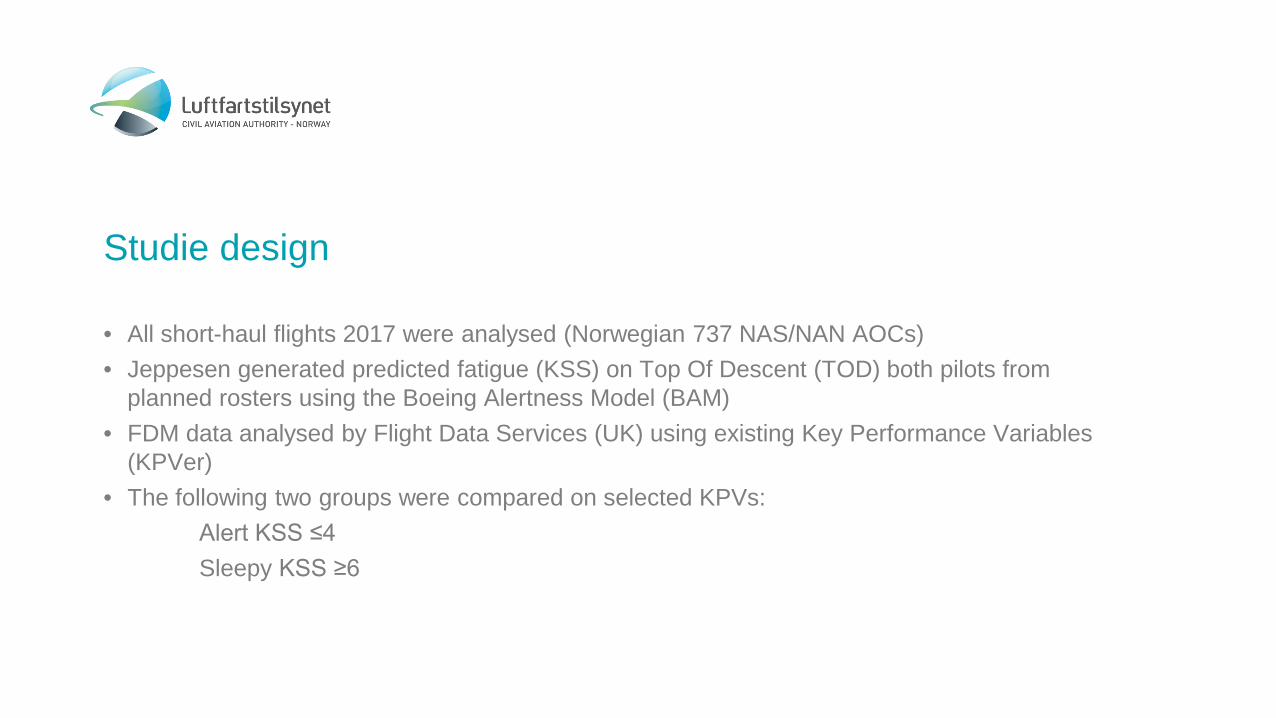
Studie design
• All short-haul flights 2017 were analysed (Norwegian 737 NAS/NAN AOCs)• Jeppesen generated predicted fatigue (KSS) on Top Of Descent (TOD) both pilots from
planned rosters using the Boeing Alertness Model (BAM)• FDM data analysed by Flight Data Services (UK) using existing Key Performance Variables
(KPVer) • The following two groups were compared on selected KPVs:
Alert KSS ≤4 Sleepy KSS ≥6

Data
103 247 flights8 412 KSS ≥617 149 KSS ≤4

KSS TOD vs. flight leg
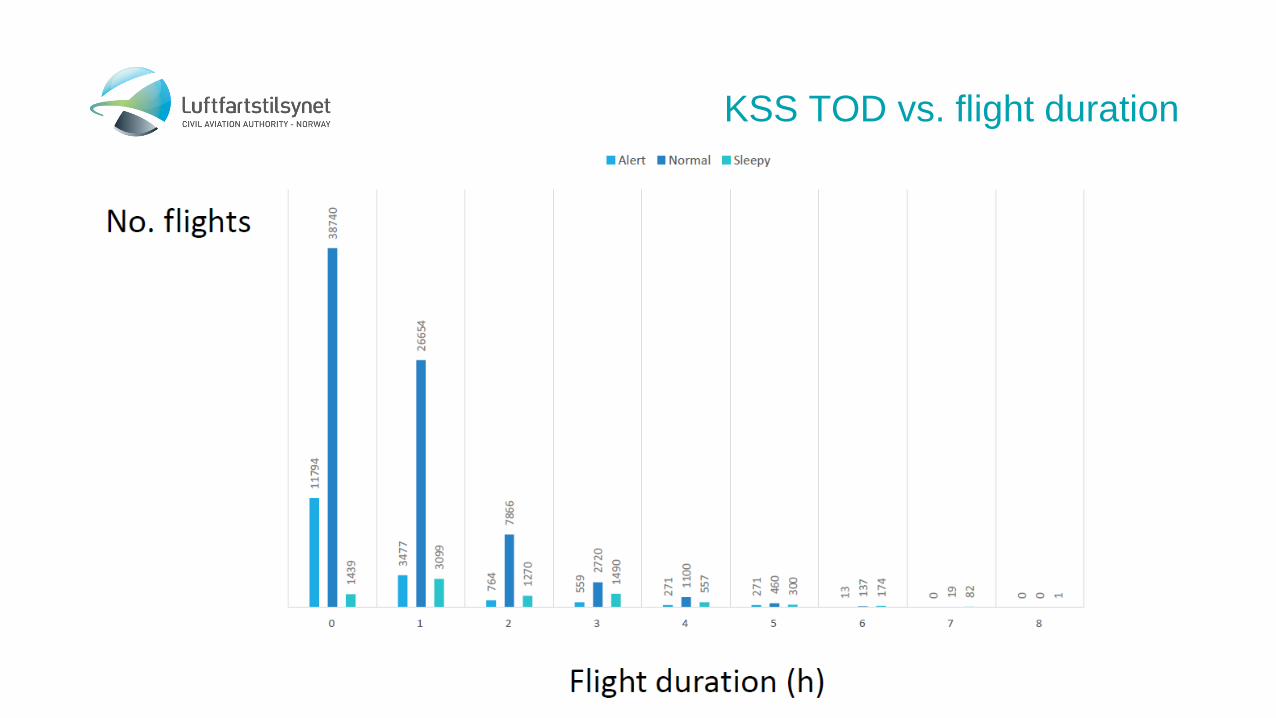
KSS TOD vs. flight duration

KSS TOD vs. night / day

KSS TOD vs. sommer / vinter

KSS TOD vs. arrival airport

Alert mean = 1,81Sleepy mean = ,38ES = ,42p << ,001
Landing performance
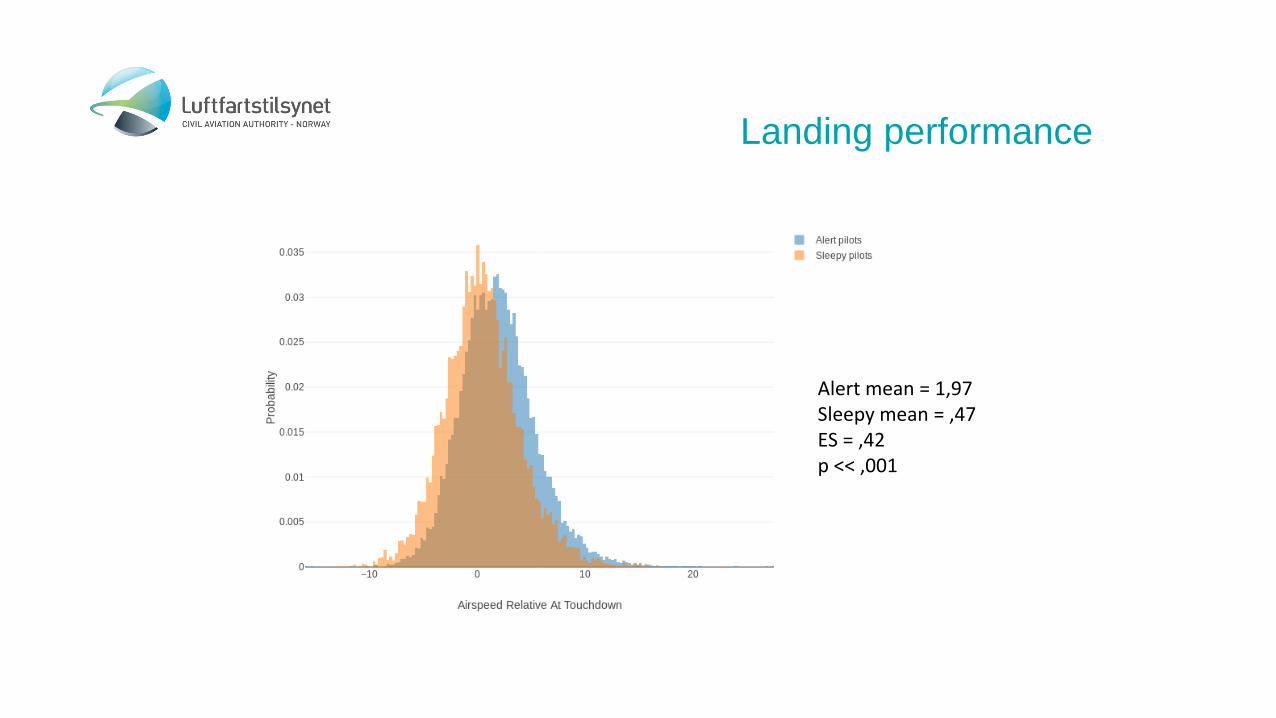
Alert mean = 1,97Sleepy mean = ,47ES = ,42p << ,001
Landing performance

Alert mean = 297Sleepy mean = 315ES = ,21p << ,001
Landing performance

Hard landings
Alert mean = 1,43Sleepy mean = 1,45ES = ,18p << ,001
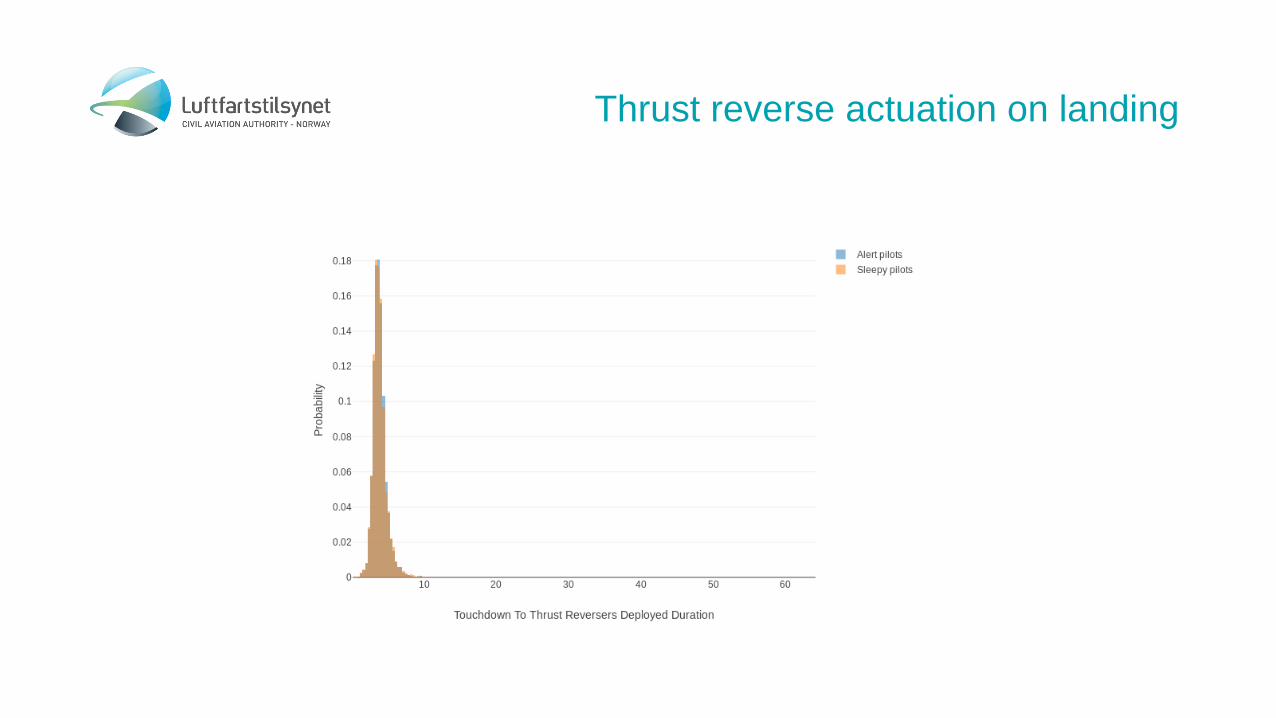
Thrust reverse actuation on landing

AP disengage altitude during approach
Alert mean = 990Sleepy mean = 905ES = ,11p << ,001
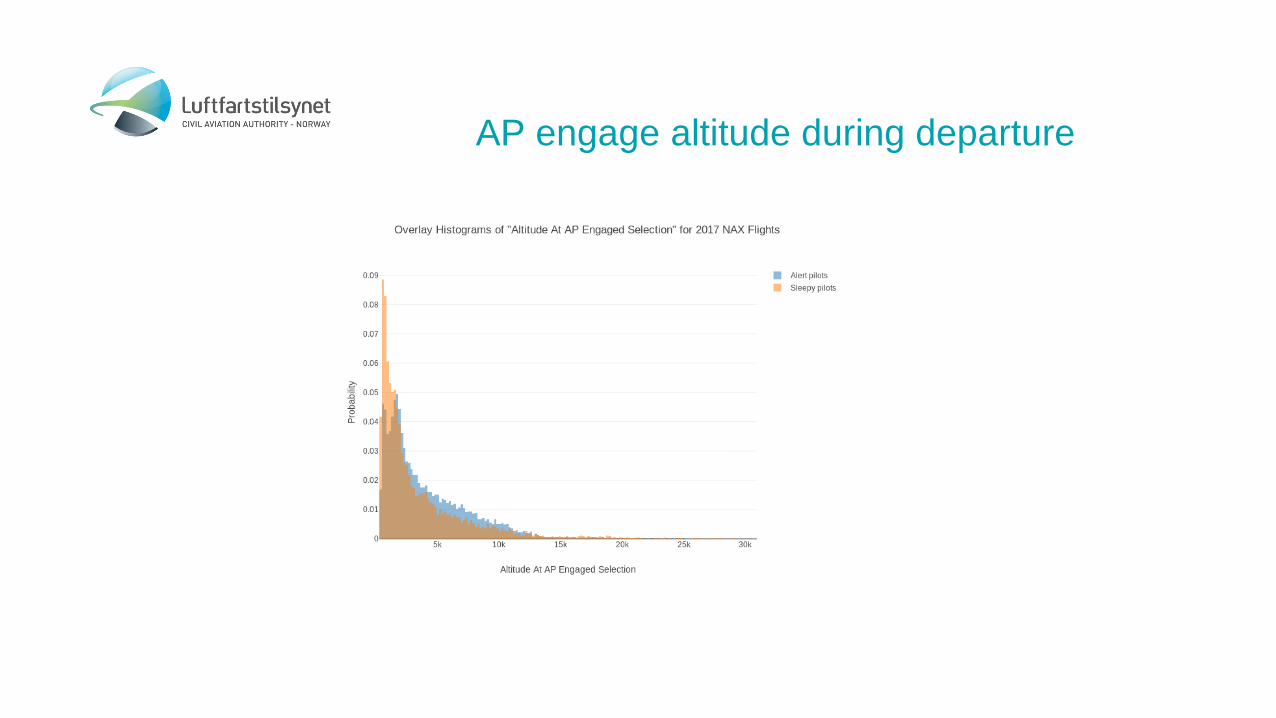
AP engage altitude during departure

Speed at Flap extension – Flap 1
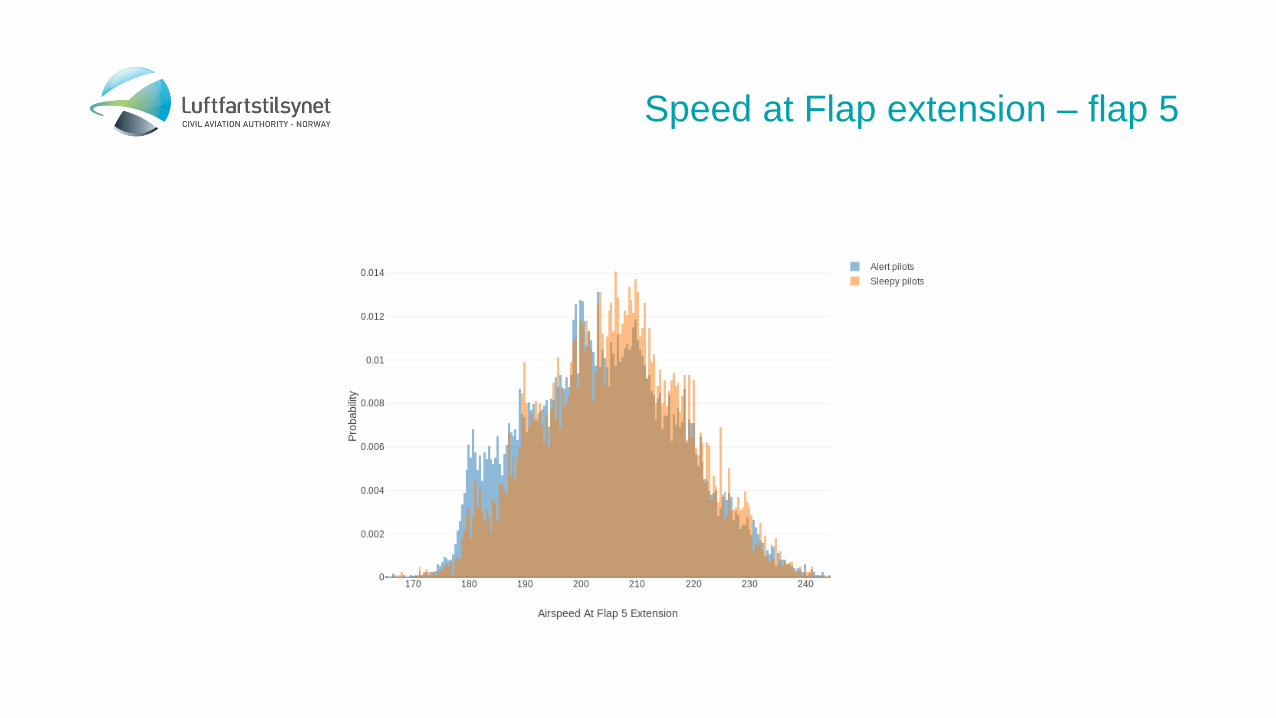
Speed at Flap extension – flap 5
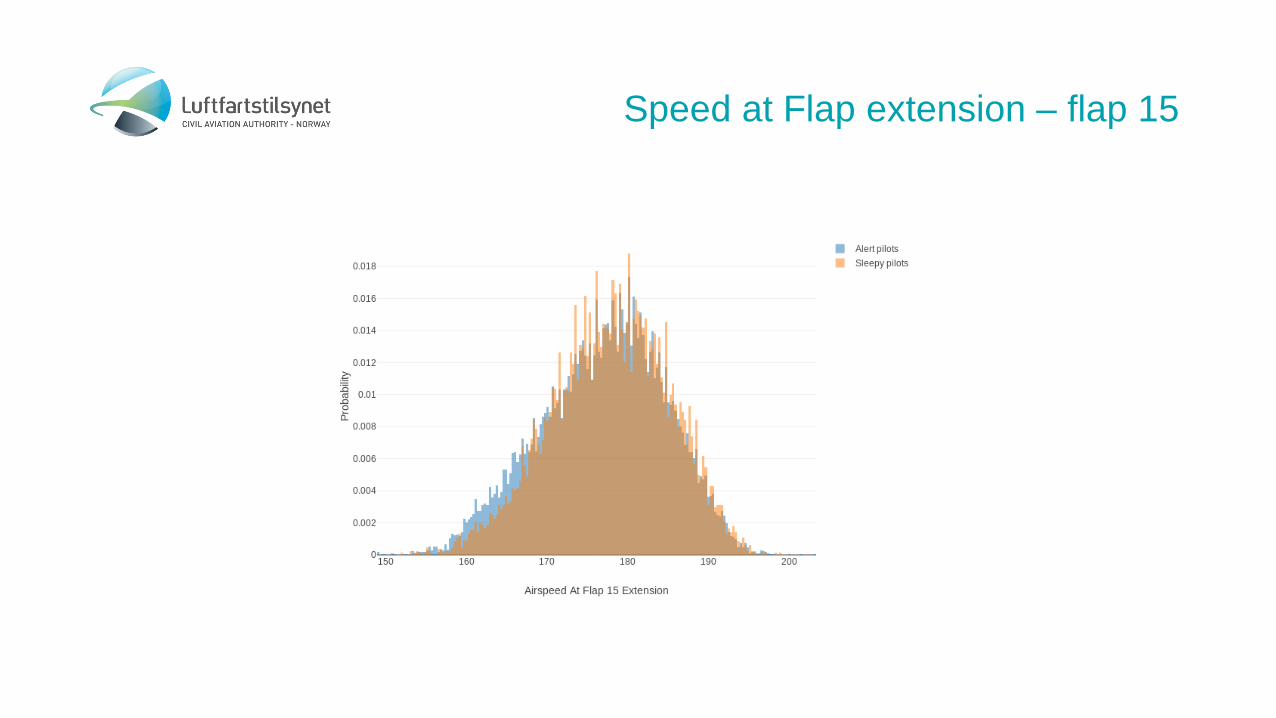
Speed at Flap extension – flap 15

Speed at Flap extension – flap 30

Fuel burn descend

Fuel quantity at shutdown

Fuel burn taxi in
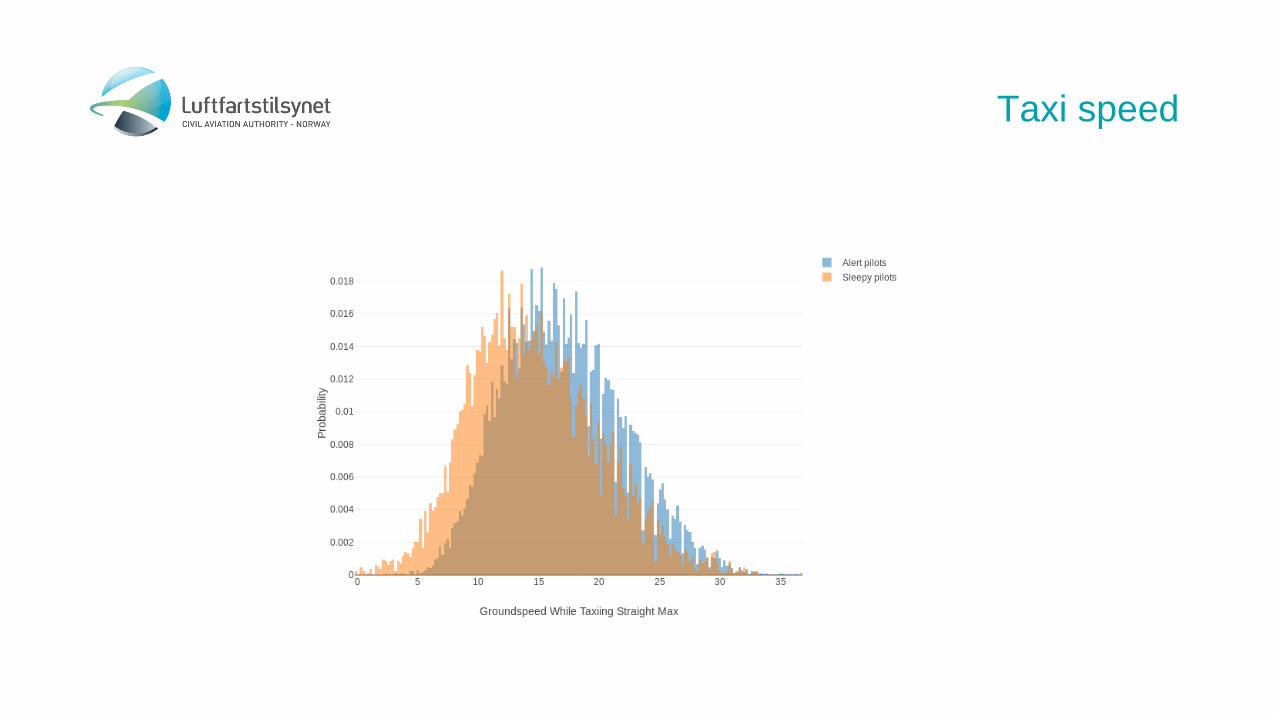
Taxi speed

KonklusjonerDet er indikasjoner på forskjeller i pilot performance som skyldes fatige vedrørende
• Approach• Landing• Autopilot use• Taxi speed• Flap extension speed• Fuel use
Dette kan ha en betydning for sikkerhetsytelse, produktivitet og miljø

Veien videre


Luftfartstilsynet
T: +47 75 58 50 00F: +47 75 58 50 [email protected]
Postadresse:Postboks 2438001 BODØ
Besøksadresse:Sjøgata 45-478006 Bodø