Embed Size (px)
Citation preview
Measuring the Fluid Flow Velocity and Its Uncertainty Using Monte Carlo Method and Ultrasonic Technique
AHMAD S. AWAD1, ZAID ABULGHANAM1, SAYEL M. FAYYAD1, SAMEH ALSAQOOR2, ALI ALAHMER2,3, NADER ALJABARIN4, PIOTR PIECHOTA5, ARTUR
ANDRUSZKIEWICZ5, WIESŁAW WĘDRYCHOWICZ5 AND PIOTR SYNOWIEC5
1 Mechanical Engineering Department, Faculty of Engineering Technology, Al-Balqa` Applied
University, Amman-Jordan, (corresponding author, Email: [email protected]). 2 Department of Mechanical Engineering, Faculty of Engineering, Tafila Technical University, P.O.
Box 179, Tafila 66110, JORDAN 3 Department of Alternative Energy Technology, Faculty of Engineering and Technology, Al-
Zaytoonah University, P.O. Box 130, Amman 11733, JORDAN 4 Department of Natural Resources and Chemical Engineering, Faculty of Engineering, Tafila
Technical University, P.O. Box 179, Tafila 66110, JORDAN, 5 Wrocław University of Science and Technology, Wybrzeże Stanisława Wyspiańskiego 27, 50-370
Wrocław, POLAND
Abstract: One of the most important challenges in fluid mechanics, gas dynamics, and hydraulic
machinery fields is measuring the flow velocity with high accuracy. It is more important in large
systems; such as thermal power stations, large scale power generations, and combined cycle
power plants. The exact estimation of the measurement uncertainty inflow velocity is extremely
importantin evaluating the accuracy of the measurement. This work describes the problem of
estimating measurement uncertainty when there are two or more dominant components of the
uncertainty budget.Two methods, analytical and numerical methods are used to study the
comparative analysis for the results of determining the expanded uncertainty of measurement
using two methods: analytical method and the numerical method. The analytical method uses
the law of uncertainty propagation and is based on the estimation of uncertainty values of type A
and B, while the numerical technique depends on the evaluation of measured samples by the
Monte Carlo method using a random number generator. The aim of this article is to show the
Monte Carlo method as an alternative way to determine the distribution of individual
components of the measurement uncertainty budget. Also, the measurement of liquid flow
velocity by an ultrasonic method has been analyzed, which is commonly used due to high
measurement accuracy and non-invasiveness. Due to the complexity of the equation defining
the measured flow velocity, determining the measurement uncertainty is not an easy task.
Keywords: Measurement Uncertainty, Monte Carlo Method, Flow Measurement, Ultrasonic
Flow Meter.
Received: June 1, 2020. Revised: October 13, 2020. Accepted: October 21, 2020. Published October 31, 2020
WSEAS TRANSACTIONS on FLUID MECHANICS DOI: 10.37394/232013.2020.15.17 Ahmad S. Awad et al.
E-ISSN: 2224-347X 172 Volume 15, 2020
NOMUNECULTURE
𝛿𝑑𝑒𝑣 – Maximum device error, m/s 𝛿𝑔1, 𝛿𝑔2 – Error components, m/s 𝛿𝑖𝑛𝑠𝑡 – Maximum mounting error, m/s 𝛿𝑚𝑒𝑠 – Border error, m/s 𝛿𝑢(𝑣) – Relative uncertainty of fluid flow velocity measurement, m/s 𝑘 – Extension factor- 𝑃 – Trust level, % 𝑅𝑒 – Reynolds number, - 𝑢(𝑣) – Standard uncertainty of fluid flow velocity, m/s 𝑈(𝑣) – Expanded uncertainty of fluid flow velocity, m/s v – Fluid flow velocity, m/s 𝑣𝑚𝑒𝑠 – Estimate of the measured fluid flow velocity, m/s
1 Introduction
The exact measuring of a velocity flow in
many applications is one of the most important issues in fluid mechanics, gas dynamics, hydraulic machines, and medical device technology [1]. Fluid flow velocity is considered one a key parameters of flow characteristic that should be measured with high accuracy [2]. Determination of the average flow velocity with precise values allows the calculation of the flow rate to create the thermal equilibrium for machines and systems. Flow measurements play a significant rule in large systems; such as thermal power stations, large scale power generations, and combined cycle power plants. In many cases, the mass flow rates of steam and cooling water reaches 100 kg/s. With these high flow rates, it is important to ensure a high possible measuring accuracy. Another important problem is the meter assembly and its effect on the operation of the entire installation, since in most measuring methods used, it is necessary to stop the pipeline in order to install the measuring device. Several measuring methods are used to measure the flow velocity and evaluate the uncertainty of the fluid flow-rate or its quantity in the measurements. The ultrasonic flow velocity measurement technique is widely used in industrial and technical measurements due to its high accuracy and non-contact type of flow measurement [3]. Measurement of flow velocity using the Transit-time method with pipeline heads does not require stopping the pipeline and interfering with its geometry. This is a great advantage compared to other
commonly used measurement methods, such as the constrictive method. Manufacturers of ultrasonic flow meters declare device accuracy at 2% of the measured value. Achieving device accuracy below 1% of the measured value is only possible for multi-way flow meters [4]. An important condition for maintaining the declared accuracy of measurement is the installation of the flow meter heads while maintaining the straight pipe sections required in the standards [5].
This paper presents the issue of estimating measurement uncertainty when there are two or more dominant components of the uncertainty budget for liquid flow velocity using both the analytical and the Monte Carlo simulation methods. Also, to show that the Monte Carlo method represents an alternative way to determine the distribution of individual components of the measurement uncertainty budget.
2 Implementation of the Measuring Process
Flow meters were used to perform the
measurements. The heads of the Endress and Hauser Proline Prosonic Flow 93T ultrasonic flow meter was used. It is designed for temporary monitoring and test measurements with clamp-on sensors. Moreover, conducting verification measurements at existing flow metering points with temperatures ranging from –40 to +170 °C. Generally, the flow meter mounted on a straight section of the pipeline, maintaining the required distance from the elements to avoid disturbance in the flow. The
WSEAS TRANSACTIONS on FLUID MECHANICS DOI: 10.37394/232013.2020.15.17 Ahmad S. Awad et al.
E-ISSN: 2224-347X 173 Volume 15, 2020
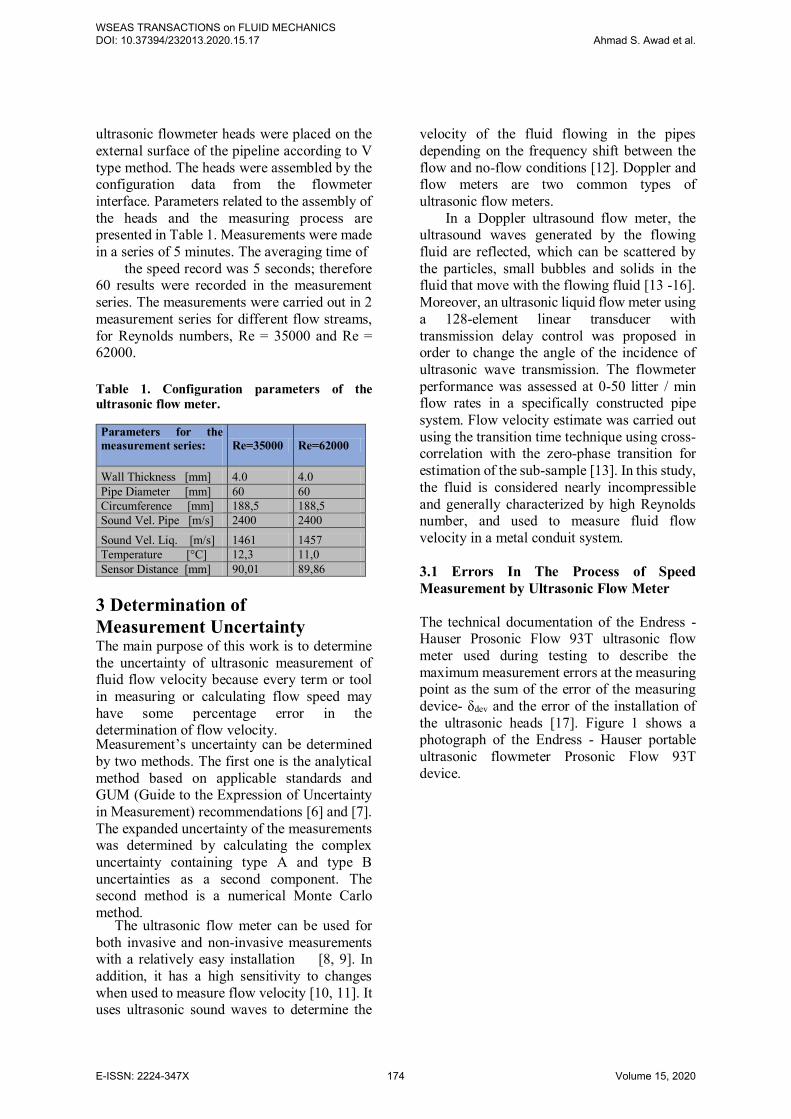
ultrasonic flowmeter heads were placed on the external surface of the pipeline according to V type method. The heads were assembled by the configuration data from the flowmeter interface. Parameters related to the assembly of the heads and the measuring process are presented in Table 1. Measurements were made in a series of 5 minutes. The averaging time of
the speed record was 5 seconds; therefore 60 results were recorded in the measurement series. The measurements were carried out in 2 measurement series for different flow streams, for Reynolds numbers, Re = 35000 and Re = 62000.
Table 1. Configuration parameters of the ultrasonic flow meter.
3 Determination of Measurement Uncertainty The main purpose of this work is to determine the uncertainty of ultrasonic measurement of fluid flow velocity because every term or tool in measuring or calculating flow speed may have some percentage error in the determination of flow velocity. Measurement’s uncertainty can be determined by two methods. The first one is the analytical method based on applicable standards and GUM (Guide to the Expression of Uncertainty in Measurement) recommendations [6] and [7]. The expanded uncertainty of the measurements was determined by calculating the complex uncertainty containing type A and type B uncertainties as a second component. The second method is a numerical Monte Carlo method.
The ultrasonic flow meter can be used for both invasive and non-invasive measurements with a relatively easy installation [8, 9]. In addition, it has a high sensitivity to changes when used to measure flow velocity [10, 11]. It uses ultrasonic sound waves to determine the
velocity of the fluid flowing in the pipes depending on the frequency shift between the flow and no-flow conditions [12]. Doppler and flow meters are two common types of ultrasonic flow meters. In a Doppler ultrasound flow meter, the ultrasound waves generated by the flowing fluid are reflected, which can be scattered by the particles, small bubbles and solids in the fluid that move with the flowing fluid [13 -16]. Moreover, an ultrasonic liquid flow meter using a 128-element linear transducer with transmission delay control was proposed in order to change the angle of the incidence of ultrasonic wave transmission. The flowmeter performance was assessed at 0-50 litter / min flow rates in a specifically constructed pipe system. Flow velocity estimate was carried out using the transition time technique using cross-correlation with the zero-phase transition for estimation of the sub-sample [13]. In this study, the fluid is considered nearly incompressible and generally characterized by high Reynolds number, and used to measure fluid flow velocity in a metal conduit system.
3.1 Errors In The Process of Speed Measurement by Ultrasonic Flow Meter
The technical documentation of the Endress - Hauser Prosonic Flow 93T ultrasonic flow meter used during testing to describe the maximum measurement errors at the measuring point as the sum of the error of the measuring device- δdev and the error of the installation of the ultrasonic heads [17]. Figure 1 shows a photograph of the Endress - Hauser portable ultrasonic flowmeter Prosonic Flow 93T device.
Parameters for the measurement series:
Re=35000 Re=62000
Wall Thickness [mm] 4.0 4.0 Pipe Diameter [mm] 60 60 Circumference [mm] 188,5 188,5 Sound Vel. Pipe [m/s] 2400 2400 Sound Vel. Liq. [m/s] 1461 1457 Temperature [°C] 12,3 11,0 Sensor Distance [mm] 90,01 89,86
WSEAS TRANSACTIONS on FLUID MECHANICS DOI: 10.37394/232013.2020.15.17 Ahmad S. Awad et al.
E-ISSN: 2224-347X 174 Volume 15, 2020
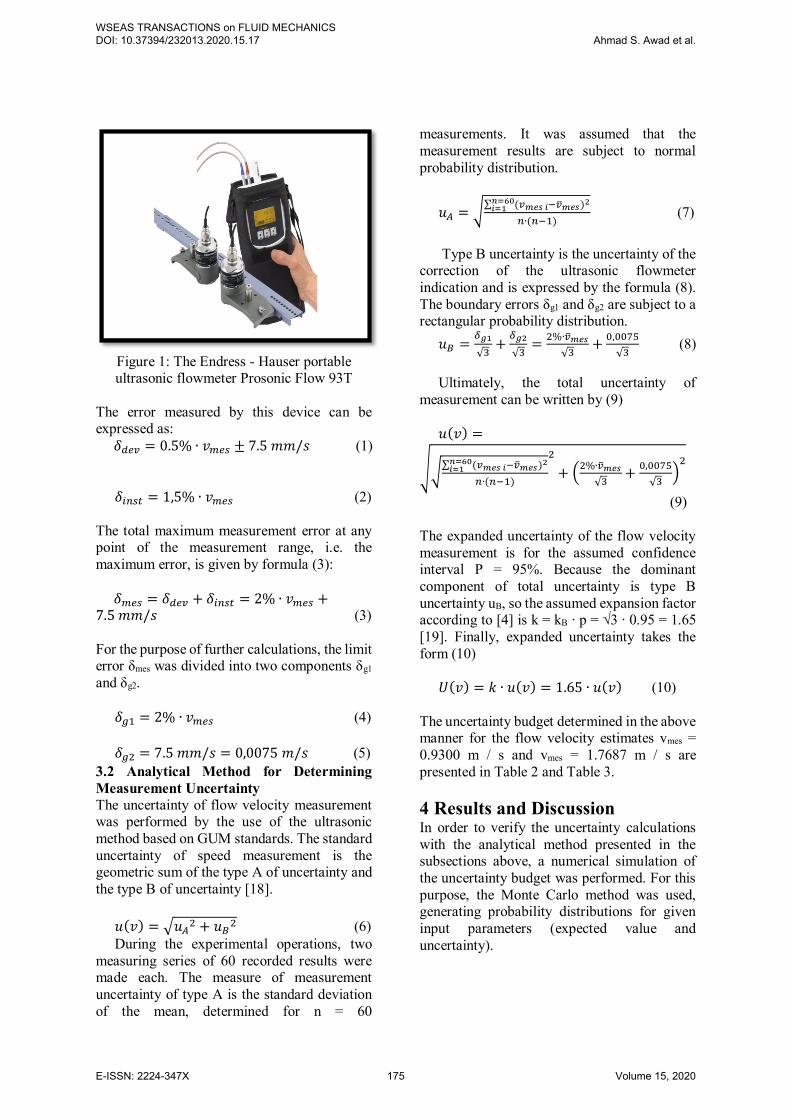
Figure 1: The Endress - Hauser portable ultrasonic flowmeter Prosonic Flow 93T
The error measured by this device can be expressed as:
𝛿𝑑𝑒𝑣 = 0.5% ∙ 𝑣𝑚𝑒𝑠 ± 7.5 𝑚𝑚/𝑠 (1)
𝛿𝑖𝑛𝑠𝑡 = 1,5% ∙ 𝑣𝑚𝑒𝑠 (2)
The total maximum measurement error at any point of the measurement range, i.e. the maximum error, is given by formula (3):
𝛿𝑚𝑒𝑠 = 𝛿𝑑𝑒𝑣 + 𝛿𝑖𝑛𝑠𝑡 = 2% ∙ 𝑣𝑚𝑒𝑠 +7.5 𝑚𝑚/𝑠 (3)
For the purpose of further calculations, the limit error δmes was divided into two components δg1 and δg2.
𝛿𝑔1 = 2% ∙ 𝑣𝑚𝑒𝑠 (4)
𝛿𝑔2 = 7.5 𝑚𝑚/𝑠 = 0,0075 𝑚/𝑠 (5)
3.2 Analytical Method for Determining Measurement Uncertainty The uncertainty of flow velocity measurement was performed by the use of the ultrasonic method based on GUM standards. The standard uncertainty of speed measurement is the geometric sum of the type A of uncertainty and the type B of uncertainty [18].
𝑢(𝑣) = √𝑢𝐴
2 + 𝑢𝐵2 (6)
During the experimental operations, two measuring series of 60 recorded results were made each. The measure of measurement uncertainty of type A is the standard deviation of the mean, determined for n = 60
measurements. It was assumed that the measurement results are subject to normal probability distribution.
𝑢𝐴 = √∑ (𝑣𝑚𝑒𝑠 𝑖−�̅�𝑚𝑒𝑠)2𝑛=60
𝑖=1
𝑛∙(𝑛−1) (7)
Type B uncertainty is the uncertainty of the
correction of the ultrasonic flowmeter indication and is expressed by the formula (8). The boundary errors δg1 and δg2 are subject to a rectangular probability distribution.
𝑢𝐵 =𝛿𝑔1
√3+
𝛿𝑔2
√3=
2%∙�̅�𝑚𝑒𝑠
√3+
0,0075
√3 (8)
Ultimately, the total uncertainty of
measurement can be written by (9) 𝑢(𝑣) =
√√∑ (𝑣𝑚𝑒𝑠 𝑖−�̅�𝑚𝑒𝑠)2𝑛=60
𝑖=1
𝑛∙(𝑛−1)
2
+ (2%∙�̅�𝑚𝑒𝑠
√3+
0,0075
√3)
2
(9)
The expanded uncertainty of the flow velocity measurement is for the assumed confidence interval P = 95%. Because the dominant component of total uncertainty is type B uncertainty uB, so the assumed expansion factor according to [4] is k = kB ∙ p = √3 ∙ 0.95 = 1.65 [19]. Finally, expanded uncertainty takes the form (10)
𝑈(𝑣) = 𝑘 ∙ 𝑢(𝑣) = 1.65 ∙ 𝑢(𝑣) (10)
The uncertainty budget determined in the above manner for the flow velocity estimates vmes = 0.9300 m / s and vmes = 1.7687 m / s are presented in Table 2 and Table 3. 4 Results and Discussion In order to verify the uncertainty calculations with the analytical method presented in the subsections above, a numerical simulation of the uncertainty budget was performed. For this purpose, the Monte Carlo method was used, generating probability distributions for given input parameters (expected value and uncertainty).
WSEAS TRANSACTIONS on FLUID MECHANICS DOI: 10.37394/232013.2020.15.17 Ahmad S. Awad et al.
E-ISSN: 2224-347X 175 Volume 15, 2020
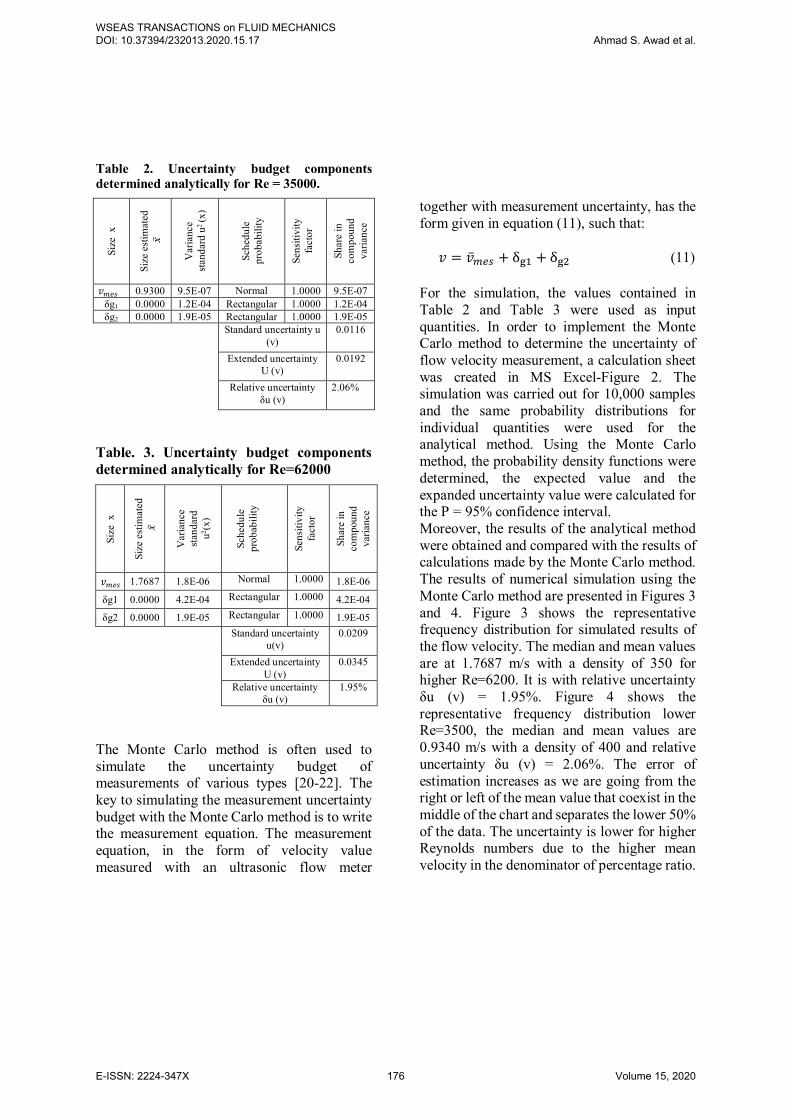
Table 2. Uncertainty budget components determined analytically for Re = 35000.
Size
x
Size
est
imat
ed
𝑥
Var
ianc
e st
anda
rd u
2 (x
)
Sche
dule
pr
obab
ility
Sens
itivi
ty
fact
or
Sh
are
in
com
poun
d va
rianc
e
𝑣𝑚𝑒𝑠 0.9300 9.5E-07 Normal 1.0000 9.5E-07 δg1 0.0000 1.2E-04 Rectangular 1.0000 1.2E-04 δg2 0.0000 1.9E-05 Rectangular 1.0000 1.9E-05
Standard uncertainty u
(v) 0.0116
Extended uncertainty
U (v) 0.0192
Relative uncertainty
δu (v) 2.06%
Table. 3. Uncertainty budget components determined analytically for Re=62000
The Monte Carlo method is often used to simulate the uncertainty budget of measurements of various types [20-22]. The key to simulating the measurement uncertainty budget with the Monte Carlo method is to write the measurement equation. The measurement equation, in the form of velocity value measured with an ultrasonic flow meter
together with measurement uncertainty, has the form given in equation (11), such that:
𝑣 = �̅�𝑚𝑒𝑠 + δg1 + δg2 (11)
For the simulation, the values contained in Table 2 and Table 3 were used as input quantities. In order to implement the Monte Carlo method to determine the uncertainty of flow velocity measurement, a calculation sheet was created in MS Excel-Figure 2. The simulation was carried out for 10,000 samples and the same probability distributions for individual quantities were used for the analytical method. Using the Monte Carlo method, the probability density functions were determined, the expected value and the expanded uncertainty value were calculated for the P = 95% confidence interval. Moreover, the results of the analytical method were obtained and compared with the results of calculations made by the Monte Carlo method. The results of numerical simulation using the Monte Carlo method are presented in Figures 3 and 4. Figure 3 shows the representative frequency distribution for simulated results of the flow velocity. The median and mean values are at 1.7687 m/s with a density of 350 for higher Re=6200. It is with relative uncertainty δu (v) = 1.95%. Figure 4 shows the representative frequency distribution lower Re=3500, the median and mean values are 0.9340 m/s with a density of 400 and relative uncertainty δu (v) = 2.06%. The error of estimation increases as we are going from the right or left of the mean value that coexist in the middle of the chart and separates the lower 50% of the data. The uncertainty is lower for higher Reynolds numbers due to the higher mean velocity in the denominator of percentage ratio.
Size
x
Size
est
imat
ed
𝑥
Var
ianc
e st
anda
rd
u2 (x)
Sche
dule
pr
obab
ility
Sens
itivi
ty
fact
or
Sh
are
in
com
poun
d
varia
nce
𝑣𝑚𝑒𝑠 1.7687 1.8E-06 Normal 1.0000 1.8E-06
δg1 0.0000 4.2E-04 Rectangular 1.0000 4.2E-04
δg2 0.0000 1.9E-05 Rectangular 1.0000 1.9E-05
Standard uncertainty
u(v) 0.0209
Extended uncertainty
U (v) 0.0345
Relative uncertainty
δu (v) 1.95%
WSEAS TRANSACTIONS on FLUID MECHANICS DOI: 10.37394/232013.2020.15.17 Ahmad S. Awad et al.
E-ISSN: 2224-347X 176 Volume 15, 2020
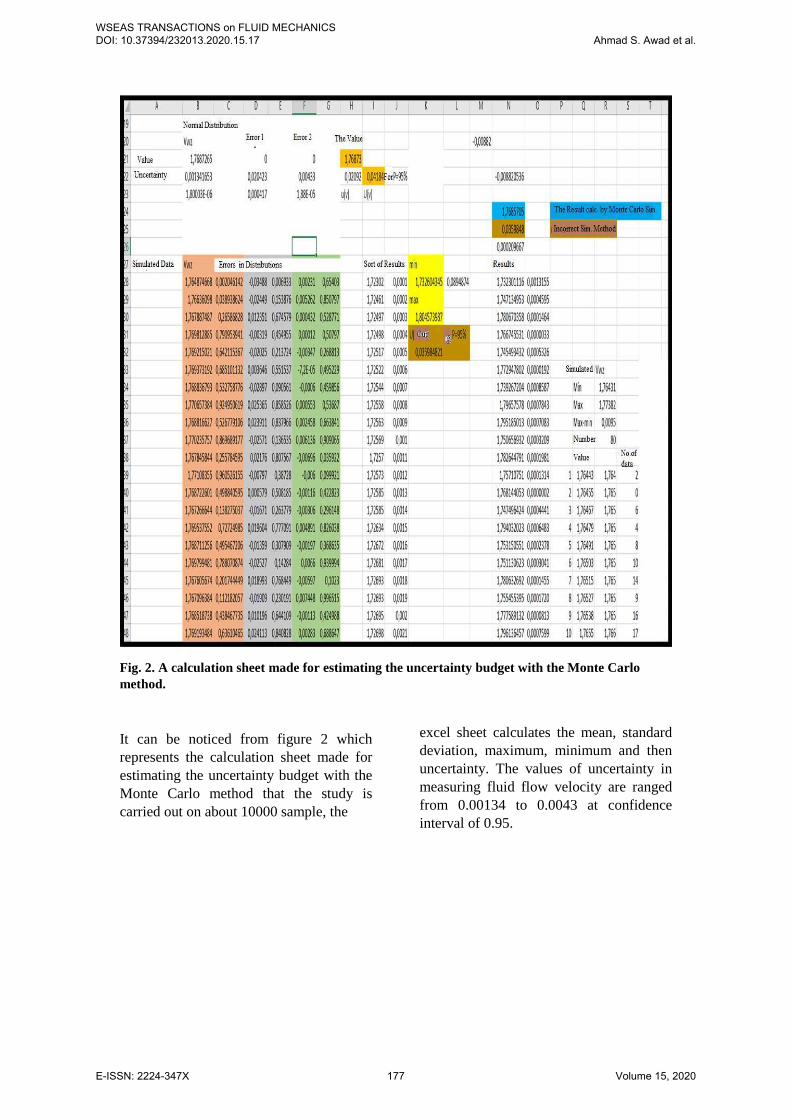
Fig. 2. A calculation sheet made for estimating the uncertainty budget with the Monte Carlo
method.
It can be noticed from figure 2 which
represents the calculation sheet made for
estimating the uncertainty budget with the
Monte Carlo method that the study is
carried out on about 10000 sample, the
excel sheet calculates the mean, standard
deviation, maximum, minimum and then
uncertainty. The values of uncertainty in
measuring fluid flow velocity are ranged
from 0.00134 to 0.0043 at confidence
interval of 0.95.
WSEAS TRANSACTIONS on FLUID MECHANICS DOI: 10.37394/232013.2020.15.17 Ahmad S. Awad et al.
E-ISSN: 2224-347X 177 Volume 15, 2020
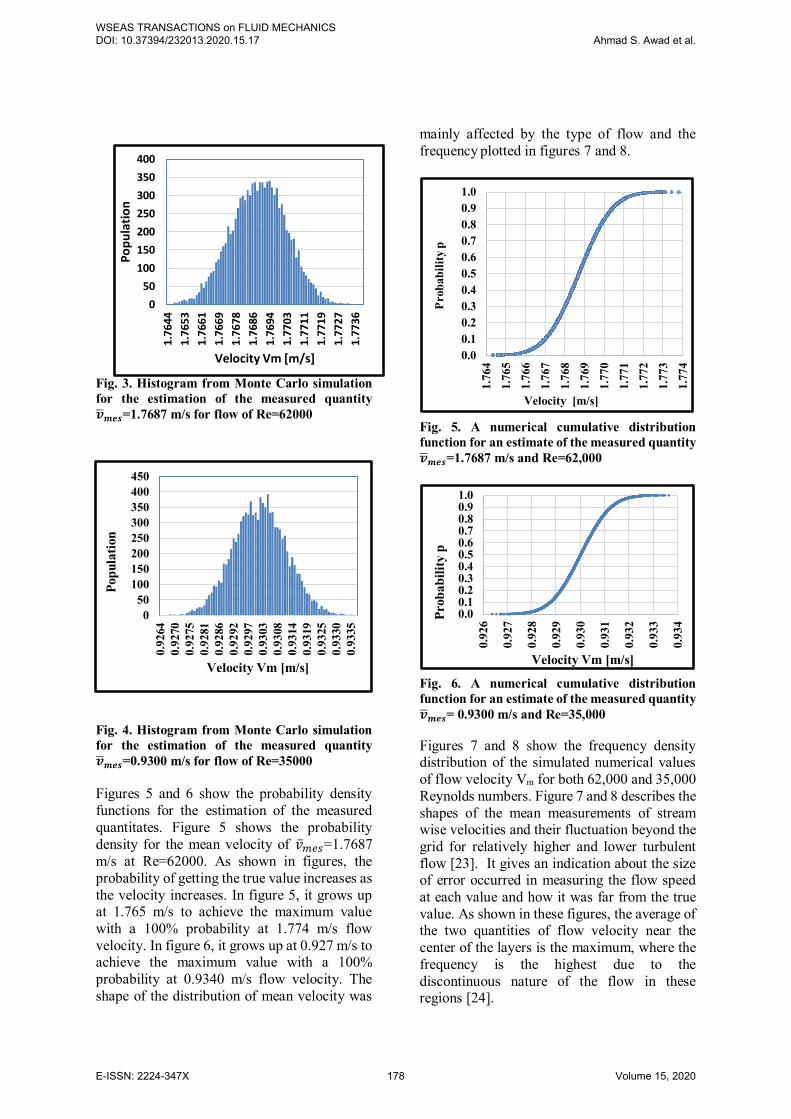
Fig. 3. Histogram from Monte Carlo simulation for the estimation of the measured quantity �̅�𝒎𝒆𝒔=1.7687 m/s for flow of Re=62000
Fig. 4. Histogram from Monte Carlo simulation for the estimation of the measured quantity �̅�𝒎𝒆𝒔=0.9300 m/s for flow of Re=35000 Figures 5 and 6 show the probability density functions for the estimation of the measured quantitates. Figure 5 shows the probability density for the mean velocity of �̅�𝑚𝑒𝑠=1.7687 m/s at Re=62000. As shown in figures, the probability of getting the true value increases as the velocity increases. In figure 5, it grows up at 1.765 m/s to achieve the maximum value with a 100% probability at 1.774 m/s flow velocity. In figure 6, it grows up at 0.927 m/s to achieve the maximum value with a 100% probability at 0.9340 m/s flow velocity. The shape of the distribution of mean velocity was
mainly affected by the type of flow and the frequency plotted in figures 7 and 8.
Fig. 5. A numerical cumulative distribution function for an estimate of the measured quantity �̅�𝒎𝒆𝒔=1.7687 m/s and Re=62,000
Fig. 6. A numerical cumulative distribution function for an estimate of the measured quantity �̅�𝒎𝒆𝒔= 0.9300 m/s and Re=35,000 Figures 7 and 8 show the frequency density distribution of the simulated numerical values of flow velocity Vm for both 62,000 and 35,000 Reynolds numbers. Figure 7 and 8 describes the shapes of the mean measurements of stream wise velocities and their fluctuation beyond the grid for relatively higher and lower turbulent flow [23]. It gives an indication about the size of error occurred in measuring the flow speed at each value and how it was far from the true value. As shown in these figures, the average of the two quantities of flow velocity near the center of the layers is the maximum, where the frequency is the highest due to the discontinuous nature of the flow in these regions [24].
0.00.10.20.30.40.50.60.70.80.91.0
1.76
41.
765
1.76
61.
767
1.76
81.
769
1.77
01.
771
1.77
21.
773
1.77
4
Prob
abili
typ
Velocity [m/s]
0.00.10.20.30.40.50.60.70.80.91.0
0.92
6
0.92
7
0.92
8
0.92
9
0.93
0
0.93
1
0.93
2
0.93
3
0.93
4Prob
abili
ty p
Velocity Vm [m/s]
0
50
100
150
200
250
300
350
4001.
7644
1.76
53
1.76
61
1.76
69
1.76
78
1.76
86
1.76
94
1.77
03
1.77
11
1.77
19
1.77
27
1.77
36
Po
pu
lati
on
Velocity Vm [m/s]
050
100150200250300350400450
0.92
640.
9270
0.92
750.
9281
0.92
860.
9292
0.92
970.
9303
0.93
080.
9314
0.93
190.
9325
0.93
300.
9335
Popu
latio
n
Velocity Vm [m/s]
WSEAS TRANSACTIONS on FLUID MECHANICS DOI: 10.37394/232013.2020.15.17 Ahmad S. Awad et al.
E-ISSN: 2224-347X 178 Volume 15, 2020
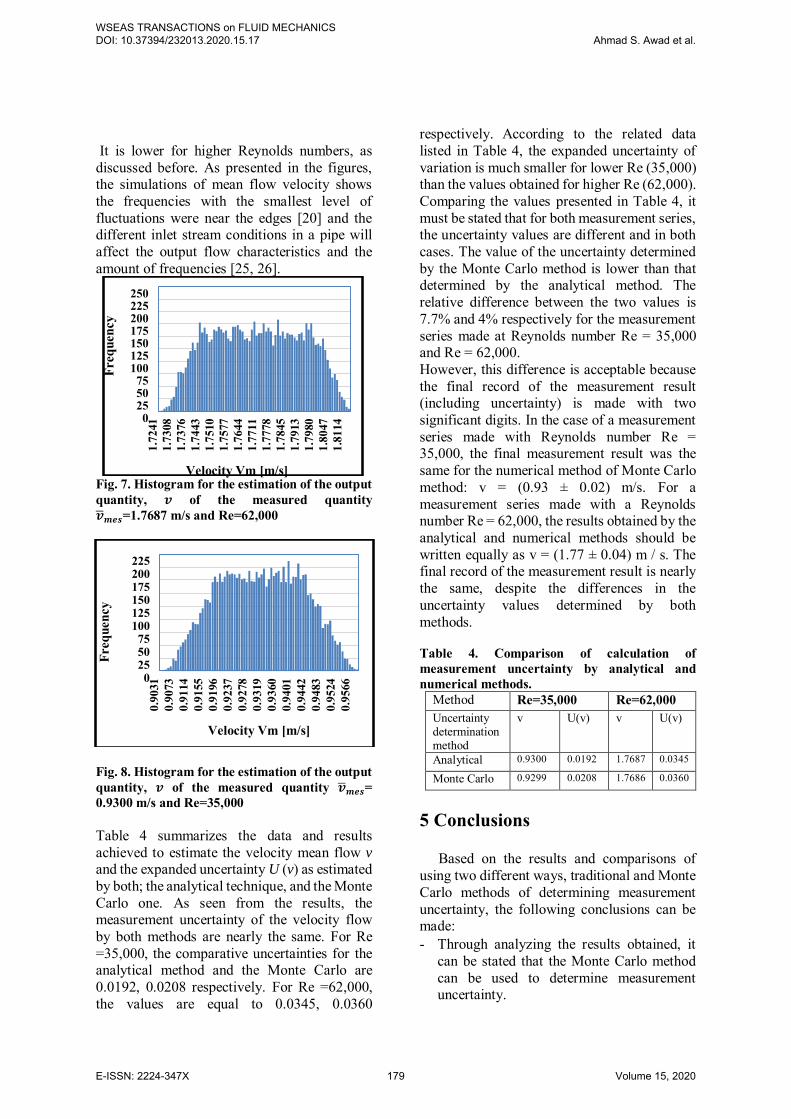
It is lower for higher Reynolds numbers, as discussed before. As presented in the figures, the simulations of mean flow velocity shows the frequencies with the smallest level of fluctuations were near the edges [20] and the different inlet stream conditions in a pipe will affect the output flow characteristics and the amount of frequencies [25, 26].
Fig. 7. Histogram for the estimation of the output quantity, 𝒗 of the measured quantity �̅�𝒎𝒆𝒔=1.7687 m/s and Re=62,000
Fig. 8. Histogram for the estimation of the output quantity, 𝒗 of the measured quantity �̅�𝒎𝒆𝒔= 0.9300 m/s and Re=35,000
Table 4 summarizes the data and results achieved to estimate the velocity mean flow v and the expanded uncertainty U (v) as estimated by both; the analytical technique, and the Monte Carlo one. As seen from the results, the measurement uncertainty of the velocity flow by both methods are nearly the same. For Re =35,000, the comparative uncertainties for the analytical method and the Monte Carlo are 0.0192, 0.0208 respectively. For Re =62,000, the values are equal to 0.0345, 0.0360
respectively. According to the related data listed in Table 4, the expanded uncertainty of variation is much smaller for lower Re (35,000) than the values obtained for higher Re (62,000). Comparing the values presented in Table 4, it must be stated that for both measurement series, the uncertainty values are different and in both cases. The value of the uncertainty determined by the Monte Carlo method is lower than that determined by the analytical method. The relative difference between the two values is 7.7% and 4% respectively for the measurement series made at Reynolds number Re = 35,000 and Re = 62,000. However, this difference is acceptable because the final record of the measurement result (including uncertainty) is made with two significant digits. In the case of a measurement series made with Reynolds number Re = 35,000, the final measurement result was the same for the numerical method of Monte Carlo method: v = (0.93 ± 0.02) m/s. For a measurement series made with a Reynolds number Re = 62,000, the results obtained by the analytical and numerical methods should be written equally as v = (1.77 ± 0.04) m / s. The final record of the measurement result is nearly the same, despite the differences in the uncertainty values determined by both methods. Table 4. Comparison of calculation of measurement uncertainty by analytical and numerical methods.
Method Re=35,000 Re=62,000 Uncertainty determination method
v U(v) v U(v)
Analytical 0.9300 0.0192 1.7687 0.0345
Monte Carlo 0.9299 0.0208 1.7686 0.0360
5 Conclusions
Based on the results and comparisons of
using two different ways, traditional and Monte Carlo methods of determining measurement uncertainty, the following conclusions can be made: - Through analyzing the results obtained, it
can be stated that the Monte Carlo method can be used to determine measurement uncertainty.
0255075
100125150175200225250
1.72
411.
7308
1.73
761.
7443
1.75
101.
7577
1.76
441.
7711
1.77
781.
7845
1.79
131.
7980
1.80
471.
8114
Freq
uenc
y
Velocity Vm [m/s]
0255075
100125150175200225
0.90
310.
9073
0.91
140.
9155
0.91
960.
9237
0.92
780.
9319
0.93
600.
9401
0.94
420.
9483
0.95
240.
9566
Freq
uenc
y
Velocity Vm [m/s]
WSEAS TRANSACTIONS on FLUID MECHANICS DOI: 10.37394/232013.2020.15.17 Ahmad S. Awad et al.
E-ISSN: 2224-347X 179 Volume 15, 2020
- It is enables a graphical representation of the probability distributions of individual variables included in the measurement equation. However, one should remember about the necessity to verify the obtained measurement uncertainty value with the uncertainty value calculated on the basis of types A and B, in accordance with GUM standards.
- In the analyzed calculation example, the final record of the measurement results, with the recommended accuracy of 2 significant digits, is the same for both methods of determining uncertainty.
References
[1] Hua-yong Yang, Min Pan, (2015), Engineering research in fluid power: a review, Journal of Zhejiang University-SCIENCE A (Applied Physics & Engineering), Vol. 16, No. 6, pp.:427-442.
DOI: 10.1631/jzus.A1500042 [2] Anna Golijanek-Jędrzejczyka, Dariusz
Świsulskia, Robert Hanusb, Marcin Zychc, Leszek Petrykad, (2018). Uncertainty of the liquid mass flow measurement using the orifice plate, Flow Measurement and Instrumentation Vol. 62, pp. 84–92. https://doi.org/10.1016/j.flowmeasinst.2018.05.012
[3] Rajita G., Nirupama Mandal, (2016), Review on transit time ultrasonic flowmeter, (2016), 2nd International Conference on Control, Instrumentation, Energy & Communication (CIEC), 28-30 Jan. 2016, IEEE, Kolkata, India. DOI: 10.1109/CIEC.2016.7513740
[4] Waluś Stanisław, (2017), Ultrasonic measurements of single-phase flows downstream of a pipe bend, Electronics: structures, technologies, applications, Vol. 58, No. 6, pp. 44-46. http://yadda.icm.edu.pl/yadda/element/bwmeta1.element.baztech-3934c437-43c5-42b3-a71f-019f20a73a7e
[5] Piechota P., Synowiec P., Andruszkiewicz A., Wędrychowicz W. (2018), Selection of the relevant turbulence model in a CFD simulation of a flow disturbed by
hydraulic elbow: comparative analysis of the simulation with measurements results obtained by the ultrasonic flowmeter, Journal of Thermal Science. Vol. 27, No. 5, pp. 413-420. DOI: 10.1007/s11630-018-1034-z
[6] Evaluation of measurement data, GUM, (2008), Guide to the expression of uncertainty in measurement, ISO 1995. First edition September 2008. https://www.bipm.org/utils/common/documents/jcgm/JCGM_100_2008_E.pdf
[7] Dimitrios Theodoroua, Loukia Meligotsidou, Sotirios Karavoltsos, Apostolos Burnetas, Manos Dassenakis, Michael Scoullos, (2011), Comparison of ISO-GUM and Monte Carlo methods for the evaluation of measurement uncertainty: Application to direct cadmium measurement in water by GFAAS, Talanta Vol. 83, pp. 1568–1574. doi:10.1016/j.talanta.2010.11.059
[8] Tsukada, K.; Tsuzuki, N.; Kikura, H., (2015), A Study of Air-coupled Ultrasonic Flowmeter Using Beam Focusing. Energy Procedia, Vol. 71, pp. 352–359. doi.org/10.1016/j.egypro.2014.11.888
[9] Mandard, E.; Kouame, D.; Battault, R.; Remenieras, J., Patat, F., (2008), Methodology for developing a high-precision ultrasound flow meter and fluid velocity profile reconstruction. IEEE Trans. Ultrason. Ferroelectr. Freq. Control, Vol. 55, pp. 161–172. DOI: 10.1109/tuffc.2008.625
[10] Tsukada, K.; Kikura, H. Flowrate, (2016), Measurement on Metal Pipes by Air-coupled Ultrasound. International Journal of Computational Methods and Experimental Measurements, Vol. 4, No. 4, pp. 583–593. DOI: 10.2495/CMEM-V4-N4-583-593
[11] Woodcock, J. P., (1975), Development of the ultrasonic flowmeter. Ultrasound in Medicine & Biology, Volume 2, No. 1, pp. 11-18 Doi.org/10.1016/0301-5629 (75)90036-8
[12] Lynnworth, L.C.; Liu, Y., (2006), Ultrasonic flowmeters: Half-century
WSEAS TRANSACTIONS on FLUID MECHANICS DOI: 10.37394/232013.2020.15.17 Ahmad S. Awad et al.
E-ISSN: 2224-347X 180 Volume 15, 2020
progress report, 1955–2005. Ultrasonis, Vol. 44, pp. e1371–e1378.
Doi.org/10.1016/j.ultras.2006.05.046 [13] Nguyen T. H. and Park S., (2020). Multi-
Angle Liquid Flow Measurement Using Ultrasonic Linear Array Transducer. Sensors 2020, Vol. 20, No. 2, pp. 388. Doi.org/10.3390/s20020388
[14] Kotrasová K., (2018). Dynamic behavior of fluid rectangular container, International Journal of Mechanics Volume 12, 2018. https://www.naun.org/main/NAUN/mechanics/2018/a422003-213.pdf
[15] Opanuga A.A., Agboola O.O., Okagbue H. I., Olanrewaju A.M., ( 2018), Hall Current and Ion-Slip Effects on the Entropy Generation of Couple Stress Fluid with Velocity Slip and Temperature Jump. International Journal of Mechanics Volume 12, 2018. https://www.naun.org/main/NAUN/mechanics/2018/a562003-abr.pdf
[16] Abiodun A. Opanuga, Hilary I. Okagbue, Olasunmbo O. Agboola1, Sheila A. Bishop. (2018). Second Law Analysis of Ion Slip Effect on MHD Couple Stress Fluid. International Journal of Mechanics Volume 12, 2018. https://www.naun.org/main/NAUN/mechanics/2018/a262003-049.pdf
[17] Endress & Hauser, Operating Instruct-ions Proline Prosonic Flow 93T Portable HART, BA00070D/06/EN/13.11711343 82, Valid as of version V 2.02.XX (Device software), pp. 1-132 https://www.instrumart.com/assets/EH-Proline-Prosonic-Flow-93C-HART-manual.pdf
[18] Lisowski M. Rozdział Lisowski M, (2011). Chapter 7 "Approximate methods for calculating the uncertainty of indirect measurements" in the book "Measurement uncertainty in theory and practice", Central Office of Measures, Warsaw 2011. ISBN 978-83-906546-8-3.7
[19] Turzeniecka D., (2005), "Assessment of uncertainty of measurement result", LAB Laboratories, Apparatus, Research, Vol. 10, No. 1, pp. 35-39.
https://yadda.icm.edu.pl/baztech/element/bwmeta1.element.baztech-article-LOD3-0007-0006
[20] Fotowicz P., (2010), Calculation of measurement uncertainty in accordance with the definition of the extension range on the example of developing a micrometer calibration result, Measurements. Automation. Robotics, Vol. 14, No. 10, pp. 48—52, file:///C:/Users/User/Downloads/Fotowicz-PAR%2010%202010.pdf
[21] Prorok M. Makal J., (2017), Application of the Monte Carlo method to determine the measurement uncertainty of the optical power of a semiconductor emitter, Scientific Papers of the Faculty of Electrical and Control Engineering, Gdańsk University of Technology, Vo. 54, pp. 187-190. file:///C:/Users/User/Downloads/ZN_WEiAPG_54_39.pdf
[22] Hussainov M., Kartushinsky A., Kohnen G., Sommerfeld M, (1999), Experimental research of modification of grid-turbulence by rough particles, Proceedings of the 4th International Symposium on Engineering Turbulence Modelling and Measurements; Ajaccio, Corsica, France, 24–26 May, 1999, pp. 933-942. https://doi.org/10.1016/B978-008043328-8/50090-4
[23] Dzwonkowski A. Golijanek-Jędrzejczyk A. Rafiński, L., (2013), Estimation of skin temperature measurement uncertainty by Monte Carlo method, Scientific Papers of the Faculty of Electrical and Control Engineering, Gdańsk University of Technology, Vol. 34, pp. 21-24.
[24] Sheikhi M. R. H., Givi P. and Pope S. B., (2009), Frequency-velocity-scalar filtered mass density function for large eddy simulation of turbulent flows, Physics of Fluids, Vol. 21, 075102 (2009), pp. 1-14. Doi.org/10.1063/1.3153907
[25] Jiann-Lin Chen, (2017), Frequency characteristics of a vortex flowmeter in various inlet velocity profiles, Advances
WSEAS TRANSACTIONS on FLUID MECHANICS DOI: 10.37394/232013.2020.15.17 Ahmad S. Awad et al.
E-ISSN: 2224-347X 181 Volume 15, 2020
in Mechanical Engineering, Vol. 9, No. 3, pp. 1–14. Doi.org/10.1177/1687814017690507
[26] Chun Sejong, Kwon Hyu-Sang, (2011), Use of wigner-ville transformations for fluid particles in laser Doppler flow accelerometer, ASME- JSME- KSME 2011 Joint Fluids Engineering Conference: Volume 1, Symposia – Parts A, B, C, and D, July 24–29, 2011, Hamamatsu, Japan, Paper No: AJK2011-16021, pp. 2945-2953. https://doi.org/10.1115/AJK2011-16021
Creative Commons Attribution License 4.0 (Attribution 4.0 International, CC BY 4.0) This article is published under the terms of the Creative Commons Attribution License 4.0 https://creativecommons.org/licenses/by/4.0/deed.en_US
WSEAS TRANSACTIONS on FLUID MECHANICS DOI: 10.37394/232013.2020.15.17 Ahmad S. Awad et al.
E-ISSN: 2224-347X 182 Volume 15, 2020