Embed Size (px)
Citation preview

3MEASURING THE FREQUENCYOF REGULAR BEHAVIORS:COMPARING THE ‘‘TYPICALWEEK’’ TO THE ‘‘PAST WEEK’’
LinChiat Chang*Jon A. Krosnick*
Social scientists often measure the frequency with which people
perform behaviors executed regularly throughout their daily lives,
but there is no standard approach to this measurement task: some
investigators have asked respondents about their behavior during a
‘‘usual’’ or ‘‘typical’’ day, week, or month, whereas others sought
to describe the same sorts of behavior patterns by asking about the
most recent day, week, or month. This paper compares the validity
of ‘‘typical’’ week and ‘‘past’’ week reports for assessing habitual
behavior patterns using data from the 1989 National Election
Study Pilot, in which respondents were randomly assigned to
report TV news program and newspaper exposure during either
a typical week or the past week. The predictive validity of the
measures was assessed using objective tests of current events
knowledge and identification of political figures, as well as self-
assessments of political knowledge. The typical week questions
consistently manifested superior predictive validity, especially
among the most educated respondents.
Jon Krosnick is University Fellow at Resources for the Future. Theauthors thank Vincent Price, John Robinson, Star Soh, and Allyson Holbrookfor their help. Correspondence regarding this article can be directed to LinChiatChang or Jon A. Krosnick, Department of Psychology, Ohio State University,1885 Neil Avenue, Columbus, OH 43210-1222 (email: [email protected] [email protected]).
*Ohio State University
55

For decades, academic studies, federal government surveys, and com-
mercial researchers have routinely measured the frequency with which
people performed particular behaviors in the course of daily life,
including exercising (e.g., Koivusilta, Rimpela, Rimpela, and Vikat
2001), consuming foods (e.g., Briefel 1994), purchasing consumer
goods (e.g., Urbany and Dickson 1991), recycling (e.g., Domina and
Koch 2002), discussing politics (e.g., Gibson 2001), and much more.
Reports of behavioral frequencies are often the bases of consequential
aggregate statistics gauging unemployment and crime rates, the epi-
demiology of illnesses, neighborhood and community service provi-
sion, transport infrastructure effectiveness, consumer behavior, and
government health resource allocation (for a review, see Conrad,
Brown, and Cashman 1998).
Some studies of behavior frequency have asked respondents
about a specific recent period (e.g., the past day or the past week) with
an explicit interest in the behavior during that time period and no
interest in generalizing those measurements beyond that time period
(e.g., Noel and Cohen 1997; Stoeber and Bittencourt 1998). But
another important goal of research has been to differentiate people
who typically perform a behavior frequently from those who usually
perform it only rarely, with an interest in identifying either the causes
or the consequences of habitual, generalized behavior frequency (e.g.,
Koivusilta et al. 2001; Krosnick and Brannon 1993; Worden and
Flynn 2002). Likewise, in the specialized literature on time use (e.g.,
Gershuny 2000; Robinson 1977; Robinson and Godbey 1997), some
studies have asked respondents about a specific recent period (e.g., the
past day or the past week) with an interest in that specific time period,
but time use researchers also sometimes attempt to differentiate
people who typically spend a lot of time performing a particular
activity from those who usually spend very little time at it (e.g., see
Robinson and Godbey 1997, especially chs. 12–15). This latter goal is
our focus in the present paper—we explore how to maximize question
validity when one seeks to differentiate respondents in terms of typical
behavior frequency.
It might seem obvious that the best measurement approach
given this goal would be asking people how often they typically or
usually perform the behavior, as has been done in such long-term,
highly-respected national surveys such as the General Social Surveys,
the National Longitudinal Surveys, and the Panel Study of Income
56 CHANG AND KROSNICK

Dynamics, as well as in numerous smaller-scale research studies (e.g.,
Koivusilta et al. 2001; Schuler, Richardson, Ochoa, and Wang 2001).
However, some researchers have gauged long-term habitual behavior
frequencies using data from other highly respected and long-running
national surveys (e.g., the National Election Study and the
NHANES) or smaller studies that asked people about behavior dur-
ing a specific recent time period (e.g., Briefel 1994; Krosnick and
Brannon 1993).
In this paper, we explore whether this latter approach is a
reasonable technique for use if one’s goal is to measure habitual
behavior patterns and rank-ordering respondents from people who
never perform a behavior to people who perform it most frequently.
To do so, we analyzed data from an experiment embedded in a
national survey, in which respondents were randomly assigned to
answer questions about either a typical week or the past week, with
a focus on television news program viewing and newspaper reading.
We assessed the predictive validity of these two question formats and
explored whether differences between them varied across multiple
validity criteria and across subgroups of the population.
We begin below with a conceptual analysis of the potential
advantages and disadvantages of the two question forms. Our con-
clusion is that neither questioning approach is clearly preferable on
conceptual grounds alone. We therefore turn to a review of the limited
body of existing evidence comparing these question forms and high-
light the need for further work. Finally, we describe the methods and
findings of our study.
1. A TYPICAL WEEK VERSUS THE PAST WEEK
A great deal of research has explored how people answer questions
about behavioral frequencies (for a review, see Tourangeau, Rips, and
Rasinski 2000). From this literature, we know that people typically
use one of two strategies to estimate a behavioral frequency: episode
enumeration (Sudman and Bradburn 1974) or rate-based estimation
(Eisenhower, Mathiowetz, and Morganstein 1991; Menon 1993;
Menon 1994). People tend to balance effort and accuracy in selecting
response formulation processes, and perceptions of effort and accur-
acy are often determined by the relative accessibility of the information
MEASURING THE FREQUENCY OF REGULAR BEHAVIORS 57

in memory (Blair and Burton 1987; Burton and Blair 1991). People
are especially likely to retrieve and count episodes when the time
frame is very short or very recent; otherwise, rate-based estimation
ismore common (Burton andBlair 1991; Eisenhower et al. 1991; Smith,
Jobe, andMingay 1991). People also tend to make rate-based estimates
when they are asked to make frequency estimates of regular behaviors
(Menon 1994).
For people who perform a behavior in a very regimented way,
such as reading a daily newspaper every morning, whether a question
asks about a typical week or last week is not likely to be especially
consequential. Such people would presumably have an easy time
enumerating their pattern of behavior and would provide identical
reports of newspaper reading regardless of whether they were asked
about a typical week or the past week (see Robinson and Gershuny
1994).
But for people whose behavior patterns are less regimented
(e.g., see Robinson and Godbey 1997: 291), the choice of asking
about a typical week versus the past week may be substantially
more consequential. The more irregular the behavior pattern of inter-
est is for an individual, the less likely an enumeration of the past week
may be to accurately represent his or her typical frequency. The
variation in a person’s experiences from week to week would be
real, of course, but this variation would constitute error variance if
a researcher’s goal is to measure people’s usual or typical behavior
patterns. The more people in a sample whose behavior patterns are
irregular, the less likely a ‘‘past week’’ question may be to yield valid
measures of average behavioral frequencies over long time periods (as
is our interest here). This logic suggests an advantage of ‘‘typical
week’’ questions over ‘‘past week’’ questions if a researcher’s goal is
to rank-order people in terms of such long-term average behavior
frequencies, presuming that people can be equivalently accurate in
describing their behaviors during both the past week and a typical
week.
But this latter premise may be incorrect (see Robinson and
Godbey 1997). Describing the last week may be relatively easy for
many respondents to do, because they can think back and enumerate
events that occurred recently. Describing a typical week may also be
easy for people if they have a frequency rate for the behavior in
question already stored in their memories. But for people without
58 CHANG AND KROSNICK

such a pre-stored rate, describing a typical week may entail quite a bit
of mental work, via one of multiple possible strategies. For example, a
respondent could identify a week that he or she considers ‘‘typical’’
and then figure out what he or she did during that week. If a person
concludes that the past week was typical, then the accuracy of his or
her response to a typical week question would be identical to that of
his or her description of the past week. But if the respondent con-
cludes that the past week was not typical, then the volume of required
cognitive work would presumably increase even more. He or she must
make behavioral frequency estimates for one or more weeks that
occurred longer ago in the past than simply a single week. And in
the extreme, a respondent who cannot identify any single week as
typical (given lots of behavioral variability) may think about the
events that occurred during a series of weeks and average recalled
behavior frequencies across them.
Regardless of which procedure a respondent uses, answering a
typical week question may entail longer-term recall than does answer-
ing a question about the past week for many respondents. And
decades of research in cognitive psychology have demonstrated that
a longer interval between the behavior performance and the time of
recollection is associated with less accurate recall (e.g., Baddeley 1999;
Burton and Blair 1991). Therefore, the cognitive strategies executed to
describe a typical week may yield a substantial amount of recall error,
enough to make reports of the past week just as accurate or even more
accurate for gauging typical action patterns. This logic led Babor,
Brown, and Del Boca (1990) to argue that general time use patterns
are better measured with questions about specific, recent, and short
time periods than by questions about usual activity patterns. Belson
(1981: 359) also warned against asking for descriptions of ‘‘usual’’
behavior, because he found that a majority of respondents in his
think-aloud studies misinterpreted the intended meaning of the term
‘‘usual’’ in ways that compromised the validity of their answers. This
logic underlies many time use researchers’ preference for asking about
recent, specific time periods (Lyberg 1989; Robinson 1977: 175;
Robinson and Godbey 1997).
There is good reason to have confidence in measurement of a
recent specific time period (e.g., the last 24 hours), because many
studies attest both to the validity and reliability of data gathered
thusly when they are used to generate aggregate figures regarding
MEASURING THE FREQUENCY OF REGULAR BEHAVIORS 59
populations (for a review, see Robinson and Godbey 1997: 74–77).
But Robinson (1977: 10) noted that ‘‘We are much less certain of the
validity of time-use diary data at the level of the individual respond-
ent,’’ and even 25 years later, empirical justification for confidence in
the individual-level data remains scant.
Interestingly, Belson (1986) himself produced cautionary evi-
dence about people’s reports of their behavior during specific time
periods. When asked to describe their behavior during the last seven
days, Belson’s respondents routinely made interpretive errors, often
reporting their ‘‘usual’’ behavior pattern instead of the specific one
that occurred during the intended reference period. Therefore, it is not
obvious a priori whether questions about recent time periods will yield
more accurate reports of typical behavior frequency than questions
asking directly about typical or usual behavior patterns.
We therefore conducted tests to explore this issue empirically.
We also explored the possibility that differences between typical week
reports and past week reports might vary with the cognitive skills of
the respondent. Because typical week questions require more cogni-
tive work than do past week questions, answering a typical week
question effectively may require substantial cognitive skills. If a per-
son lacks such skills, any advantage of the typical week question over
the past week question may disappear, because the respondent may
fail to correctly identify what weeks are typical or may make more
recall errors in describing behavior patterns regarding time periods
longer ago than simply the past week. So typical week questions may
be especially effective among respondents with substantial cognitive
skills and of less value among other respondents.
2. EXISTING EVIDENCE ON VALIDITY
Only two past experimental studies have compared results obtained
by questions asking about typical behavior and questions asking
about a recent specific period (e.g., the past week). Jacob (1995)
asked respondents to complete large sets of rating scales describing
various characteristics of their families (e.g., cohesion, expressiveness)
twice, once describing their families ‘‘in general’’ and again with
reference to their families during the past week. Correlations between
total scores of multi-item indices measuring the same construct in the
60 CHANG AND KROSNICK

two question formats averaged .74. The indices’ coefficient alphas
averaged .65, which suggests that after multi-item index construction
and correction for random measurement error, the underlying con-
structs measured by the two question formats were nearly perfectly
correlated with one another. Unfortunately, Jacob (1995) did not
report separate coefficient alphas for the two question formats, so it
was not possible to assess whether one format yielded more reliable
measurements of that underlying construct than did the other.
Respondents reported greater frequency of behaviors and endorsed
more characteristics as descriptive of the family when answering the
‘‘in general’’ questions than when answering the ‘‘past week’’ ques-
tions, but Jacob (1995) offered no evidence to explain this gap.
Price (1993) analyzed data from an experiment embedded in a
national survey, in which respondents were randomly assigned to be
asked one of two question forms, measuring their news media expos-
ure during a typical week or the past week. Respondents reported
more television news program viewing and newspaper reading during
a typical week than during the past week. To assess the validity of the
‘‘past week’’ versus ‘‘typical week’’ measures, Price (1993) examined
whether people who reported more exposure to news through various
channels could also more accurately describe recent events that had
been covered by the news media. Stronger correlations between media
exposure reports and news recall quiz scores were presumed to indi-
cate greater validity of the former, because media exposure is pre-
sumably a primary cause of knowledge about recent public events.
Typical week reports correlated slightly more strongly with news
recall quiz score than did the past week reports, but this difference
was not statistically significant, so Price (1993) concluded the differ-
ence was not meaningful and that the two question forms were of
equivalent utility.
Although this conclusion may be correct, it is possible that
Price’s analyses were misleading. In general, data analysts recommend
the use of unstandardized regression coefficients rather than standard-
ized measures such as correlations for comparing associations
between variables across groups of respondents (e.g., Blalock 1967;
Duncan 1975) because across-group comparisons of standardized
measures of association can be distorted by between-group differences
in the variances of the variables involved. In fact, Price (1993)
reported that there was more variance in answers to the past week
MEASURING THE FREQUENCY OF REGULAR BEHAVIORS 61
questions than in answers to the typical week questions, which would
misleadingly inflate the past week question’s correlations in compari-
son to those involving the typical week questions. Therefore, true
validity could have been lower for the past week questions than the
typical week questions, but this would have been masked in Price’s
analyses. Consequently, it seems worthwhile to reconsider these data
before reaching any conclusion.
3. DESIGN OF THE PRESENT STUDY
In this paper, we report findings from a reanalysis of the data Price
(1993) examined, from the National Election Study’s (NES) 1989
Pilot Study. Like Price (1993), we focused on the correlational validity
of the two question forms, assessed using unstandardized regression
coefficients rather than correlations.
The ideal criterion variable for assessing the validity of media
exposure measures would be a pure and completely accurate assess-
ment of media exposure. With such a measure, we could estimate the
parameters of the following equations separately using two different
measures of media exposure:
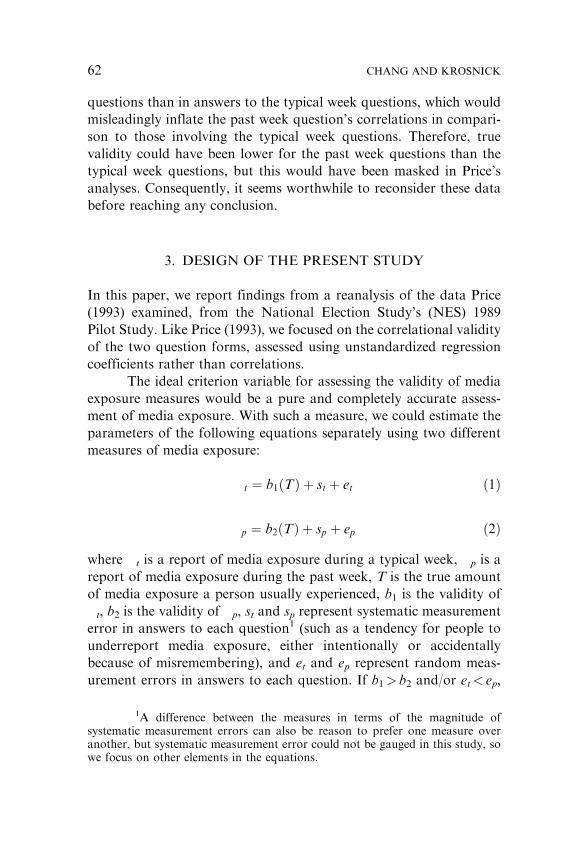
�t ¼ b1ðTÞ þ st þ et ð1Þ
�p ¼ b2ðTÞ þ sp þ ep ð2Þ
where �t is a report of media exposure during a typical week, �p is a
report of media exposure during the past week, T is the true amount
of media exposure a person usually experienced, b1 is the validity of
�t, b2 is the validity of �p, st and sp represent systematic measurement
error in answers to each question1 (such as a tendency for people to
underreport media exposure, either intentionally or accidentally
because of misremembering), and et and ep represent random meas-
urement errors in answers to each question. If b1> b2 and/or et< ep,
1A difference between the measures in terms of the magnitude ofsystematic measurement errors can also be reason to prefer one measure overanother, but systematic measurement error could not be gauged in this study, sowe focus on other elements in the equations.
62 CHANG AND KROSNICK

that would suggest that the typical week question is a more valid and/
or reliable measure of true media exposure than the past week ques-
tion. And if b1< b2 and/or et> ep, that would suggest that the typical
week question is a less valid and/or reliable measure of true media
exposure than the past week question.
Unfortunately, no pure and completely accurate method for
assessment of media exposure yet exists, and methods such as observ-
ation, diaries, and experience sampling all have advantages and draw-
backs (for reviews, see, Kubey and Csikszentmihalyi 1990; Robinson and
Godbey 1997: 61–62). And we have found no dataset containing the
array of needed measures for estimating the parameters of equations (1)
and (2).
We have therefore taken an alternative approach using a cri-
terion variable that theory suggests should be correlated with news
media exposure: knowledge about recent political events. That is, we
have adopted an approach suggested by the American Psychological
Association (1954) for gauging the validity of a measure: assessing
construct validity, which focuses on the extent to which a measure (in
our case, of media exposure) is related to measures of other constructs
to which theory says it should be related (in our case, political know-
ledge; see also Messick 1989).
We posited the following model of the relation between measures
of news media exposure and measures of political knowledge:
� ¼ b3ð�tÞ þ b4 ð�Þ þ sþ e ð3Þ
� ¼ b5ð�pÞ þ b4 ð�Þ þ sþ e ð4Þ
where � is a measure of knowledge about politics that is presumably
learned through exposure to the news media, �t and �p are the two
different reports of the amount of news media exposure, b3 and b5 are
coefficients estimating the associations of� with �t and �p,� is a vector
of other causes of assessed knowledge levels besides media exposure,
b4 is a vector of coefficients reflecting the strength of impact of these
other causes, s is systematic measurement error in assessments
of political knowledge, and e is random error in measurements of
political knowledge. b3 and b5 can be estimated in the two separate
equations leaving � and s out of the equations because the impact of
other causes and systematic measurement error will be the same in both.
MEASURING THE FREQUENCY OF REGULAR BEHAVIORS 63

Invalidity and random measurement error in the measures of media
exposure will attenuate b3 and b5. So if b3> b5, that would suggest that
the typical week question is a more valid and/or reliable measure of true
media exposure than the past week question. And if b3< b5, that would
suggest that the typical week question is a less valid and/or reliable
measure of true media exposure than the past week question.
We used the data set analyzed by Price (1993) to estimate b3and b5 in order to make these comparisons. In addition to using the
validity criteria Price (1993) used (quiz questions about current events
administered later in the same interviews as the media exposure
questions), we also used current event quiz questions administered
during a subsequent interview with the same respondents, as well as
quiz questions about the jobs or offices held by various political
figures that had been asked of the respondents one year prior to the
media exposure questions.
All of these indices of knowledge are what Bassili (1996) labeled
‘‘operative’’ measures, because they assess the presence of accurate
knowledge in respondents’ memories directly. Knowledge quantities
can also be assessed ‘‘meta-attitudinally,’’ by asking people how know-
ledgeable they think they are on a particular topic. Bassili (1996) argued
that operative measures are advantaged in terms of validity, because
they bypass respondents’ potentially inaccurate perceptions and stra-
tegic efforts at self-presentation. However, quiz questions can also be
misleading, because they reflect the accumulation of only the specific
bits of information asked about and therefore may understate know-
ledge levels for some respondents. We therefore used meta-attitudinal
knowledge questions included in the 1988 NES questionnaire as add-
itional independent validity criteria in our analyses.
Furthermore, we went a step beyond Price’s (1993) approach to
assessing validity by recognizing that exposure to news media stories
is not likely to translate directly into the accumulation of knowledge.
Rather, information accumulation from the media is likely to be a
joint product of exposure levels and attention levels (Chaffee and
Schleuder 1986; Zaller 1990, 1992). That is, a person who is exposed
to many news stories but pays only minimal attention to them (e.g.,
because the television serves as background accompaniment to mak-
ing and eating dinner) may retain less information than a person who
was exposed to fewer stories but paid close attention to them. There-
fore, any attempt to gauge the validity of exposure measures must
64 CHANG AND KROSNICK

explicitly model an interaction: exposure and attention are likely to
combine multiplicatively with one another to enhance knowledge
gathering, so assessing such an interaction explicitly is the only effect-
ive way to investigate the effects of attention. We did just this.
4. METHOD
4.1. Data
The National Election Studies are surveys of nationally representative
samples of American adults conducted during even-numbered,
national election years in the U.S. During every odd-numbered year
between 1979 and 1997, a subsample from the prior year’s national
sample was selected for participation in a pilot study. Respondents in
the 1989 NES Pilot Study were first interviewed as part of the 1988
National Election Study and were then interviewed twice in 1989, first
between July 6 and August 1 (Wave I), and again between September
6 and October 6 (Wave II). A total of 614 people completed the Wave
I interviews, 243 men and 371 women, 542 Caucasians and 72 non-
Caucasians. A total of 494 of these respondents completed the Wave
II interviews.
4.2. Measures
Media Exposure. During the Wave I interviews in 1989, respondents
were asked either typical week or past week questions assessing expos-
ure to television news and newspapers:2
‘‘How many days (in the past week/in a typical week)
did you watch the news on TV?’’
2The survey also measured exposure to radio news, but we focused onTV news and newspapers because respondents reported very little exposure toradio news programs. Questions asking about exposure to morning televisionshows and evening entertainment programs on television were also not used,because they presumably have little impact on people’s knowledge about politicalevents.
MEASURING THE FREQUENCY OF REGULAR BEHAVIORS 65

‘‘How many days (in the past week/in a typical week)
did you read a daily newspaper?’’
Because exposure through either medium should contribute to
knowledge accumulation, we summed respondents’ two exposure
scores and recoded the result to range from 0 (meaning no exposure
to either television news or newspapers) to 1 (meaning 7 days of
exposure to television news and 7 days of exposure to newspapers).
Attention. The amount of attention respondents paid to political
news was measured by two follow-up questions. Respondents who
received the past week form were asked: ‘‘How much attention did
you pay to news on TV about national politics?’’ and ‘‘How much
attention did you pay to newspaper articles about national politics?’’
Respondents who received the typical week form were instead asked
more generally phrased questions: ‘‘How much attention do you pay
to news on TV about national politics?’’ and ‘‘How much attention
do you pay to newspaper articles about national politics?’’ Each of
these questions was asked immediately after the corresponding
media exposure item. Responses were made on a 5-point scale: ‘‘a
great deal,’’ ‘‘quite a bit,’’ ‘‘some,’’ ‘‘very little,’’ and ‘‘none,’’ coded 1,
.75, .5, .25, and 0, respectively. An index of attention to political
news was computed by averaging respondents’ answers to these two
questions.3
Wave I Current Events Recall Questions. During the 1989 Wave I
interviews, all respondents were asked if they remembered hearing or
reading anything about five current news events: the resignation of
House Speaker Jim Wright, a Supreme Court ruling on the death
penalty, a scandal involving the U.S. Department of Housing and
Urban Development, the trials of Colonel Oliver North, and a ruling
by the U.S. Supreme Court on abortion.
For example, the first question asked about Jim Wright was:
‘‘Every day there are dozens of stories in the news. We are interested
in how many of these stories people actually see or hear and how
good a job the media does in covering the news. For example: Have
3News media exposure and attention were significantly correlated(r¼ .65, p< .001).
66 CHANG AND KROSNICK

you read or heard any news stories about the resignation of Congress-
man Jim Wright?’’ If respondents said they did remember hearing or
reading something on the topic, they were asked: ‘‘Do you happen to
recall why he resigned?’’ Similar question sequences were asked about
the other events.
The coding staff of the University of Michigan’s Institute of
Social Research coded answers into categories representing the
amount of accurate information each respondent reported about
each event. Respondents who said they did not read or hear any-
thing about the event in question, or who gave incoherent answers,
or said ‘‘don’t know’’ were given a score of 0. All other answers were
coded for level of detail and accuracy, such that smaller numbers
indicated inaccurate or vague answers, while large numbers were
assigned to answers reflecting both correct recollections about the
events and detailed knowledge (for details, see http://www.umich.
edu/�nes).
Codes for each news recall item were recoded to range from 0
(meaning no recall at all) to 1 (meaning the most accurate recall of
extensive knowledge possible). A composite measure of current events
recall was then computed by averaging each respondent’s scores on
the five questions. The reliability of this measure was satisfactory,
�¼ .76 (N¼ 596), and all five items loaded significantly on a single
factor (.46<�< .71) in a confirmatory factor analysis.
Wave II Current Events Recall Questions. Four current events recall
items were asked of all respondents who were interviewed in the
second wave of the 1989 NES Pilot Study, about the HUD scandal,
the Oliver North trials, the Supreme Court ruling on abortion, and a
scandal involving evangelist Jim Bakker. Coding of answers and index
construction was done just as had been done with the Wave I data.
The reliability of this measure was satisfactory, �¼ .84 (N¼ 431), and
all four items loaded significantly on a single factor (.74<�< .82) in a
confirmatory factor analysis.
Political Figure Identification. During the 1988 NES pre-election
survey interviews (one year before the Pilot Study), respondents
were asked if they knew the job or office held by prominent political
figures: Ted Kennedy, George Shultz, William Rehnquist, Mikhail
Gorbachev, Margaret Thatcher, Yasser Arafat, and Jim Wright. Each
MEASURING THE FREQUENCY OF REGULAR BEHAVIORS 67

respondent received a score of 1 for a question if he or she correctly
identified the political figure and a score of zero if he or she gave an
incorrect answer, said ‘‘don’t know,’’ or gave an irrelevant or inco-
herent answer. An index of recollection accuracy was computed by
averaging the seven scores for the individual items. The reliability of
this index was satisfactory, �¼ .77 (N¼ 609), and all seven of the
items loaded significantly on a single factor (.47<�< .69) in a con-
firmatory factor analysis.
Self-Reported Knowledge Volume. During the 1988 NES pre-election
interviews, respondents were asked whether they agreed or disagreed
with two statements: ‘‘I feel that I have a pretty good understanding
of the important political issues facing our country’’ and ‘‘I think I am
better informed about politics and government than most people.’’
Responses were made on a 5-point scale ranging from ‘‘strongly
agree’’ to ‘‘strongly disagree,’’ which we coded to range from 0 (mean-
ing ‘‘strongly disagree’’) to 1 (meaning ‘‘strongly agree’’). The mean of
these two scores was treated as a measure of self-reported knowledge
volume. The correlation between the two items was .56, p< .001
(N¼ 613).
Education. To measure respondents’ cognitive skills, we employed
educational attainment as a proxy, because it is extremely strongly
correlated with direct measures of cognitive skills (Ceci 1991).
Respondents reported the highest year of school they attended and
the highest degree they had received.
5. RESULTS
As shown in Table 1, we replicated the frequency distributions of
responses to the television news and daily newspapers questions that
Price (1993) reported. Respondents answering the past week questions
were more likely to report zero days of exposure, whereas respondents
answering the typical week questions were more likely to report five
days of exposure. These distributions were significantly different from
one another for both television (�2¼ 30.97, p< .001) and newspapers
68 CHANG AND KROSNICK

(�2¼ 24.72, p< .001).4 Tests of equality of variances confirmed that
the variability of the past week reports was greater than that of the
typical week reports of exposure to television news (p< .01) but not
exposure to newspapers (p> .20).
5.1. Associations Among the Key Variables
Exposure was significantly correlated with each of the four validity
criteria (with Wave I current events recall r¼ .34, p< .001; with Wave
II current events recall r¼ .26, p< .001; with political figure identifi-
cation r¼ .32, p< .001; and with self-reported knowledge volume
r¼ .29, p< .001). Attention was also significantly correlated with
each of the four validity criteria (with Wave I current events recall
r¼ .41, p< .001; with Wave II current events recall r¼ .38, p< .001;
with political figure identification r¼ .44, p< .001; and with self-
reported knowledge volume r¼ .48, p< .001).
Not surprisingly, the operative measures of political knowledge
were more strongly associated with each other (current events recall
4All analyses were conducted using STATA controlling for designeffects due to the cluster sampling done for the NES.
TABLE 1
Distributions of Responses to News Media Exposure Questions
Television News Daily Newspapers
Days per Week
Typical Week
Question (%)
Past Week
Question (%)
Typical Week
Question (%)
Past Week
Question (%)
0 6 11 10 17
1 4 8 10 11
2 8 11 8 8
3 11 13 10 13
4 9 11 3 7
5 22 10 11 6
6 8 4 7 4
7 32 33 42 33
Standard deviation .31 .36 .37 .39
N 302 312 302 312
MEASURING THE FREQUENCY OF REGULAR BEHAVIORS 69

Wave I and Wave II: for r¼ .70, p< .001; Wave I current events recall
and political figure identification: r¼ .67, p< .001; Wave II current
events recall and political figure identification: r¼ .62, p< .001) than
with the meta-attitudinal measure of political knowledge (Wave I
current events recall: r¼ .49, p< .001; Wave II current events recall:
r¼ .43, p< .001; political figure identification: r¼ .53, p< .001). The
correlations’ magnitudes suggest that the four criteria were related to
one another as expected but were sufficiently nonredundant to permit
useful replications for assessment of validity.
5.2. Predictive Validity
An initial, simple assessment of predictive validity suggested that the
typical week questions were superior to the past week questions (see
Table 2, top panel). Across all four dependent variables, unstandard-
ized regression coefficients indicated a stronger relation between
reported media exposure and political knowledge for the typical
week questions than for the past week questions. The differences
between forms were statistically significant for Wave I current events
recall (t¼ 2.63, p< .05), political figure identification (t¼ 2.71,
p< .01), and self-reported knowledge volume (t¼ 2.75, p< .01).5 A
meta-analysis combining across the four validity criteria using a
technique that controls for correlations among the validity criteria
(see Rosenthal and Rubin 1986) revealed significantly greater overall
predictive validity for the typical week questions than for the past
week questions in terms of the two-way interactions between exposure
x form (d¼ .167, p< .01)
When we estimated the parameters of regression equations
predicting the four knowledge measures with exposure, attention,
and the interaction between exposure and attention, the results
again suggested superiority of the typical week questions (see Table
2, bottom panel). Using the past week questions, the interaction was
positive (as expected) and statistically significant for three criteria
5The difference between forms was tested by regressing each criterion onmedia exposure, question form, and the interaction of exposure x form andassessing the significance of the interaction. The same analyses were repeatedafter media exposure was (1) recoded into quartiles, and (2) subjected to a naturallog transformation, and comparable results were obtained to those reported in thetext.
70 CHANG AND KROSNICK

TABLE 2
Regressions Predicting Political Knowledge with News Media Exposure, Attention, and the Interaction of Exposure and Attention
Typical Week Questions Past Week Questions
Unstandardized Regression Coefficients Unstandardized Regression CoefficientsDifference
Dependent
Variable Exposure Attention
Exposure*
Attention R2 N Exposure Attention
Exposure*
Attention R2 N
Between
Coefficientsa
Current events
recall, Wave I
.40** .16 290 .26** .10 306 .14*
Current events
recall, Wave II
.31** .10 210 .19** .05 221 .12
Political figure
identification
.40** .14 302 .21** .06 312 .19**
Self-reported
knowledge
.32** .12 302 .18** .05 311 .14**
Current events
recall, Wave I
�.14 .02 .65** .25 290 �.09 .24* .29* .19 306 .36þ
Current events
recall, Wave II
�.10 �.02 .51** .16 210 �.13 .47** .10 .21 221 .41
Political figure
identification
�.24þ �.06 .82** .23 302 �.19* .29** .33* .18 312 .49þ
Self-reported
knowledge
�.29** .25* .59** .30 302 �.28** .27** .43** .19 311 .16
aIn the top panel, these are differences between the main effect coefficients; in the bottom panel, these are differences between the
interaction coefficients.
**p< .01 * p< .05 þp< .10
71

(Wave I current events recall: b¼ .29, p< .05; political figure identifi-
cation: b¼ .33, p< .05; self-reported knowledge volume: b¼ .43,
p< .01) but was not significant for Wave II current events recall
(b¼ .10, p> .30). In contrast, when using the typical week questions
instead, the interaction was more than twice as strong for three of the
four criteria and was significant for all four of them (Wave I current
events recall: b¼ .65, p< .01; Wave II current events recall: b¼ .51,
p< .01; Political figure identification: b¼ .82, p< .01; self-reported
knowledge volume: b¼ .59, p< .01). The difference between the typ-
ical week and past week questions was marginally significant for Wave
I current events recall (t¼ 1.78, p< .10) and political figure identifica-
tion (t¼ 1.96, p< .10) and was not significant for Wave II current
events recall (t¼ 1.43, p> .10) and self-reported knowledge volume
(t¼ .67, p> .50).6 A meta-analysis showed that overall predictive
validity of the exposure x attention interaction was marginally sig-
nificantly greater for the typical week questions than for the past week
questions (d¼ .109, p< .10).7
5.3. Explaining the Difference in Validity
One possible explanation for the poorer performance of the past week
questions is variability in people’s media exposure from week to week.
The more people in the sample whose past week was atypical, the
lower the predictive validity of the past week measures should be,
whereas this sort of schedule variability would presumably not
6The difference between forms was tested via the three-way interactionsin regression equations predicting each criterion with media exposure, attention,question form, exposure x form, attention x form, exposure x attention, andexposure x attention x form.
7To explore whether failure to reinterview some respondents at Wave IIhad any impact on the results, we compared the characteristics of people whowere respondents and nonrespondents at Wave II. The two groups were notdifferent in terms of age, race, gender, income, or employment status. Within thegroups that received the two different question forms, respondents andnonrespondents did not differ in terms of media exposure, attention paid tonews in media, current events recall in Wave I, political figure identification, orself-reported knowledge volume. Wave II respondents were slightly moreeducated than Wave II nonrespondents. Because similar results were obtainedusing only Wave I data, there is no reason to believe that the attrition at Wave IIis responsible for the results obtained on the single criterion variable from WaveII.
72 CHANG AND KROSNICK

handicap the typicalweek questions so directly.NES respondents asked
the past week questions were also asked whether the past week was
typical for them in terms of media exposure or not: ‘‘Was this a
typical week for you with respect to the amount of news on TV you
watched?’’, to which 70 percent of respondents replied in the affirma-
tive, and ‘‘Was this a typical week for you with respect to how often
you read a daily newspaper?’’, to which 79 percent of respondents
replied in the affirmative.
When we repeated the predictive validity comparisons shown
in Table 2 using only the respondents who were asked the past week
questions and said their past weeks were typical, we found the gap
between the question forms was somewhat diminished. Nonetheless,
meta-analyses combining across the four validity criteria revealed
significantly better overall predictive validity for the typical week
questions than for the past week questions in terms of the main effect
of news media exposure (d¼ .108, p< .05) and marginally signifi-
cantly better overall predictive validity for the typical week questions
than for the past week questions in terms of the exposure x attention
interaction (d¼ .099, p< .10). As would be expected, both of these
effect sizes are smaller than those generated using all respondents who
were asked the past week questions. This suggests that the discrep-
ancy between the results yielded by the two question forms may be
partly but not completely attributable to atypicality of the prior
week.8
5.4. The Moderating Role of Education
Clear support for the moderating role of cognitive skills emerged
when we estimated the three-way interaction of exposure x attention
x question form separately for respondents with high school educa-
tion or less and for respondents with some college education or more.
Among respondents in the high education group, the three-way inter-
action was significant and positive (as expected) for Wave II current
events recall (t¼ 2.23, p< .05), political figure identification (t¼ 2.30,
p< .05), and self-reported knowledge volume (t¼ 2.06, p< .05), and
8This analysis would be best done eliminating people who were askedthe typical week question and whose past week was atypical, but the NES did notask the necessary question to permit this filtering.
MEASURING THE FREQUENCY OF REGULAR BEHAVIORS 73
in the same direction and nonsignificant for Wave I current events
recall (t¼ .48, p> .20). Among respondents in the low education
group, the three-way interaction was not significant for any of the
four validity criteria (t¼ .73, p> .40 for Wave I current events recall;
t¼� .27, p> .70 for Wave II current events recall; t¼ .10, p> .90 for
political figure identification; t¼� 1.17, p> .20 for self-reported
knowledge volume). Meta-analyses of this three-way interaction
between exposure x attention x question form, combining across the
four validity criteria, revealed greater predictive validity for the typ-
ical week questions than for the past week questions among the high
education respondents (d¼ .136, p< .05) but not among the low
education respondents (d¼ .003, p> .90), and the contrast between
these two effect sizes was statistically significant (g¼ .234, p< .001).
This supports the conclusion that the typical week questions yielded
greater validity only among the respondents most skilled at perform-
ing the required complex tasks.
6. DISCUSSION
6.1. Summary of Findings
People reported more television news and newspaper exposure when
answering the typical week questions than when answering the past
week questions, a finding in line with other evidence that total
amount of time spent on various activities is greater for a typical
or average week than for a recent week (Jacob 1995; Market Facts,
Inc. n.d.; Price 1993; Robinson and Godbey 1997, p. 60; c.f.
Eldridge, Barnard, and Bekerian 1994). It might be tempting for
some readers to infer from this that typical week questions elicit
more social desirability bias, on the assumption that reporting fre-
quent news media exposure is socially admirable. Such a conclusion
might seem consonant with evidence described by Marini and
Shelton (1993) and Robinson and Godbey (1997) that estimates of
typical behavior overestimate time spent doing housework and
underestimate free time, in comparison to time diary data on the
past 24 hours (assuming that housework is socially admirable and
free time is not).
74 CHANG AND KROSNICK

However, people routinely overestimate time spent at all sorts
of activities when asked about their typical behavior, because totals of
time spent doing various things during a week routinely total up to
well over the 168 hours available in a week (Verbrugge and Gruber-
Baldine 1993). People may answer questions about a typical week’s
television viewing with reference only to a typical week when the
personwatches television,whichwouldyieldoverstatement (Robinson
and Godbey 1997: 60). Or people may undercharacterize time
spent on various activities in a time diary because they can only
report one activity at a time, even if they are doing multiple things at
once (Juster and Stafford 1991). We know of no evidence showing
that reports of news media exposure are subject to distortion due to
social desirability bias, so we are hesitant to assume that the typical
week question responses are necessarily less valid simply because
they elicit higher rates of reported behaviors. In fact, the evidence
we reported about correlational validity suggests that the past week
question answers about media use may have been distorted down-
ward, rather than the typical week question answers being distorted
upward.
6.2. The Attention�Exposure Interaction
Our findings point to the importance of considering the interaction
between exposure and attention when studying information acquisi-
tion. Based on past research, we expected the effect of exposure to
news media on the gaining of political knowledge to be moderated
by the amount of attention paid to politics during exposure (Zaller
1990, 1992). And, in most cases, the interaction of exposure and
attention was positive and significant. This finding attests to the
importance and utility of considering attention when analyzing
data involving media exposure (e.g., Chaffee and Schleuder 1986),
reinforces the approach taken in some past investigations of media
effects of examining interactions between exposure and attention
(e.g., Krosnick and Brannon 1993), and suggests that past investiga-
tions that have looked at just simple effects of exposure alone (e.g.,
see Gilliam and Iyengar 2000) or separate effects of exposure and
attention without an interaction (e.g., Chaffee and Schleuder 1986;
Mastro and Atkin 2002) may have understated or mischaracterized
media effects.
MEASURING THE FREQUENCY OF REGULAR BEHAVIORS 75

6.3. Meta-Attitudinal Measures
The present findings have implications for research comparing meta-
attitudinal measures with operative indices of psychological con-
structs. Research on attitude strength has demonstrated that people’s
perceptions of the operation of their attitudes may be discrepant from
the actual operation of those attitudes. Therefore, concurrent exam-
ination of both meta-attitudinal and operative measures seems wise to
preclude drawing incorrect conclusions from one type of measure
alone (Bassili 1996; Visser and Krosnick 1998). The self-reported
political knowledge volume questions and quizzes testing factual
knowledge in this investigation are meta-judgmental measures and
operative indices, respectively. And we generally obtained comparable
results using both measures. This pattern is consistent with the find-
ings of Krosnick et al. (1993), who reported exploratory and confirma-
tory factor analyses showing that operative and meta-attitudinal
measures of knowledge volume reflected a single underlying common
factor. All this suggests comparability of meta-attitudinal and opera-
tive measures of knowledge volume and suggests the value of further
research exploring the conditions under which meta-attitudinal and
operative measures of this and other constructs converge and diverge.
6.4. Explaining the Education Effect
One possible explanation for the apparent moderating role of educa-
tion is suggested by the work of Eldridge, Barnard, and Bekerian
(1994). These investigators showed that when people attempted to
remember all the activities they performed during one day a week ago,
their memorial representation of a typical day’s activities (their
‘‘schemas’’) interfered: People forgot some or many of the events that
actually occurred that day and instead misremembered that their
activities were those of a typical day. This sort of interference might
be especially likely among individuals with more limited cognitive
skills. Therefore, our evidence that among low education respondents
the typical week and past week questions were equally valid may have
occurred because these individuals’ typical week schemas overrode
recollections of the past week. As a result, these people may have
described their typical week, regardless of whether they were explicitly
asked about it or the past week.
76 CHANG AND KROSNICK

7. CONCLUSION
Although the typical week questions performed better in this context,
the past week questions were not totally invalid. The past week
questions yielded significant correlations with most of the dependent
variables, just not as strong as those for the typical week questions.
Therefore, existing data sets that were generated using past week
questions are certainly worth analyzing. But for researchers planning
future studies with the goal of differentiating people with chronically
high and low levels of news media exposure, the typical week ques-
tions seem preferable.
The typical week questions may have performed better than the
past week questions here because news media exposure involves a
regular behavioral pattern for most people. Hence the differences
demonstrated in this study may not appear when measuring other
behaviors that people perform in more erratic ways and for which
estimating typical patterns may be quite a bit more cognitively taxing
and error-prone. We therefore look forward to future studies explor-
ing these measurement issues in domains other than news media
exposure.
REFERENCES
American Psychological Association. 1954. ‘‘Technical Recommendations for
Psychological Tests and Diagnostic Techniques.’’ Psychological Bulletin 51:2,
pt. 2.
Babor, Thomas F., Joseph Brown, and Frances K. Del Boca. 1990. ‘‘Validity of
Self-Reports in Applied Research on Addictive Behaviors: Fact or Fiction?’’
Behavioral Assessment 12:5–31.
Baddeley, Allen D. 1999. Essentials of Human Memory. East Sussex, England:
Psychology Press.
Bassili, John N. 1996. ‘‘Meta-Judgmental Versus Operative Indexes of Psycho-
logical Attributes: The Case of Measures of Attitude Strength.’’ Journal of
Personality and Social Psychology 71:637–53.
Belson, William A. 1981. The Design and Understanding of Survey Questions.
Hants, England: Gower.
———. 1986. Validity in Survey Research. Hants, England: Gower.
Blair, Edward, and Scot Burton. 1987. ‘‘Cognitive Processes Used by Survey
Respondents to Answer Behavioral Frequency Questions.’’ Journal of Con-
sumer Research 14:280–88.
MEASURING THE FREQUENCY OF REGULAR BEHAVIORS 77

Blalock, Hubert M. 1967. ‘‘Path Coefficients Versus Regression Coefficients.’’
American Journal of Sociology 72:675–76.
Briefel, Ronette R. 1994. ‘‘Assessment of the U.S. Diet in National Nutrition
Surveys: National Collaborative Efforts and NHANES.’’ American Journal of
Clinical Nutrition 59: (suppl) 164–167S.
Burton, Scot, and Edward Blair. 1991. ‘‘Task Conditions, Response Formulation
Processes, and Response Accuracy for Behavioral Frequency Questions in
Surveys.’’ Public Opinion Quarterly 55:50–79.
Ceci, Stephen J. 1991. ‘‘How Much Does Schooling Influence General Intelli-
gence and its Cognitive Components? A Reassessment of the Evidence.’’
Developmental Psychology 27:703–22.
Chaffee, Steven H., and Joan Schleuder. 1986. ‘‘Measurement and Effects of
Attention to Media News.’’ Human Communication Research 13:76–107.
Conrad, Frederick G., NormanR. Brown, and Erin R. Cashman. 1998. ‘‘Strategies
for Estimating Behavioral Frequency in Survey Interviews.’’Memory 6:339–66.
Domina, Tanya, and Kathryn Koch. 2002. ‘‘Convenience and Frequency of
Recycling: Implications for Including Textiles in Curbside Recycling
Programs.’’ Environment and Behavior 34:216–38.
Duncan, Otis Dudley. 1975. Introduction to Structural Equation Models. New
York: Academic Press.
Eisenhower, Donna, Nancy A. Mathiowetz, and David Morganstein. 1991.
‘‘Recall Error: Sources and Bias Reduction Techniques.’’ Pp. 128–44 in Meas-
urement Errors in Surveys, edited by Paul Biemer, Robert M. Groves, Lars
E. Lyberg, Nancy A. Mathiowetz, and Seymour Sudman. New York: Wiley.
Eldridge, Margery A., Philip J. Barnard, and Debra A. Bekerian. 1994.
‘‘Autobiographical Memory and Daily Schemas at Work.’’ Memory 2:51–74.
Gershuny, Jonathon. 2000. Changing Times: Work and Leisure in Postindustrial
Society. New York: Oxford University Press.
Gibson, James L. 2001. ‘‘Social Networks, Civil Society, and the Prospects for
Consolidating Russia’s Democratic Transition.’’ American Journal of Political
Science 45:51–69.
Gilliam, Frank D., and Shanto Iyengar. 2000. ‘‘Prime Suspects: The Influence of
Local Television News on the Viewing Public.’’ American Journal of Political
Science 44:560–73.
Jacob, Theodore. 1995. ‘‘The Role of Time Frame in the Assessment of Family
Functioning.’’ Journal of Marital and Family Therapy 32:281–88.
Juster, F. Thomas, and Frank P. Stafford. 1991. ‘‘The Allocation of Time:
Empirical Findings, Behavioral Models, and Problems of Measurement.’’
Journal of Economic Literature 29:471–522.
Koivusilta, L. K., A. H. Rimpela, M. Rimpela, and A. Vikat. 2001. ‘‘Health
Behavior-Based Selection into Educational Tracks Starts in Early Adoles-
cence.’’ Health Education Research 16:201–214.
Krosnick, Jon A., and Laura Brannon. 1993. ‘‘The Impact of the Gulf War on the
Ingredients of Presidential Evaluations: Multidimensional Effects of Political
Involvement.’’ American Political Science Review 87:963–75.
78 CHANG AND KROSNICK
Krosnick, Jon A., David S. Boninger, Yao-Chia Chuang, Matthew K. Berent,
and Catherine G. Carnot. 1993. ‘‘Attitude Strength: One Construct or Many
Related Constructs?’’ Journal of Personality and Social Psychology 65:1132–49.
Kubey, Robert, and Mihaly Csikszentmihalyi. 1990. Television and the Quality of
Life: How Viewing Shapes Everyday Experience. Hillsdale, NJ: Lawrence
Erlbaum.
Lyberg, Lars. 1989. ‘‘Sampling, Nonresponse, and Measurement Issues in the
1984–85 Swedish Time Budget Survey.’’ Proceedings of the Fifth Annual
Research Conference, U.S. Bureau of the Census, 1989, pp. 210–31.
Marini, Margaret M., and Beth A. Shelton. 1993. ‘‘Measuring Household Work:
Recent Experience in the United States.’’ Social Science Research 22:361–82.
Market Facts, Inc. (n.d.). Frequency measurement: Past vs. average period.
Research on Research 7. Arlington Heights, IL: Market Facts.
Mastro, Dana E., and Charles Atkin. 2002. ‘‘Exposure to Alcohol Billboards and
Beliefs and Attitudes Toward Drinking Among Mexican American High
School Students.’’ Howard Journal of Communications 13:129–51.
Menon, Geeta. 1993. ‘‘The Effects of Accessibility of Information in Memory on
Judgments of Behavioral Frequencies.’’ Journal of Consumer Research
20:431–40.
———. 1994. ‘‘Judgments of Behavioral Frequencies: Memory Search and
Retrieval Strategies.’’ Pp. 161–72 in Autobiographical Memory and the Validity
of Retrospective Reports, edited by Norbert Schwarz and Seymour Sudman.
New York: Springer-Verlag.
Messick, Samuel. 1989. ‘‘Validity.’’ Pp. 13–103 in Educational Measurement,
edited by R. Linn. New York: Macmillan.
Noel, Nora E., and Dale J. Cohen. 1997. ‘‘Changes in Substance Use During
Times of Stress: College Students the Week Before Exams.’’ Journal of Drug
Education 27:363–72.
Price, Vincent. 1993. ‘‘The Impact of Varying Reference Periods in Survey Ques-
tions About Media Use.’’ Journalism Quarterly 70:615–27.
Robinson, John. P. 1977. How Americans Use Time: A Social-Psychological
Analysis of Everyday Behavior. New York: Praeger.
Robinson, John P., and Jonathon Gershuny. 1994. ‘‘Measuring Hours of Paid
Work: Time-Diary vs. Estimate Questions.’’ Bulletin of Labor Statistics,
xi-xvii. Geneva: International Labor Office.
Robinson, John P., and Geoffrey Godbey. 1997. Time for Life: The Surprising
Ways Americans Use Their Time. University Park, PA: Pennsylvania State
University Press.
Rosenthal, Robert, and Donald B. Rubin. 1986. ‘‘Meta-Analytic Procedures for
Combining Studies with Multiple Effect Sizes.’’ Psychological Bulletin
99:400–406.
Schuler, Petra B., Mark T. Richardson, Patricia Ochoa, and Min Q. Wang. 2001.
‘‘Accuracy and Repeatability of the Yale Physical Activity Survey in Assessing
Physical Activity of Older Adults.’’ Perceptual and Motor Skills 93:163–77.
Smith, Albert F., Jared B. Jobe, and David J. Mingay. 1991. ‘‘Retrieval from
Memory of Dietary Information.’’ Applied Cognitive Psychology 5:269–96.
MEASURING THE FREQUENCY OF REGULAR BEHAVIORS 79

Stoeber, Joachim, and Jussara Bittencourt. 1998. ‘‘Weekly Assessment of Worry:
An Adaptation of the Penn State Worry Questionnaire for Monitoring
Changes During Treatment.’’ Behaviour Research and Therapy 36:645–56.
Sudman, Seymour, and Norman M. Bradburn. 1974. Response Effects in Surveys:
A Review and Synthesis. Chicago: Aldine.
Tourangeau, Roger, Lance J. Rips, and Kenneth Rasinski. 2000. The Psychology
of Survey Response. Cambridge, England: Cambridge University Press.
Urbany, Joel E., and Peter R. Dickson. 1991. ‘‘Consumer Normal Price Estima-
tion: Market Versus Personal Standards.’’ Journal of Consumer Research
18:45–51.
Verbrugge, Lois, and D. Gruber-Baldine. 1993. ‘‘Baltimore Study of Activity
Patterns.’’ Ann Arbor, MI: Institute of Gerontology, University of Michigan.
Visser, Penny S., and Jon A. Krosnick. 1998. ‘‘Development of Attitude Strength
Over the Life Cycle: Surge and Decline.’’ Journal of Personality and Social
Psychology 75:1389–410.
Worden, John K., and Brian S. Flynn. 2002. ‘‘Using Mass Media to Prevent
Cigarette Smoking.’’ Pp. 23–33 in Public Health Communication: Evidence for
Behavior Change, edited by Robert C. Hornik. Mahwah, NJ: Lawrence
Erlbaum.
Zaller, John R. 1990. ‘‘Political Awareness, Elite Opinion Leadership, and the
Mass Survey Response.’’ Social Cognition 8:125–53.
———. 1992. The Nature and Origins of Mass Opinion. New York: Cambridge
University Press.
80 CHANG AND KROSNICK