Embed Size (px)
Citation preview

Measuring the Interrelations Among Multiple Paradigms of VisualAttention: An Individual Differences Approach
Liqiang HuangThe Chinese University of Hong Kong, Hong Kong, China
Lei MoThe South China Normal University, Guangzhou,
Guangdong, China
Ying LiZhengzhou University, Zhengzhou, Henan, China
A large part of the empirical research in the field of visual attention has focused on various concreteparadigms. However, as yet, there has been no clear demonstration of whether or not these paradigms areindeed measuring the same underlying construct. We collected a very large data set (nearly 1.3 milliontrials) to address this question. We tested 257 participants on nine paradigms: conjunction search,configuration search, counting, tracking, feature access, spatial pattern, response selection, visualshort-term memory, and change blindness. A fairly general attention factor was identified. Some of theparticipants were also tested on eight other paradigms. This general attention factor was found to becorrelated with intelligence, visual marking, task switching, mental rotation, and Stroop task. On theother hand, a few paradigms that are very important in the attention literature (attentional capture,consonance-driven orienting, and inhibition of return) were found to be dissociated from this generalattention factor.
Keywords: visual attention, individual differences, general attention factor
In recent decades, visual attention and related processes havebeen among the most rapidly growing fields in cognitive psychol-ogy and neuroscience. A large part, although by no means all, ofthe empirical research in these fields has been driven by veryconcrete paradigms, such as visual search (e.g., Treisman & Ge-lade, 1980), change blindness (e.g., Rensink, Oregan, & Clark,1997), and attentional tracking (Pylyshyn & Storm, 1988). Theseparadigms have spawned thousands of studies and a very in-depthunderstanding has been gained of particular paradigms. However,it is hard to say how the knowledge gained from the variousparadigms could work together to reveal the fundamental under-lying construct, namely visual attention.
The central idea of the concept of attention is a limit of infor-mation processing. Visual search, for example, is considered toreflect attention because observers try to find goal-relevant infor-mation (i.e., targets) and exclude goal-irrelevant information (i.e.,
distractors), presumably because it is impossible to process all ofthe information efficiently due to the limit of information process-ing. All of these classic paradigms are reasonably related to thegeneral concept of attention. But, to the best of our knowledge,there is no explicit agreement in the field as to whether or not thelimits reflected in these paradigms are the same. On the one hand,it is perhaps not implausible that the same general attention factoris behind all of these different paradigms. On the other hand, it isalso easily conceivable that these different paradigms could reflectlimits in the different stages of information processing; if so, theywould be dissociated from each other. The present study tries toexplore the research question of the relationships between thesemultiple paradigms, specifically to see how unified (or how sep-arable) they are, in order to shed light on the nature of theunderlying limit(s). To start, we will consider the different ways ofstudying this question.
Previous Approaches
Before introducing the rationale of the present approach, let usfirst consider other approaches that have been attempted to achievethe goal of revealing the relationships between multiple visualattention paradigms. First, scientists have empirically tested therelationships between different paradigms based on dual-task per-formance (e.g., Alvarez, Horowitz, Arsenio, DiMase, & Wolfe,2005). Even though these studies have shed useful light on thistopic, they lack the power of comparing many paradigms simul-taneously. Hypothetically, assume that we found that both para-digms A and B and paradigms A and C interfere with each other.Paradigms A and B therefore share some common attentional
This article was published Online First January 16, 2012.Liqiang Huang, Department of Psychology, The Chinese University of
Hong Kong, Hong Kong, China; Lei Mo, Department of Psychology, TheSouth China Normal University, Guangzhou, Guangdong, China; Ying Li,Department of Education, Zhengzhou University, Zhengzhou, Henan,China.
This research was supported by RGC Grant 446110 from the Hong KongGovernment.
Correspondence concerning this article should be addressed to LiqiangHuang, Department of Psychology, The Chinese University of Hong Kong,Hong Kong, China. E-mail: [email protected] or Lei Mo, Depart-ment of Psychology, The South China Normal University, Guangzhou,Guangdong, China. E-mail: [email protected]
Journal of Experimental Psychology: © 2012 American Psychological AssociationHuman Perception and Performance2012, Vol. 38, No. 2, 414–428
0096-1523/12/$12.00 DOI: 10.1037/a0026314
414

limit, as do paradigms A and C. However, we cannot knowwhether there is a general attentional limit for all three paradigmsbecause what is shared between A and B could well be differentfrom what is shared between A and C. Therefore, these studiesshed little light on the overall picture across multiple paradigms.
Second, scientists have developed broad theories that try toincorporate these disparate paradigms into one framework. Thishas been a successful approach in other disciplines, such as phys-ics; Newton’s Laws, for example, led to a breakthrough in classicalmechanics, largely because they explained phenomena that seemedto be totally irrelevant to each other, such as gravity on the Earthand the trajectory of planets. Nevertheless, how theoretical con-cepts should be interpreted in novel paradigms is often rathersubjective in this field, thus making it difficult for these theories tomake uncontroversial predictions. The seminal feature integrationtheory (Treisman & Gelade, 1980), for example, has substantiallyadvanced our understanding of visual attention, but, apart fromthose paradigms that have been explicitly presented along with thetheory (e.g., a visual search for a feature singleton), it is not alwaysclear how conceptual notions such as “parallel feature processing”should be interpreted in a novel paradigm. The recent Boolean maptheory has shown that “feature processing” is not parallel when allfeature values have to be consciously accessed (Huang & Pashler,2007; Huang, Treisman, & Pashler, 2007; Huang, 2010), thusmaking it clear that the implications of even a straightforward termcould be difficult to interpret in a novel paradigm.
Other important theoretical frameworks have also been pro-posed to try to give a unified description across multiple para-digms. The biased competition model (Desimone & Duncan,1995), for example, has tried to propose a unified neuronal expla-nation for a set of fairly diverse findings. Bundesen’s TVA (theoryof visual attention, Bundesen, 1990) approaches this question evenmore explicitly: it uses only a few variables to provide a goodquantitative fitting for the behavioral results of multiple para-digms. From another perspective, Posner and Petersen (1990) haveproposed three attentional networks (vigilance, orienting, and con-flict resolution) and have provided support for this division fromtasks such as the Attention Networks Test (ANT). Although thereis no doubt that these theories/models have all shed very importantlight on the mechanisms of visual attention, it remains largelyunclear how most classic attention paradigms are related to eachother.
An Individual Differences Approach
In the present study, we take an approach that differs from thoseoutlined above. We measure the performance of a group of humanobservers on many paradigms. The basic rationale of this individ-ual differences analysis can be exemplified as follows: if observ-ers’ performances are correlated on paradigms A and B but theseperformances are not correlated with the performance on paradigmC, this means that A and B are related to each other in some way(e.g., they share part of their underlying mechanisms), but C isprobably measuring something different. More sophisticated tech-niques (e.g., factor analysis) allow the “structure” of multipleparadigms to be extracted, as will be discussed below.
This approach has advantages over the two approaches outlinedabove. First, it allows the simultaneous comparison of many par-adigms. Second, the conclusions that emerge from this analysis
should be relatively objective, uncontaminated by the bias causedby the theoretical positions of particular researchers. Certainly, thisapproach also has its limitations. Unlike experimental designs,correlational studies cannot precisely determine the direction ofcausality. At the very least, this new approach can provide uniqueinsights and should supplement the two approaches describedabove.
This individual differences approach has been widely applied insocial psychology, developmental psychology, and some areas ofcognitive psychology, such as intelligence and executive function(e.g., Engle, Tuholski, Laughlin, & Conway, 1999; Kane & Engle,2000; Miyake et al., 2000), and has made a substantial impact.However, its application in the field of visual attention has beenrelatively limited; it has mainly been used in the ways describedbelow.
Previous Studies on Individual Differences
In a series of studies, Engle, Kane, and their colleagues arguedthat individual working memory capacity is strongly related withexecutive attention (Kane & Engle, 2002; Engle, 2002; Engle &Kane, 2004; Kane, Bleckley, Conway, & Engle, 2001; Kane &Engle, 2003; Kane, Poole, Tuholski, & Engle, 2006). They com-pared the performance of observers with high and low workingmemory span in various tasks. In Kane et al. (2001), observerswere required to detect targets in either cued or uncued locations;there was no difference between the two groups in the task involv-ing the detection of cued targets, but the high-span group wassignificantly better than the low-span group in detecting uncuedtargets, suggesting that working memory capacity is not correlatedwith automatic orienting but is correlated with the voluntary at-tentional control process. Kane and Engle (2003) found consistentevidence for the working memory attention relation from a Strooptask. It is interesting that Kane et al. (2006) found that the perfor-mance of high and low working memory span groups was equiv-alent in feature search, conjunction search, and spatial configura-tion search tasks, suggesting that “executive attention” may differfrom the “visual attention” involved in visual search tasks.
The individual differences approach has also been applied in thevisual attention field to determine the interrelations between themultiple factors of one paradigm. Here, we will use attentionalblink as an example. Arnell, Howe, Joanisse, and Klein (2006)showed that the magnitude of observers’ attentional blink was onlymoderately predicted by their target 1 accuracy and not predictedat all by either their target 2 accuracy or single-target accuracy.This suggests that individual attentional blink magnitude is notwell explained by general information-processing efficiency. Onthe other hand, Colzato, Spape, Pannebakker, and Hommel (2007)found that individual attentional blink magnitude was correlated(negatively) with working memory operation span but not withintelligence, and they argued for the possible role of individualprocessing limits in attentional blink. Arnell, Stokes, MacLean andGicante (2010) further showed that it is not the static storagecapacity, but rather the executive component, of visual workingmemory that affects individual attentional blink magnitude.
A third interesting application of the individual differencesapproach is its use in characterizing a distinctive feature of someunique observers. For example, Green and Bavelier (2003, see alsoGreen & Bavelier, 2006, 2007) showed that habitual action video
415MULTIPLE PARADIGMS OF VISUAL ATTENTION
game players performed better than nonplayers in various cogni-tive tasks involving visual attention and working memory.
Although very useful insights have been gained from each of theabove-mentioned approaches, they have not directly helped toreveal the underlying relationships between multiple visual atten-tion paradigms. Although the studies of Engle, Kane, and theircolleagues (e.g., Kane & Engle, 2002; Engle, 2002; Engle & Kane,2004) have focused on the relationships between different para-digms (i.e., working memory vs. executive attention), they did notsimultaneously cover important visual attention paradigms (e.g.,visual search, tracking, and change blindness). More importantly,Kane and colleagues (2006) seemed to imply that the “executiveattention” they studied is separate from the “visual attention”studied by experimental psychologists.
To answer the question on the underlying relationships betweenmultiple visual attention paradigms, the appropriate approach is totest many visual attention paradigms on one group of observersand to use exploratory factor analysis (EFA) to extract the con-structs. To the best of our knowledge, this relatively straightfor-ward approach has not been tried before. The reasons for this arenot completely obvious, although we suspect there may be tworeasons. First, the experimental and psychometric methods ofstudying “attention” remain relatively segregated; therefore, thestudies based on psychometric methods have not systematicallycovered those paradigms that have mainly interested experimentalpsychologists. Second, perhaps the exceptionally large data de-mands of this approach make it impractical. Unlike many of thequestionnaires studies, which can efficiently measure dozens ofvariables in one or two sessions, measuring the performance ofobservers on these attentional paradigms takes much longer. Aseparate session of decent length is needed to measure just onevariable. To ensure reliable and clear-cut results, we collected alarge set of data (about 3,200 separate sessions from 257 partici-pants).
In the present study, we adopted a typical exploratory approachof individual differences analysis. In this approach, a researcherseeks to understand the empirical associations among a set ofmeasurements. The specific technique we used, principal compo-nents analysis (PCA), calculates the pattern of correlations amonga set of variables and attempts to reduce these variables to severalprincipal components. More specifically, this technique, whenapplied to a set of variables, identifies coherent subsets that arerelatively separate from each other and a coherent subset (i.e., agroup of variables that are correlated with each other but largelyuncorrelated with other subsets of variables) is combined into onefactor (or principal component). The extracted factors are sup-posed to reflect the relatively independent underlying mechanismsthat have caused the correlations among the variables.
Possible Relationships Between the Various Paradigms
In this field, when the term attention is used to refer to manydifferent paradigms, researchers may, often implicitly, have verydifferent assumptions. Some researchers (e.g., those who proposegeneral theoretical frameworks, such as those mentioned above)may indeed intend to suggest that there is a general attentionallimit that is shared by many, if not all, of these paradigms; forothers, the term may be nothing more than a convenient label.Next, we will consider the possible relationships between the
different paradigms and also how they could be distinguishedbased on the present study’s individual differences data.
A General Attention Factor
First, there may be a general attention factor (i.e., a generalattentional limit) that is shared by the majority of the paradigmsthat have been conventionally included in this field. This wouldmanifest itself as a general factor shared by many of the para-digms. However, even if this pattern shows up in the results, beforewe can reach a conclusion on a general attention factor, onepotential issue has to be addressed: the contribution of generalcognitive ability. A century of research has shown that whenperformances are measured on a wide range of cognitive tasks, thecorrelations between them are usually all positive. Such findingsled to Spearman’s theory of the g factor (e.g., Spearman, 1927).Generally, a first factor, often defined as the g factor, will accountfor a large portion of the variance across all of the cognitive taskstested, with the second and subsequent factors accounting for lessof the variance. Normally, the impact of the g factor is reflected invery strong correlations with standard intelligence tests such asRaven’s test (Raven, 1962). Therefore, to address this potentialconcern, we included Raven’s test in our list of paradigms.
Paradigm-Specific Mechanisms
Second, given that in the various paradigms the nature of atten-tion involved is rather different, there will probably be somemechanisms that are unique to each of the specific paradigms. Aparadigm-specific mechanism would manifest itself as the gapbetween the portion of the variance that could be explained by thefactor(s) and the portion of the “reliable” variance that could beestimated from the reliability of the measurement. For example, iffor one paradigm, 30% of the variance can be explained by thefactor(s) and the reliability of the measurement is 0.9, then themechanism of this paradigm is mostly unique. Generally, giventhe apparent diversity of the different paradigms, one may expectthat paradigm specific mechanisms would account for a fairamount of variance. The present study should shed light on thisissue by determining the extent of such paradigm-specific mech-anisms: are the mechanisms of these paradigms mostly unique ormostly shared with the others?
Semigeneral Mechanisms
Between the two possibilities mentioned above, there could bemechanisms that contribute to a few, but not all, of the paradigmsin the field of attention. In the present study, we will see whetherany such semigeneral mechanism is apparent in the data.
Choice of Paradigms and Outline of the Present Study
Although we have tried to study this topic systematically usinga fairly large number of paradigms, the term attention, as we useit, still only refers to one subset of the concepts/areas covered bythis word in the literature. As our main research interest is the topicof visual attention, the present study focuses on the selectiveprocessing and representation of visual information (primarilyperceptual information, but sometimes also memorized informa-tion). We have therefore not covered attention in other modalities
416 HUANG, MO, AND LI

(e.g., auditory attention, Broadbent, 1958), vigilance (e.g., Mack-worth, 1969), or attention in more central processing (e.g., Bad-deley, 1986; see also Moosbrugger, Goldhammer, & Schweizer,2006 for an attempt to distinguish this from perceptual attentionbased on individual differences).
The present study is divided into two steps: primary paradigmsand secondary paradigms.
Primary Paradigms
Nine primary paradigms were completed by 257 participants,with a separate session for each paradigm. The nine primaryparadigms were chosen based on the criterions that each paradigmhad to be a classic paradigm in the field of visual attention, and/orconceptually characterize visual attention very well. Given thesestandards, we settled on nine paradigms: conjunction search, con-figuration search, counting, tracking, feature access, spatial pat-tern, response selection, visual short-term memory, and changeblindness. In the pilot testing, we also included feature search (e.g.,Treisman & Gelade, 1980), but this was removed from the listbecause its split-half reliability was lower than 0.7.
Secondary Paradigms
Some of the participants completed eight secondary paradigms,with a separate session for each paradigm. Among these secondaryparadigms, five (visual marking, attentional capture, consonance-driven orienting, inhibition of return, and mental rotation) wereincluded because they are also important attention paradigms.Stroop task and task switching were chosen because it has previ-ously been reported that they are important functions of executivefunction (Miyake et al., 2000); therefore, including these para-digms can help us to understand the relationship between visualattention and executive function. Intelligence, as measured byRaven’s test, was also included because it is often reported thatintelligence is correlated with “mental capacities” (Engle et al.,
1999) and also because, as mentioned above, we wanted to knowto what extent the factor(s) that emerge from visual attentionparadigms are caused by the g factor. In the pilot testing, we alsoincluded attentional blink (e.g., Raymond, Shapiro, & Arnell,1992), priming of pop-out (e.g., Maljkovic & Nakayama, 1994),negative priming (e.g., Tipper & Driver, 1988), and contextualcueing (e.g., Chun & Jiang, 1998). However, these four paradigmswere removed from the list because their split-half reliabilitieswere lower than 0.7.
Both the primary and secondary paradigms, together with somekey references, are listed in Table 1. Further descriptions of theindividual paradigms are given in the Method section.
The primary paradigms were tested using a large number ofparticipants; therefore, PCA (see below) was performed to extractthe general attention factor(s) from the nine variables measured inthese nine paradigms. The secondary paradigms were tested usingfewer (in some cases, much fewer) participants, and so we merelytested whether they were correlated with the attention factor(s) thathad been extracted from the primary paradigms.
Method
Participants
The participants in this study were 257 students from SouthChina Normal University, all of whom had normal or corrected-to-normal visual acuity.
Apparatus
The stimuli were presented on 1,024 � 768 pixel color moni-tors. The participants viewed the displays from a distance of about60 cm and responded using a keyboard. The program was writtenin Microsoft Visual Basic 6.0.
Table 1Key References and Descriptive Statistics for the Nine Primary Paradigms and Eight Secondary Paradigms
Paradigm Key references Mean (SD) N Skewness Kurtosis
Nine Primary Paradigms(N � 257)
Conjunction Search Treisman & Gelade, 1980 77 msec/item (25) 257 �0.26 0.17Configuration Search Egeth & Dagenbach, 1991 67 msec/item (21) 257 0.12 �0.02Counting Gelman & Gallistel, 1978 33 msec/item (7) 257 �0.29 0.08Tracking Pylyshyn & Storm, 1988 2.91 items (0.72) 257 0.27 �0.11Feature access Duncan, 1980 38 msec (23) 257 �0.02 �0.21Spatial pattern Barlow & Reeves, 1979 121 msec (74) 257 �0.03 �0.13Response selection Passingham, 1993 647 msec (112) 257 �0.11 0.06Visual short-term memory Phillips, 1974 2.64 items (0.58) 257 0.39 0.31Change blindness Rensink, Oregan, & Clark, 1997 0.479 (0.112) 257 �0.35 �0.25
Eight Secondary Paradigms(N � 257)
Intelligence (Raven’s test) Raven, 1962 55.5 (3.6) 247 �0.05 0.06Visual marking Watson & Humphreys, 1997 54.1% (23.2%) 95 �0.42 0.29Attentional capture Yantis & Jonides, 1984 11.4% (7.4%) 95 0.15 0.46Consonance-driven orienting Soto et al., 2008 0.885 (0.173) 95 0.69 �0.72Inhibition of return Posner & Cohen, 1984 29 msec (23) 95 �0.08 �0.47Task switching Monsell, 2003 284 msec (144) 95 0.42 0.02Mental rotation Shepard & Metzler, 1971 238 msec (147) 94 0.51 �0.46Stroop task Macleod, 1991 106 msec (52) 95 �0.43 �0.08
Note. In each session, if the measurement was response time, we excluded the outliers (values outside 3 standard deviations). Variables that were skewedand/or kurtotic were transformed to achieve approximate normality. For each variable, reliability was estimated by calculating the split-half (odd-even)correlations, and the Spearman-Brown formula was used for adjustment. See text for details of the measurements.
417MULTIPLE PARADIGMS OF VISUAL ATTENTION
Primary Paradigm 1: Conjunction Search
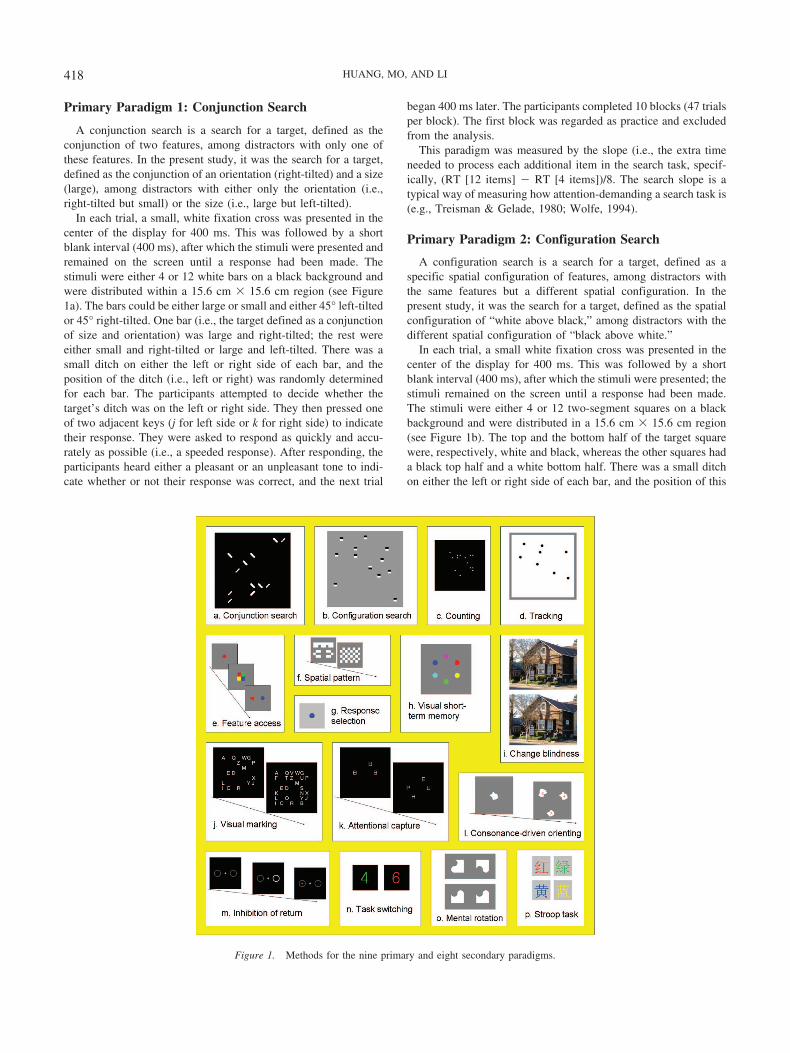
A conjunction search is a search for a target, defined as theconjunction of two features, among distractors with only one ofthese features. In the present study, it was the search for a target,defined as the conjunction of an orientation (right-tilted) and a size(large), among distractors with either only the orientation (i.e.,right-tilted but small) or the size (i.e., large but left-tilted).
In each trial, a small, white fixation cross was presented in thecenter of the display for 400 ms. This was followed by a shortblank interval (400 ms), after which the stimuli were presented andremained on the screen until a response had been made. Thestimuli were either 4 or 12 white bars on a black background andwere distributed within a 15.6 cm � 15.6 cm region (see Figure1a). The bars could be either large or small and either 45° left-tiltedor 45° right-tilted. One bar (i.e., the target defined as a conjunctionof size and orientation) was large and right-tilted; the rest wereeither small and right-tilted or large and left-tilted. There was asmall ditch on either the left or right side of each bar, and theposition of the ditch (i.e., left or right) was randomly determinedfor each bar. The participants attempted to decide whether thetarget’s ditch was on the left or right side. They then pressed oneof two adjacent keys (j for left side or k for right side) to indicatetheir response. They were asked to respond as quickly and accu-rately as possible (i.e., a speeded response). After responding, theparticipants heard either a pleasant or an unpleasant tone to indi-cate whether or not their response was correct, and the next trial
began 400 ms later. The participants completed 10 blocks (47 trialsper block). The first block was regarded as practice and excludedfrom the analysis.
This paradigm was measured by the slope (i.e., the extra timeneeded to process each additional item in the search task, specif-ically, (RT [12 items] � RT [4 items])/8. The search slope is atypical way of measuring how attention-demanding a search task is(e.g., Treisman & Gelade, 1980; Wolfe, 1994).
Primary Paradigm 2: Configuration Search
A configuration search is a search for a target, defined as aspecific spatial configuration of features, among distractors withthe same features but a different spatial configuration. In thepresent study, it was the search for a target, defined as the spatialconfiguration of “white above black,” among distractors with thedifferent spatial configuration of “black above white.”
In each trial, a small white fixation cross was presented in thecenter of the display for 400 ms. This was followed by a shortblank interval (400 ms), after which the stimuli were presented; thestimuli remained on the screen until a response had been made.The stimuli were either 4 or 12 two-segment squares on a blackbackground and were distributed in a 15.6 cm � 15.6 cm region(see Figure 1b). The top and the bottom half of the target squarewere, respectively, white and black, whereas the other squares hada black top half and a white bottom half. There was a small ditchon either the left or right side of each bar, and the position of this
Figure 1. Methods for the nine primary and eight secondary paradigms.
418 HUANG, MO, AND LI

ditch (i.e., left or right) was randomly determined for each square.The participants attempted to decide whether the ditch beside thetarget was on the left or right side. They then pressed one of twoadjacent keys (j for left side or k for right side) to indicate theirresponse. They were asked to respond as quickly and accurately aspossible (i.e., a speeded response). After responding, the partici-pants heard either a pleasant or an unpleasant tone to indicatewhether or not their response was correct, and the next trial began400 ms later. The participants completed 10 blocks (51 trials perblock). The first block was regarded as practice and excluded fromthe analysis.
This paradigm was measured by the slope (i.e., the extra timeneeded to process each additional item in the search task, specif-ically, (RT [12 items] � RT [4 items])/8. The search slope is atypical way of measuring how attention-demanding a search task is(e.g., Treisman & Gelade, 1980; Wolfe, 1994).
Primary Paradigm 3: Counting
Counting involves counting the number of items (e.g., whiteballs in the present study) in a display.
In each trial, a small white fixation cross was presented in thecenter of the display for 400 ms. This was followed by a shortblank interval (400 ms), after which the stimuli were presented; thestimuli remained on the screen until a response had been made.The stimuli were 3, 4, 13, or 14 white dots (diameter � 0.23 cm)on a black background distributed within a 10.4 cm � 10.4 cmregion (see Figure 1c). The participants attempted to decidewhether there was an even (i.e., 4 or 14) or odd (i.e., 3 or 13)number of dots in the display. They then pressed one of twoadjacent keys (j for an odd number or k for an even number) toindicate their response. They were asked to respond as quickly andaccurately as possible (i.e., a speeded response). After responding,the participants heard either a pleasant or an unpleasant tone toindicate whether or not their response was correct, and the nexttrial began 400 ms later. The participants completed 10 blocks (40trials per block). The first block was regarded as practice andexcluded from the analysis.
This paradigm was measured by the counting slope (i.e., thetime needed to count each additional item, specifically, (RT [13items] � RT [14 items] � RT [3 items] � RT [4 items])/20. Thecounting slope is a typical way of measuring how difficult acounting task is (e.g., Gelman & Gallistel, 1978).
Primary Paradigm 4: Tracking
Tracking involves keeping track of a subset among severalvisually identical items (e.g., black balls in the present study) thatmove around on random trajectories.
In each trial, eight black balls were randomly placed within a14.6 cm � 14.6 cm white region (see Figure 1d). At the beginningof each trial, four balls (i.e., the target balls) flashed for 2 seconds.After the flashing stopped, the items began to move around onrandom trajectories at a speed of 6 cm/second. After 10 seconds ofmovement, the position of each item was covered by a button. Theparticipants then attempted to identify the four target items byclicking the corresponding buttons. After four clicks, either apleasant or unpleasant tone would sound to indicate whether or notall four responses were correct, and the next trial began 400 ms
later. The participants completed nine blocks (9 trials per block).The first block was regarded as practice and excluded from theanalysis.
This paradigm was measured using an estimate of the number ofitems that can be tracked (calculated from the average accuracy).Estimate of tracking capacity is a typical way of measuring track-ing ability (e.g., Pylyshyn & Storm, 1988).
Primary Paradigm 5: Feature Access
Feature access involves perceiving a feature (e.g., the colors ofballs in the present study) in a brief and masked display.
In each trial, a small white fixation cross was presented in thecenter of the display for 400 ms. This was followed by a shortblank interval (400 ms), after which the stimuli were presented fora short period and then covered by masks. Each stimulus was acolored ball that could be red, green, yellow, or blue. The exposureduration of the stimuli was adjusted for each individual participantso that their overall performances were moderate. The masksremained on the display for 200 ms and then disappeared. Imme-diately following the disappearance of the mask, the test displaywas presented showing two items, only one of which had appearedin the stimulus display; this test display remained on the screenuntil a response had been made. One sequence (stimulus3 mask3 test display) is shown in Figure 1e. The participants attemptedto decide which of the two items in the test display had beenpresented in the stimulus display. They then pressed one of twoadjacent keys (j for the left item and k for the right item) to indicatetheir response. They were asked to respond as accurately as pos-sible, but were under no time pressure (i.e., an unspeeded re-sponse). After responding, the participants heard either a pleasantor an unpleasant tone to indicate whether or not their response wascorrect, and the next trial began 400 ms later. The participantscompleted 10 blocks (40 trials per block). The first block wasregarded as practice and excluded from the analysis.
This paradigm was measured by the exposure duration thresh-old, which was the exposure duration required to do this task to anaccuracy of 75%. Exposure duration (or, sometimes, accuracy in abrief display of fixed duration) is a typical way of measuring theaccess of information (Duncan, 1980).
Primary Paradigm 6: Spatial Pattern
Spatial pattern involves perceiving a spatial pattern or relation-ship (e.g., the presence of symmetry in the present study).
In each trial, a small white fixation cross was presented in thecenter of the display for 400 ms. This was followed by a shortblank interval (400 ms), after which the stimuli were presented fora short period and then covered by masks (as shown in Figure 1f).The stimuli were white patterns, which could be either symmetri-cal or asymmetrical. The exposure duration of the stimuli wasadjusted for each individual participant so that their overall per-formances were moderate. The masks remained on the display for200 ms and then disappeared. The participants attempted to decidewhether the pattern was symmetrical or asymmetrical. They thenpressed one of two adjacent keys (j for the left item and k for theright item) to indicate their response. They were asked to respondas accurately as possible, but were under no time pressure (i.e., anunspeeded response). After responding, the participants heard ei-
419MULTIPLE PARADIGMS OF VISUAL ATTENTION
ther a pleasant or an unpleasant tone to indicate whether or nottheir response was correct, and the next trial began 400 ms later.The participants completed 10 blocks (40 trials per block). Thefirst block was regarded as practice and excluded from the anal-ysis.
This paradigm was measured by the exposure duration thresh-old, which was the exposure duration required to do this task to anaccuracy of 75%. Exposure duration (or, sometimes, accuracy in abrief display of fixed duration) is a typical way of measuring theability to perceive a spatial pattern (Barlow & Reeves, 1979).
Primary Paradigm 7: Response Selection
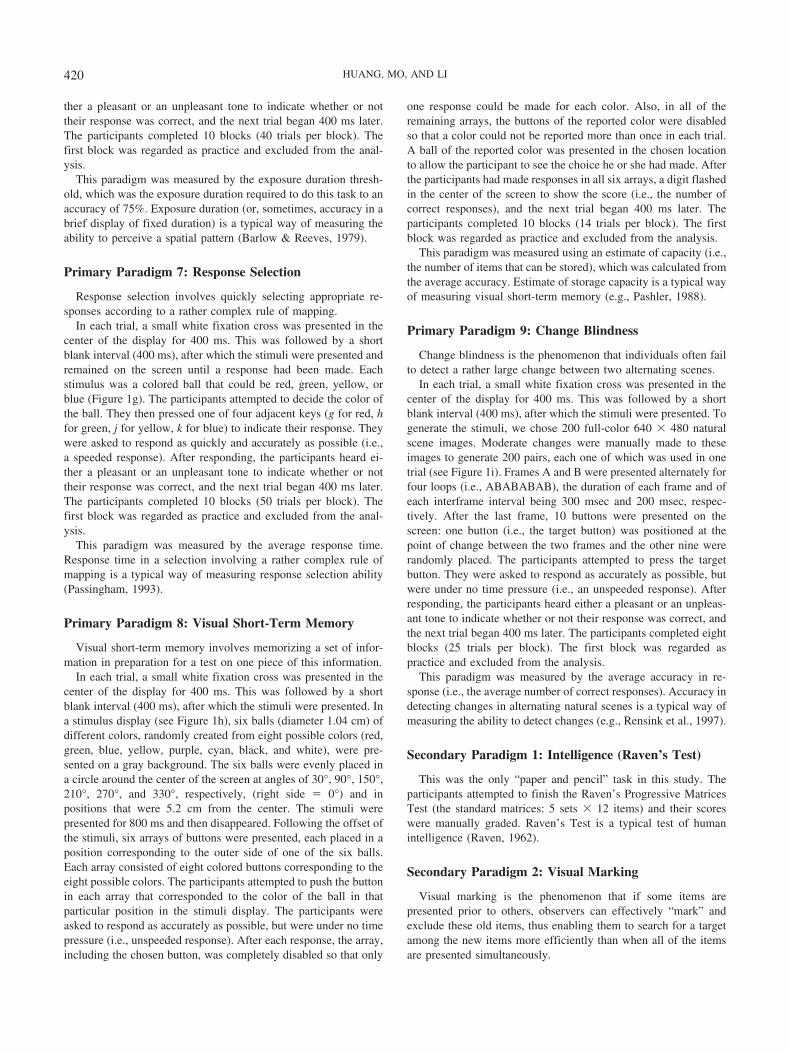
Response selection involves quickly selecting appropriate re-sponses according to a rather complex rule of mapping.
In each trial, a small white fixation cross was presented in thecenter of the display for 400 ms. This was followed by a shortblank interval (400 ms), after which the stimuli were presented andremained on the screen until a response had been made. Eachstimulus was a colored ball that could be red, green, yellow, orblue (Figure 1g). The participants attempted to decide the color ofthe ball. They then pressed one of four adjacent keys (g for red, hfor green, j for yellow, k for blue) to indicate their response. Theywere asked to respond as quickly and accurately as possible (i.e.,a speeded response). After responding, the participants heard ei-ther a pleasant or an unpleasant tone to indicate whether or nottheir response was correct, and the next trial began 400 ms later.The participants completed 10 blocks (50 trials per block). Thefirst block was regarded as practice and excluded from the anal-ysis.
This paradigm was measured by the average response time.Response time in a selection involving a rather complex rule ofmapping is a typical way of measuring response selection ability(Passingham, 1993).
Primary Paradigm 8: Visual Short-Term Memory
Visual short-term memory involves memorizing a set of infor-mation in preparation for a test on one piece of this information.
In each trial, a small white fixation cross was presented in thecenter of the display for 400 ms. This was followed by a shortblank interval (400 ms), after which the stimuli were presented. Ina stimulus display (see Figure 1h), six balls (diameter 1.04 cm) ofdifferent colors, randomly created from eight possible colors (red,green, blue, yellow, purple, cyan, black, and white), were pre-sented on a gray background. The six balls were evenly placed ina circle around the center of the screen at angles of 30°, 90°, 150°,210°, 270°, and 330°, respectively, (right side � 0°) and inpositions that were 5.2 cm from the center. The stimuli werepresented for 800 ms and then disappeared. Following the offset ofthe stimuli, six arrays of buttons were presented, each placed in aposition corresponding to the outer side of one of the six balls.Each array consisted of eight colored buttons corresponding to theeight possible colors. The participants attempted to push the buttonin each array that corresponded to the color of the ball in thatparticular position in the stimuli display. The participants wereasked to respond as accurately as possible, but were under no timepressure (i.e., unspeeded response). After each response, the array,including the chosen button, was completely disabled so that only
one response could be made for each color. Also, in all of theremaining arrays, the buttons of the reported color were disabledso that a color could not be reported more than once in each trial.A ball of the reported color was presented in the chosen locationto allow the participant to see the choice he or she had made. Afterthe participants had made responses in all six arrays, a digit flashedin the center of the screen to show the score (i.e., the number ofcorrect responses), and the next trial began 400 ms later. Theparticipants completed 10 blocks (14 trials per block). The firstblock was regarded as practice and excluded from the analysis.
This paradigm was measured using an estimate of capacity (i.e.,the number of items that can be stored), which was calculated fromthe average accuracy. Estimate of storage capacity is a typical wayof measuring visual short-term memory (e.g., Pashler, 1988).
Primary Paradigm 9: Change Blindness
Change blindness is the phenomenon that individuals often failto detect a rather large change between two alternating scenes.
In each trial, a small white fixation cross was presented in thecenter of the display for 400 ms. This was followed by a shortblank interval (400 ms), after which the stimuli were presented. Togenerate the stimuli, we chose 200 full-color 640 � 480 naturalscene images. Moderate changes were manually made to theseimages to generate 200 pairs, each one of which was used in onetrial (see Figure 1i). Frames A and B were presented alternately forfour loops (i.e., ABABABAB), the duration of each frame and ofeach interframe interval being 300 msec and 200 msec, respec-tively. After the last frame, 10 buttons were presented on thescreen: one button (i.e., the target button) was positioned at thepoint of change between the two frames and the other nine wererandomly placed. The participants attempted to press the targetbutton. They were asked to respond as accurately as possible, butwere under no time pressure (i.e., an unspeeded response). Afterresponding, the participants heard either a pleasant or an unpleas-ant tone to indicate whether or not their response was correct, andthe next trial began 400 ms later. The participants completed eightblocks (25 trials per block). The first block was regarded aspractice and excluded from the analysis.
This paradigm was measured by the average accuracy in re-sponse (i.e., the average number of correct responses). Accuracy indetecting changes in alternating natural scenes is a typical way ofmeasuring the ability to detect changes (e.g., Rensink et al., 1997).
Secondary Paradigm 1: Intelligence (Raven’s Test)
This was the only “paper and pencil” task in this study. Theparticipants attempted to finish the Raven’s Progressive MatricesTest (the standard matrices: 5 sets � 12 items) and their scoreswere manually graded. Raven’s Test is a typical test of humanintelligence (Raven, 1962).
Secondary Paradigm 2: Visual Marking
Visual marking is the phenomenon that if some items arepresented prior to others, observers can effectively “mark” andexclude these old items, thus enabling them to search for a targetamong the new items more efficiently than when all of the itemsare presented simultaneously.
420 HUANG, MO, AND LI

In each trial, a small white fixation cross was presented in thecenter of the display for 400 ms. This was followed by a shortblank interval (400 ms), after which the stimuli were presented.The stimuli were 25 white letters on a black background. All of theletters were different from each other. In each trial, only one of theletters F and H appeared and this letter was the target of the trial;the other 24 letters always appeared in the display. The 25 letterswere divided into two subsets: the target subset, which had nineletters (i.e., the target and 8 other letters), and the distractor subset,which had 16 letters. There were three conditions: the target-onlycondition, in which only the target subset were presented; the gapcondition, in which the target subset was presented 400 msec afterthe distractor subset; and the all condition, in which both the targetand the distractor subsets were presented simultaneously. Thesequence of one sample trial in the gap condition is presented inFigure 1j. The presented letters remained on the screen until aresponse had been made. The participants attempted to decide theidentity of the target. They then pressed one of two adjacent keys(j for target F or k for target H) to indicate their response. Theywere asked to respond as quickly and accurately as possible (i.e.,a speeded response). After responding, the participants heard ei-ther a pleasant or an unpleasant tone to indicate whether or nottheir response was correct, and the next trial began 400 ms later.The participants completed 12 blocks (84 trials per block). Theblocks alternated between the three conditions (i.e., target-only,gap, and all). The first three blocks were regarded as practice andexcluded from the analysis.
This paradigm was measured by the percentage of time saved bythe preview: (RT [all] � RT[gap])/(RT[all] � RT[target-only]).The amount (or percentage) of time that is saved by the preview isa typical way of measuring the effectiveness of visual marking(e.g., Watson & Humphreys, 1997).
Secondary Paradigm 3: Attentional Capture
Attentional capture is the phenomenon that attention tends to beautomatically drawn toward a newly presented item rather than toan item that has already existed in the display.
In each trial, a small white fixation cross was presented in thecenter of the display for 400 ms. This was followed by a shortblank interval (400 ms), after which the prime display was pre-sented. The prime display remained for 800 msec and was thenreplaced by the stimuli display, which remained on the screen untila response had been made. The stimuli were four letters: one target(F or H) and three distractors (randomly chosen from U, S, P, andE). The four letters were randomly placed in four of six possiblelocations; these locations were at angles of 30°, 90°, 150°, 210°,270°, and 330°, respectively, on a circle around the center of thescreen (right side � 0°). The prime display consisted of three “日”symbols, which were randomly placed on three of the four loca-tions to be occupied by letters in the stimuli display. The sequenceof one sample trial is presented in Figure 1k. The participantsattempted to decide the identity of the target. They then pressedone of two adjacent keys (j for target F or k for target H) to indicatetheir response. They were asked to respond as quickly and accu-rately as possible (i.e., a speeded response). After responding, theparticipants heard either a pleasant or an unpleasant tone to indi-cate whether or not their response was correct, and the next trialbegan 400 ms later. The participants completed 10 blocks (70 trials
per block). The first block was regarded as practice and excludedfrom the analysis.
This paradigm was measured by the percentage increase in theresponse time for the “old” condition (i.e., when the target ap-peared in a location that was previously occupied by a “日”)compared to the “new” condition (i.e., when the target appeared ina location that was not previously occupied by a “日”). Theamount (or percentage) of time difference between “old” and“new” conditions is a typical way of measuring the effectivenessof attentional capture (e.g., Yantis & Jonides, 1984).
Secondary Paradigm 4: Consonance-Driven Orienting
Consonance-driven orienting is the phenomenon that attentiontends to be drawn more to an item that resembles the content ofvisual short-term memory than to an item that does not.
In each trial, a small white fixation cross was presented in thecenter of the display for 400 ms. This was followed by a shortblank interval (400 ms), after which a random-shaped white targetpattern was presented in the center of the display. The targetpattern remained on the screen for 800 msec and then disappeared.As the target patterns disappeared, three white patterns were si-multaneously placed evenly on a circle around the center of thescreen. The shape of one of these patterns was identical to thetarget pattern; the shapes of the other two patterns were randomlygenerated. The participants were explicitly instructed that the threepatterns were irrelevant to their tasks. After another 800 msec,three red digits were superimposed on the three patterns. A sampleof these frames is presented in Figure 1l. After another 800 msec,both the white patterns and the red digits disappeared. The testdisplay was then presented. The participants attempted to performtwo tasks in the test display by clicking buttons with a mouse to (1)select the target pattern from a choice of two possible patterns and(2) to report, given the choice of all 10 digits, one of the red digits.The participants were explicitly instructed that reporting any of thethree digits was sufficient for the task. For both tasks, the partic-ipants were asked to respond as accurately as possible, but wereunder no time pressure (i.e., an unspeeded response). After eachresponse, the participants heard either a pleasant or an unpleasanttone to indicate whether or not their response was correct. The nexttrial began 400 ms after both responses had been made. Theparticipants completed 10 blocks (35 trials per block). The firstblock was regarded as practice and excluded from the analysis.
This paradigm was measured by determining, in relation to allreports of any of the presented red digits, the percentage ofresponses that reported the red digit on the pattern identical to thetarget pattern. The frequency of reporting the “primed” item is atypical way of measuring the effectiveness of consonance-drivenorienting (e.g., Soto, Hodsoll, Rotshtein, & Humphreys, 2008;Huang & Pashler, 2006)
Secondary Paradigm 5: Inhibition of Return
Inhibition of return is the phenomenon that when the temporalgap between a cue and a target is about half a second or longer,detecting a target on a precued location is slower than on a locationthat is not precued.
In each trial, a small white fixation dot was presented in thecenter of the display. Two gray circles appeared on the left and
421MULTIPLE PARADIGMS OF VISUAL ATTENTION

right sides of the fixation dots 400 msec later. After a further 800msec, one of the gray circles turned white; it remained white for 50msec and then turn back to gray. This “white flash” served as theexogenous cue. Subsequently, a red target dot appeared in one ofthe circles, either simultaneously with the offset of the white flashor 500 msec later (a 50% probability of each option). The sequenceof one sample trial is presented in Figure 1m. The locations of boththe exogenous cue and the target dot (i.e., left or right circle) wererandomly determined for each trial; therefore, the probability thatthey resided on the same circle or on different circles was 50% ineach case. The participants attempted to detect the presence of thetarget dot, and then pressed one key (j) to indicate their response.They were asked to respond as quickly as possible (i.e., a speededresponse). A key press before the presentation of the target dot wasconsidered an incorrect response. After responding, the partici-pants heard either a pleasant or an unpleasant tone to indicatewhether or not their response was correct, and the next trial began400 ms later. The participants completed 10 blocks (80 trials perblock). The first block was regarded as practice and excluded fromthe analysis.
This paradigm was measured by the difference between re-sponse times for detecting a target dot at the cued and uncuedlocation in trials in which targets appeared 500 msec after theoffset of the cues. The response time (RT) difference between thecued and uncued condition (i.e., RT[cued] � RT[uncued]) whentargets appear long after cues is a typical way of measuring theoccurrence of inhibition of return (e.g., Posner & Cohen, 1984).
Secondary Paradigm 6: Task Switching
Task switching is the phenomenon that when required to switchbetween two tasks, observers perform more slowly than when theyconstantly perform the same task.
In each trial, a small white fixation cross was presented in thecenter of the display for 400 ms. This was followed by a shortblank interval (400 ms), after which a digit (0–9) was presented.This digit could be either red or green, indicating two possibletasks. If the digit was red, the participants performed Task 1(determining whether the digit was odd or even) and then pressedone of two adjacent keys (j for an odd number or k for an evennumber) to indicate their response; if the digit was green, theparticipants performed Task 2 (determining whether the digit wassmall (i.e., � 4) or large (i.e., �5)) and then pressed one of twoadjacent keys (j for a number �4 or k for a number �5) to indicatetheir response. They were asked to respond as quickly and accu-rately as possible (i.e., a speeded response). Examples of the redand green digits are presented in Figure 1n. After responding, theparticipants heard either a pleasant or an unpleasant tone to indi-cate whether or not their response was correct, and the next trialbegan 400 ms later. There were two types of blocks: in task-repetition blocks, the digit remained the same color across thewhole block (i.e., the participants performed the same task acrossthe whole block); in task-alternation blocks, the digit alternatedbetween red and green from trial to trial (i.e., the tasks alternatedfrom trial to trial). The blocks switched between task-repetitionand task-alternation blocks. The participants completed 10 blocks(65 trials per block). The first two blocks were regarded as practiceand excluded from the analysis.
This paradigm was measured by the percentage increase inresponse time for the task-alternation trials compared to the task-repetition trials. The RT difference between the task-alternationand task-repetition condition (i.e., RT[alternation] � RT[repeti-tion]) is a typical way of measuring the cost of task switching (e.g.,Monsell, 2003).
Secondary Paradigm 7: Mental Rotation
Mental rotation is the task of judging, after appropriate rotation,whether two patterns are identical.
In each trial, a small white fixation cross was presented in thecenter of the display for 400 ms. This was followed by a shortblank interval (400 ms), after which the stimuli were presented andremained on the screen until a response had been made. Thestimuli were two patterns that could be either identical or mirror-reflections of each other. In half of the trials, one of the patternswas rotated 90°or �90°. Two examples of “identical” displays,with and without rotation respectively, are presented in Figure 1o.The participants attempted to decide whether the two patterns wereidentical or mirror reflections of each other (after rotation, ifnecessary). They then pressed one of two adjacent keys (j foridentical or k for mirror-reflection of each other) to indicate theirresponse. They were asked to respond as quickly and accurately aspossible (i.e., a speeded response). After responding, the partici-pants heard either a pleasant or an unpleasant tone to indicatewhether or not their response was correct, and the next trial began400 ms later. The participants completed 10 blocks (60 trials perblock). The first block was regarded as practice and excluded fromthe analysis.
This paradigm was measured by the difference in response timesbetween trials in which one of the patterns was rotated and trialswith no such rotation. The RT difference between the rotated andno-rotation condition (i.e., RT[rotated] � RT[no-rotation]) is atypical way of measuring the cost of mental rotation (e.g., Shepard& Metzler, 1971).
Secondary Paradigm 8: Stroop Task
Stroop task is the phenomenon that when required to name onefeature of a stimulus, observers respond more slowly if that nameconflicts with another aspect of the stimulus. In the present study,this involved naming the color of words that are color namesthemselves (e.g., if the word “green” was colored red, the observ-ers should name the feature “red”).
In each trial, a small white fixation cross was presented in thecenter of the display for 400 ms. This was followed by a shortblank interval (400 ms), after which the stimuli were presented andremained on the screen until a response had been made. Thestimulus in each display was one Chinese character that could becolored red, green, yellow, or blue. The characters could be“ ”, “ ”, “ ”, or “ ”, which respectively mean “red”,“green”, “yellow”, and “blue”. The color and identity of thecharacter were consistent in 50% of the trials, but were inconsis-tent in the other 50%. Four examples of characters (two consistentcharacters on the top of two inconsistent characters) are presentedin Figure 1p. The participants attempted to decide the color of thecharacter. They then pressed one of four adjacent keys (g for red,h for green, j for yellow, or k for blue) to indicate their response.
422 HUANG, MO, AND LI
They were asked to respond as quickly and accurately as possible(i.e., a speeded response). After responding, the participants heardeither a pleasant or an unpleasant tone to indicate whether or nottheir response was correct, and the next trial began 400 ms later.The participants completed 10 blocks (100 trials per block). Thefirst block was regarded as practice and excluded from the anal-ysis.
This paradigm was measured by the difference in response timesbetween the consistent and inconsistent trials. The RT differencebetween the consistent and inconsistent condition (i.e., RT[incon-sistent] � RT[consistent]) is a typical way of measuring themagnitude of the Stroop effect (e.g., Macleod, 1991).
Results and Discussion
Transformations and Outlier Analysis
In each session, if the measurement was response time, weexcluded the outliers (values outside 3 standard deviations). Log-arithmic transformations (with reflections if necessary) were ap-plied to variables that were skewed and/or kurtotic to achieveapproximate normality. Also, to simplify the presentation of data,all of the variables that correlated negatively with the generalattention factor (see below) were reflected (i.e., � �1); thistransformation made no difference to the statistical analysis. Spe-cifically, six primary paradigms (conjunction and configurationsearch, counting, feature access, spatial pattern, and response se-lection) and three secondary paradigms (mental rotation, taskswitching, and Stroop task) were reflected. This reflection meansthat smaller values in the original measurements of these para-
digms (e.g., shallower slopes in search and counting tasks, lessswitch cost, less Stroop effect) imply better performance.
Descriptive Statistics
The descriptive statistics of the measures used in the study,including the mean, the standard deviation, skewness, and kurtosis,are shown in Table 1. The reliabilities of these measures are shownin Table 2. For each variable, reliability was estimated by calcu-lating the split-half (odd-even) correlations and the Spearman-Brown formula was used for adjustment. All of the 17 paradigmsmet the minimum reliability of 0.7.
The results for all 17 paradigms replicated the typical find-ings reported in the literature. As shown in Table 1, the para-digms that measured absolute performances were generally inthe typical range. Conjunction search showed a somewhatgreater than typical slope (77 msec/item), although this wasonly because we intentionally used a difficult conjunctionsearch task (i.e., fine feature differences) in order to ensure thatthe conjunction and configuration searches were of similarlevels of difficulty. In the visual marking paradigm, there wasa significant preview advantage (54.1%, p � .001). In theattentional capture paradigm, there was a significant new-itemadvantage (11.4%, p � .001). In the consonance-driven orient-ing task, the memorized item was reported 88.5% of the time,which was much higher than the baseline of 33.3% (p � .001).In the inhibition of return paradigm, the average response timefor the cued items was 29 msec longer than that for the uncueditems (p � .001). In the task-switching paradigm, the averageresponse time in the switched trials was 284 msec longer thanthat in the repeated trials (p � .001). In the Stroop task, the
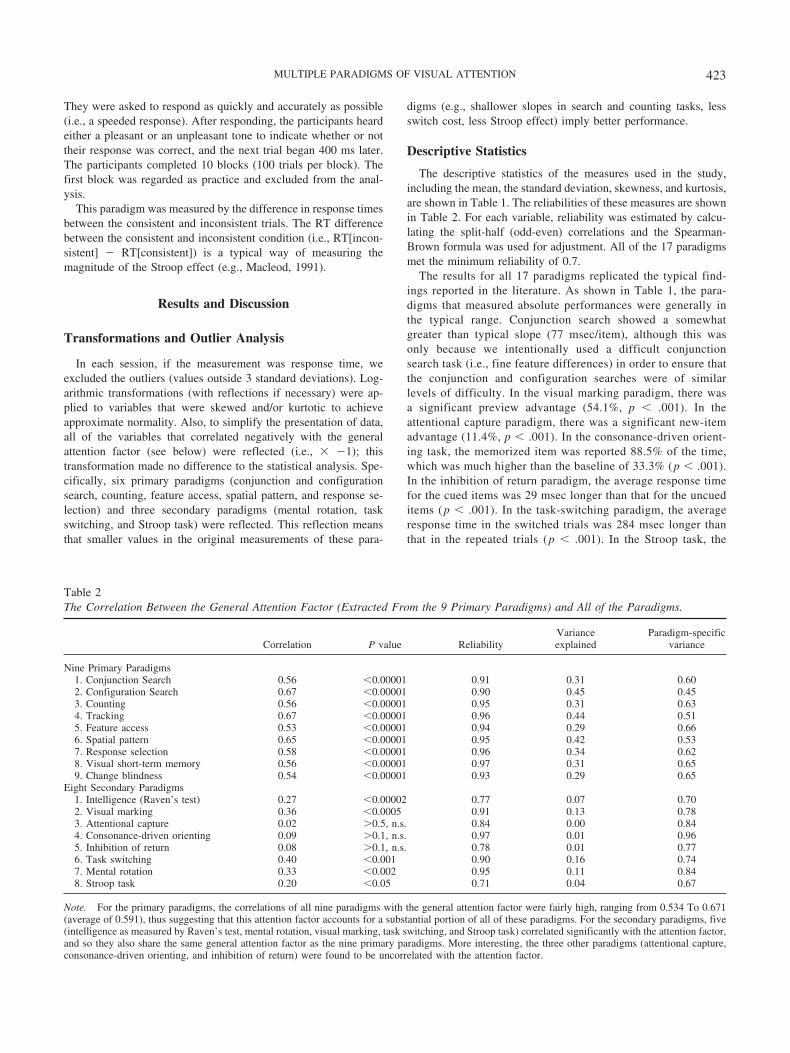
Table 2The Correlation Between the General Attention Factor (Extracted From the 9 Primary Paradigms) and All of the Paradigms.
Correlation P value ReliabilityVarianceexplained
Paradigm-specificvariance
Nine Primary Paradigms1. Conjunction Search 0.56 �0.00001 0.91 0.31 0.602. Configuration Search 0.67 �0.00001 0.90 0.45 0.453. Counting 0.56 �0.00001 0.95 0.31 0.634. Tracking 0.67 �0.00001 0.96 0.44 0.515. Feature access 0.53 �0.00001 0.94 0.29 0.666. Spatial pattern 0.65 �0.00001 0.95 0.42 0.537. Response selection 0.58 �0.00001 0.96 0.34 0.628. Visual short-term memory 0.56 �0.00001 0.97 0.31 0.659. Change blindness 0.54 �0.00001 0.93 0.29 0.65
Eight Secondary Paradigms1. Intelligence (Raven’s test) 0.27 �0.00002 0.77 0.07 0.702. Visual marking 0.36 �0.0005 0.91 0.13 0.783. Attentional capture 0.02 �0.5, n.s. 0.84 0.00 0.844. Consonance-driven orienting 0.09 �0.1, n.s. 0.97 0.01 0.965. Inhibition of return 0.08 �0.1, n.s. 0.78 0.01 0.776. Task switching 0.40 �0.001 0.90 0.16 0.747. Mental rotation 0.33 �0.002 0.95 0.11 0.848. Stroop task 0.20 �0.05 0.71 0.04 0.67
Note. For the primary paradigms, the correlations of all nine paradigms with the general attention factor were fairly high, ranging from 0.534 To 0.671(average of 0.591), thus suggesting that this attention factor accounts for a substantial portion of all of these paradigms. For the secondary paradigms, five(intelligence as measured by Raven’s test, mental rotation, visual marking, task switching, and Stroop task) correlated significantly with the attention factor,and so they also share the same general attention factor as the nine primary paradigms. More interesting, the three other paradigms (attentional capture,consonance-driven orienting, and inhibition of return) were found to be uncorrelated with the attention factor.
423MULTIPLE PARADIGMS OF VISUAL ATTENTION
average response time in the inconsistent trials was 106 mseclonger than that in the consistent trials (p � .001).
Factor Analysis Step I: A General Factor for the NinePrimary Paradigms
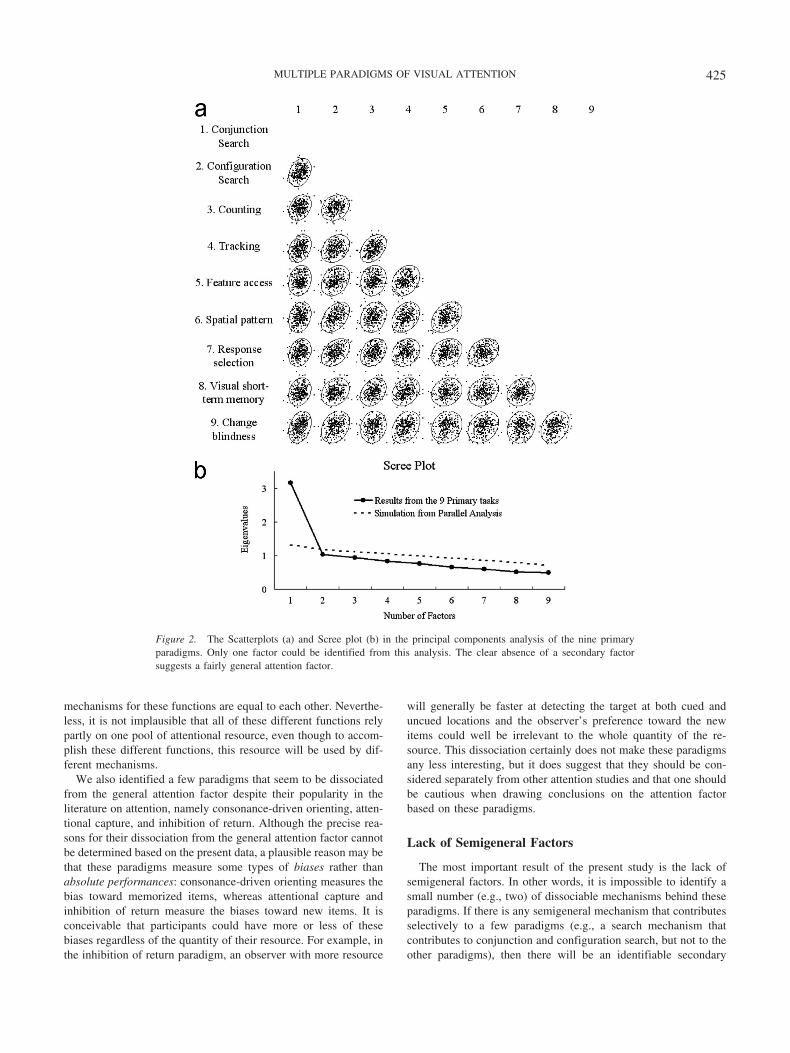
We ran PCA on the nine primary paradigms. The correlationmatrix is shown in Table 3, although only the nine primaryparadigms were included in this analysis. The scatterplot and theScree plot (along with the simulation from a parallel analysis) arerespectively shown in Figure 2a and b. Clearly, there is one, andonly one, factor (i.e., a general attention factor) behind these nineparadigms. This single factor explained 35% of the total variance,and there was a substantial drop between the first and secondfactor. The loadings (i.e., correlations) of all of the nine paradigmson this general attention factor and the p values are shown in Table2. The loadings were all fairly high, ranging from 0.53 to 0.67(average 0.59), thus suggesting that this general attention factoraccounts for a substantial portion of all of these paradigms.
Factor Analysis Step II: Correlations Between theAttention Factor and the Eight Secondary Paradigms
We calculated the correlations between the attention factor andthe eight secondary paradigms. The correlations and p values areshown in Table 2. It should be mentioned that the attention factorhere is defined in the same way as above (i.e., determined by thePCA of the nine primary paradigms), and is not extracted from anew PCA including both primary and secondary paradigms.
Out of the eight secondary paradigms, five (intelligence asmeasured by Raven’s test, mental rotation, visual marking, taskswitching, and Stroop task) correlated significantly with the gen-eral attention factor. Therefore, they also share the same generalattention factor as the nine primary paradigms.
More interestingly, the three other secondary paradigms (atten-tional capture, consonance-driven orienting, and inhibition of re-turn) were found to be uncorrelated with the attention factor. Thereliabilities of all of these three paradigms were fairly high (seeTable 2). Therefore, we can confidently say that the mechanismsunderlying attentional capture, consonance-driven orienting, andinhibition of return are dissociated from the general attentionfactor.
General Discussion
Below, we discuss the general message of the present study aswell as its implications for a few specific paradigms.
The Nature of the General Attention Factor
The PCA suggested that there is a general attention factor. Whatis the nature of this general attention factor? A precise answer tothis question cannot be given based on the present data. If we adoptthe conceptualization of attention most commonly used in previousstudies, then we could speculate that this attention factor is perhapssome kind of representational resource that can be flexibly used formany tasks: a greater quantity of (or a faster rate of using) thisrepresentational resource leads to superior performance in all ofthese paradigms. When performing a tracking task, for example,this resource is used to mark the tracked items, and a greateramount of this resource will lead to more markers. When perform-ing a conjunction search, this resource is used to make featurecomparisons, and a greater amount of this resource will lead tomore efficient feature-based selections. When performing a visualshort-term memory task, this resource is used to represent thememorized items, and a greater amount of this resource will leadto a greater memory capacity. Certainly, by suggesting a commonrepresentational resource, we are not implying that the underlying
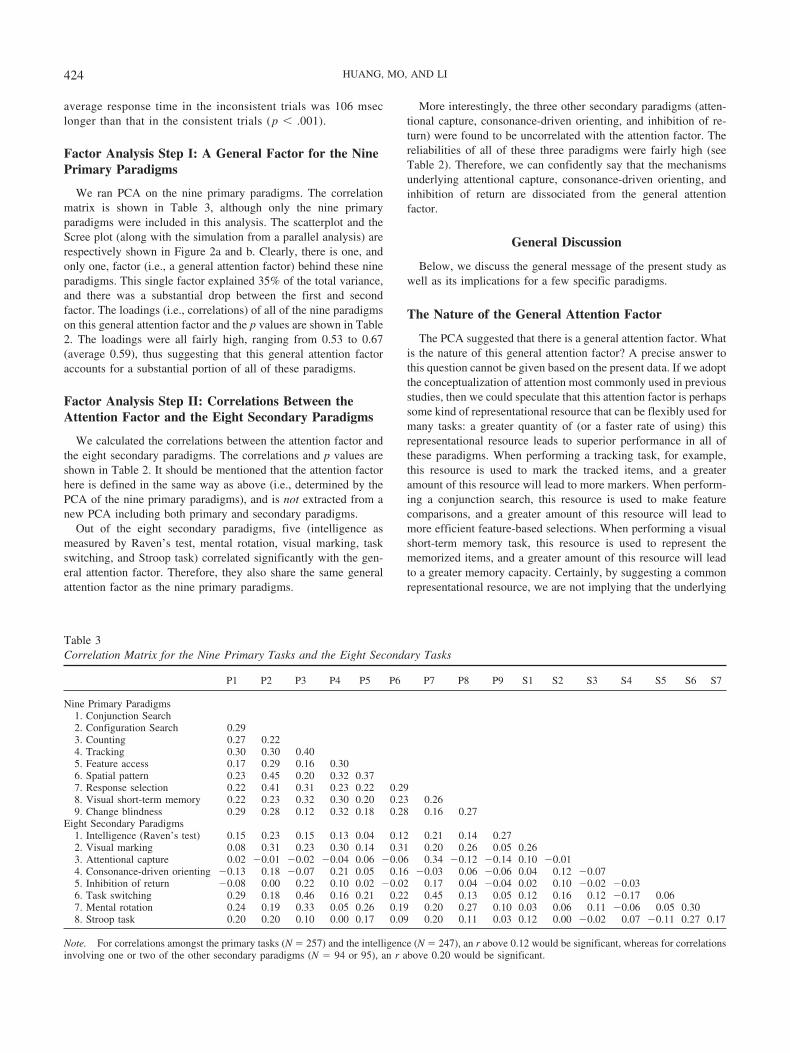
Table 3Correlation Matrix for the Nine Primary Tasks and the Eight Secondary Tasks
P1 P2 P3 P4 P5 P6 P7 P8 P9 S1 S2 S3 S4 S5 S6 S7
Nine Primary Paradigms1. Conjunction Search2. Configuration Search 0.293. Counting 0.27 0.224. Tracking 0.30 0.30 0.405. Feature access 0.17 0.29 0.16 0.306. Spatial pattern 0.23 0.45 0.20 0.32 0.377. Response selection 0.22 0.41 0.31 0.23 0.22 0.298. Visual short-term memory 0.22 0.23 0.32 0.30 0.20 0.23 0.269. Change blindness 0.29 0.28 0.12 0.32 0.18 0.28 0.16 0.27
Eight Secondary Paradigms1. Intelligence (Raven’s test) 0.15 0.23 0.15 0.13 0.04 0.12 0.21 0.14 0.272. Visual marking 0.08 0.31 0.23 0.30 0.14 0.31 0.20 0.26 0.05 0.263. Attentional capture 0.02 �0.01 �0.02 �0.04 0.06 �0.06 0.34 �0.12 �0.14 0.10 �0.014. Consonance-driven orienting �0.13 0.18 �0.07 0.21 0.05 0.16 �0.03 0.06 �0.06 0.04 0.12 �0.075. Inhibition of return �0.08 0.00 0.22 0.10 0.02 �0.02 0.17 0.04 �0.04 0.02 0.10 �0.02 �0.036. Task switching 0.29 0.18 0.46 0.16 0.21 0.22 0.45 0.13 0.05 0.12 0.16 0.12 �0.17 0.067. Mental rotation 0.24 0.19 0.33 0.05 0.26 0.19 0.20 0.27 0.10 0.03 0.06 0.11 �0.06 0.05 0.308. Stroop task 0.20 0.20 0.10 0.00 0.17 0.09 0.20 0.11 0.03 0.12 0.00 �0.02 0.07 �0.11 0.27 0.17
Note. For correlations amongst the primary tasks (N � 257) and the intelligence (N � 247), an r above 0.12 would be significant, whereas for correlationsinvolving one or two of the other secondary paradigms (N � 94 or 95), an r above 0.20 would be significant.
424 HUANG, MO, AND LI
mechanisms for these functions are equal to each other. Neverthe-less, it is not implausible that all of these different functions relypartly on one pool of attentional resource, even though to accom-plish these different functions, this resource will be used by dif-ferent mechanisms.
We also identified a few paradigms that seem to be dissociatedfrom the general attention factor despite their popularity in theliterature on attention, namely consonance-driven orienting, atten-tional capture, and inhibition of return. Although the precise rea-sons for their dissociation from the general attention factor cannotbe determined based on the present data, a plausible reason may bethat these paradigms measure some types of biases rather thanabsolute performances: consonance-driven orienting measures thebias toward memorized items, whereas attentional capture andinhibition of return measure the biases toward new items. It isconceivable that participants could have more or less of thesebiases regardless of the quantity of their resource. For example, inthe inhibition of return paradigm, an observer with more resource
will generally be faster at detecting the target at both cued anduncued locations and the observer’s preference toward the newitems could well be irrelevant to the whole quantity of the re-source. This dissociation certainly does not make these paradigmsany less interesting, but it does suggest that they should be con-sidered separately from other attention studies and that one shouldbe cautious when drawing conclusions on the attention factorbased on these paradigms.
Lack of Semigeneral Factors
The most important result of the present study is the lack ofsemigeneral factors. In other words, it is impossible to identify asmall number (e.g., two) of dissociable mechanisms behind theseparadigms. If there is any semigeneral mechanism that contributesselectively to a few paradigms (e.g., a search mechanism thatcontributes to conjunction and configuration search, but not to theother paradigms), then there will be an identifiable secondary
Figure 2. The Scatterplots (a) and Scree plot (b) in the principal components analysis of the nine primaryparadigms. Only one factor could be identified from this analysis. The clear absence of a secondary factorsuggests a fairly general attention factor.
425MULTIPLE PARADIGMS OF VISUAL ATTENTION
factor. In other words, the present study not only shows thatdisparate paradigms are related to one general attention factor, butalso that this general attention factor is the only shared mechanismin these paradigms.
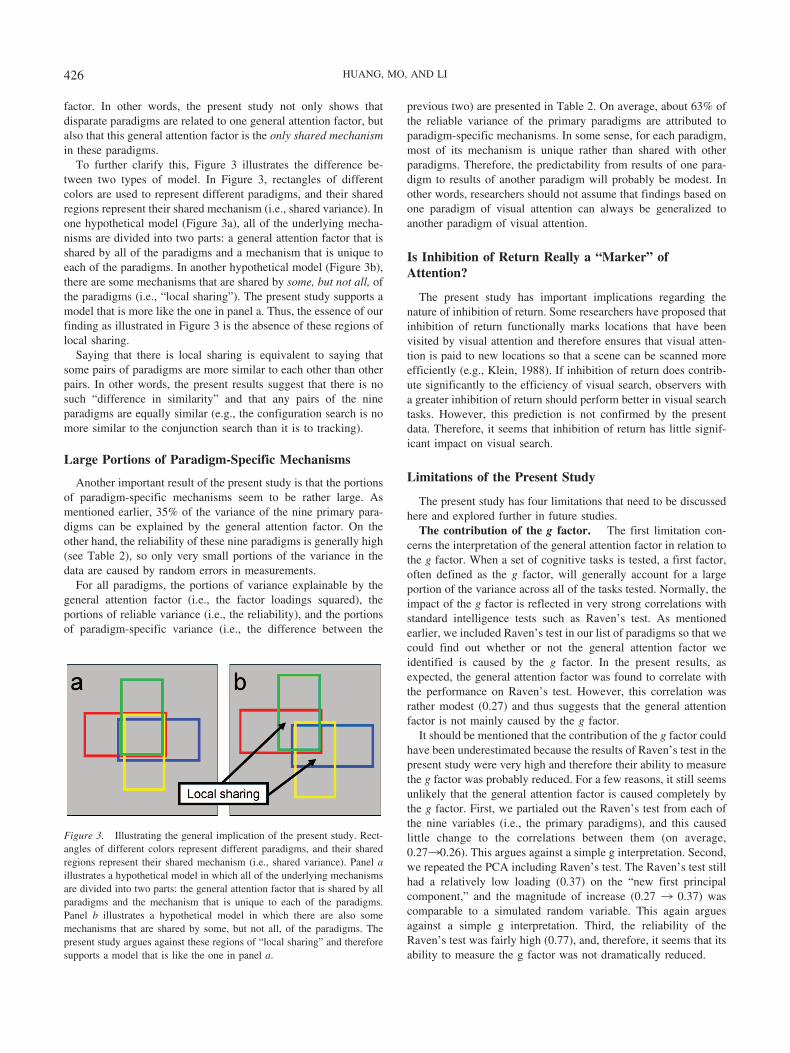
To further clarify this, Figure 3 illustrates the difference be-tween two types of model. In Figure 3, rectangles of differentcolors are used to represent different paradigms, and their sharedregions represent their shared mechanism (i.e., shared variance). Inone hypothetical model (Figure 3a), all of the underlying mecha-nisms are divided into two parts: a general attention factor that isshared by all of the paradigms and a mechanism that is unique toeach of the paradigms. In another hypothetical model (Figure 3b),there are some mechanisms that are shared by some, but not all, ofthe paradigms (i.e., “local sharing”). The present study supports amodel that is more like the one in panel a. Thus, the essence of ourfinding as illustrated in Figure 3 is the absence of these regions oflocal sharing.
Saying that there is local sharing is equivalent to saying thatsome pairs of paradigms are more similar to each other than otherpairs. In other words, the present results suggest that there is nosuch “difference in similarity” and that any pairs of the nineparadigms are equally similar (e.g., the configuration search is nomore similar to the conjunction search than it is to tracking).
Large Portions of Paradigm-Specific Mechanisms
Another important result of the present study is that the portionsof paradigm-specific mechanisms seem to be rather large. Asmentioned earlier, 35% of the variance of the nine primary para-digms can be explained by the general attention factor. On theother hand, the reliability of these nine paradigms is generally high(see Table 2), so only very small portions of the variance in thedata are caused by random errors in measurements.
For all paradigms, the portions of variance explainable by thegeneral attention factor (i.e., the factor loadings squared), theportions of reliable variance (i.e., the reliability), and the portionsof paradigm-specific variance (i.e., the difference between the
previous two) are presented in Table 2. On average, about 63% ofthe reliable variance of the primary paradigms are attributed toparadigm-specific mechanisms. In some sense, for each paradigm,most of its mechanism is unique rather than shared with otherparadigms. Therefore, the predictability from results of one para-digm to results of another paradigm will probably be modest. Inother words, researchers should not assume that findings based onone paradigm of visual attention can always be generalized toanother paradigm of visual attention.
Is Inhibition of Return Really a “Marker” ofAttention?
The present study has important implications regarding thenature of inhibition of return. Some researchers have proposed thatinhibition of return functionally marks locations that have beenvisited by visual attention and therefore ensures that visual atten-tion is paid to new locations so that a scene can be scanned moreefficiently (e.g., Klein, 1988). If inhibition of return does contrib-ute significantly to the efficiency of visual search, observers witha greater inhibition of return should perform better in visual searchtasks. However, this prediction is not confirmed by the presentdata. Therefore, it seems that inhibition of return has little signif-icant impact on visual search.
Limitations of the Present Study
The present study has four limitations that need to be discussedhere and explored further in future studies.
The contribution of the g factor. The first limitation con-cerns the interpretation of the general attention factor in relation tothe g factor. When a set of cognitive tasks is tested, a first factor,often defined as the g factor, will generally account for a largeportion of the variance across all of the tasks tested. Normally, theimpact of the g factor is reflected in very strong correlations withstandard intelligence tests such as Raven’s test. As mentionedearlier, we included Raven’s test in our list of paradigms so that wecould find out whether or not the general attention factor weidentified is caused by the g factor. In the present results, asexpected, the general attention factor was found to correlate withthe performance on Raven’s test. However, this correlation wasrather modest (0.27) and thus suggests that the general attentionfactor is not mainly caused by the g factor.
It should be mentioned that the contribution of the g factor couldhave been underestimated because the results of Raven’s test in thepresent study were very high and therefore their ability to measurethe g factor was probably reduced. For a few reasons, it still seemsunlikely that the general attention factor is caused completely bythe g factor. First, we partialed out the Raven’s test from each ofthe nine variables (i.e., the primary paradigms), and this causedlittle change to the correlations between them (on average,0.2730.26). This argues against a simple g interpretation. Second,we repeated the PCA including Raven’s test. The Raven’s test stillhad a relatively low loading (0.37) on the “new first principalcomponent,” and the magnitude of increase (0.27 3 0.37) wascomparable to a simulated random variable. This again arguesagainst a simple g interpretation. Third, the reliability of theRaven’s test was fairly high (0.77), and, therefore, it seems that itsability to measure the g factor was not dramatically reduced.
Figure 3. Illustrating the general implication of the present study. Rect-angles of different colors represent different paradigms, and their sharedregions represent their shared mechanism (i.e., shared variance). Panel aillustrates a hypothetical model in which all of the underlying mechanismsare divided into two parts: the general attention factor that is shared by allparadigms and the mechanism that is unique to each of the paradigms.Panel b illustrates a hypothetical model in which there are also somemechanisms that are shared by some, but not all, of the paradigms. Thepresent study argues against these regions of “local sharing” and thereforesupports a model that is like the one in panel a.
426 HUANG, MO, AND LI
Admittedly, we still cannot completely rule out the possibilitythat the general attention factor here can be completely attributedto the g factor. If future studies indeed confirm this possibility,how would that affect the implications of the present study? Insuch a case, there would be no general attention factor, and so ourinterpretation on the “general resource” would have to be revised.However, the two other important conclusions of this study,namely the absence of semigeneral factors and the large portionsof paradigm-specific mechanisms, would still be correct.
Local fragmentations. The second limitation concerns pos-sible local fragmentations. Although we argue that there is onlyone general “attention” factor behind the tested paradigms, therewill inevitably be local fragmentations. One can certainly imagineusing several different searches or tracking tasks that are verysimilar to each other in terms of stimuli and procedure; in suchcases, eventually and inevitably, these tasks will share more mech-anisms with each other than just the general attention factor.Although, by using such an approach, one can characterize somelocal fragmentations very precisely, it is impossible to enjoy thisprecision and keep breadth at the same time because there wouldsimply be too many paradigms. The present study intended todepict the overall picture; therefore, we allocated our testing todisparate paradigms. In other words, although we do not deny thepossibility of local fragmentations, which should definitely beexplored in the future, we do suggest that, globally, the attentionfactor is very general and cannot be divided into a couple of largesubmechanisms.
Possible global fragmentations. The third issue is that therecould well be some important global fragmentations (i.e., semi-general factors) that were not revealed in the present paradigms wehave tested. There are important conceptual distinctions (or dichot-omies) that have been made in the literature based on behavior orneuroimaging data (e.g., stimulus driven vs. goal driven attention:Corbetta & Shulman, 2002; temporal vs. spatial attention; selec-tion vs. access: Duncan, 1980). Therefore, it is certainly likely thatat least some of these conceptual distinctions will have corre-sponding semigeneral factors in individual differences of some setof paradigms, and future studies with paradigms specifically de-signed to explore these distinctions are required to address theseissues.
Highly correlated factors. The fourth limitation is that thepresent study is, in some sense, a null finding. Although we havefound the absence of a secondary factor, the possibility still re-mains that there are actually two separate attention mechanisms,but that these two mechanisms correlate so highly with each otherthat they become statistically undistinguishable. Although we can-not rule out this possibility, the present study used a fairly largesample and testing sessions of decent lengths, so it seems reason-able to say that, for the purpose of characterizing visual attentionfrom the data, no noticeable division could be found. Futurestudies should further explore this issue by using an even largersample and/or limiting the scope of research to a subset.
General Implications
Taken together, the present studies indicate that (1) there is onegeneral attention factor behind the various paradigms; (2) there areno semigeneral mechanisms that contribute to some of the para-
digms, but not the others; and (3) there is a substantial portion ofa paradigm-specific mechanism in each paradigm.
How will these conclusions affect our understanding of visualattention? We believe that the answer to this question dependsheavily on the (often implicit) prior assumptions made by partic-ular researchers. Perhaps those who have assumed that visualattention is mostly a general mechanism will be surprised to learnhow large the portion of a paradigm-specific mechanism is,whereas those who have assumed that visual attention is merely alabel for various arbitrary tasks will be surprised to learn that ageneral attention factor exists. In general, the absence of semigen-eral mechanisms seems to be the most informative finding becausethere are strong reasons from previous studies to believe that theyexist and, to the best of our knowledge, no previous theory orfinding entails the lack of such mechanisms. Overall, the presentresults provide us with useful constraints and guides on how weshould conceptualize a theory of attention.
References
Alvarez, G. A., Horowitz, T. S., Arsenio, H. C., DiMase, J. S., & Wolfe,J. M. (2005). Do multielement visual tracking and visual search drawcontinuously on the same visual attention resources? Journal of Exper-imental Psychology-Human Perception and Performance, 31, 643–667.
Arnell, K. M., Howe, A. E., Joanisse, M. F., & Klein, R. M. (2006).Relationships between attentional blink magnitude, RSVP target accu-racy, and performance on other cognitive tasks. Memory & Cognition,34, 1472–1483. doi:10.3758/BF03195912
Arnell, K. M., Stokes, K. A., MacLean, M. H., & Gicante, C. (2010).Executive control processes of working memory predict attentional blinkmagnitude over and above storage capacity. Psychological Research-Psychologische Forschung, 74, 1–11. doi:10.1007/s00426-008-0200-4
Baddeley, A. D. (1986). Working memory. Oxford: Clarendon Press.Barlow, H. B., & Reeves, B. C. (1979). Versatility and absolute efficiency
of detecting mirror symmetry in random dot displays. Vision Research,19, 783–793. doi:10.1016/0042-6989(79)90154-8
Broadbent, D. E. (1958). Perception and communication. New York:Oxford University Press. doi:10.1037/10037-000
Bundesen, C. (1990). A theory of visual-attention. Psychological Review,97, 523–547. doi:10.1037/0033-295X.97.4.523
Chun, M. M., & Jiang, Y. H. (1998). Contextual cueing: Implicit learningand memory of visual context guides spatial attention. Cognitive Psy-chology, 36, 28–71. doi:10.1006/cogp.1998.0681
Colzato, L. S., Spape, M. M. A., Pannebakker, M. M., & Hommel, B.(2007). Working memory and the attentional blink: Blink size is pre-dicted by individual differences in operation span. Psychonomic Bulletin& Review, 14, 1051–1057. doi:10.3758/BF03193090
Corbetta, M., & Shulman, G. L. (2002). Control of goal-directed andstimulus-driven attention in the brain. Nature Reviews Neuroscience, 3,201–215. doi:10.1038/nrn755
Desimone, R., & Duncan, J. (1995). Neural mechanisms of selectivevisual-attention. Annual Review of Neuroscience, 18, 193–222. doi:10.1146/annurev.ne.18.030195.001205
Duncan, J. (1980). The locus of interference in the perception of simulta-neous stimuli. Psychological Review, 87, 272–300. doi:10.1037/0033-295X.87.3.272
Engle, R. W. (2002). Working memory capacity as executive attention.Current Directions in Psychological Science, 11, 19–23. doi:10.1111/1467-8721.00160
Engle, R. W., & Kane, M. J. (2004). Executive attention, working memorycapacity, and a two-factor theory of cognitive control. In B. H. Ross(Ed.), Psychology of learning and motivation: Advances in research andtheory, Vol. 44 (pp. 145–199). San Diego: Academic Press Inc.
427MULTIPLE PARADIGMS OF VISUAL ATTENTION
Engle, R. W., Tuholski, S. W., Laughlin, J. E., & Conway, A. R. A. (1999).Working memory, short-term memory, and general fluid intelligence: Alatent-variable approach. Journal of Experimental Psychology-General,128, 309–331. doi:10.1037/0096-3445.128.3.309
Gelman, R., & Gallistel, C. R. (1978). The child’s understanding ofnumber. Cambridge, MA: Harvard University Press.
Green, C. S., & Bavelier, D. (2003). Action video game modifies visualselective attention. Nature, 423, 534–537. doi:10.1038/nature01647
Green, C. S., & Bavelier, D. (2006). Effect of action video games on thespatial distribution of visuospatial attention. Journal of ExperimentalPsychology-Human Perception and Performance, 32, 1465–1478. doi:10.1037/0096-1523.32.6.1465
Green, C. S., & Bavelier, D. (2007). Action-video-game experience altersthe spatial resolution of vision. Psychological Science, 18, 88–94. doi:10.1111/j.1467-9280.2007.01853.x
Huang, L. (2010). What is the unit of visual attention? Object for selection,but Boolean map for access. Journal of Experimental Psychology-General, 139, 162–179. doi:10.1037/a0018034
Huang, L., & Pashler, H. (2007). A Boolean map theory of visual attention.Psychological Review, 114, 599 – 631. doi:10.1037/0033-295X.114.3.599
Huang, L., Treisman, A., & Pashler, H. (2007). Characterizing the limits ofhuman visual awareness. Science, 317, 823– 825. doi:10.1126/science.1143515
Kane, M. J., Bleckley, M. K., Conway, A. R. A., & Engle, R. W. (2001).A controlled-attention view of working-memory capacity. Journal ofExperimental Psychology-General, 130, 169–183. doi:10.1037/0096-3445.130.2.169
Kane, M. J., & Engle, R. W. (2000). Working-memory capacity, proactiveinterference, and divided attention: Limits on long-term memory re-trieval. Journal of Experimental Psychology-Learning Memory & Cog-nition, 26, 336–358. doi:10.1037/0278-7393.26.2.336
Kane, M. J., & Engle, R. W. (2002). The role of prefrontal cortex inworking-memory capacity, executive attention, and general fluid intel-ligence: An individual-differences perspective. Psychonomic Bulletin &Review, 9, 637–671. doi:10.3758/BF03196323
Kane, M. J., & Engle, R. W. (2003). Working-memory capacity and thecontrol of attention: The contributions of goal neglect, response com-petition, and task set to Stroop interference. Journal of ExperimentalPsychology-General, 132, 47–70. doi:10.1037/0096-3445.132.1.47
Kane, M. J., Poole, B. J., Tuholski, S. W., & Engle, R. W. (2006). Workingmemory capacity and the top-down control of visual search: Exploringthe boundaries of “executive attention”. Journal of ExperimentalPsychology-Learning Memory & Cognition, 32, 749–777. doi:10.1037/0278-7393.32.4.749
Klein, R. (1988). Inhibitory tagging system facilitates visual-search. Na-ture, 334, 430–431. doi:10.1038/334430a0
Mackworth, J. F. (1969). Vigilance and habituation. Baltimore, MD:Penguin.
Macleod, C. M. (1991). Half a century of research on the Stroop effect: Anintegrative review. Psychological Bulletin, 109, 163–203. doi:10.1037/0033-2909.109.2.163
Maljkovic, V., & Nakayama, K. (1994). Priming of pop-out. 1. Role offeatures. Memory & Cognition, 22, 657–672. doi:10.3758/BF03209251
Miyake, A., Friedman, N. P., Emerson, M. J., Witzki, A. H., Howerter, A.,& Wager, T. D. (2000). The unity and diversity of executive functions
and their contributions to complex “frontal lobe” tasks: A latent variableanalysis. Cognitive Psychology, 49–100. doi:10.1006/cogp.1999.0734
Monsell, S. (2003). Task switching. Trends in Cognitive Sciences, 7,134–140. doi:10.1016/S1364-6613(03)00028-7
Moosbrugger, H., Goldhammer, F., & Schweizer, K. (2006). Latent factorsunderlying individual differences in attention measures: Perceptual andexecutive attention. European Journal of Psychological Assessment, 22,177–188. doi:10.1027/1015-5759.22.3.177
Pashler, H. (1988). Familiarity and visual change detection. Perception &Psychophysics, 44, 369–378. doi:10.3758/BF03210419
Passingham, R. E. (1993). The frontal lobes and voluntary action. Oxford:Oxford University Press.
Posner, M. I., & Cohen, Y. (1984). Components of visual orienting.Attention and Performance, 32, 531–556.
Posner, M. I., & Petersen, S. E. (1990). The attention system of the humanbrain. Annual Review of Neuroscience, 13, 25– 42. doi:10.1146/annurev.ne.13.030190.000325
Pylyshyn, Z. W., & Storm, R. W. (1988). Tracking multiple independenttargets: Evidence for a parallel tracking mechanism. Spatial Vision, 3,179–197. doi:10.1163/156856888X00122
Raven, J. C. (1962). Advanced progressive matrices, set ii. London, Eng-land: H. K. Lewis.
Raymond, J. E., Shapiro, K. L., & Arnell, K. M. (1992). Temporarysuppression of visual processing in an RSVP task: An attentional blink.Journal of Experimental Psychology-Human Perception and Perfor-mance, 18, 849–860. doi:10.1037/0096-1523.18.3.849
Rensink, R. A., Oregan, J. K., & Clark, J. J. (1997). To see or not to see:The need for attention to perceive changes in scenes. PsychologicalScience, 8, 368–373. doi:10.1111/j.1467-9280.1997.tb00427.x
Shepard, R. N., & Metzler, J. (1971). Mental rotation of 3-dimensionalobjects. Science, 171, 701–703. doi:10.1126/science.171.3972.701
Soto, D., Hodsoll, J., Rotshtein, P., & Humphreys, G. W. (2008). Auto-matic guidance of attention from working memory. Trends in CognitiveSciences, 12, 342–348. doi:10.1016/j.tics.2008.05.007
Spearman, C. (1927). The Abilities of Man: Their Nature and Measure-ment. New York, NY: Macmillan.
Tipper, S. P., & Driver, J. (1988). Negative priming between pictures andwords in a selective attention task: Evidence for semantic processing ofignored stimuli. Memory & Cognition, 16, 64 –70. doi:10.3758/BF03197746
Treisman, A. M., & Gelade, G. (1980). A feature-integration theory ofattention. Cognitive Psychology, 12, 97–136. doi:10.1016/0010-0285(80)90005-5
Watson, D. G., & Humphreys, G. W. (1997). Visual marking: Prioritizingselection for new objects by top-down attentional inhibition of oldobjects. Psychological Review, 104, 90 –122. doi:10.1037/0033-295X.104.1.90
Wolfe, J. M. (1994). Guided search 2.0 - a revised model of visual-search.Psychonomic Bulletin & Review, 1, 202–238.
Yantis, S., & Jonides, J. (1984). Abrupt visual onsets and selective atten-tion: Evidence from visual-search. Journal of Experimental Psychology-Human Perception and Performance, 10, 601–621. doi:10.1037/0096-1523.10.5.601
Received February 3, 2011Revision received September 28, 2011
Accepted October 3, 2011 �
428 HUANG, MO, AND LI