Embed Size (px)
Citation preview
Measuring the Learning:Assessment of General Education and Program Learning Outcomes at the University of Wisconsin-Stevens Point
Measuring the Learning:Assessment of General Education and Program
Learning Outcomes at the University of Wisconsin-Stevens Point
A Progress ReportWritten at the request of the Higher Learning Commission
January 15, 2015
The University of Wisconsin-Stevens Point is an Equal Opportunity/Affirmative Action Institution.The University of Wisconsin-Stevens Point is a tobacco-free campus.
Page 1
University of Wisconsin-Stevens Point Progress Report
Table of ContentsI. Introduction .................................................................................................................................... 2 Background ................................................................................................................................... 2
II. General Education Program Assessment Report ...................................................................... 3A. Introduction to assessment of the General Education Program ........................................ 3B. Overview of ongoing General Education Program assessment efforts ............................. 4C. Results of General Education Program course portfolio reviews ....................................... 5
Written Communication .................................................................................................... 5Oral Communication ......................................................................................................... 5First-Year Seminar ................................................................................................................ 8Quantitative Literacy ....................................................................................................... 10Wellness .............................................................................................................................. 13
D. Executive summary and recommendations ...................................................................... 15Changes to General Education Program assessment procedures and policies...... 16Recommendations for General Education Program/Committee Procedures ......... 16Recommendations for General Education Program/Committee Policies ................ 17Recommendations for General Education Program Professional Development..... 18
E. Concluding remarks .............................................................................................................. 18
III. Program Assessment Report ..................................................................................................... 19A. Introduction to assessment of program learning outcomes ............................................. 19B. Overview of ongoing program assessment efforts ............................................................. 19C. Results of program assessment............................................................................................. 20
Assessment results for HLC Interim Report 2013-2014 .................................................... 20Aggregated program-level assessment results 2013-2014 .......................................... 21
D. Data-driven initiatives for future actions ............................................................................. 24E. Concluding remarks .............................................................................................................. 25
IV. Conclusion and Looking Ahead ............................................................................................. 25
Because of the nature of our faculty governance units and the purviews of our committees, the assessment reports that follow here have each been crafted and vetted by governance committees and then were approved by our Faculty Senate. Our General Education Committee (GEC) has purview over the General Education Program (GEP) learning outcomes, curriculum, and assessment. Concomitantly, our Assessment Subcommittee (AS) of the Academic Affairs Committee has purview over assessment activities and efforts as they relate to program-specific learning outcomes. Hence, for the purpose of our governance processes, the assessment activities and our reports were specifically crafted as separate documents for consideration and evaluation by the appropriate governance committees. They have been knitted together in this single Progress Report document for your consideration.To assist the reader, a virtual “resource room” has been established at:
www.uwsp.edu/acadaff/Pages/HLC-2015-Progress-Report-Resource-Room.aspx
This resource room includes the various appendices referred to, and linked, in the text below.
Structure of this Progress Report
Page 2
I. Introduction
UW-Stevens Point experienced its last comprehensive accreditation visit by the Higher Learning Commission (HLC) in 2008. The evaluation was successful, and the university was deemed to be fulfilling its mission and in strong condition. Despite this generally positive review, however, the HLC’s site visit team identified several concerns related to our ability to provide evidence of student learning and teaching effectiveness in a way that demonstrates we are fulfilling our educational mission. In particular, the university’s assessment of student learning in its General Education program—then known locally as the General Degree Requirements (GDRs)—was deemed to be problematic enough to necessitate additional commission follow-up. The site visit team recommended a “focused visit on assessment with a particular emphasis on the assessment and subsequent revision of the General Education program and General Degree Requirements.”
In preparation for this mandated focused visit, we prepared an abbreviated self-study document to provide information to the HLC focused visit team, and this self-study is provided in our electronic Resource Room as Appendix A1: Abbreviated Self-Study 2012. The focused visit occurred in February of 2012 and later in April the evaluation team communicated its observations to HLC and our campus (see Appendix A2: Focused Visit Report 2012). Here again, this team noted several positive developments and particularly highlighted that our campus had thoughtfully implemented a new General Education Program that our faculty both developed and broadly supported. However, the team also expressed concern about the assessment of our new General Education Program. Specifically, the team noted: “While there is a plan for assessing the new General Education Program, it is yet to be implemented” (Appendix A2: Focused Visit Report 2012, pp. 12-13). Similarly, with respect to program-specific learning outcomes, the team observed: “There continues to be unevenness in where departments are in terms of assessment for improving student learning as reported from departmental representatives.”
The focused visit team recommended that a Progress Report be submitted that “… provides evidence that the assessment has not only been planned, but has been implemented and is being used to enhance student learning.” The team also averred that “Given the rapid progress that UWSP has demonstrated in its ability to respond appropriately to Commission mandates the team believes that it will be a relatively easy task for the university to document its sustained progress, which will meet the expectations of the Progress Report outlined below.”
In the report that follows, we directly address the concerns expressed by the focused visit team. In the first section of the report, we communicate our activities on the collection and analysisof direct evidence of student learning within our General Education Program offerings. In the second section of the report, we delineate our efforts and resulting evidence related to assessing program-specific learning outcomes. Also included in this report, based on our assessment results, we detail our observations, reflections, and the changes our faculty have recommended and havemade to close the loop and improve student learning.
One aspect of the required General Education Program assessment process that could not be addressed in this report is the inclusion of standardized testing data from our Institutional Research and Effectiveness Office. Our campus is a participant in the Voluntary System of Accountability and our Institutional Research and Effectiveness Office has utilized the ETS Proficiency Profile exam to assess learning outcomes. This exam has been administered to our first-year and fourth-year students. Unfortunately, the scores are not available because the person responsible for administering and compiling the standardized test data resigned from the position in January of 2014 and the position was not filled again until fall of 2014. Because the tests were administered again to first-year students this fall (2014) and are scheduled to be taken by graduating seniors in spring of 2015, we anticipate being able to analyze this testing data and compare the results with the General Education Program assessment results reported here. A summary of these comparisons and findings can be made available to the HLC by the end of the summer of 2015.
Background
Page 3
University of Wisconsin-Stevens Point Progress Report
II. General Education ProgramAssessment Report
The assessment of the General Education Program (GEP) is described in Step 6 of the University Handbook (Chapter 7, Section 2) in the following way:
Assessment within the General Education Program is intended to be a formal process of inquiry into student learning. More than simply an exercise in documenting the level of student achievement within the program, assessment is an exploration of how and why students learn, or fail to learn, within a particular curricular and pedagogical context. It explores both the outcomes that students achieve as well as the processes through which they learn. In this way, assessment should be viewed as an open ended scholarly activity, a collaborative action research project aimed at the improvement of teaching and learning.
The General Education Program Assessment process for Year 1 was structured to honor this reflective and collaborative approach to assessment by asking all Foundation Level instructors teaching First-Year Seminar, Written and Oral Communication, Quantitative Literacy, and Wellness to submit course portfolios explaining the alignment of their courses to their General Education category learning outcomes, providing assessment results of student learning related to at least one of these learning outcomes, reflecting on the results, and describing a plan for addressing the results to impact and improve student learning. In addition, four Faculty Learning Communities were formed, comprised of 4-6 members, for each Foundation Level category, to review all of the course portfolios in their category, furnish rubric feedback to each instructor, and provide summary comments and recommendations to be used by the Assessment Coordinator for the Year One Assessment Report for the General Education Committee.
To prepare Foundation Level instructors to successfully submit course portfolios and to prepare the four Foundation Level Faculty Learning Communities members to fulfill their responsibilities, the Associate Vice Chancellor for Teaching, Learning and Academic Programs, the Director of General Education, the Assessment Coordinator, the Chair of the General Education Committee (GEC) and other members of the GEC conducted a series of informational meetings and professional development workshops. The workshops provided Foundation Level instructors with descriptions of the required course portfolio components, examples of course portfolios, and training in the use of ePortfolio, an electronic portfolio submission feature within Desire2Learn (D2L). The sessions specifically for Faculty Learning Community members also provided essential information on the required portfolio components and gave them practice in applying the Course Portfolio Rubric to sample course portfolios. All materials and PowerPoint slides shared at the informational meetings and workshops were made available on a campus GEP Assessment Web page to ensure easy access and opportunity for feedback by all parties.
The report that follows details the assessment process that was implemented as well as a discussion of the results.
A. Introduction to assessment of the General Education Program
(Submitted to the General Education Committee and approved by Faculty Senate, Fall 2014)
Page 4
Effectively implementing all components and phases of the General Education Program assessment process required a multi-faceted approach with a primary emphasis on professional development. Not only did instructors need to understand the essential components of the course portfolio, but because the decision was made to have all portfolios submitted electronically, the majority of Foundation Level instructors also had to learn how to submit an ePortfolio in the Desire2Learn platform. Efforts to prepare all participants to successfully complete the General Education Program assessment process included the following:
• Holding informational sessions for the entire campus community explaining the GEP Assessmentprocess, including the required components of the course portfolio and the purpose andresponsibilities of the Faculty Learning Communities
• Developing an electronic course portfolio template for use in Desire2Learn (see GEP Assessmentwebsite for course portfolio example)
• Holding a series of summer workshops on course redesign, aligning course learning outcomes toGEP Learning Outcomes, developing and applying assessment rubrics, and reporting assessmentdata
• Holding a series of summer and fall workshops to train Foundation Level instructors on how to use the ePortfolio function in Desire2Learn
• Developing a Course Portfolio Rubric for use by the Faculty Learning Communities to provideindividual feedback to instructors (see GEP Assessment website for the Course Portfolio Rubric)
• Monitoring the submission process to make sure course portfolios were submitted by all FoundationLevel instructors, responding to questions when instructors experienced difficulties, and followingup when course portfolios were not submitted by the February 1 deadline
• Developing a “Faculty Learning Community Summary Report Template” for capturing feedbackfrom the four Faculty Learning Communities on the strengths, challenges and suggestions forimprovement to the GEP assessment process (see Appendix A3: Faculty Learning CommunitySummary Report Template)
• Holding four professional development workshops/meetings for Faculty Learning Communitymembers to explain their responsibilities, provide them with practice in applying the CoursePortfolio Assessment Rubric, invite their input for revising the rubric, support them through theprocess of reviewing and assessing the course portfolios, and finally, to solicit feedback on the entireassessment process
• Creating procedures for delinquent course portfolios that included notifications of DepartmentChairs, Deans, and the Provost (see Appendix A4: Procedures for Delinquent Course Portfolios)
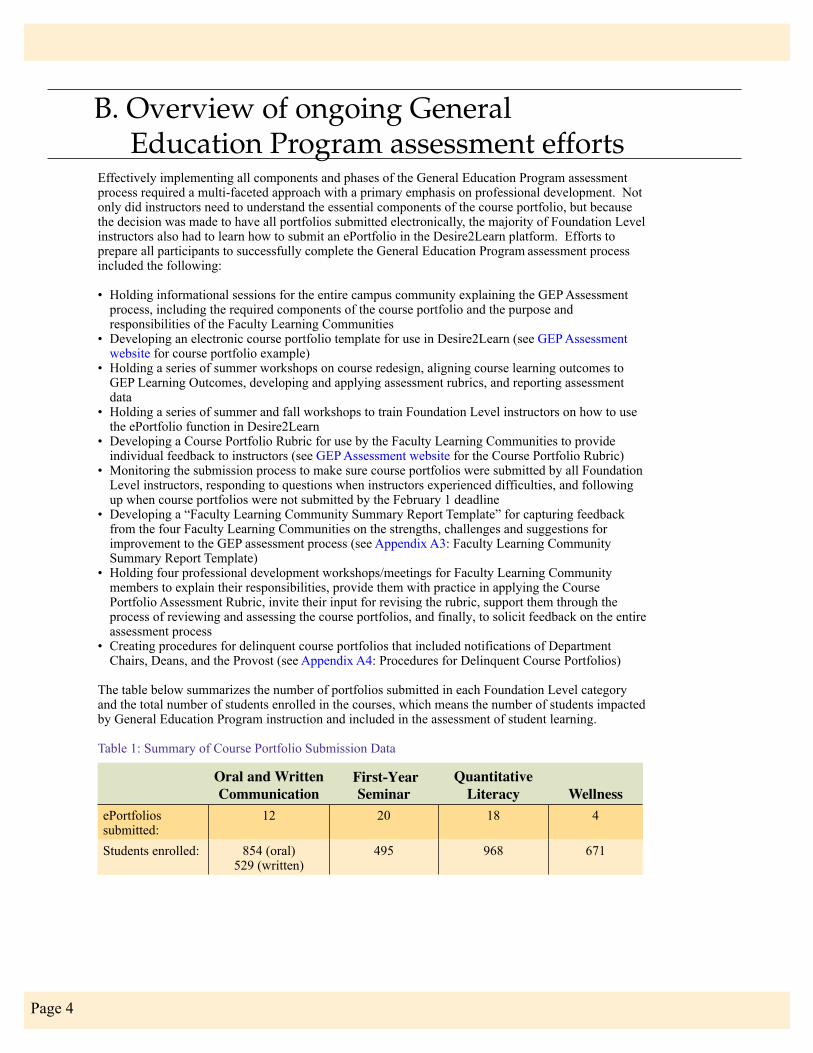
The table below summarizes the number of portfolios submitted in each Foundation Level category and the total number of students enrolled in the courses, which means the number of students impacted by General Education Program instruction and included in the assessment of student learning.
Table 1: Summary of Course Portfolio Submission Data
B. Overview of ongoing General Education Program assessment efforts
Oral and Written Communication
First-Year Seminar
Quantitative Literacy Wellness
ePortfoliossubmitted:
12 20 18 4
Students enrolled: 854 (oral)529 (written)
495 968 671
Page 5
University of Wisconsin-Stevens Point Progress Report
The section that follows will summarize the findings for each General Education Foundation Level Category (Written and Oral Communication, First-Year Seminar, Quantitative Literacy, and Wellness) including analysis of the actual course portfolios and assessment findings of the instructors, survey data from both course instructors and Faculty Learning Community members, rubric data from the Faculty Learning Communities, individual feedback from the Faculty Learning Community to each instructor, and summary findings and recommendations from each of the four Faculty Learning Communities.
Written CommunicationEleven course portfolios were submitted for Written Communication including the assessment of student work from English 101, English 150, and English 202, all Foundation Level writing courses that are taken by first and second-year students. While a common rubric was not used across all of the courses, all but two of the course portfolios included clearly delineated assessment criteria with common elements like a clear and well-supported thesis, effective use of evidence from textual material, smooth transitions, logical and organized presentation of ideas, and writing free from grammatical and mechanical errors (see Appendix A5: Sample Written Communication Rubric).
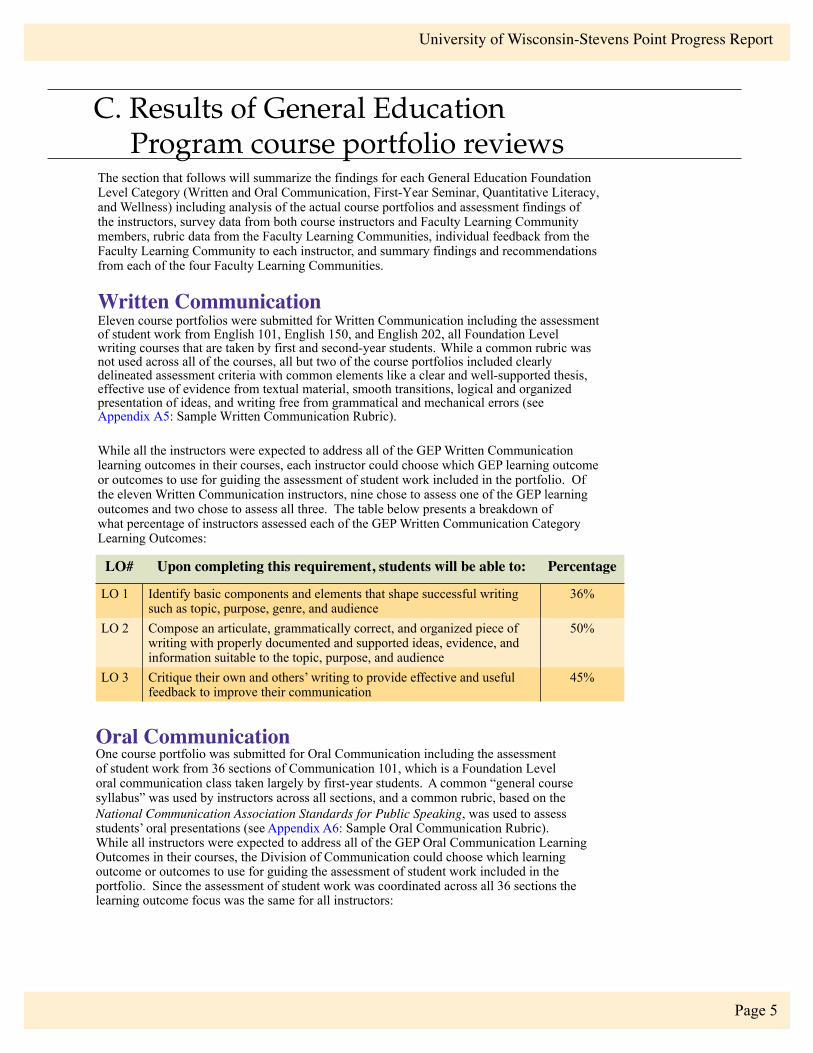
While all the instructors were expected to address all of the GEP Written Communication learning outcomes in their courses, each instructor could choose which GEP learning outcome or outcomes to use for guiding the assessment of student work included in the portfolio. Of the eleven Written Communication instructors, nine chose to assess one of the GEP learning outcomes and two chose to assess all three. The table below presents a breakdown of what percentage of instructors assessed each of the GEP Written Communication Category Learning Outcomes:
C. Results of General Education Program course portfolio reviews
LO# Upon completing this requirement, students will be able to: Percentage
LO 1 Identify basic components and elements that shape successful writing such as topic, purpose, genre, and audience
36%
LO 2 Compose an articulate, grammatically correct, and organized piece of writing with properly documented and supported ideas, evidence, and information suitable to the topic, purpose, and audience
50%
LO 3 Critique their own and others’ writing to provide effective and useful feedback to improve their communication
45%
Oral CommunicationOne course portfolio was submitted for Oral Communication including the assessment of student work from 36 sections of Communication 101, which is a Foundation Level oral communication class taken largely by first-year students. A common “general course syllabus” was used by instructors across all sections, and a common rubric, based on the National Communication Association Standards for Public Speaking, was used to assess students’ oral presentations (see Appendix A6: Sample Oral Communication Rubric).While all instructors were expected to address all of the GEP Oral Communication Learning Outcomes in their courses, the Division of Communication could choose which learning outcome or outcomes to use for guiding the assessment of student work included in the portfolio. Since the assessment of student work was coordinated across all 36 sections the learning outcome focus was the same for all instructors:
Page 6
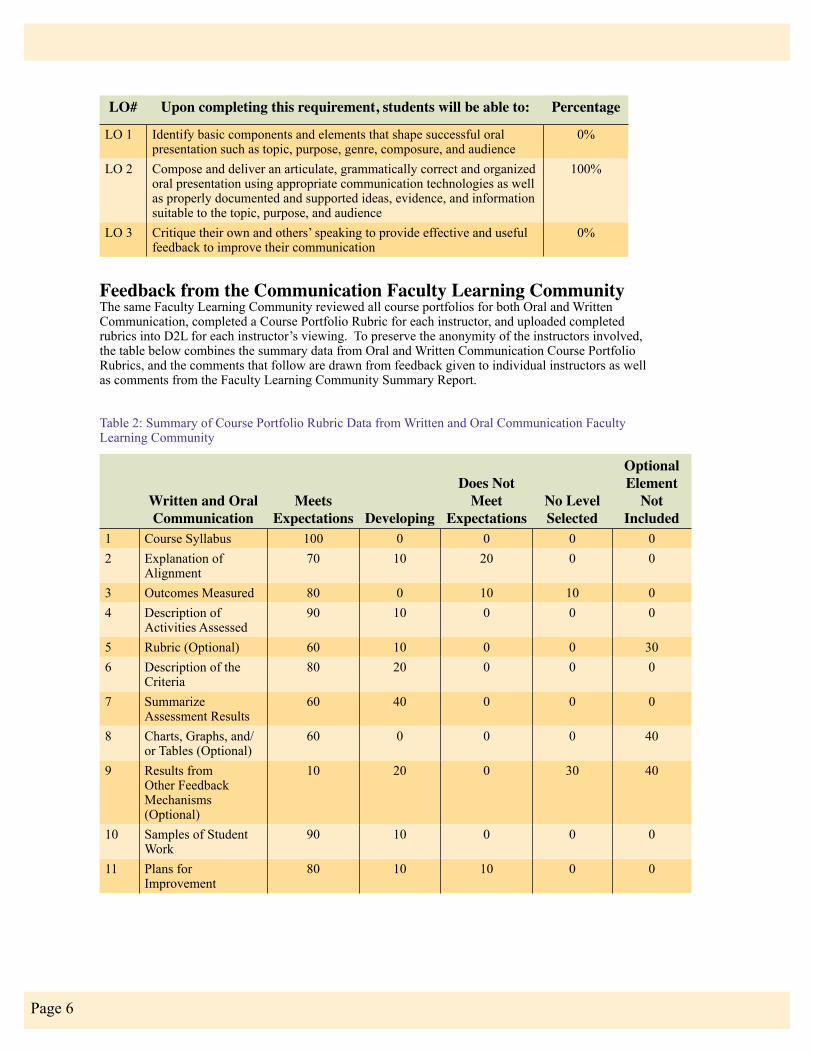
Feedback from the Communication Faculty Learning CommunityThe same Faculty Learning Community reviewed all course portfolios for both Oral and Written Communication, completed a Course Portfolio Rubric for each instructor, and uploaded completed rubrics into D2L for each instructor’s viewing. To preserve the anonymity of the instructors involved, the table below combines the summary data from Oral and Written Communication Course Portfolio Rubrics, and the comments that follow are drawn from feedback given to individual instructors as well as comments from the Faculty Learning Community Summary Report.
LO# Upon completing this requirement, students will be able to: Percentage
LO 1 Identify basic components and elements that shape successful oral presentation such as topic, purpose, genre, composure, and audience
0%
LO 2 Compose and deliver an articulate, grammatically correct and organized oral presentation using appropriate communication technologies as well as properly documented and supported ideas, evidence, and information suitable to the topic, purpose, and audience
100%
LO 3 Critique their own and others’ speaking to provide effective and useful feedback to improve their communication
0%
Written and Oral Communication
Meets Expectations Developing
Does Not Meet
ExpectationsNo Level Selected
Optional Element
Not Included
1 Course Syllabus 100 0 0 0 02 Explanation of
Alignment70 10 20 0 0
3 Outcomes Measured 80 0 10 10 04 Description of
Activities Assessed90 10 0 0 0
5 Rubric (Optional) 60 10 0 0 306 Description of the
Criteria80 20 0 0 0
7 Summarize Assessment Results
60 40 0 0 0
8 Charts, Graphs, and/or Tables (Optional)
60 0 0 0 40
9 Results from Other Feedback Mechanisms (Optional)
10 20 0 30 40
10 Samples of Student Work
90 10 0 0 0
11 Plans for Improvement
80 10 10 0 0
Table 2: Summary of Course Portfolio Rubric Data from Written and Oral Communication Faculty Learning Community
Page 7
University of Wisconsin-Stevens Point Progress Report
As the chart above illustrates, the majority of Oral and Written Communication instructors successfully completed all required components of the course portfolio and received positive feedback from the Faculty Learning community. Suggestions for improvement mainly focused on “Explanation for Alignment,” where the Faculty Learning Community felt the alignment between GEP and course learning outcomes needed to be made more explicit and recommended that the GEP Learning Outcomes and explanation of alignment be included in the course syllabus; and “Summarize Assessment Results” where feedback indicated that “many [instructors] were unable to quantify results” and that the results were not always sufficiently explained. The Faculty Learning Community also commented that in the few cases where a rubric or clear assessment criteria were not provided, it was difficult to followboth the instructor’s assessment process and their results.
Assessment Results and Future Plans for Written and Oral Communication InstructorsAs mentioned previously, all Oral Communication instructors applied the same rubric to student work and results were already aggregated across the 36 sections of Oral Communication classes in the course portfolio submitted. On the student presentation that all Oral Communication instructors required and assessed, the average score across 793 students was 87%, which was somewhat skewed by a few students scoring a zero (a zero score typically represents students who miss their scheduled presentation day). While 87% indicates solid student performance, the mode score for the same assessment was 92% indicating even stronger performance across students in Oral Communication.
In the Written Communication category, there was a great deal of agreement across instructors on what criteria are critical for demonstrating proficient written communication. However, in this set of course portfolios, the use of a common rubric for the assessment of student work was not a requirement and a common format was not used for reporting assessment results. Therefore, assessment results for Written Communication cannot be cleanly aggregated. In the absence of a common assessment tool, the results of each instructor’s assessment data were examined by the Assessment Coordinator to determine what was revealed about student learning. From the grades and ratings given by instructors, it is clear from their point of view that the vast majority of students in written communication are meeting or exceeding expectations for learning related to the GEP Communication Learning Outcomes selected. The majority of students fell into the top two categories where an assessment rubric was used by the instructor, received A’s and B’s when grades were given, and scored in the A/B range if a course average was provided. While a common rubric was not used, because there was a great deal of agreement across instructors on what criteria are critical for demonstrating proficient written communication the development of a common rubric is a logical next step.
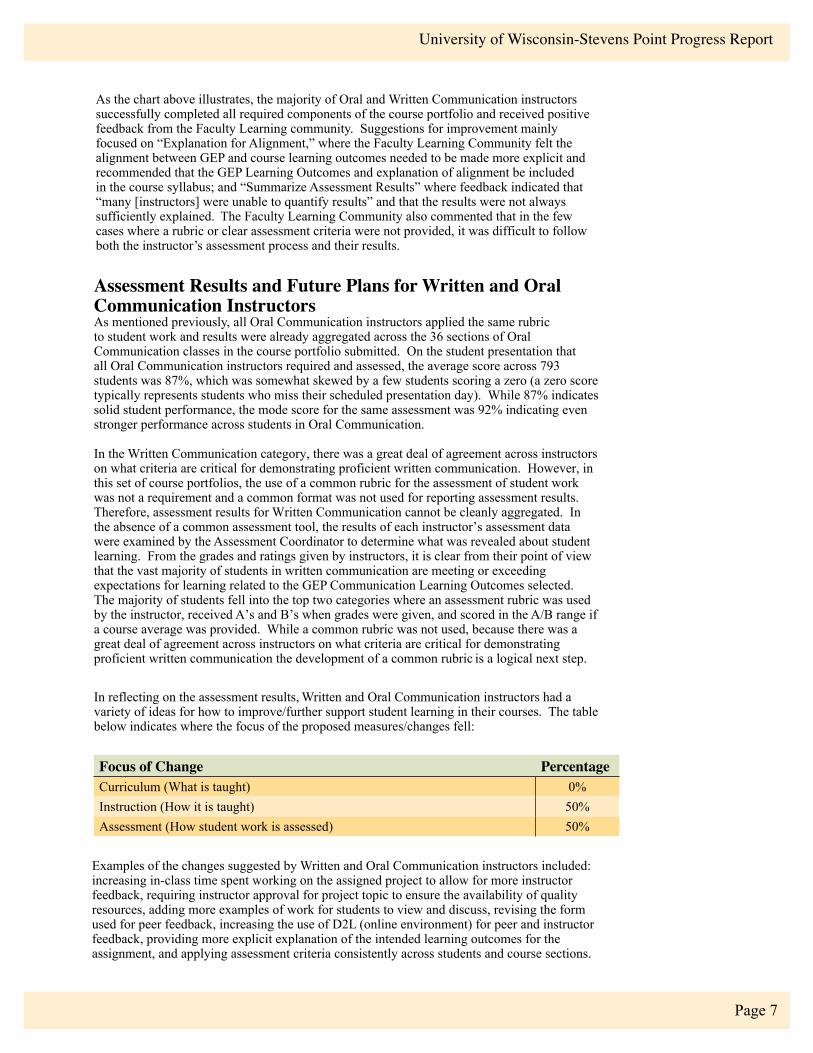
In reflecting on the assessment results, Written and Oral Communication instructors had a variety of ideas for how to improve/further support student learning in their courses. The table below indicates where the focus of the proposed measures/changes fell:
Examples of the changes suggested by Written and Oral Communication instructors included: increasing in-class time spent working on the assigned project to allow for more instructor feedback, requiring instructor approval for project topic to ensure the availability of quality resources, adding more examples of work for students to view and discuss, revising the form used for peer feedback, increasing the use of D2L (online environment) for peer and instructor feedback, providing more explicit explanation of the intended learning outcomes for the assignment, and applying assessment criteria consistently across students and course sections.
Focus of Change PercentageCurriculum (What is taught) 0%Instruction (How it is taught) 50%Assessment (How student work is assessed) 50%
Page 8
First-Year SeminarTwenty course portfolios were submitted in the First-Year Seminar (FYS) category including the assessment of student work from twenty different sections of “special topic” FYS courses, a new component of the General Education Program taken by first-year students. While a common rubric was not used for assessing common learning outcomes across all of the courses, all instructors but a small few included clearly to fairly clearly delineated assessment criteria for the FYS learning outcomes being assessed. Because of the newness of the FYS course, and the number of learning outcomes included in this category, the use of a common rubric or even multiple common rubrics would have been difficult to administer in this first round of assessment. While a common rubric was not used across courses, an example of a FYS rubric that had clear assessment criteria and was noted by the Faculty Learning Community is included in Appendix A7: Sample First-Year Seminar Rubric.
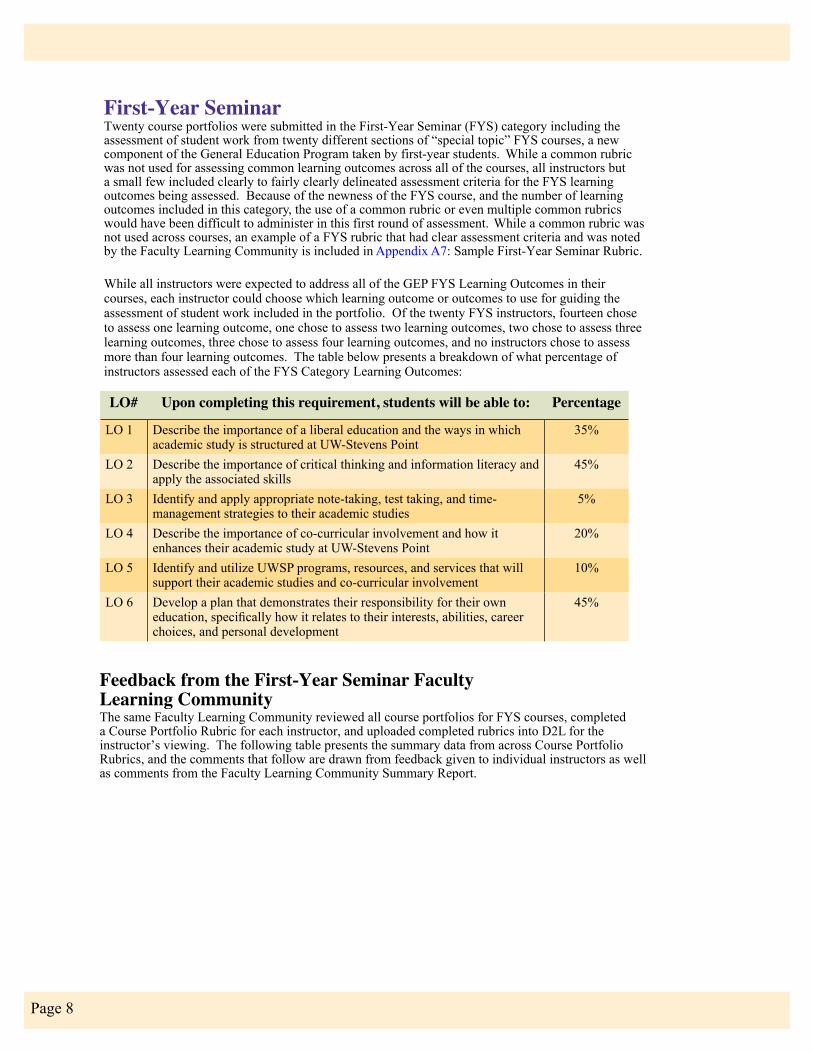
While all instructors were expected to address all of the GEP FYS Learning Outcomes in their courses, each instructor could choose which learning outcome or outcomes to use for guiding the assessment of student work included in the portfolio. Of the twenty FYS instructors, fourteen chose to assess one learning outcome, one chose to assess two learning outcomes, two chose to assess three learning outcomes, three chose to assess four learning outcomes, and no instructors chose to assess more than four learning outcomes. The table below presents a breakdown of what percentage of instructors assessed each of the FYS Category Learning Outcomes:
LO# Upon completing this requirement, students will be able to: Percentage
LO 1 Describe the importance of a liberal education and the ways in which academic study is structured at UW-Stevens Point
35%
LO 2 Describe the importance of critical thinking and information literacy and apply the associated skills
45%
LO 3 Identify and apply appropriate note-taking, test taking, and time-management strategies to their academic studies
5%
LO 4 Describe the importance of co-curricular involvement and how it enhances their academic study at UW-Stevens Point
20%
LO 5 Identify and utilize UWSP programs, resources, and services that will support their academic studies and co-curricular involvement
10%
LO 6 Develop a plan that demonstrates their responsibility for their own education, specifically how it relates to their interests, abilities, career choices, and personal development
45%
Feedback from the First-Year Seminar Faculty Learning CommunityThe same Faculty Learning Community reviewed all course portfolios for FYS courses, completed a Course Portfolio Rubric for each instructor, and uploaded completed rubrics into D2L for the instructor’s viewing. The following table presents the summary data from across Course Portfolio Rubrics, and the comments that follow are drawn from feedback given to individual instructors as well as comments from the Faculty Learning Community Summary Report.
Page 9
University of Wisconsin-Stevens Point Progress Report
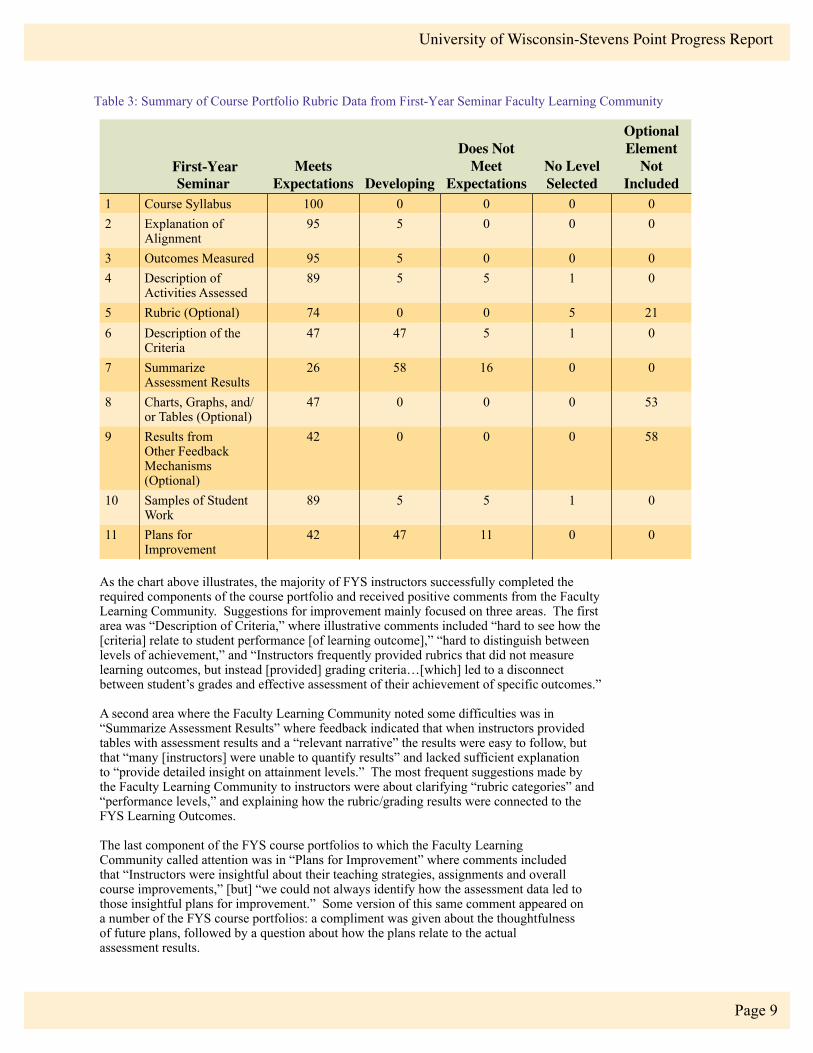
Table 3: Summary of Course Portfolio Rubric Data from First-Year Seminar Faculty Learning Community
First-Year Seminar
Meets Expectations Developing
Does Not Meet
ExpectationsNo Level Selected
Optional Element
Not Included
1 Course Syllabus 100 0 0 0 02 Explanation of
Alignment95 5 0 0 0
3 Outcomes Measured 95 5 0 0 04 Description of
Activities Assessed89 5 5 1 0
5 Rubric (Optional) 74 0 0 5 216 Description of the
Criteria47 47 5 1 0
7 Summarize Assessment Results
26 58 16 0 0
8 Charts, Graphs, and/or Tables (Optional)
47 0 0 0 53
9 Results from Other Feedback Mechanisms (Optional)
42 0 0 0 58
10 Samples of Student Work
89 5 5 1 0
11 Plans for Improvement
42 47 11 0 0
As the chart above illustrates, the majority of FYS instructors successfully completed the required components of the course portfolio and received positive comments from the Faculty Learning Community. Suggestions for improvement mainly focused on three areas. The first area was “Description of Criteria,” where illustrative comments included “hard to see how the [criteria] relate to student performance [of learning outcome],” “hard to distinguish between levels of achievement,” and “Instructors frequently provided rubrics that did not measure learning outcomes, but instead [provided] grading criteria…[which] led to a disconnect between student’s grades and effective assessment of their achievement of specific outcomes.”
A second area where the Faculty Learning Community noted some difficulties was in“Summarize Assessment Results” where feedback indicated that when instructors provided tables with assessment results and a “relevant narrative” the results were easy to follow, but that “many [instructors] were unable to quantify results” and lacked sufficient explanationto “provide detailed insight on attainment levels.” The most frequent suggestions made by the Faculty Learning Community to instructors were about clarifying “rubric categories” and “performance levels,” and explaining how the rubric/grading results were connected to the FYS Learning Outcomes.
The last component of the FYS course portfolios to which the Faculty Learning Community called attention was in “Plans for Improvement” where comments included that “Instructors were insightful about their teaching strategies, assignments and overall course improvements,” [but] “we could not always identify how the assessment data led to those insightful plans for improvement.” Some version of this same comment appeared on a number of the FYS course portfolios: a compliment was given about the thoughtfulness of future plans, followed by a question about how the plans relate to the actualassessment results.
Page 10
Assessment Results and Future Plans for First-Year Seminar InstructorsAssessment results for FYS were especially difficult to aggregate because of the number of learning outcomes included in this category and the fact that common criteria were not required to be used for the assessment of student work nor a common format used for reporting assessment results. In the absence of common criteria or a common assessment tool, the results of each instructor’s assessment data were examined by the Assessment Coordinator to determine what was revealed about student learning. From the grades and ratings given by instructors, it is clear from their point of view that the majority of students in FYS are meeting or exceeding expectations for learning related to the GEP FYS Learning Outcomes selected. The majority of students fell into the top two categories when an assessment rubric was used by the instructor; received A’s and Bs when grades were given, and scored in the A/B range if a point score or class average was provided.
While the majority of students in FYS appear to be meeting or exceeding expectations, in several of the sections, between 10 and 30 percent of the students fell into the lowest and second lowest categories on the assessment results matrix. Descriptors used for the lowest category included “D/F,” “Unacceptable,” “Failing,” “Inadequate,” “Emerging,” and “Beginning.” Descriptors for the second lowest category included “C,” Unsatisfactory,” “Developing,” “Progressing,” and “Average.” It was unclear from the presentation of the assessment results whether these categories were considered unacceptable in terms of performance and what should be done specifically for students who fall into these categories. This was noted in the portfolio assessment rubric by the Faculty Learning Community when it occurred, and generally was followed by a request for clarifying information.
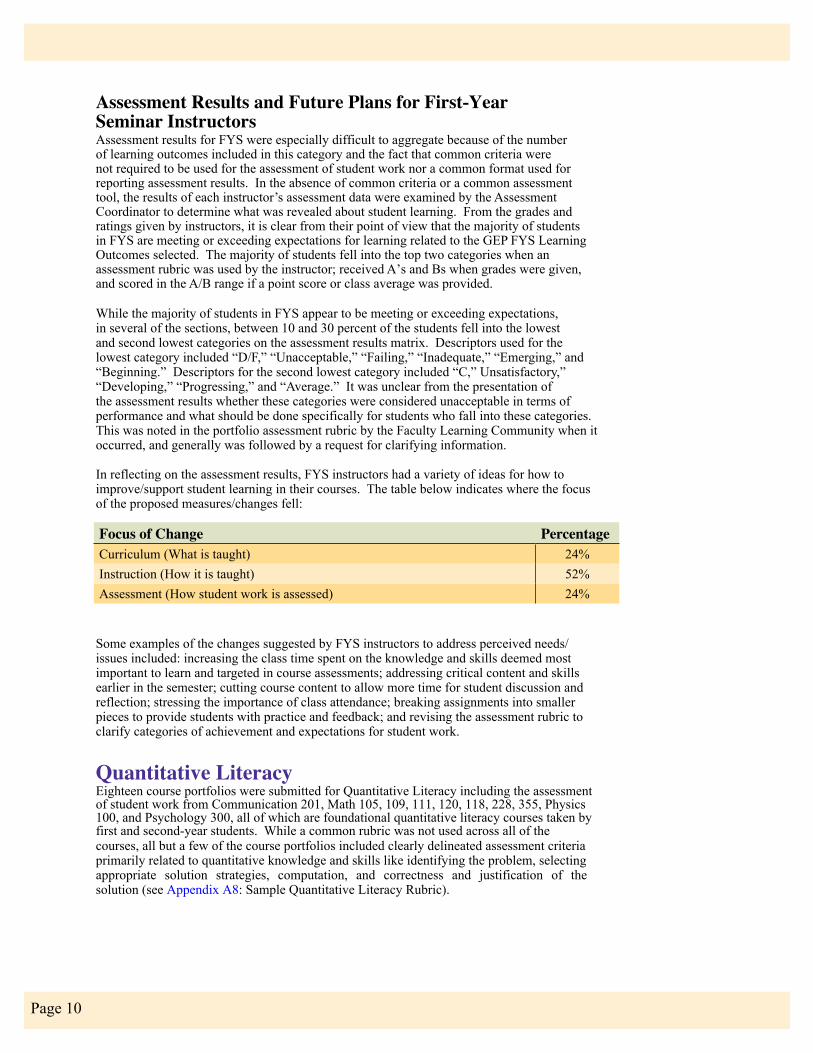
In reflecting on the assessment results, FYS instructors had a variety of ideas for how toimprove/support student learning in their courses. The table below indicates where the focus of the proposed measures/changes fell:
Focus of Change PercentageCurriculum (What is taught) 24%Instruction (How it is taught) 52%Assessment (How student work is assessed) 24%
Some examples of the changes suggested by FYS instructors to address perceived needs/issues included: increasing the class time spent on the knowledge and skills deemed most important to learn and targeted in course assessments; addressing critical content and skills earlier in the semester; cutting course content to allow more time for student discussion and reflection; stressing the importance of class attendance; breaking assignments into smallerpieces to provide students with practice and feedback; and revising the assessment rubric to clarify categories of achievement and expectations for student work.
Quantitative LiteracyEighteen course portfolios were submitted for Quantitative Literacy including the assessment of student work from Communication 201, Math 105, 109, 111, 120, 118, 228, 355, Physics 100, and Psychology 300, all of which are foundational quantitative literacy courses taken by first and second-year students. While a common rubric was not used across all of the courses, all but a few of the course portfolios included clearly delineated assessment criteria primarily related to quantitative knowledge and skills like identifying the problem, selecting appropriate solution strategies, computation, and correctness and justification of the solution (see Appendix A8: Sample Quantitative Literacy Rubric).
Page 11
University of Wisconsin-Stevens Point Progress Report
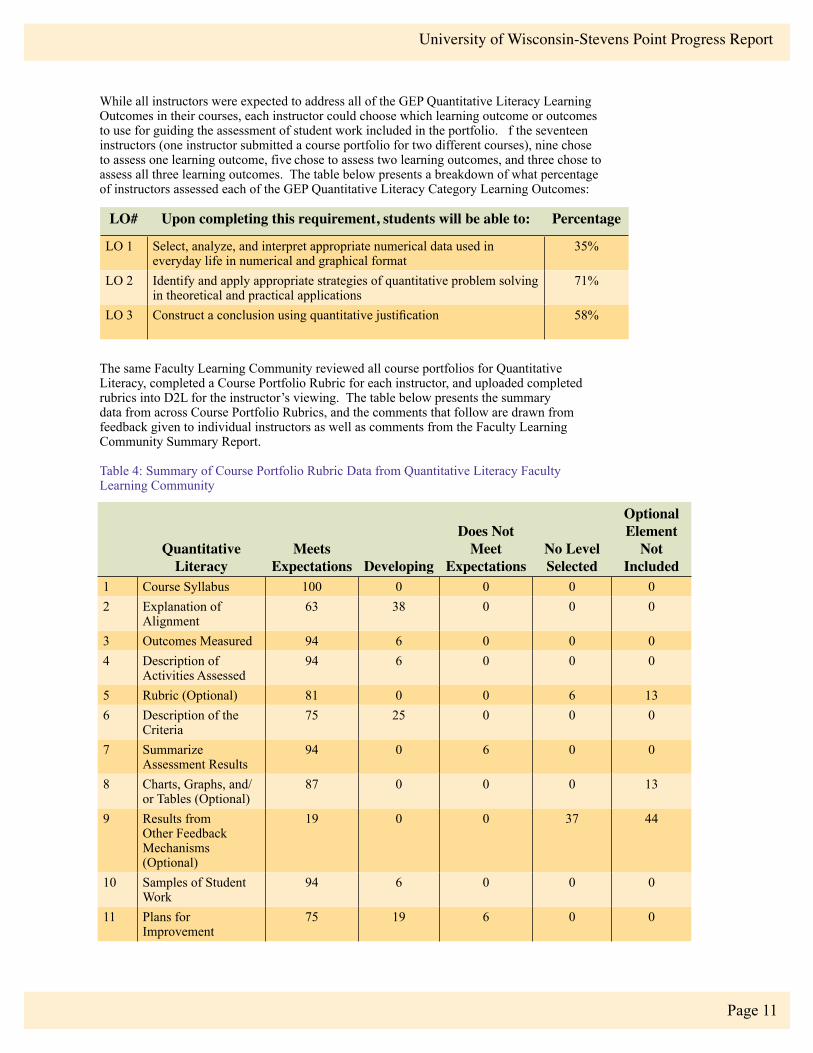
While all instructors were expected to address all of the GEP Quantitative Literacy Learning Outcomes in their courses, each instructor could choose which learning outcome or outcomes to use for guiding the assessment of student work included in the portfolio. Of the seventeen instructors (one instructor submitted a course portfolio for two different courses), nine chose to assess one learning outcome, five chose to assess two learning outcomes, and three chose to assess all three learning outcomes. The table below presents a breakdown of what percentage of instructors assessed each of the GEP Quantitative Literacy Category Learning Outcomes:
LO# Upon completing this requirement, students will be able to: Percentage
LO 1 Select, analyze, and interpret appropriate numerical data used in everyday life in numerical and graphical format
35%
LO 2 Identify and apply appropriate strategies of quantitative problem solving in theoretical and practical applications
71%
LO 3 Construct a conclusion using quantitative justification 58%
The same Faculty Learning Community reviewed all course portfolios for Quantitative Literacy, completed a Course Portfolio Rubric for each instructor, and uploaded completed rubrics into D2L for the instructor’s viewing. The table below presents the summary data from across Course Portfolio Rubrics, and the comments that follow are drawn from feedback given to individual instructors as well as comments from the Faculty Learning Community Summary Report.
Table 4: Summary of Course Portfolio Rubric Data from Quantitative Literacy Faculty Learning Community
Quantitative Literacy
Meets Expectations Developing
Does Not Meet
ExpectationsNo Level Selected
Optional Element
Not Included
1 Course Syllabus 100 0 0 0 02 Explanation of
Alignment63 38 0 0 0
3 Outcomes Measured 94 6 0 0 04 Description of
Activities Assessed94 6 0 0 0
5 Rubric (Optional) 81 0 0 6 136 Description of the
Criteria75 25 0 0 0
7 Summarize Assessment Results
94 0 6 0 0
8 Charts, Graphs, and/or Tables (Optional)
87 0 0 0 13
9 Results from Other Feedback Mechanisms (Optional)
19 0 0 37 44
10 Samples of Student Work
94 6 0 0 0
11 Plans for Improvement
75 19 6 0 0
Page 12
As the table above illustrates, the majority of Quantitative Literacy instructors successfully completed all required components of the course portfolio and received positive comments from the Faculty Learning Community. Suggestions for improvement mainly focused on three areas. The first was “Explanation of Alignment,” where the main focus of comments was to encourage instructors to include the GEP Quantitative Literacy Learning Outcomes and an explanation of alignment in their course syllabus because they believed “students in these courses needed clearer communication of this alignment.”
The second portfolio component that elicited a number of comments from the Faculty Learning Community was in “Description of Criteria,” where it was noted that many instructors provided very clear rubrics/assessment criteria, but in the case of others, “it was not clear how the assessment is linked to the QL learning outcome.” One comment specifically mentioned that the terms used on the rubric for problem-solving were different from the terms included in the Quantitative Literacy Learning Outcome being assessed even though both were focused on the same skills. There was also some concern expressed by the Faculty Learning Community about the match between problems or exam questions being assessed and the Quantitative Literacy Learning Outcome identified as the focus of instruction and assessment.
The last area of the Quantitative Literacy portfolios that drew attention from the Faculty Learning Community was in “Plans for Improvement” where there were a number of very complimentary comments about the instructors’ responses to the assessment results. The Faculty Learning Community expressed support for plans of the instructors to make changes like increase the class focus on the interpretation of a problem and lessen the focus on computation, rearrange their schedule to address some of the targeted knowledge/skills earlier in the semester, and change the language of exam questions to make them clearer to students. In a few cases, Quantitative Literacy instructors did not suggest plans for improvement and the Faculty Learning Community encouraged them to consider what might be done for the students who are not succeeding on their course assessments.
Assessment Results and Future Plans for Quantitative Literacy InstructorsIn the Quantitative Literacy category, there was a great deal of agreement across instructors on what criteria are critical for demonstrating proficiency in this learning outcome. However, in this set of course portfolios, the use of a common rubric for the assessment of student work was not a requirement and a common format was not used for reporting assessment results. Therefore, assessment results for Quantitative Literacy could not readily be aggregated. In the absence of a common assessment tool, the results of each instructor’s assessment data were examined by the Assessment Coordinator to determine what was revealed about student learning. From the grades and ratings given by instructors, it is clear from their point of view that a simple majority of students are meeting or exceeding expectations for learning related to the Quantitative Literacy Learning Outcomes selected. In most classes, at least 50 percent of the students fell into the top two categories on the assessment rubric used by each instructor. While a common rubric was not used, because there was a great deal of agreement and similarity in the criteria used for assessment of quantitative literacy, developing a common rubric for future assessment efforts is a natural next step.
While over half of the students in Quantitative Literacy appear to be meeting or exceeding expectations, in several of the sections, 30 percent or more of the students fell into the lowest and/or second lowest categories on the assessment results matrix. Descriptors used for the lowest category included “Beginning,” ”Unsatisfactory,” “Unacceptable,” “Developing,” “Low Competency,” and “No Attempt.” Descriptors for the second lowest category included “Emerging,” ‘Developing,” ”Problematic,” “Adequate,” and ”Satisfactory.” Some of these descriptors clearly indicate that falling into the category either does or does not qualify as meeting expectations for learning, but others are less clear. The presentation of the assessment results and the accompanying narrative did not always shed light on the instructor’s interpretation of student performance in relation to meeting the GEP Quantitative Literacy learning outcomes.
Page 13
University of Wisconsin-Stevens Point Progress Report
Focus of Change PercentageCurriculum (What is taught) 5%Instruction (How it is taught) 69%Assessment (How student work is assessed) 26%
Some examples of the changes suggested by Quantitative Literacy instructors included increasing the class time spent on the assessed project, pre-testing to determine student skills and inform instruction, giving more problem solving assignments like the ones assessed, making sure tutorials meet the needs of students (class demographics have changed with the change in the General Education Program), increasing student participation rates, spending more time on problems that are interesting to students, and aligning course content with instructors in other departments.
WellnessWhile four course portfolios were submitted for Wellness, only three were uploaded in a complete form to D2L and reviewed by the Faculty Learning Community. The three course portfolios included the assessment of student work from Food and Nutrition 151, Health Promotion and Wellness 102, and Wellness 100, all foundational wellness courses that are taken by first-year students. The Wellness category originally included twelve different courses/instructors, but five of the instructors requested removal of the GEP Wellness designation when they concluded that their courses did not address all three of the learning outcomes. And three instructors, in the same department, requested and were granted the time to revise their courses to meet the Wellness designation and submit course portfolios in the fall of 2014. While a common rubric was not used across all of the courses, all of the course portfolios included clearly delineated criteria for assessment of student work (see Appendix A9: Sample Wellness Rubric).
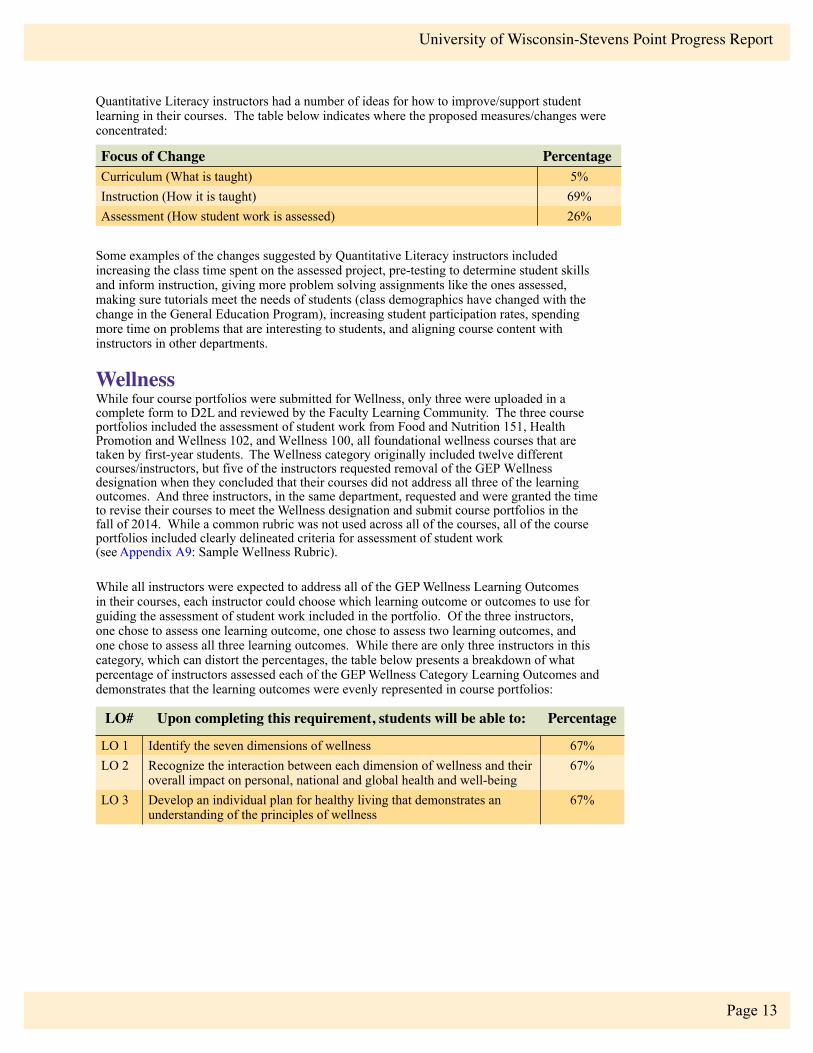
While all instructors were expected to address all of the GEP Wellness Learning Outcomes in their courses, each instructor could choose which learning outcome or outcomes to use for guiding the assessment of student work included in the portfolio. Of the three instructors, one chose to assess one learning outcome, one chose to assess two learning outcomes, and one chose to assess all three learning outcomes. While there are only three instructors in this category, which can distort the percentages, the table below presents a breakdown of what percentage of instructors assessed each of the GEP Wellness Category Learning Outcomes and demonstrates that the learning outcomes were evenly represented in course portfolios:
Quantitative Literacy instructors had a number of ideas for how to improve/support student learning in their courses. The table below indicates where the proposed measures/changes were concentrated:
LO# Upon completing this requirement, students will be able to: Percentage
LO 1 Identify the seven dimensions of wellness 67%LO 2 Recognize the interaction between each dimension of wellness and their
overall impact on personal, national and global health and well-being67%
LO 3 Develop an individual plan for healthy living that demonstrates an understanding of the principles of wellness
67%
Page 14
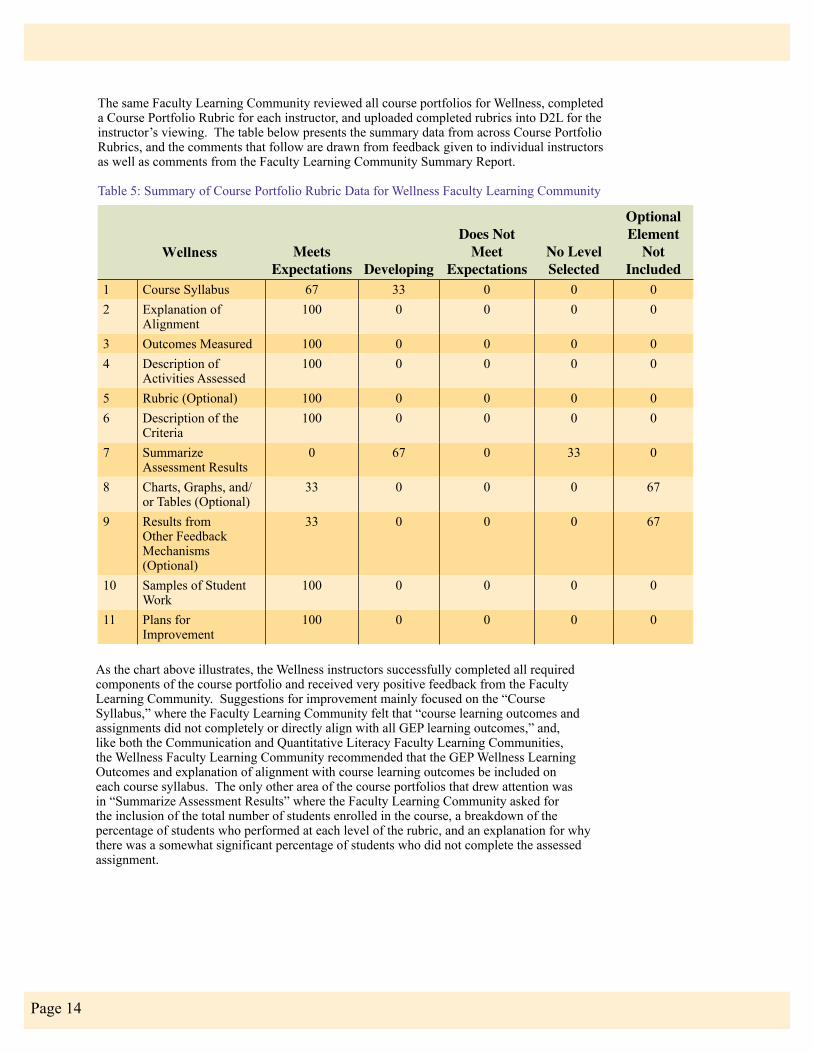
The same Faculty Learning Community reviewed all course portfolios for Wellness, completed a Course Portfolio Rubric for each instructor, and uploaded completed rubrics into D2L for the instructor’s viewing. The table below presents the summary data from across Course Portfolio Rubrics, and the comments that follow are drawn from feedback given to individual instructors as well as comments from the Faculty Learning Community Summary Report.
Table 5: Summary of Course Portfolio Rubric Data for Wellness Faculty Learning Community
Wellness Meets Expectations Developing
Does Not Meet
ExpectationsNo Level Selected
Optional Element
Not Included
1 Course Syllabus 67 33 0 0 02 Explanation of
Alignment100 0 0 0 0
3 Outcomes Measured 100 0 0 0 04 Description of
Activities Assessed100 0 0 0 0
5 Rubric (Optional) 100 0 0 0 06 Description of the
Criteria100 0 0 0 0
7 Summarize Assessment Results
0 67 0 33 0
8 Charts, Graphs, and/or Tables (Optional)
33 0 0 0 67
9 Results from Other Feedback Mechanisms (Optional)
33 0 0 0 67
10 Samples of Student Work
100 0 0 0 0
11 Plans for Improvement
100 0 0 0 0
As the chart above illustrates, the Wellness instructors successfully completed all required components of the course portfolio and received very positive feedback from the Faculty Learning Community. Suggestions for improvement mainly focused on the “Course Syllabus,” where the Faculty Learning Community felt that “course learning outcomes and assignments did not completely or directly align with all GEP learning outcomes,” and, like both the Communication and Quantitative Literacy Faculty Learning Communities, the Wellness Faculty Learning Community recommended that the GEP Wellness Learning Outcomes and explanation of alignment with course learning outcomes be included on each course syllabus. The only other area of the course portfolios that drew attention was in “Summarize Assessment Results” where the Faculty Learning Community asked for the inclusion of the total number of students enrolled in the course, a breakdown of the percentage of students who performed at each level of the rubric, and an explanation for why there was a somewhat significant percentage of students who did not complete the assessedassignment.
Page 15
University of Wisconsin-Stevens Point Progress Report
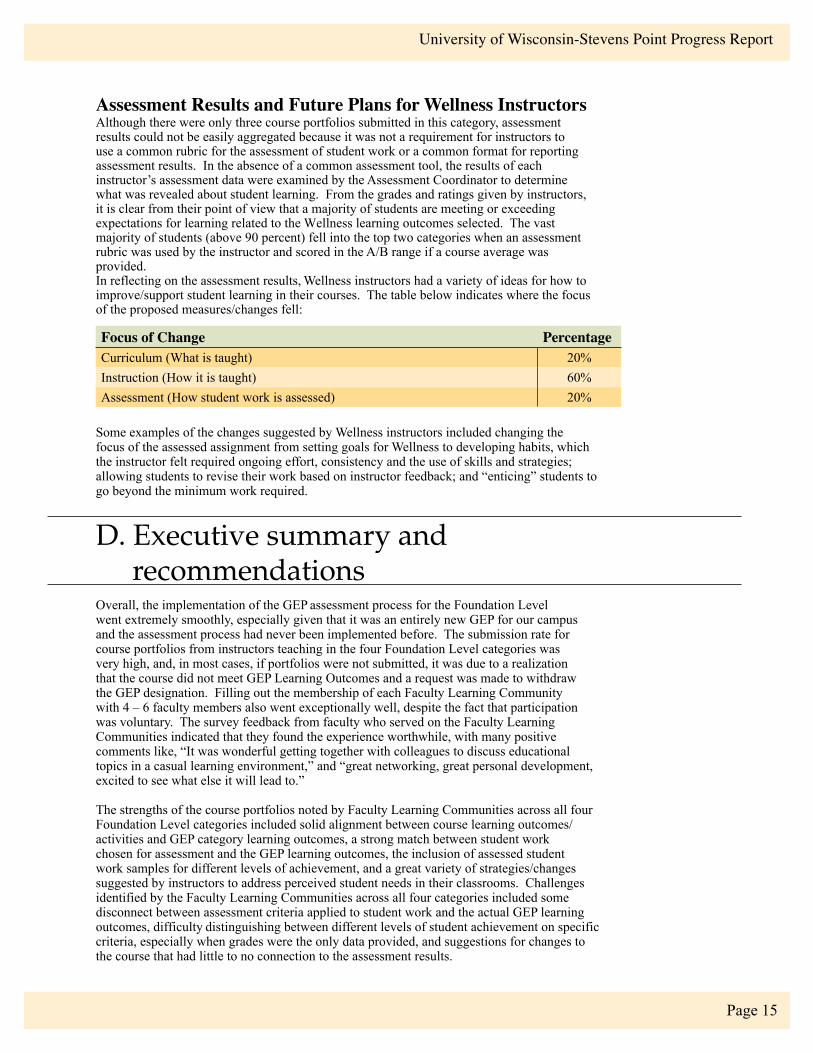
Assessment Results and Future Plans for Wellness Instructors Although there were only three course portfolios submitted in this category, assessment results could not be easily aggregated because it was not a requirement for instructors to use a common rubric for the assessment of student work or a common format for reporting assessment results. In the absence of a common assessment tool, the results of each instructor’s assessment data were examined by the Assessment Coordinator to determine what was revealed about student learning. From the grades and ratings given by instructors, it is clear from their point of view that a majority of students are meeting or exceeding expectations for learning related to the Wellness learning outcomes selected. The vast majority of students (above 90 percent) fell into the top two categories when an assessment rubric was used by the instructor and scored in the A/B range if a course average was provided. In reflecting on the assessment results, Wellness instructors had a variety of ideas for how to improve/support student learning in their courses. The table below indicates where the focus of the proposed measures/changes fell:
Focus of Change PercentageCurriculum (What is taught) 20%Instruction (How it is taught) 60%Assessment (How student work is assessed) 20%
Some examples of the changes suggested by Wellness instructors included changing the focus of the assessed assignment from setting goals for Wellness to developing habits, which the instructor felt required ongoing effort, consistency and the use of skills and strategies; allowing students to revise their work based on instructor feedback; and “enticing” students to go beyond the minimum work required.
D. Executive summary and recommendationsOverall, the implementation of the GEP assessment process for the Foundation Level went extremely smoothly, especially given that it was an entirely new GEP for our campus and the assessment process had never been implemented before. The submission rate for course portfolios from instructors teaching in the four Foundation Level categories was very high, and, in most cases, if portfolios were not submitted, it was due to a realization that the course did not meet GEP Learning Outcomes and a request was made to withdraw the GEP designation. Filling out the membership of each Faculty Learning Community with 4 – 6 faculty members also went exceptionally well, despite the fact that participation was voluntary. The survey feedback from faculty who served on the Faculty Learning Communities indicated that they found the experience worthwhile, with many positive comments like, “It was wonderful getting together with colleagues to discuss educational topics in a casual learning environment,” and “great networking, great personal development, excited to see what else it will lead to.”
The strengths of the course portfolios noted by Faculty Learning Communities across all four Foundation Level categories included solid alignment between course learning outcomes/ activities and GEP category learning outcomes, a strong match between student work chosen for assessment and the GEP learning outcomes, the inclusion of assessed student work samples for different levels of achievement, and a great variety of strategies/changes suggested by instructors to address perceived student needs in their classrooms. Challenges identified by the Faculty Learning Communities across all four categories included somedisconnect between assessment criteria applied to student work and the actual GEP learning outcomes, difficulty distinguishing between different levels of student achievement on specificcriteria, especially when grades were the only data provided, and suggestions for changes to the course that had little to no connection to the assessment results.
Page 16
After careful consideration of the course portfolios submitted, reported assessment results, Faculty Learning Community feedback to instructors, survey data from instructors and Faculty Learning Community members, and summary comments and recommendations from the four Faculty Learning Communities, the following recommendations are made for future efforts and actions, some of which have already been implemented.
Changes to General Education Program assessment procedures and policiesThe changes outlined below also include changes to professional development opportunities for Year 2 of the GEP Assessment cycle, which focuses on Investigation Level courses in the Arts, Humanities, Historical Perspectives, Social Sciences, and Natural Sciences. Changes already implemented for the assessment of our General Education Program include:
1. An increased number of informational sessions have been offered for InvestigationLevel instructors and department chairs, and have been offered earlier in theassessment cycle than for Foundation Level Instructors.
2. The single professional development workshop provided for instructors on how to develop a course portfolio and upload materials electronically in Desire2Learn has been divided into two separate workshops; the first, a two-hour workshop, specifically focused on preparing materials for the course portfolio like the syllabus, explanation of alignment of course and GEP learning outcomes, developing and applying rubrics, reporting assessment results, and developing plans for improvement based on the results; and the second, an hour-long workshop solely on how to upload an electronic version of course portfolio to DesiretoLearn.
3. Based on the feedback from Foundation Level Faculty Learning Communities,Investigation Level instructors have been encouraged to include the GEP CategoryLearning Outcomes and an explanation of alignment to their course in theirsyllabus.
4. While the UWSP Handbook language only specifies that a “discipline-appropriateevaluation of student attainment of at least one learning outcome” be used, copiesof the AAC&U VALUE Rubrics have been shared in all Investigation Levelassessment workshops and instructors have been encouraged to choose entirerubrics or criteria from the rubrics to assess student work in their courses.
5. Based on feedback from course instructors and Faculty Learning Communities,the Course Portfolio Rubric has been revised to more clearly communicate what isneeded for each component of the course portfolio.
Recommendations for General Education Program/Committee ProceduresReconvene all four Foundation Level Faculty Learning Communities this fall, along with representative instructors and General Education Committee members, to follow up on the assessment results and recommendations for changes/improvement, including:
1. Review and suggest any needed revisions for learning outcomes in each category basedon the results of Foundation Level assessment. A suggestion might be to streamline thenumber of learning outcomes to two in each category, which would make it possiblefor instructors to assess student learning of all category learning outcomes through oneor two well-chosen course assessments, a recommendation from the Faculty LearningCommunities.
2. Specifically, revise First-Year Seminar category learning outcomes. This was therecommendation from instructors and Faculty Learning Community members alike,as trying to teach and/or assess six learning outcomes turned out to be difficult andunwieldy. Based on the learning outcomes that were assessed when given the choice,the one focused on critical thinking and information literacy and the one focusedon developing a plan that demonstrates the student’s responsibility for their owneducation seemed to be the top choices of the instructors. Some of the other learningoutcomes might be deemed important activities to include in First-Year Seminars, but
Page 17
University of Wisconsin-Stevens Point Progress Report
not necessarily learning outcomes to be assessed. Critical thinking seems especially important to retain as one of the First-Year Seminar learning outcomes because it is part of the first “Overarching GEP Learning Outcomes” and a foundational skill for students pursuing a higher education.
3. Develop a common assessment rubric for critical thinking to be used in all First-YearSeminar courses, which would help provide consistency in assessing CriticalThinking and also clarify communication about critical thinking to students. Thiscommon critical thinking rubric could be used for other GEP Levels and for programassessment (critical thinking rubrics already being used on campus and the AAC&UVALUE Rubric for Critical Thinking would be valuable resources in this process).Since Information Literacy is included in the same learning outcome as criticalthinking, a common rubric for Information Literacy might also be developed andapplied across First-Year Seminar courses.
4. Form a Faculty Learning Community for the First-Year Seminar category in the fall of2015 and require all First-Year Seminar course instructors teaching in that semester tosubmit course portfolios. This would provide an opportunity to assess the revised andstreamlined First-Year Seminar learning outcomes and apply the common rubric forCritical Thinking, and possibly Information Literacy.
5. Develop common assessment rubrics to be used for Written Communication,Quantitative Literacy, and Wellness. There was already considerable agreement aboutassessment criteria among instructors in these categories and using common rubricswould provide for more consistency in assessment across students and courses, andwould facilitate the aggregation of data. These common rubrics for foundational skillscould then be used across campus for other GEP Levels and for program assessment(the rubrics already being used by English instructors and the AAC&U VALUE Rubricfor Written Communication would be valuable resources in this process).
6. Form a Faculty Learning Community for the Wellness category in the fall of 2015 andrequire all Wellness instructors teaching at that time to submit course portfolios. Thiswould provide an opportunity to assess courses that weren’t ready to submit portfoliosthis past fall, assess new Wellness courses that are added this year, and apply thecommon rubric for Wellness that assesses the revised learning outcomes, if changesare made by the General Education Committee and Faculty Senate.
Recommendations for General Education Program/Committee PoliciesRequire that GEP Category Learning Outcomes and an explanation of alignment between these learning outcomes and the course/course activities be included in the course syllabus portion of GEP course proposal form before a course is approved for the GEP.
1. As recommended by Faculty Learning Community members, require that GEPCategory Learning Outcomes and an explanation of alignment between the course/course activities and the GEP learning outcomes be included in every syllabussubmitted as part of the course portfolio process beginning with the Cultural andEnvironmental Awareness Level. Making this stipulation would create a smootherreview process for the Faculty Learning Communities and streamline the courseportfolio process for instructors.
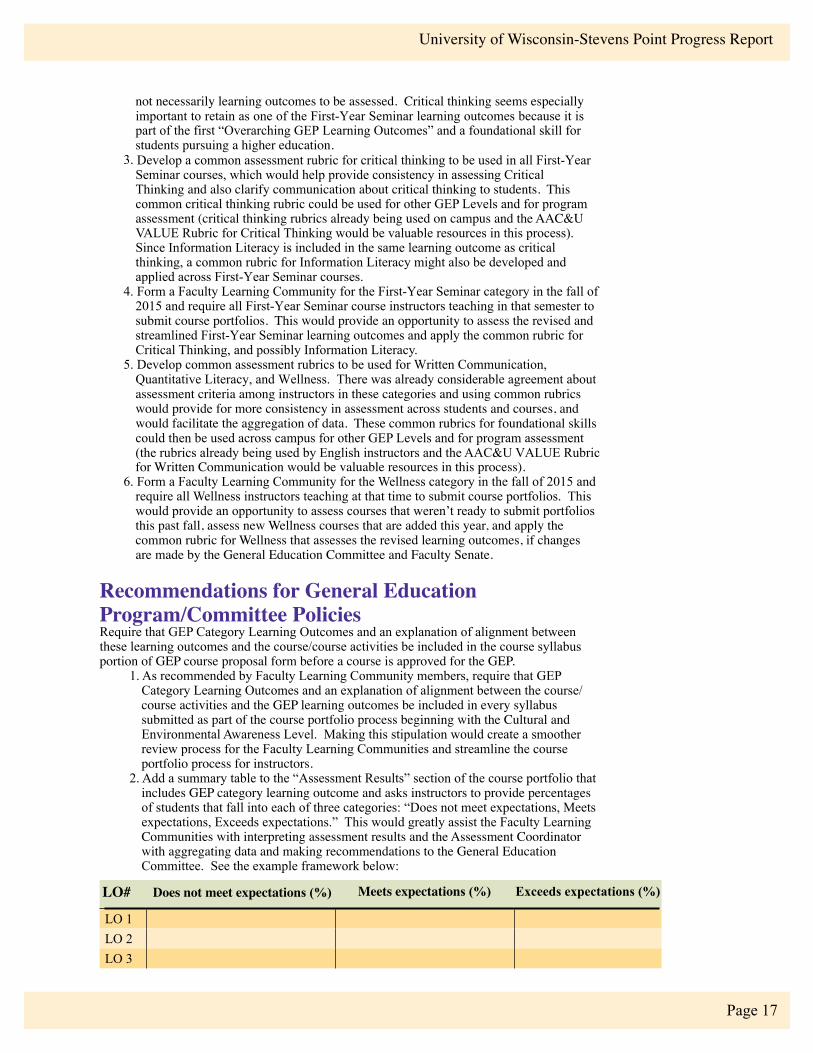
2. Add a summary table to the “Assessment Results” section of the course portfolio thatincludes GEP category learning outcome and asks instructors to provide percentagesof students that fall into each of three categories: “Does not meet expectations, Meetsexpectations, Exceeds expectations.” This would greatly assist the Faculty LearningCommunities with interpreting assessment results and the Assessment Coordinatorwith aggregating data and making recommendations to the General EducationCommittee. See the example framework below:
LO# Does not meet expectations (%) Meets expectations (%) Exceeds expectations (%)
LO 1LO 2LO 3
Page 18
3. Consider an addition to the “Plans for Improvement” section that would ask instructorsto explain plans for helping students who are not meeting expectations in their classes.Especially at the Foundation Level, students who are struggling with fundamental andnecessary skills in writing, speaking, quantitative literacy, and critical thinking may beat risk for failing and/or leaving the university. Encouraging instructors to reflect onthis issue in their course portfolio might help to contribute to overall retention offirst-year students.
Recommendations for General Education Program Professional Development
1. Continue professional development efforts in the use of assessment rubrics and thereporting of data from the rubrics; the current set of course portfolios demonstrate that our campus has made great strides in this area, but feedback from the Faculty Learning Communities also suggest that further development is needed.
2. Collaborate with the University Assessment Subcommittee to help disciplines/programs develop plans for integrating GEP assessment data into their Five-YearProgram Assessment Reports, which helps to facilitate the assessment of the entireGeneral Education Program from the first year through graduation, including thedevelopment of critical communication, quantitative literacy, critical thinking, andwellness skills throughout major courses.
3. Consider offering professional development opportunities related to helping strugglingfirst-year students in Foundation Level courses. Some of the assessment resultsreported by instructors indicate that a small to sometimes significant portion of studentsdo not meet expectations for the GEP learning outcomes and may indicate thesestudents are at risk for failure and/or leaving the university.
E. Concluding remarksThe GEP Assessment Process for the Foundation Level went extremely well and demonstrates a strong commitment on the UW-Stevens Point campus to the assessment and improvement of student learning. There was much agreement demonstrated about what is important for students to know and be able to do in each of the four Foundation Level Categories and results demonstrate that, based on the best judgment of instructors, the majority of students are meeting or exceeding GEP learning outcomes in their courses. At the time the GEP Assessment Plan was drafted, it was determined that instructors should apply a “discipline-appropriate evaluation,” and the decision was left to them to determine what this assessment should be. The results from this first round of assessment demonstrate that there is significant agreement about key assessment criteria among instructors in each category and that agreeing on common assessment rubrics for future use is well within reach and will be implemented as soon as the spring of 2015. The use of common rubrics (locally created and drawn from the AAC&U VALUE Rubrics where deemed appropriate) would increase consistency of assessment across students and courses, simplify the analysis of data and the reporting of assessment results, and allow for the aggregation of data within GEP categories and across the entire GEP. The assessment process currently in place, as described in this report, supports scholarly and collaborative inquiry into teaching and learning and promotes thoughtful reflection on instructional practices. The aim should be to continue to support this important and unique aspect of the GEP Assessment process, while also addressing needs for reliable assessment and accountability.
Page 19
University of Wisconsin-Stevens Point Progress Report
III. Program Assessment Report(Submitted to the Academic Affairs Committee and approved by Faculty Senate, Fall 2014)
A. Introduction to assessment of program learning outcomesDuring the 2012 Focused Visit, the Higher Learning Commission expressed concern over an observed unevenness in departments’ understanding of the assessment process, particularly related to the use of direct measure assessments of student learning. This concern was instrumental in motivating the Assessment Subcommittee to institute a multistep procedure to assure that all the departments could successfully collect, analyze, and reflect on the results of direct measure assessment of student learning, as well as determine plans for future efforts based on assessment results.
Throughout 2012-2014, the Assessment Subcommittee conducted professional workshops and face-to-face meetings to prepare departments to meet the direct measure assessment requirement from the Higher Learning Commission. Effective models of rubrics, reports, and course assessments were shared during professional development workshops. Assessment resources from the workshops were made easily available online for everybody’s benefit and consultation. The Assessment Subcommittee also provided timely feedback to all departments upon completion of each stage in the multistep procedure ensuring that each program was supported in their assessment efforts.
Below are the details of the multistep procedure implemented as well as a discussion of the results.
B. Overview of ongoing program assessment effortsThe Assessment Coordinator (50% assessment and 50% teaching position) was hired in the fall of 2012 and, in that role, began serving as a permanent member of the Faculty Senate Assessment Subcommittee (AS). The Assessment Coordinator’s activities have included:
• Providing professional development opportunities: - Ongoing summer and academic year workshops on the use of learning outcomes
for assessment and curricular redesign (week-long, whole-day, and half-day formats)
- October 2013 and April 2014 workshops helping departments complete the HLC Interim Assessment Reports
- Creating and providing templates, examples, and rubrics for the workshops and interim reports
- Making all workshop information/materials available on-line and communicating with departments on a continual basis to provide support:http://www.uwsp.edu/acadaff/Pages/ProgressReport2015/InterimAssessmentReports.aspx
• Face-to-face meetings with the departments• Serving as a permanent member of the General Education Committee (GEC) and
coordinating assessment activities between the two committees, GEC and AS• Coordinating bi-monthly meetings for the Assessment Subcommittee Executive Team,
comprised of the AS co-chairs and the Assessment Coordinator
Page 20
The Assessment Subcommittee Efforts: • Revised and refined the full Program Assessment Report presentation guidelines and
format (see Appendix A10: Assessment Report Presentation Guidelines and Format Narrative)• Developed a “Next Steps” section for the full Program Assessment Report feedback
rubric to address follow up issues with departments, including a requirement for thesubmission of an Abbreviated Interim Report prior to the next full assessment reportdeadline when the report does not meet all the assessment requirements(see Appendix A11: Assessment Report Feedback Rubric)
• Developed an HLC Interim Assessment Report process, including a two-part reportform (Part I due November 15, 2013 and Part II due June 15, 2014) and correspondingfeedback rubrics, along with a list of requirements, explaining the two-part report,emailed to each department/program (see Appendix A12: Interim Assessment ReportTemplate, Feedback Rubric and Guidelines)
• Designed tentative procedures and timeline for assessment liaisons (see Appendix A13:Tentative Procedures and Timeline for Assessment Liaisons)
• Assigned assessment liaisons from the Assessment Subcommittee to every department/program to monitor and assist in the successful completion of their program assessment(see Appendix A14: Assessment Liaisons, 2013-2014)
• Created procedures for delinquent Program Assessment Reports that included possible notifications to Department Chairs, Deans, and the Provost (see Appendix A15: Procedures for Delinquent Assessment Reports)
• Held face-to-face discussions with departmental representatives about their fullassessment reports to answer questions and provide guidance and resources for theirassessment efforts
• Provided written feedback to all departments, both those submitting a full ProgramAssessment Report and those submitting an HLC Interim Assessment Report
• Held multiday summer assessment retreats (2012, 2013) and extended summer work(2014) to reflect on and address assessment results and needs for the campus
• Adjusted the 5-year reporting cycle for Program Assessment Reports and departmentalreviews to more effectively distribute the committee workload (see Appendix A16:Reporting Cycle for Assessment and Department Review, 2011-2021)
• Developed an Annual Department/Program Check-In Assessment Form(see Appendix A17: Annual Program Check-In Assessment Form)
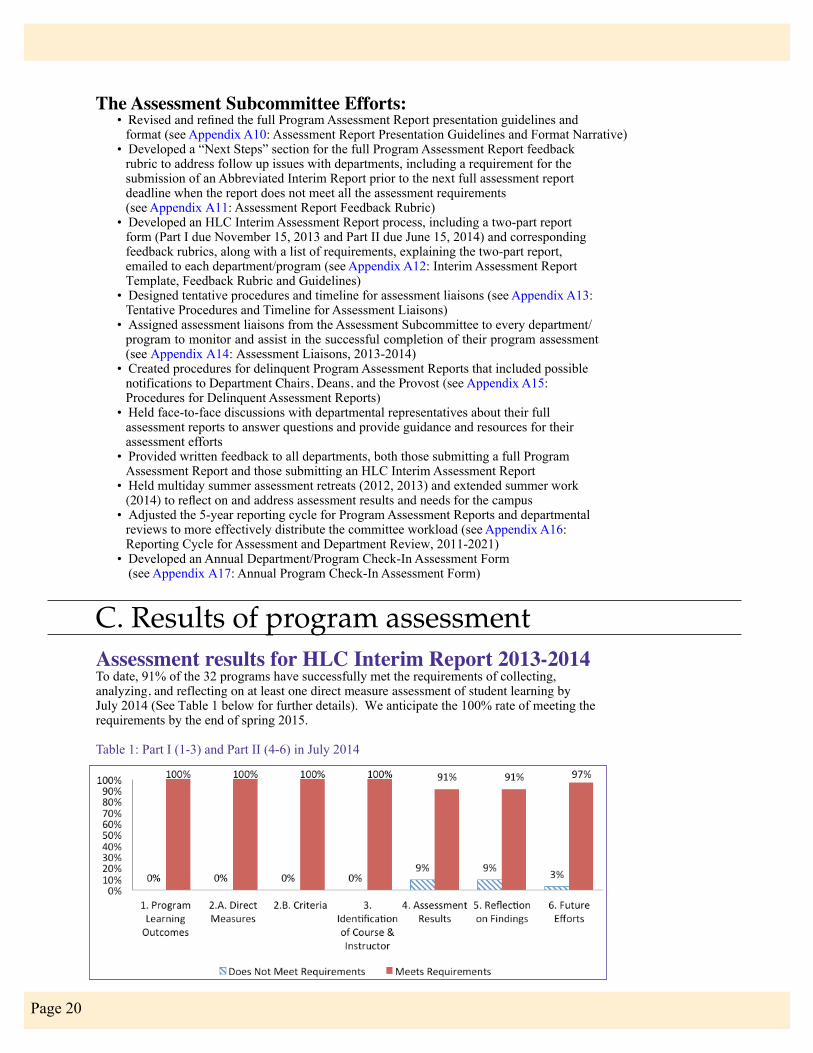
C. Results of program assessmentAssessment results for HLC Interim Report 2013-2014To date, 91% of the 32 programs have successfully met the requirements of collecting, analyzing, and reflecting on at least one direct measure assessment of student learning by July 2014 (See Table 1 below for further details). We anticipate the 100% rate of meeting the requirements by the end of spring 2015.
Table 1: Part I (1-3) and Part II (4-6) in July 2014
Page 21
University of Wisconsin-Stevens Point Progress Report
Achieving this level of success has required four distinct steps on the part of the Assessment Subcommittee facilitated by the Assessment Coordinator:
a. Collecting and reviewing all HLC Interim Report Part I submissions in November 2013b. Following up with the departments that did not meet the requirements for the HLC
Interim Report Part I in fall of 2013c. Collecting and reviewing all HLC Interim Report Part II submissions in July 2014d. Following up with the departments who did not meet the requirements for the HLC
Interim Report Part II in early fall of 2014
When the first round of data collection and analysis for the HLC Interim Report Part I revealed in November 2013 that some departments were not clear on how to address the direct measure requirement, the Assessment Subcommittee provided a detailed rubric that included constructive feedback to the departments. In addition to this, the Assessment Coordinator and Co-Chair of the AS conducted face-to-face meetings with departmental representatives to address any questions or concerns. As a result of these efforts, all the departments were successful in meeting the requirement of having a plan for using direct measures to assess student learning (Part I) by the end of the 2013 fall semester.
In summer of 2014, the second round of data collection and analysis for the HLC Interim Report revealed that 29 programs (91%) met all the requirements for Part II by using direct measures to provide evidence of student learning, reflecting on findings, and discussing future plans based on assessment results. Although the overall results for program assessment were very positive, the Assessment Subcommittee required the resubmission in early fall of 2014 of Part II from the three departments that did not meet the HLC Interim Assessment Report requirements. The Assessment Coordinator and AS Co-Chair scheduled individual follow-up meetings to assist each of these departments with the resubmission of the report and revision of their assessment procedures, such as data collection, interpretation of results, and future planning.
Aggregated program-level assessment results 2013-2014In accordance with the university’s 5-year “Reporting Cycle for Program Assessment Reports,” nine programs submitted full Program Assessment Reports in fall of 2013. Based on the AS review of the full Program Assessment Reports, eight of the nine programs that submitted reports met the requirements of applying a direct measure to assess student learning and were not asked to submit the HLC Interim Report. The one program that did not meet the requirements of applying a direct measure to assess student learning was asked to submit an HLC Interim Assessment Report by June of 2014. At that time, the final program successfully reported their results from applying a direct measure to assess student learning.
The aggregated results combine the data from the full Program Assessment Reports (eight programs) and the HLC Interim Assessment Reports (24 programs) to provide a full picture of how they are collecting, analyzing, and processing their data to monitor student performance on program learning outcomes and make changes to enhance student learning. The following Table 2 below provides a breakdown on the number of Program Learning Outcomes (PLOs) measured, criteria used, course levels assessed, and future plans.
Page 22
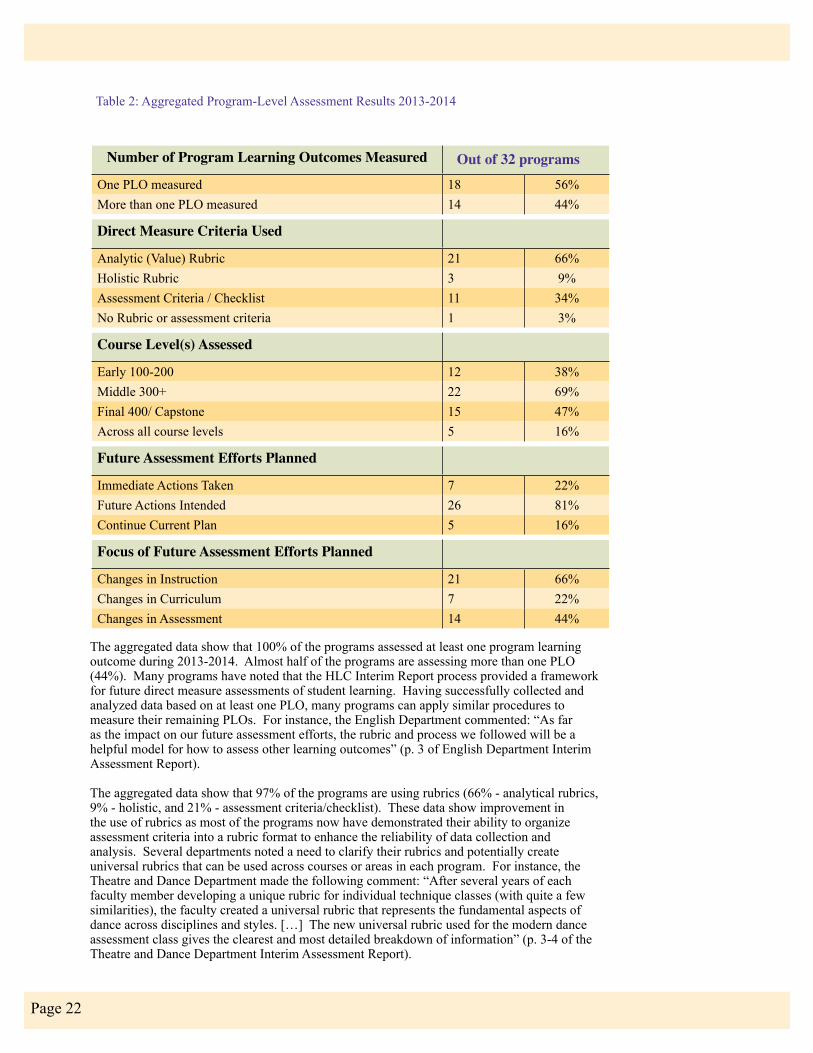
Table 2: Aggregated Program-Level Assessment Results 2013-2014
Number of Program Learning Outcomes Measured
One PLO measured 18 56%More than one PLO measured 14 44%
Direct Measure Criteria Used
Analytic (Value) Rubric 21 66%Holistic Rubric 3 9%Assessment Criteria / Checklist 11 34%No Rubric or assessment criteria 1 3%
Course Level(s) Assessed
Early 100-200 12 38%Middle 300+ 22 69%Final 400/ Capstone 15 47%Across all course levels 5 16%
Future Assessment Efforts Planned
Immediate Actions Taken 7 22%Future Actions Intended 26 81%Continue Current Plan 5 16%
Focus of Future Assessment Efforts Planned
Changes in Instruction 21 66%Changes in Curriculum 7 22%Changes in Assessment 14 44%
Out of 32 programs
The aggregated data show that 100% of the programs assessed at least one program learning outcome during 2013-2014. Almost half of the programs are assessing more than one PLO (44%). Many programs have noted that the HLC Interim Report process provided a framework for future direct measure assessments of student learning. Having successfully collected and analyzed data based on at least one PLO, many programs can apply similar procedures to measure their remaining PLOs. For instance, the English Department commented: “As far as the impact on our future assessment efforts, the rubric and process we followed will be a helpful model for how to assess other learning outcomes” (p. 3 of English Department Interim Assessment Report).
The aggregated data show that 97% of the programs are using rubrics (66% - analytical rubrics, 9% - holistic, and 21% - assessment criteria/checklist). These data show improvement in the use of rubrics as most of the programs now have demonstrated their ability to organize assessment criteria into a rubric format to enhance the reliability of data collection and analysis. Several departments noted a need to clarify their rubrics and potentially create universal rubrics that can be used across courses or areas in each program. For instance, the Theatre and Dance Department made the following comment: “After several years of each faculty member developing a unique rubric for individual technique classes (with quite a few similarities), the faculty created a universal rubric that represents the fundamental aspects of dance across disciplines and styles. […] The new universal rubric used for the modern dance assessment class gives the clearest and most detailed breakdown of information” (p. 3-4 of the Theatre and Dance Department Interim Assessment Report).
Page 23
University of Wisconsin-Stevens Point Progress Report
The aggregated data show that programs are conducting assessments of student learning across all course levels. Thirty-eight percent of the programs implemented assessment early in the curriculum (100 and 200 level), which is especially helpful for determining student performance early in the program and setting benchmarks for student performance in more advanced courses. Sixty-nine percent of the programs favored assessment at the middle level as most of the major requirements begin to be covered in 300 level courses. This level seems appropriate for gauging if students are achieving the “mid-level” competencies in the program. Forty-seven percent of the programs assessed student learning at the exit point in their courses. The new General Education Program (GEP) requirement for a Capstone Experience in the Major will be a natural place for gauging student learning and many departments commented that their future assessment plans include collecting data from both their Communication in the Major and Capstone courses.
The aggregated data show that 16% of the programs have already implemented assessment across all course levels. The Assessment Subcommittee intends to use the findings from the HLC Interim Assessment Reports for future professional development workshops to provide concrete tools and examples on how to embed assessment across all course levels in an effective and efficient manner.
It is noteworthy that 22% of the programs took immediate action based on the assessment results before their HLC Interim Assessment Report was even submitted to the Assessment Subcommittee. For instance, the Department of World Languages and Literatures noticed that the assessment results for written communication from the first assignment did not meet the desired expectations for writing mechanics and syntax. The program immediately added extra modeling of writing mechanics and syntax into course instruction and the second round of assessment in the same course reflected positive changes in student performance. As the faculty discussed the assessment results, they agreed that “it would be useful to show students how to edit their writing as part of a classroom activity in order to help students along in this process” (p. 3, Department of World Languages and Literatures HLC Interim Assessment Report). Eighty-one percent of the programs have charted a plan for future action with changes in curriculum, instruction, and assessment, based on their assessment results while 16% plan to continue to carry out existing procedures and monitor for any needed changes based on future assessment findings.
As far as the kinds of changes programs plan to make based on their findings, 66% intend to implement changes in instruction, 22% in curriculum, and 44% in assessment. Common changes in instruction include: requiring more drafts of written work; providing more feedback to students, especially before the final version of the assignment is submitted; and increasing transparency of expectations by sharing the assessment rubrics with students ahead of time. For instance, the School of Health Care Professions (SHCP) included the following comment on the importance of transparency: “Clarifying for students what SHCP program learning outcomes are being met in each course, and how student learning is being measured is necessary for students assuring their own success in meeting or achieving expected performance outcomes” (p. 4, School of Health Care Professions HLC Interim Assessment Report). The intended changes in curriculum include: introducing main concepts earlier in the program; providing more examples (articles, text readings, etc.) for students to review and follow; and involving the local community to help students connect course learning to the world immediately beyond the classroom. The intended changes in assessment include: developing a common rubric across areas or courses; testing the existing rubric through multiple cycles of assessment; assuring inter-rater reliability; and better aligning assessment rubrics with PLOs.
Page 24
D. Data-driven initiatives for future actions Our assessment findings indicate the vital need for sustained assessment efforts throughout the 5-year cycle. As the HLC Focused Visit report indicated, “It is theoretically possible for a department to do little-to-nothing in terms of the assessment of student learning during a five-year period” (p. 17). The Assessment Subcommittee has developed a systematic process in accordance with the suggestions by HLC to rectify this concern by utilizing an abbreviated interim report process with well-defined expectations and by developing feedback rubrics to clearly communicate to departments where they are and are not meeting expectations for assessment of student learning. (Please see the Interim Assessment Report Template, Feedback Rubric and Guidelines in Appendix A12.)
After collecting data across campus in 2012-2014 and reflecting on the findings, we have developed a three-pronged approach to assure continuity of assessment efforts on campus: 1. Sustained Assessment
a. Annual check-in with departments throughout their 5-year cycle (please see the Annual Program Check-In Assessment Form in Appendix A17)
b. Liaisons’ intervention to help provide feedback to the departments
2. Professional development for 2014-2016 academic perioda. Workshops focused on the development and application of assessment rubricsb. Workshops focused on the creation and management of an effective 5-year assessment
planc. Workshops focused on the streamlining of assessment through the use of embedded
assessment and assessment rubrics
3. Assessment Subcommittee effortsa. As noted in the HLC Report, there was concern expressed about the confusion and
miscommunication created: “Because UWSP has multiple groups involved withassessment activities on campus, confusion about reporting information, data collectionand analysis, and ultimate authority may arise. UWSP may want to consider bringing
all groups together on a regular basis so everyone has a clear understanding of theprogress made and what future actions need to be undertaken” (Appendix A2: FocusedVisit Report 2012, p. 18).• Sharing information through a virtual common meeting ground: The Assessment
Subcommittee has been using SharePoint for archiving and sharing internalworking documents related to Program Assessment. Upon acceptance by theappropriate faculty governance committees, the Assessment Subcommittee plans tomake the following reports accessible to the entire campus community (faculty andstaff) after they have been reviewed by the AS and updated (if necessary) by thedepartments.1) List of PLOs2) Assessment Plans and 5-year Timelines3) Full Assessment Reports4) Assessment Subcommittee Annual Report with aggregated data from all
assessment reports submittedb. Policies and Procedures – the Assessment Subcommittee will continue to update and
revise its policies and procedures to support assessment efforts on campus.c. Communication with departments (face-to-face visits, rubric feedback to departments,
follow-up after submission of full reports). The Assessment Subcommittee found thatdirect and timely communication (including specific comments on the strengths andweaknesses of assessment work with suggestions for improvement) has been essentialin moving the campus forward. The Assessment Subcommittee will continue its focuson direct and timely feedback and explore additional ways to improve communicationwith departments.
Page 25
University of Wisconsin-Stevens Point Progress Report
E. Concluding remarks The Assessment Subcommittee is pleased to note that the programs have reported an increased appreciation for assessment of student learning, thanks to many improvements implemented in this area on the UW-Stevens Point campus. We continue to cultivate our culture of assessment and the use of assessment results to guide the decision-making process as illustrated by the submission of direct measure assessment by an overwhelming majority (91 percent) of academic programs on campus in 2013-2014 with an anticipated success rate of 100 percent by the end of the spring semester of 2015. The many similar comments demonstrate that UW-Stevens Point faculty/staff are embracing assessment as a way to understand and enhance student learning: “This has been a very interesting and illuminating process” (Music Department email, 10/15/2014).
We assert that our campus has made substantial progress in the two main areas of concern noted by the HLC focused visit team: the assessment and documentation of student learning in our General Education Program, and the assessment of program-specific learning outcomes. In this Progress Report, we have documented not only how our assessment process has worked, through references to our reports filed, but have concomitantly demonstrated our campus efforts to use these results to inform our teaching and improve student learning.
With respect to our General Education Program, these assessment results are leading us to evaluate and refine our GEP learning outcomes to ensure they are clearly worded and closely matched to the student learning that is valued and expected in each of the GEP categories. Additionally, by evaluating the courses in terms of meeting GEP learning outcomes, our assessment process and results have encouraged instructors and departments to be more thoughtful in requesting that courses be included or excluded from the GEP. The realization that evidence of student learning related to the GEP category learning outcomes must be submitted in a course portfolio has caused faculty to carefully consider whether or not they address, and can produce evidence of student learning related to, the GEP designated learning outcomes.
Regarding program level assessment, our robust interim assessment process required all departments to collect, analyze, and report evidence of student learning related to their program learning outcomes, and explain how the results would be used for future planning and improvement of student learning. Through this process, departments were encouraged to review (and potentially revise) their program learning outcomes, revisit their curriculum maps and five-year assessment plans, and develop a formal process for collecting and analyzing student learning data that will be implemented each year of their five-year plan. Results presented in this report clearly indicate that the interim assessment process provided a model cycle of assessment that departments can continue to follow and, in many cases, led to the development of common assessment criteria and rubrics that departments can utilize across courses in their programs. The progress made in program assessment through our interim assessment process helps to ensure that departments will continue to thoughtfully and consistently evaluate their students’ achievement of program learning outcomes and reflect upon ways to improve teaching and learning in their courses.
Looking ahead, where our campus had an admittedly uneven and mixed history of assessing student learning, we now have a rigorous process that delivers direct measurements of student learning related to both our GEP and all academic programs offered on campus. We will continue to examine and revise student learning outcomes, develop and refine GEP and program assessment rubrics, use Faculty Learning Communities to evaluate GEP course portfolios, and employ the Assessment Subcommittee to review and monitor program assessment. Consequently, we strive to close the loop by incorporating the results of our assessment activities to change and refine our teaching to foster meaningful, and documented, student learning.
IV. Conclusion and Looking Ahead
Measuring the Learning:Assessment of General Education and Program
Learning Outcomes at the University of Wisconsin-Stevens Point