Embed Size (px)
Citation preview

Journal of Construction in Developing Countries, Vol. 15(2), 87–116, 2010
PENERBIT UNIVERSITI SAINS MALAYSIAI87
Measuring the Maturity of Guyana’s Construction Industry Using the
Construction Industry Macro Maturity Model (CIM3)
*Christopher J. Willis1 and Jeff H. Rankin2
Abstract: The newly developed Construction Industry Macro Maturity Model (CIM3) was used to measure the maturity of Guyana‘s construction industry. The
CIM3‘s assessment provides a leading indication of performance by relating the maturity of a set of management and operation key practices in the
construction industry to the achievement of various performance objectives that lead to the realisation of the construction industry‘s performance goals. The
implementation of the CIM3 in Guyana relied upon the use of an expert group of construction industry professionals who were elicited to provide the input
information for the model. It was found that Guyana‘s construction industry is least mature with respect to health and safety management and most mature
with respect to cost management. Overall, Guyana‘s construction industry is immature, and a translation of its maturity to represent the level of realisation of
its combined performance goals indicates that its lagging or after-the-fact performance indicators are likely to be poor.
Keywords: CIM3, Construction Industry, Guyana, Maturity, Performance
INTRODUCTION
In an effort to provide a better approach to the
measurement, comparison and interpretation of the
performance of a country‘s construction industry,
researchers at the University of New Brunswick developed
an innovative performance measurement framework that
1Construction Engineering and Management, Department of Civil
Engineering, University of New Brunswick, CANADA. 2M. Patrick Gillin Chair
Construction Engineering and Management, Department of Civil
Engineering, University of New Brunswick, CANADA.
*Corresponding author: [email protected]/[email protected]
utilises maturity modelling and a set of project
performance benchmarking (Willis and Rankin, 2008). The
maturity model developed as part of this framework is
referred to as the Construction Industry Macro Maturity
Model (CIM3), and is based on an adaptation of the
concept of process maturity. While maturity modelling has
been extensively applied in the software manufacturing
industry, most notably as the Capability Maturity Model
(CMM) and in the area of project management as the
Organisational Project Management Maturity Model
(OPM3), the Portfolio, Program and Project Management

Christopher J. Willis and Jeff H. Rankin
88/PENERBIT UNIVERSITI SAINS MALAYSIA
Maturity Model (P3M3) and the PRINCE2 Maturity Model, its
use within the construction industry is still in its infancy.
A recent paper by Willis and Rankin (2009) reported
on the development and theoretical underpinnings of the
CIM3. This paper reports the implementation of the CIM3 in
Guyana, a developing country, as part of a larger study to
measure the performance of its construction industry and
to prove that there is a relationship between the maturity
and performance of a country‘s construction industry. To
prove this, the CIM3 is implemented in both a developing
country (Guyana) and a developed country (Canada).
The objectives of this paper are as follows: (1) to provide a
brief background on Guyana and its construction industry,
(2) to provide a brief overview of the CIM3, (3) to briefly
highlight aspects of the implementation of the CIM3 in
Guyana and (4) to present and discuss the resulting
maturity assessment provided by the CIM3. This paper is
expected to be of interest to construction industry policy
makers, researchers and practitioners because it will
provide these groups with an understanding of the level of
advancement of Guyana‘s construction industry in terms of
its management and operation key practices. These
groups will be provided with an alternative perspective of
measuring and interpreting the performance of the
construction industry through the use of leading measures
as opposed to lagging measures. The maturity framework
and method of assessment used in this study will be
applicable to both developing and developed countries.
In fact, the CIM3 has recently been applied in Canada,
and the results will be presented in a subsequent paper.
BACKGROUND – GUYANA’S CONSTRUCTION INDUSTRY
Guyana is an independent nation located on the northern
coast of South America. It is the only English-speaking
country in South America and has a land mass of
approximately 216,000 km2 and a population of
approximately 770,000 (CIA World Fact Book, 2009). The
World Bank classifies Guyana as a developing country or,
more accurately, a heavily indebted poor nation (World
Bank, 2007). The importance of Guyana‘s construction
industry is emphasised in the country‘s National
Development Strategy (NDS), which places emphasis on
the construction of physical infrastructure as a means of
aiding the resettlement of the country‘s population from
the coast to the interior (National Development Strategy,
2000a). In addition, the construction industry is charged
with providing the necessary infrastructure that will allow for
the production of food and enhance the extraction and
processing of the country‘s vast natural resources. In
addition, the construction industry is tasked with providing
and maintaining a land-based trade route with Brazil,
which is expected to greatly benefit the economy
(National Development Strategy, 2000b). The importance

Measuring the Maturity of Guyana’s Construction Industry
PENERBIT UNIVERSITI SAINS MALAYSIAI89
of Guyana‘s construction industry is also highlighted in the
World Bank (2007) country report, which mentions the need
for Guyana to improve and expand its insufficient physical
infrastructure in the areas of water distribution, health care,
education and housing to improve the standard of living of
its citizens.
At present, Guyana‘s construction industry seems to
be performing poorly and for this reason, it has often been
the subject of debate in articles from Guyana‘s print
media, such as the Stabroek News (2007a, 2007b, 2007c
and 2009) and the Guyana Chronicle (2009). In addition,
the perceived poor performance of Guyana‘s construction
industry has often been highlighted through sporadic
subjective criticisms by local industry observer groups, such
as the Guyana Association of Professional Engineers
(GAPE) and by small numbers of graduate research theses,
such as that by Willis (2006) and a lone journal publication
(Willis and Lewis, 2009). To date, there have been no
recognised studies focusing specifically on the
performance of Guyana‘s construction industry. To this
end, a formal study to measure the maturity of Guyana‘s
construction industry is necessary.
BACKGROUND – CONCEPT OF MATURITY MODELLING
Maturity modelling, more specifically, process maturity
modelling, has its genesis in the software manufacturing
industry (Finnemore et al., 2000) and is based on an
adaptation of Deming‘s concept of process improvement
(plan–do–check–act) and on Philip Crosby‘s quality
management maturity grid, which ―describes five
evolutionary stages in adopting quality practices‖ (Crosby,
1979). The underlying premise of process maturity
modelling is that the quality of a product is directly related
to the quality of the process used to develop that product
(Paulk et al., 1995). Process maturity modelling is based on
the assumption that to sustainably improve a process,
there is an evolutionary path or set of thresholds through
which the process must transition. This evolutionary path is
referred to as the process maturity framework and consists
of various stages of progression, which, when adhered to,
increases the effectiveness of a process in achieving its
objectives. Researchers at the Software Engineering
Institute at Carnegie Mellon University used this concept in
the development of the Capability Maturity Model or CMM
(Paulk et al., 1995). The CMM, which is based directly on
the original framework and the concept of process
maturity, best highlights the thresholds of maturity through
which a process must transition to be sustainably improved.
These five thresholds of maturity are shown in Figure 1 and
are collectively referred to as the five levels of process

Christopher J. Willis and Jeff H. Rankin
90/PENERBIT UNIVERSITI SAINS MALAYSIA
maturity (Paulk et al., 1995). Initially, a process is chaotic or
ad-hoc and must be made repeatable; then, it must be
defined or standardised. The process must then be
managed (i.e., measured and controlled). Ultimately, the
process must be optimised, this is, it must be continuously
improved via feedback and through the use of innovative
ideas and technologies.
Continuously
improving
process
Predictable
process
Standard,
consistent
process
Disciplined
process
Initial
1
Repeatable
2
Defined
3
Managed
4
Optimizing
5
Figure 1. The five levels of process maturity Source: Paulk et al., (1995).
The utility gained from process maturity modelling has
been investigated by various researchers. In the field of
software development, it was found that improved process
maturity had the net effect of reducing the overall
software development cycle as well as reducing the
development effort (Harter et al., 2000), whereas in the
field of project management, Ibbs and Kwak (2000) found
that higher levels of project management maturity resulted
in improved project performance.
The above concept of process maturity has since
been applied in the construction industry in the form of
micro- or organisational level maturity models, such as the
Standardised Process Improvement for Construction
Enterprises (SPICE) (Sarshar et al., 1999; Amaratunga et al.,
2002) and the Construction Supply Chain Maturity Model
(CSCMM) (Vaidyanathan and Howel, 2007). In the area of
project management, the process maturity concept has
been applied in a myriad of project management maturity
models, of which the Organisational Project Management
Maturity Model (OPM3) (PMI, 2005) is one of the most
notable. At the macro-level of the construction industry,
the concept of process maturity has yet to be applied.
Currently, only one such model exists and is referred to as
the Fuzzy Industry Maturity Grid (FIMG) (Tay and Low,1994).

Measuring the Maturity of Guyana’s Construction Industry
PENERBIT UNIVERSITI SAINS MALAYSIAI91
OVERVIEW OF THE CIM3
The CIM3 is based on an adaptation of the concept of
process improvement exemplified in the process maturity
framework first developed and used by Watts Humphrey in
the CMM. The goals of the CIM3 are as follows: model the
maturity of the construction industry at the macro level to
provide leading indicators of project performance, provide
a context in which to interpret project performance,
enable comparisons between various countries and
regions and provide guidance with respect to construction
industry performance improvement initiatives. Based on the
above goals, the CIM3 views the construction industry as
being structured as shown in Figure 2, where the
construction industry is viewed as being composed of Key
Practice Areas (KPAs), which contain key practices. Simply
put, a key practice is an approach or way in which the
construction industry seeks to achieve a specific objective.
It is a description of an activity or set of activities,
regulations and infrastructure that are relied upon to
achieve various objectives. Each key practice is assessed
to determine the industry‘s capability with respect to that
key practice and the capability is transformed into a level
of maturity. There are three possible levels of maturity
associated with each key practice and the determination
of each level of maturity is based on the presence of
specific outcomes and/or indicators. The
outcomes/indicators are the tangible or intangible results
of the industry‘s current capability concerning a key
practice.
Construction Industry
Key Practice Areas
Key Practices
3 Maturity Levels
Outcomes /
Indicators
Is comprised of
Contain
Are determined to be
at one of
Based on the presence of
Figure 2. General structure of the CIM3
Source: Willis and Rankin, (2009).
Each KPA has a performance goal and the key
practices within a KPA collectively reflect the way in which
the construction industry seeks to achieve the
performance goal of the KPA. Figure 3 shows the
underlying logic of the CIM3 concerning a key practice

Christopher J. Willis and Jeff H. Rankin
92/PENERBIT UNIVERSITI SAINS MALAYSIA
and the performance of the construction industry. The
maturity of the construction industry with respect to its key
practices informs us of how effective and efficient the
construction industry is in achieving specific objectives,
which, in turn, influence the realisation of the construction
industry‘s overall performance goals.
Figure 3. Underlying logic of a key practice and the performance
of the construction industry
Source: Willis and Rankin, (2009).
It is important to note that, at the macro level, the
maturity assessment focuses on the capability of the
construction industry with respect to its key practices, i.e.,
the capacity or ability of the construction industry to
extensively use and consistently implement a key practice
and to improve the effectiveness of the key practice. In
contrast, at the micro level, an assessment of maturity is
likely to focus on the consistency with which key processes
are implemented as is reflected in micro-level maturity
models, such as SPICE, CSCMM and OPM3. This is a subtle
yet noteworthy departure from the original concept of
process maturity, with the underlying reason being that the
characteristics of the construction industry, i.e., the
uniqueness of construction products as well as the
dynamic and unique circumstances under which
construction projects are executed, do not make assessing
processes at the macro level feasible. This is because most
processes will be inconsistent between different
construction organisations and between different types of
construction projects. At the macro level, it is more feasible
to analyse the construction industry according to key
practices because these are supposed to be inherent in all
construction organisations and on all types of construction
projects, although the sequence of their concomitant
activities, regulations, infrastructure and sub-processes will
be different between organisations and various types of
projects.
The three levels of maturity of the CIM3 are shown in
Figure 4, in which each level is assigned a numeric score
referred to as the capability score. The ‗immature‘ level is
assigned a capability score of 1/3, the ‗transitional mature‘
level is assigned a capability score of 2/3 and the ‗mature‘
level is assigned a capability score of 1. The capability
score demonstrates the construction industry‘s current
capability in implementing a key practice and informs us of
the location of the key practice within the maturity
framework. It provides an indication of the potential for the
construction industry to grow or improve its capacity with
respect to the use of the key practice. The score of 1/3
indicates that the construction industry is at 1/3 of its full

Measuring the Maturity of Guyana’s Construction Industry
PENERBIT UNIVERSITI SAINS MALAYSIAI93
capacity with respect to the use of a ‗key practice‘, 2/3
indicates that the construction industry is at 2/3 of its full
capacity with respect to its use of a key practice and 3/3
indicates that the construction industry is at its full capacity
or growth with respect to its use of a key practice.
Use of a key practice
is ad-hoc
Use of a key practice
is standard
Use of a key practice
is proactively managedMature (1)
Transitional
Mature (2/3)
Immature (1/3)
Figure 4. The three levels of maturity used in the CIM3
Source: Willis, (2010).
IMPLEMENTATION OF THE CIM3 IN GUYANA
In assessing the maturity of Guyana‘s construction industry,
the CIM3 was implemented using input collected by
surveying a group of experts. The size and characteristics of
the group of experts that was consulted was of the utmost
importance as it directly affected the reliability and
accuracy of the resulting maturity assessment. Table 1 is a
summary of the main attributes of the members of the
Guyana construction industry expert group. The expert
group consisted of eight local civil engineers with
experience ranging from 7 to 28 years, a cumulative tenure
of 102 years and an average experience of 12.75 years.
The employment positions of the members of the expert
group included project coordinators, project managers,
project engineers and a director. The sectors of current
employment of the eight local experts within the
construction industry included consultancies, contracting
firms and client organisations. This combination of experts
was critical because it influenced the type of knowledge
and experience that was elicited from the group and
ensured that biases were cancelled out when the eight
experts were ultimately considered as a single unit.

Christopher J. Willis and Jeff H. Rankin
94/PENERBIT UNIVERSITI SAINS MALAYSIA
Table 1. Summary of the traits of the members of the expert group
Expert
#
Level of
Education
Experience
(Years)
Employment
Position
Sector of
Employment
1 B.Eng. 16 Project
Manager
Contracting
2 Post
Grad.
Diploma
7 Project
Engineer
Consultancy
3 B.Eng. 7 Project
Engineer
Consultancy
4 M.Sc. 20 Project
Manager
Consultancy
5 B.Eng. 9 Project
Engineer
Consultancy
6 M.Sc. 28 Project
Coordinator
Client
Organisation
(Public)
7 B.Eng. 8 Director Contracting
8 M.Sc. 7 Senior
Engineer
Client
Organisation
(Public)
Source: Willis, (2010).
It is important to note that the pool from which the
eight experts were selected from was very small due to
Guyana‘s high rate of migration of skilled professionals
(International Monetary Fund, 1999), especially civil
engineers who are leaving to work in various Caribbean
territories. In fact, there are no more than 20 engineers
registered with the Guyana Association of Professional
Engineers (GAPE, 2008). Initially, contact was made with 12
experts, of which eight agreed to participate in the study.
Figure 5 depicts the general implementation
framework utilised by the CIM3 in Guyana. The framework
consisted of two parts. The first part sought to establish
weights of importance of the key practices (i.e., at level
three of the maturity hierarchy) and of KPAs (i.e., at level
two of the maturity hierarchy). The second part of the
framework sought to establish the construction industry‘s
capabilities with respect to each of its key practices. The
implementation of the first part commenced with each
member of the expert group carrying out AHP pair-wise
comparisons of the key practices and KPAs and
concluded with the aggregation of the resulting AHP pair-
wise judgments to produce a single set of weights of
importance for each of the key practices and KPAs. The
implementation of the second part commenced with
administering a questionnaire survey to each member of
the expert group, which was followed by aggregating the
questionnaire responses to determine the consensus of the
expert group. It is important to note that the questionnaire
survey was administered in an interview session after the
experts were finished with the AHP pair-wise comparisons.
As an example, a copy of the quality management
questionnaire survey is provided in Appendix 1. The second
part concluded with a random verification of the
questionnaire responses. Collectively, both parts of the
implementation framework led to the development of
numeric scores of maturity, which were used as leading
indicators of performance and provided a context in

Measuring the Maturity of Guyana’s Construction Industry
PENERBIT UNIVERSITI SAINS MALAYSIAI95
which to interpret and compare the construction industry‘s
performance.
Calculate Maturity Scores, Maturity Comparison,
Performance Interpretation and Comparison
Carry out AHP pairwise comparisons with each
expert
Aggregate AHP pairwise comparisons
by KPA
Administer questionnaire survey to each expert
Aggregate and analyze questionnaire responses
Carry out random questionnaire response
verification
Establish weights of importance of ‘key
practices’ & KPAs (level 2)
Establish construction industry’s capabilities wrt
‘key practices’
1A
2A
1B
2B
3B
Figure 5. General implementation framework of the CIM3 in
Guyana
Source: Willis, (2010).
In assessing the maturity of Guyana‘s construction
industry, the KPAs and key practices that were focused on
included cost management, quality management, health
and safety management and human resource
management. These KPAs, along with their key practices,
are listed in Appendix 2, which provides brief descriptions
of the management objectives and performance goals of
each key practice. After the weights of importance and
capabilities of the construction industry in implementing
the key practices were determined using the procedure
described above, numeric scores of maturity were
calculated as a means of transforming the subjective
concept of maturity into a set of objective measures that
could be compared and interpreted as forward-looking
indicators of performance.
NUMERIC SCORES OF MATURITY
Maturity scores were derived at three hierarchical levels, as
shown in Figure 6. At level 3, a maturity score for each key
practice is calculated; whereas at level 2, a maturity score
for each KPA is calculated. Ultimately, at level 1, a single
maturity score is calculated for the entire construction
industry.

Christopher J. Willis and Jeff H. Rankin
96/PENERBIT UNIVERSITI SAINS MALAYSIA
Level 1
Level 2
Level 3
Construction Industry
Key Practice Area
A
Key Practice
A1
Key Practice
A2
Key Practice
A(n)
Key Practice Area
B
Key Practice
B1
Key Practice
B2
Key Practice
B(n)
Figure 6. Hierarchical structure of the CIM3 showing the three
levels of maturity scores
Source: Willis, (2010).
The calculation of the maturity scores at each of the
three hierarchical levels utilised the outputs of the two parts
associated with implementing the CIM3, i.e., the weights of
importance and the capabilities of the construction
industry represented as capability scores. The calculation
of the maturity scores is summarised in the following
expressions:
At level one: MSConstruction Industry = Σ MSKPA
Eq.1
At level two: MSKPA = Σ (MSKey Practice) X AHPKPA
Eq. 2
At level three: MSKey Practice = CSKey Practice X AHPKey Practice
Eq. 3
where:
MSKPA is the maturity score of a KPA,
MSKey Practice is the maturity score of a key practice,
MSConstruction Industry is the total maturity score of the
construction industry,
AHPKPA is the weight of importance of a KPA derived
via the analytic hierarchy process,
AHPKey Practice is the weight of importance of a key
practice to the performance goal of its KPA derived
via the analytic hierarchy process and
CSKey Practice is the capability score of a key practice.
RESULTS – MATURITY AT LEVEL 3
The maturity of Guyana‘s construction industry at level 3 of
the CIM3‘s maturity framework is based on the relative
importance of a key practice to the performance goal of
its KPA determined using AHP pair-wise comparisons and

Measuring the Maturity of Guyana’s Construction Industry
PENERBIT UNIVERSITI SAINS MALAYSIAI97
the capabilities of the industry in implementing the key
practices. The numeric values of maturity of the key
practices are shown by bar charts in Figures 7 to 10, where
the shaded portion of each bar represents the calculated
maturity scores of a key practice and the un-shaded
portion represents the possible potential growth of a key
practice. The entire length of a bar is an indication of the
maximum possible level of influence of a key practice on
the performance goal of its KPA. The maturity scores inform
us of two things. First, when compared with each other, the
magnitude of the maturity scores (shaded portion of each
bar) informs us of the existing levels of influence of the key
practices on the performance goal of the KPA. Second,
the maturity scores of each key practice, when compared
to its maximum possible potential growth, inform us of the
extent to which the objectives associated with each of the
key practices are being achieved.
Figure 7 compares the maturity scores of the cost
management key practices and shows that the key
practices CM1, CM3 and CM4 have achieved full maturity
and therefore have zero potential growth. On the other
hand, the key practices CM2, CM8 and CM9 are currently
immature and therefore have the greatest potential
growth. The key practices CM5, CM6 and CM7 are
currently in a transitional state of maturity and therefore
also have some potential for further growth. In terms of the
realisation of the objectives of the key practices, the
objectives associated with CM1, CM3 and CM4 have been
fully realised, whereas the objectives associated with CM2,
CM5, CM6, CM7, CM8 and CM9 have only been partially
realised. The level of influence of the key practices on the
construction industry‘s cost performance goal is lowest for
CM3 and greatest for CM7.
Figure 7. Comparison of the maturity scores and growth potential
of cost management key practices
Source: Willis, (2010).
Christopher J. Willis and Jeff H. Rankin
98/PENERBIT UNIVERSITI SAINS MALAYSIA
When considered as leading indicators of cost
performance, it appears that the key practices CM7, CM9,
CM5 and CM8 are the most significant, whereas CM4, CM3
and CM2 are the least significant. Interventions aimed at
improving the construction industry‘s cost performance
should, therefore, first focus on improving the maturity of
the four former key practices because these are likely to
bring about more noticeable changes in the industry‘s cost
performance.
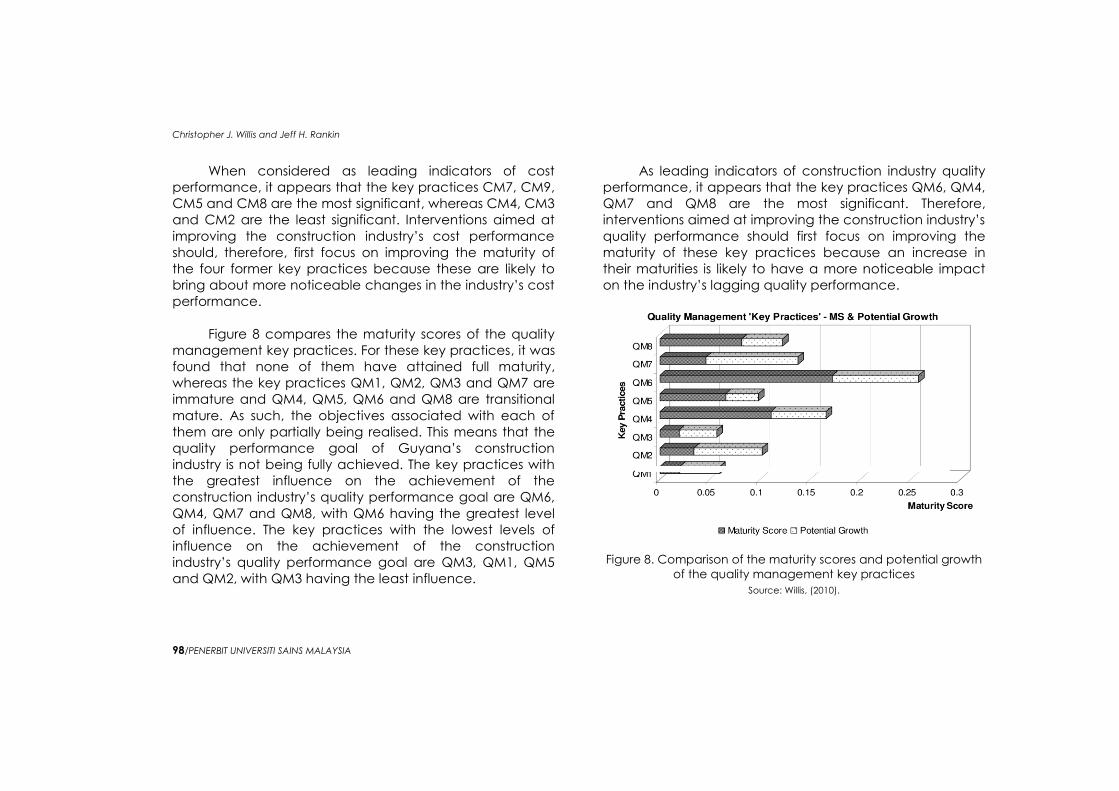
Figure 8 compares the maturity scores of the quality
management key practices. For these key practices, it was
found that none of them have attained full maturity,
whereas the key practices QM1, QM2, QM3 and QM7 are
immature and QM4, QM5, QM6 and QM8 are transitional
mature. As such, the objectives associated with each of
them are only partially being realised. This means that the
quality performance goal of Guyana‘s construction
industry is not being fully achieved. The key practices with
the greatest influence on the achievement of the
construction industry‘s quality performance goal are QM6,
QM4, QM7 and QM8, with QM6 having the greatest level
of influence. The key practices with the lowest levels of
influence on the achievement of the construction
industry‘s quality performance goal are QM3, QM1, QM5
and QM2, with QM3 having the least influence.
As leading indicators of construction industry quality
performance, it appears that the key practices QM6, QM4,
QM7 and QM8 are the most significant. Therefore,
interventions aimed at improving the construction industry‘s
quality performance should first focus on improving the
maturity of these key practices because an increase in
their maturities is likely to have a more noticeable impact
on the industry‘s lagging quality performance.
Figure 8. Comparison of the maturity scores and potential growth
of the quality management key practices
Source: Willis, (2010).
Measuring the Maturity of Guyana’s Construction Industry
PENERBIT UNIVERSITI SAINS MALAYSIAI99
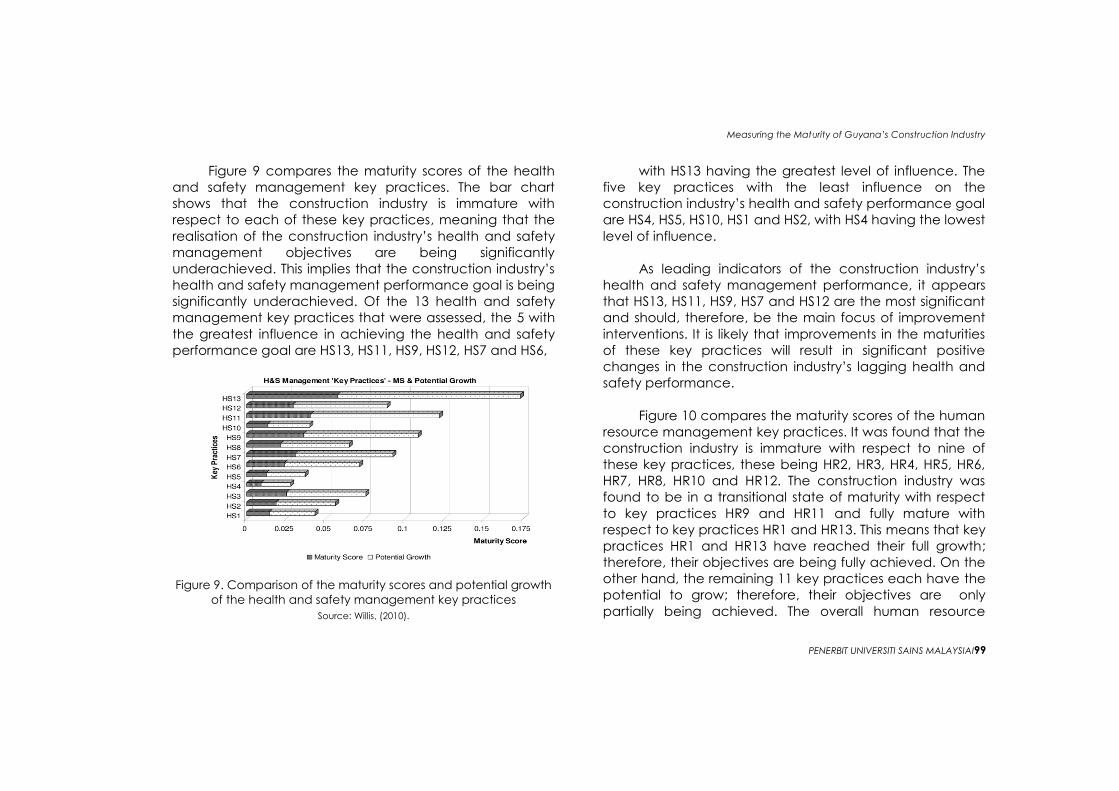
Figure 9 compares the maturity scores of the health
and safety management key practices. The bar chart
shows that the construction industry is immature with
respect to each of these key practices, meaning that the
realisation of the construction industry‘s health and safety
management objectives are being significantly
underachieved. This implies that the construction industry‘s
health and safety management performance goal is being
significantly underachieved. Of the 13 health and safety
management key practices that were assessed, the 5 with
the greatest influence in achieving the health and safety
performance goal are HS13, HS11, HS9, HS12, HS7 and HS6,
Figure 9. Comparison of the maturity scores and potential growth
of the health and safety management key practices
Source: Willis, (2010).
with HS13 having the greatest level of influence. The
five key practices with the least influence on the
construction industry‘s health and safety performance goal
are HS4, HS5, HS10, HS1 and HS2, with HS4 having the lowest
level of influence.
As leading indicators of the construction industry‘s
health and safety management performance, it appears
that HS13, HS11, HS9, HS7 and HS12 are the most significant
and should, therefore, be the main focus of improvement
interventions. It is likely that improvements in the maturities
of these key practices will result in significant positive
changes in the construction industry‘s lagging health and
safety performance.
Figure 10 compares the maturity scores of the human
resource management key practices. It was found that the
construction industry is immature with respect to nine of
these key practices, these being HR2, HR3, HR4, HR5, HR6,
HR7, HR8, HR10 and HR12. The construction industry was
found to be in a transitional state of maturity with respect
to key practices HR9 and HR11 and fully mature with
respect to key practices HR1 and HR13. This means that key
practices HR1 and HR13 have reached their full growth;
therefore, their objectives are being fully achieved. On the
other hand, the remaining 11 key practices each have the
potential to grow; therefore, their objectives are only
partially being achieved. The overall human resource
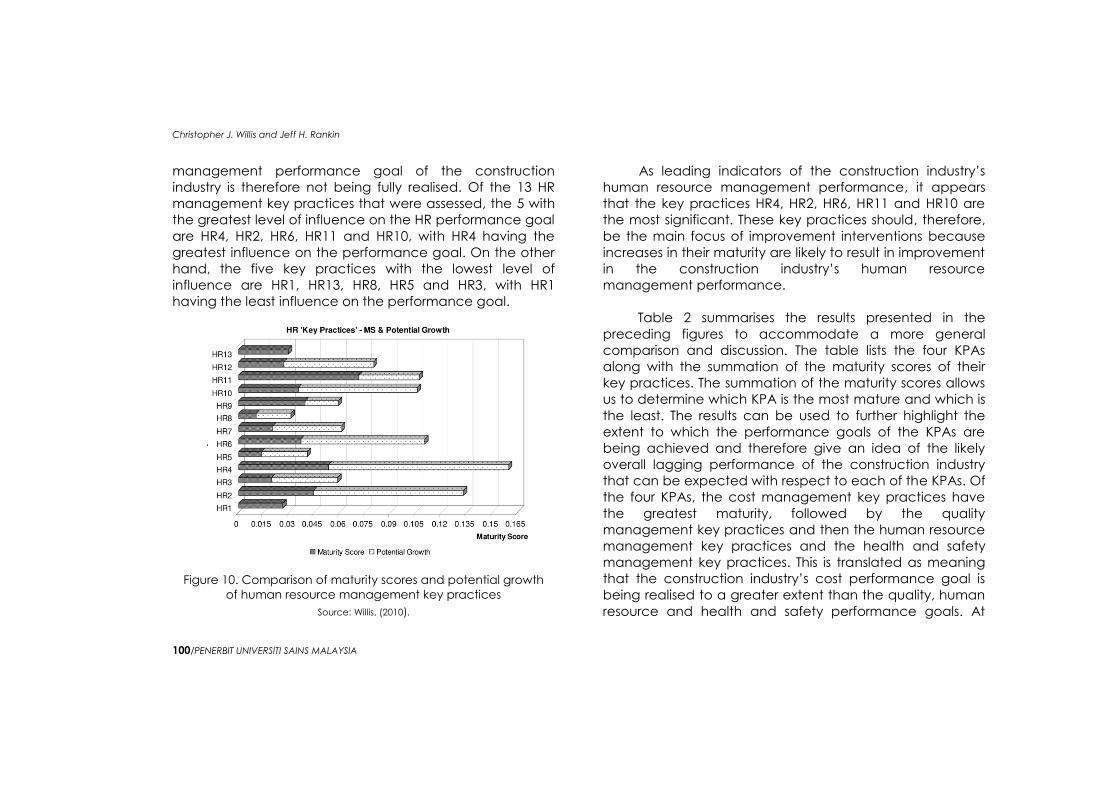
Christopher J. Willis and Jeff H. Rankin
100/PENERBIT UNIVERSITI SAINS MALAYSIA
management performance goal of the construction
industry is therefore not being fully realised. Of the 13 HR
management key practices that were assessed, the 5 with
the greatest level of influence on the HR performance goal
are HR4, HR2, HR6, HR11 and HR10, with HR4 having the
greatest influence on the performance goal. On the other
hand, the five key practices with the lowest level of
influence are HR1, HR13, HR8, HR5 and HR3, with HR1
having the least influence on the performance goal.
Figure 10. Comparison of maturity scores and potential growth
of human resource management key practices
Source: Willis, (2010).
As leading indicators of the construction industry‘s
human resource management performance, it appears
that the key practices HR4, HR2, HR6, HR11 and HR10 are
the most significant. These key practices should, therefore,
be the main focus of improvement interventions because
increases in their maturity are likely to result in improvement
in the construction industry‘s human resource
management performance.
Table 2 summarises the results presented in the
preceding figures to accommodate a more general
comparison and discussion. The table lists the four KPAs
along with the summation of the maturity scores of their
key practices. The summation of the maturity scores allows
us to determine which KPA is the most mature and which is
the least. The results can be used to further highlight the
extent to which the performance goals of the KPAs are
being achieved and therefore give an idea of the likely
overall lagging performance of the construction industry
that can be expected with respect to each of the KPAs. Of
the four KPAs, the cost management key practices have
the greatest maturity, followed by the quality
management key practices and then the human resource
management key practices and the health and safety
management key practices. This is translated as meaning
that the construction industry‘s cost performance goal is
being realised to a greater extent than the quality, human
resource and health and safety performance goals. At

Measuring the Maturity of Guyana’s Construction Industry
PENERBIT UNIVERSITI SAINS MALAYSIAI101
present, the construction industry‘s health and safety
management performance goal is the least realised.
Table 2. Values of the ∑ (MS Key Practice)
KPA Σ (MS Key Practice)
Cost 0.5857
Quality 0.5481
HR 0.4256
H&S 0.3333
Source: Willis, (2010).
RESULTS – MATURITY AT LEVEL TWO
Table 3 presents the maturity scores of Guyana‘s
construction industry at level two (i.e., MS KPA). In addition,
the table shows the maximum possible maturity score for
each of the KPAs and their potential growth represented
as a percentage. The MS KPA indicates the level of
contribution of a KPA to the overall maturity of the
construction industry. For Guyana‘s construction industry,
the quality management KPA has the greatest contribution
to the overall maturity of the construction industry with a
score of 0.2384, followed by the cost management KPA
(0.2201) and then the human resource management KPA
(0.0433) and lastly the health and safety management KPA
(0.0343). This implies that based on the perception of those
within Guyana‘s construction industry, the current overall or
general performance of Guyana‘s construction industry is
affected to a greater extent by the maturity of its quality
management and cost management key practices and to
a lesser extent by the maturity of its human resource
management and health and safety management key
practices. In terms of the potential growth of the maturity
of each of the four KPAs, the health and safety
management KPA has the greatest potential growth at
66.73%, followed by the human resource management
KPA (55.36%), then by the quality management KPA
(45.23%) and, finally, the cost management KPA (39.63%).
These scores further reinforce the hypothesis that the
operation of Guyana‘s construction industry is likely to be
most advanced in cost management and least advanced
in health and safety management.

Christopher J. Willis and Jeff H. Rankin
102/PENERBIT UNIVERSITI SAINS MALAYSIA
Table 3. MS KPA for Guyana‘s construction industry
KPAs MS KPA :
∑ (MS Key
Practice) X
AHP KPA
Maximum
Possible
MS KPA
Potential
Growth
Cost Management 0.2201 0.3646 39.63%
Quality Management 0.2384 0.4353 45.23%
Human Resource
Management
0.0433 0.0970 55.36%
Health and Safety
Management
0.0343 0.1031 66.73%
Source: Willis, (2010).
Based on the above discussion, any attempt to
improve the overall performance of Guyana‘s construction
industry should first focus on improving the maturity of its
cost management and quality management key
practices. Although these two KPAs are currently more
advanced in maturity in comparison to the human
resource management and health and safety
management KPAs, as reflected in their potential growth,
their maximum possible contribution to the overall maturity
of the construction industry and thus its performance, is far
greater than the combined contribution of the human
resource management and health and safety
management KPAs. While improving the maturity of the
human resource management and health and safety
management KPAs will improve the overall performance of
the construction industry, the improvement in performance
is likely to be perceived by those within the construction
industry as being inadequate and ineffective within a
larger context.
RESULTS – MATURITY SCORES AT LEVEL ONE
The level one maturity score (i.e., MSConstruction Industry) is a
single maturity score representing the overall maturity
of the construction industry. The MS Construction Industry of
Guyana‘s construction industry is calculated as being
0.5361, or 53.61%. This means that Guyana‘s construction
industry is currently 53.61% mature and therefore has an
overall growth potential of 46.39%. In general, Guyana‘s
construction industry is currently immature and its
propinquity in terms of entering the transitional maturity
level is still far off. This immaturity is shown in Figure 11, which
highlights the relationship between the current maturity of
Guyana‘s construction industry and the realisation of its
combined performance goals. At present, the realisation
of the combined performance goals of Guyana‘s
construction industry is being significantly underachieved.
Interpreted as a leading indicator of performance, this
means that the measured lagging performance of
Guyana‘s construction industry is likely to be relatively poor
with significant potential for improvement.

Measuring the Maturity of Guyana’s Construction Industry
PENERBIT UNIVERSITI SAINS MALAYSIAI103
Figure 11. Relationship between the maturity of Guyana's
construction industry and its combined performance goals
Source: Willis, (2010).
The first step towards improvement should be to
improve the maturity of specific KPAs to enable the
construction industry to enter into the transitional phase of
maturity. It appears that the KPAs of cost management
and quality management are best suited for this purpose.
Once this is done, focus can be placed on improving the
maturity of the lesser KPAs of human resource
management and health and safety management, which
will serve to move the construction industry closer to full
maturity and the full realisation of its performance goals. In
essence, this approach seeks to improve cost and quality
performances first, as these are perceived by those within
Guyana‘s construction industry as being the most critical of
the four KPAs. By using this approach, there will be a
greater recognition and acceptance of the improvement
initiatives by those within the construction industry, which
will greatly increase the chances of performance
improvement initiatives being successfully implemented.
CONCLUSION
This paper has discussed aspects of the newly developed
maturity model CIM3 and its implementation in Guyana.
With respect to the maturity of Guyana‘s construction
industry, the CIM3‘s assessment found the following:
(1) Guyana‘s construction industry is currently immature,
with its cost management key practices being more
mature than those of quality management, human
resource management and health and safety
management. Based on this finding, the construction
industry‘s cost management objectives are being
achieved to a greater extent than those of the other key
practices. This has led to the cost management
performance goal having the highest level of realisation
relative to the other performance goals of the construction
industry.
(2) In translating the overall maturity of Guyana‘s
construction industry, it was found that the overall level of
realisation of the combined performance goals of the

Christopher J. Willis and Jeff H. Rankin
104/PENERBIT UNIVERSITI SAINS MALAYSIA
construction industry is significantly low. This translation is
useful because it allows for the interpretation of the
lagging performance measures of the construction
industry. Based on the findings of the CIM3, it is predicted
that the lagging performance measures of Guyana‘s
construction industry will be poor.
(3) The maximum possible maturity scores reveal that
the overall performance of Guyana‘s construction industry
is influenced to a greater extent by its quality management
key practices, followed by its cost management key
practices, then by its health and safety management key
practices and, finally, by its human resource management
key practices. As part of a roadmap to improving the
performance of Guyana‘s construction industry, there may
be a need to convince those within the industry of the
importance of human resource management and its direct
and indirect benefits concerning project and
organisational performance. An assessment of the maturity
of the construction industries of advanced countries, such
as Canada, can be used to change the perceptions of
those within Guyana‘s construction industry.
It is possible for the general maturity framework and
method used in implementing this study to be applied to
other developing countries, as the KPAs and key practices
of the CIM3 are generic and are therefore likely to exist in
most construction industries. Of interest would be the
relative rank of importance of the KPAs and key practices
between different developing countries.
In conclusion, the results of the maturity assessment
provided by the CIM3 appear to be in line with the
mainstream opinion concerning the current operation and
level of advancement of Guyana‘s construction industry.
At this point in time, future work concomitant with the CIM3
includes establishing direct and indirect relationships
between the lagging performance of a country‘s
construction industry and its maturity and linking the CIM3
with micro-level construction maturity models, such as
those addressing construction organisation health and
safety.
REFERENCES
Amaratunga, D., Sarshar, M. and Baldry, D. (2002). Process
improvement in facilities management: The SPICE approach.
Business Process Management Journal, 8(4): 318–337.
CIA World Fact Book. (2009). Country Profile: Guyana. [Online].
Available at: https://www.cia.gov/library/publications/ the-
world-factbook/geos/gy.html [Accessed on 2 June 2009].
Crosby, P.B. (1979). Quality is free: The art of making quality
certain. New York: McGraw-Hill Book Company.

Measuring the Maturity of Guyana’s Construction Industry
PENERBIT UNIVERSITI SAINS MALAYSIAI105
Finnemore, M., Sarshar, M. and Haigh, R. (2000). Case studies in
construction process improvement. Proceedings of the
Arcom Construction Process Workshop, Loughborough
University, Loughborough. February 16, 2000.
GAPE. (2008). Guyana Association of Professional Engineers 40th
Anniversary Newsletter. GAPE, Volume 3(1) April 2008.
Guyana Chronicle. 2009. Newspaper Article: Tough New
Measures for Contractors, Consultants – President warns
Permanent Secretaries can loose Jobs. Located @
http://www.guyanachronicle.com/ARCHIVES/archieve%200
3-04- 09.html#Anchor--39430, accessed on 2009/06/02
Harter, D., Krishnan, M. and Slaughter, S. (2000). Effects of process
maturity on quality, cycle time, and effort in software
product development. Management Science, 46(4): 451–
466.
Ibbs, C. and Kwak, Y. (2000). Assessing project management
maturity. Project Management Journal, 31(1): 32—43.
International Monetary Fund. (1999). How Extensive is the Brain
Drain? [Online]. Available at: http://www.imf.org/external
pubs/ft/fandd/1999/06/carringt.htm [Accessed on 2 June
2009].
National Development Strategy. (2000a). NDS: Overview. [Online].
Available at: http://www.sdnp.org.gy/nds/overview.pdf
[Accessed on 24 May 2007].
. (2000b). NDS: GDP by Activity at Constant Factor Cost.
[Online]. Available at: http://www.sdnp.org.gy/
nds/gdp2.html [Accessed on 24 May 2007].
Paulk, M., Weber, C., Curtis, B. and Mary-Beth, C. (1995). The
capability maturity model: Guidelines for improving the
software process. USA: Addison-Wesley Longman Inc.
PMI, (2005). Organizational project management maturity model:
OPM3 knowledge foundation. Pennsylvania:.Project
Management Institute, Inc, Newtown Square.
Sarshar, M., Hutchinson, A., Aouad, G., Barret, P., Minnikin, J. and
Shelly, C. (1999). Standardized process improvement for
construction enterprises (SPICE): Research methodology and
approach. Challenge of Change: Building and Construction
in the New Millennium, Royal Institution of Chartered
Surveyors (RICS) COBRA Annual Conference, Salford.
September 1–2, 1999.
Stabroek News. (2007a). Newspaper Article: Govt. Awaiting CDB
Approval to Extend Four Lane Highway – Willis says ‗not
really‘ satisfied with work. [Online]. Available at:
http://www.stabroeknews.com/index.pl/article_archive?id=
51512267 [Accessed on 19 May 2007].
. (2007b). Newspaper Article: Construction Industry
Operating in Flagrant Disregard for Building Standards –
Rodrigues. [Online]. Available at:
http://www.stabroeknews.com/index.pl/article_archive?id=
56496000 [Accessed on 24 May 2007].
. (2007c). Newspaper Article: EU Funded Housing Project
Scaled Back Due to High Construction Costs. [Online].
Available at: http://www.stabroeknews.com/ index.pl/
article_ archive?id=56506344 [Accessed on 24 May 2007].
. (2009). Newspaper Article: Contractors, Consultants to be
Held to Rigid Standards – Late penalties to be instituted.
[Online]. Available at: http://www. stabroeknews.com/
2009/news/local/04/04/contractors-consultants-to-be-held-
to-rigid-standards/ [Accessed on 2 June 2009].

Christopher J. Willis and Jeff H. Rankin
106/PENERBIT UNIVERSITI SAINS MALAYSIA
Tay, P. and Low, S. (1994). The fuzzy industry maturity grid (FIMG)
and its application to the Singaporean construction industry.
Construction Management and Economics, 12 (2): 125–238.
Vaidyanathan, K. and Howell, G. (2007). Construction supply
chain maturity model-conceptual framework. Proceedings:
International Group for Lean Construction (IGLC-15) Annual
Conference, Michigan, USA. July 16–22, 2007.
Willis, C.J. (2006). A comparison of highway construction costs
between Guyana and Trinidad as faced by a Trinidadian
Contracting Firm. Master of Science(Eng) Research Project,
University of the West Indies, St. Augustine, Trinidad.
. 2010). Measuring the Performance of the Construction
Industry through the use of Project Performance
Benchmarking Metrics and Maturity Modelling. Doctoral
Thesis. Department of Civil Engineering, University of New
Brunswick, Canada.
Willis, C.J. and Lewis, T.M. (2009). A comparison of highway
construction costs between Guyana and Trinidad as faced
by a Trinidadian Contracting Firm. Journal of Construction
Procurement, 13(1): pp. 13–23
Willis, C.J. and Rankin, J.H. (2008). Measuring the performance of
the construction industry: An innovative performance
measurement framework based on benchmarking and
maturity modeling. Proceedings: CSCE 2008 Annual
Conference, Quebec, QC Canada, 10–13 June 2008.
. (2009). Maturity modeling in construction: introducing the
construction industry macro maturity model (CIM3).
Proceedings: 2nd International / 8th Construction Specialty
Conference, CSCE, St John‘s, New Foundland Canada, 27–
30 May 2009.
World Bank (2007). Guyana Country Brief. [Online]. Available at:
http://web.worldbank.org/WBSITE/EXTERNAL/COUNTRIES/LA
CEXT/GUYANAEXTN/0,,menuPK:328284~pagePK:141132~piPK
:141107~theSitePK:328274,00.html [Accessed on 19 May
2007].

Measuring the Maturity of Guyana’s Construction Industry
PENERBIT UNIVERSITI SAINS MALAYSIAI107
APPENDIX 1: QUALITY MANAGEMENT QUESTIONNAIRE
Industry Practice QM1
There is a national building code, which is referred to in
project design and construction as a means of ensuring
acceptable levels of performance.
Assessment Questions
QM1-A: Is there a national building code, which is referred
to in the design and construction of a majority of projects?
Yes
No
QM1-B: Are there revised versions of the national building
code?
Yes
No
QM1-C: Does the national building code promote the use
of innovative techniques and technological aids?
Yes
No
Industry Practice QM2
Construction organisations utilise Total Quality
Management (TQM) as a means of ensuring and improving
quality.
Assessment Questions
QM2-A: Is TQM utilised by a majority of construction
organisations?
Yes
No
QM2-B: Do a majority of construction organisations utilise
the latest techniques and approaches associated with
TQM?
Yes
No

Christopher J. Willis and Jeff H. Rankin
108/PENERBIT UNIVERSITI SAINS MALAYSIA
Industry Practice QM3
Construction organisations utilise ISO certification as a
means of ensuring and improving quality.
Assessment Questions
QM3-A: Are a majority of construction organisations ISO
certified?
Yes
No
QM3-B: Do a majority of construction organisations utilise
the latest versions of ISO certification?
Yes
No
Industry Practice QM4
Quality specifications are used in construction contracts as
a means of defining the required quality of various aspects
of construction.
Assessment Questions
QM4-A: Are quality specifications for common aspects of
construction consistent for a majority of projects?
Yes
No
QM4-B: For a majority of projects, are there up-to-date
versions of quality specifications that promote the use of
new techniques, materials and technological aids?
Yes
No
QM4-C: Is the effectiveness of quality specifications
improved based on industry feedback and measures of
project performance?
Yes
No

Measuring the Maturity of Guyana’s Construction Industry
PENERBIT UNIVERSITI SAINS MALAYSIAI109
Industry Practice QM5
Weekly and monthly reports are used to report quality
issues during the execution of construction projects.
Assessment Questions
QM5-A: Are weekly and monthly quality reports produced
for a majority of construction projects?
No
Yes
QM5-B: Is the effectiveness of weekly and monthly quality
reports improved through industry feedback?
Yes
No
Industry Practice QM6
Quality inspections are used on construction projects as a
means of verifying and ensuring quality.
Assessment Questions
QM6-A: Are quality inspections done for a majority of
construction projects?
Yes
No
QM6-B: For a majority of projects, do quality inspections
utilise the latest techniques and technological aids?
Yes
No
QM6-C: Is the effectiveness of quality inspections improved
through the use of industry feedback?
Yes
No

Christopher J. Willis and Jeff H. Rankin
110/PENERBIT UNIVERSITI SAINS MALAYSIA
Industry Practice QM7
Quality management plans are used on construction
projects as a means of ensuring quality.
Assessment Questions
QM7-A: Are quality management plans developed and
used for a majority of construction projects?
Yes
No
QM7-B: For a majority of projects, do quality management
plans refer to the use of the latest quality management
techniques and technological aids?
Yes
No
QM7-C: Is the effectiveness of quality management plans
improved via adjustments based on industry feedback?
Yes
No
Industry Practice QM8
Punch list inspections are performed as part of project
closeout to highlight and rectify outstanding quality issues.
Assessment Questions
QM8-A: Are punch list inspections performed at project
close out for a majority of projects?
Yes
No
QM8-B: For a majority of projects, are punch list inspections
done using the latest techniques and technological aids?
Yes
No

Measuring the Maturity of Guyana’s Construction Industry
PENERBIT UNIVERSITI SAINS MALAYSIAI111
APPENDIX 2: LIST OF KEY PRACTICES AND THEIR ASSOCIATED OBJECTIVES AND PERFORMANCE GOALS
Table A: List of cost management key practices and their associated objectives and performance goals
Cost Management Key Practices Objective
CM1: The earnings of construction workers adhere to an
industry-wide salary scale
Control and limit the salaries of project employees1
CM2: Cost indices are used in the development of
construction cost estimates
Develop accurate and reliable construction cost estimates1
CM3: Consultancies charge hourly rates for various
design and supervision services
To be adequately reimbursed for services rendered and to
control and limit the cost of various consultancy services1
CM4: Equipment and labour rates are charged by
contractors for various types of construction work
To be adequately reimbursed for construction services and to
control and limit the cost of various construction services1
CM5: Construction costs are monitored and reported
during the execution of projects
Inform project stakeholders of actual project costs during
project execution1
CM6: Contractors submit progress payment claims
during project execution
Recover project expenditures in a timely manner to pay for
future project activities1
CM7: The client issues intermediate payments to
contractors within a specified timeframe
Compensate the contractor for work completed in a timely
manner to aid in the contractor in having a good cash flow1
CM8: Construction organisations use organisational
performance measures as a means of monitoring and
controlling their business operations
Ensure business operations are within budget and
organisational cash flow is positive1
CM9: Contractors develop formal cash flow schedules
at the commencement of construction projects as a
means of managing project costs
Forecast project expenditure and income so as to determine
the availability of adequate financial resources1
Source: Willis, C.J. (2010)
1 The performance goal of the cost management key practices is ―to deliver construction projects within budget‖.

Christopher J. Willis and Jeff H. Rankin
112/PENERBIT UNIVERSITI SAINS MALAYSIA
Table B: List of quality management key practices and their associated objectives and performance goals
Quality Management Key Practices Objectives
QM1: There is a national building code that is referred to
in project design and construction as a means of
ensuring acceptable levels of performance
Ensure construction projects conform to certain required
minimum standards2
QM2: Construction organisations utilise TQM as a means
of ensuring and improving quality
Ensure there is a desired level of quality in the
construction process and in the construction product2
QM3: Construction organisations utilise ISO certification
as a means of ensuring and improving quality
Ensure there is a desired level of quality in the
construction process and in the construction product2
QM4: Quality specifications are used in construction
contracts as a means of defining the required quality of
various aspects of construction
Provide a comprehensive description of the desired
attributes and quality of the construction process and
the constructed product2
QM5: Weekly and monthly reports are used to report
quality issues during the execution of construction
projects
Inform project stakeholders of quality issues as they arise
during the execution of construction projects2
QM6: Quality inspections are used on construction
projects as a means of verifying and ensuring quality
Verify and ensure that the required levels of quality are
being achieved2
QM7: Quality management plans are used on
construction projects as a means of ensuring quality
Outline to project stakeholders, the approaches that will
be taken to ensure that desired levels of quality will be
achieved2
QM8: Punch list inspections are performed as part of
project closeout to highlight and rectify outstanding
quality issues
Highlight outstanding quality issues that need to be
rectified before final completion2
Source: Willis, C.J. (2010)
2 The performance goal of the quality management key practices is ―to deliver construction projects at the desired quality‖.

Measuring the Maturity of Guyana’s Construction Industry
PENERBIT UNIVERSITI SAINS MALAYSIAI113
Table C: List of HR Management Key Practices and their associated Objectives and Performance Goals
HR Management Key Practices Objectives
HR1 Construction projects have established employment
positions
Formalise the employment of construction industry
workers3
HR2 Skill utilisation is assessed on construction projects so
as to ensure that the correct types of project personnel
are being assigned to various tasks/activities
Make sure that the correct types of project personnel
are being assigned to various tasks/ activities3
HR3 The composition of work crews is planned for
construction projects to ensure an appropriate ratio of
workers to supervision for various project activities
Make sure there is an appropriate ratio of workers to
supervision for various project activities3
HR4 Employees are subjected to various types of skill
assessments and evaluations in advance of the
execution of construction projects
Determine the abilities of workers in advance of the
execution of construction projects3
HR5 The composition of work crews is tracked
throughout the execution of construction projects to
ensure an appropriate ratio of workers to supervision for
various project activities
Verify and monitor the effectiveness with which workers
are being supervised for various project activities3
HR6 Employees are subjected to various types of skill
assessments and evaluations during the execution of
construction projects
Determine the growth or improvement in employees‘
skills during project execution3
HR7 Project personnel receive on the job training on
construction projects
Enhance/improve the skills of project personnel3
HR8 Incentives are used as a means of motivating
project personnel during the execution of construction
projects
Motivate project personnel during project execution3
HR9 There is a communication and information flow
between project personnel during the execution of
construction projects
Ensure the efficient flow of ideas and opinions during
project execution3
(Continued on next page)

Christopher J. Willis and Jeff H. Rankin
114/PENERBIT UNIVERSITI SAINS MALAYSIA
Table C: (continued)
HR Management Key Practices Objectives
HR10 The construction industry has licensing
requirements that are applicable to professionals
seeking to work within the industry
Ensure and validate the education and training of
professionals seeking to work within the industry3
HR11 Construction job vacancies have specific
qualification and experience requirements
Ensure that qualification and experience requirements
for specific jobs are consistent throughout the industry3
HR12 The construction industry has a strategic human
resource plan that is consulted as a means of guiding its
industry level HR related actions and decisions
Effectively guide the construction industry‘s HR related
decisions and actions3
HR13 Positions of employment within construction
organisations and on construction projects have
associated with them specific levels of remuneration
and benefits
Ensure levels of remuneration and benefits are
consistent for employment positions 3
Source: Willis, C.J. (2010)
3 The performance goal of human resource management key practices is ―to ensure the efficient use of the industry‘s human resources‖.

Measuring the Maturity of Guyana’s Construction Industry
PENERBIT UNIVERSITI SAINS MALAYSIAI115
Table D: List of H&S Management Key Practices and their associated Objectives and Performance Goals
H&S Management Key Practices Objectives
HS1: There are national H&S laws and regulations that
are applicable to various types of construction work
Make mandatory, safe construction working conditions
and practices4
HS2: The construction industry has H&S training programs
that are used to train construction workers regarding
safe working practices
Continuously train construction workers in safe working
techniques4
HS3: Construction organisations have a formal H&S
policy that guides their approach to the H&S of their
workers
Clearly state and make known the overall intention and
objectives with respect to health and safety4
HS4: General contractors screen subcontractors for their
H&S programs and choose those with records of good
performance
Increase the likelihood of employing only subcontractors
with good records of safety performance4
HS5: Construction organisations implement drug and
alcohol testing of their employees as part of their H&S
program
Ensure employees can work in a safe manner and are
not a danger to themselves or others4
HS6: H&S management plans are utilised on construction
projects to ensure the H&S of project personnel
Outline to project stakeholders, the approaches that will
be taken to address safety issues during the execution of
construction projects4
HS7: Money is budgeted on construction projects in to
address various H&S issues
Ensure there are financial resources to address H&S
issues during the execution of construction projects4
HS8: Hazard analysis is used to identify hazards on
construction projects
Identify hazards on construction projects to eliminate or
mitigate them during the execution of construction
projects4
(Continued on next page)

Christopher J. Willis and Jeff H. Rankin
116/PENERBIT UNIVERSITI SAINS MALAYSIA
Table D: (continued)
KPAs MS KPA :
Σ (MS Key Practice) X AHP
KPA
Maximum Possible
MS KPA
Potential Growth
Cost Management 0.2201 0.3646 39.63%
Quality Management 0.2384 0.4353 45.23%
Human Resource
Management
0.0433 0.0970 55.36%
Health and Safety
Management
0.0343 0.1031 66.73%
Source: Willis, C.J. (2010)
4 The performance goal of H&S management practices is ―to execute construction projects in a safe manner and reduce the number of accidents‖.
H&S Management Key Practices Objectives
HS9: Construction projects have safety induction
programs
Introduce new project personnel to relevant safety
techniques and practices to be used on the project4
HS10: The performance of contracting firms regarding
H&S is considered when awarding contracts
Increase the likelihood of awarding contracts to only
contracting firms with good H&S performance4
HS11: Construction organisations provide their
employees with safety equipment
Ensure construction workers have the relevant
protective/safety equipment 4
HS12: Toolbox meetings are held regularly during the
execution of construction projects as a means of raising
the H&S awareness of project personnel
Raise the awareness of project personnel regarding
various H&S issues and concerns4
HS13: Construction organisations adhere to a national
construction H&S code of practice as a means of
improving their H&S performance
Have a formal approach to H&S 4