Embed Size (px)
Citation preview
elifesciences.org
TOOLS AND RESOURCES
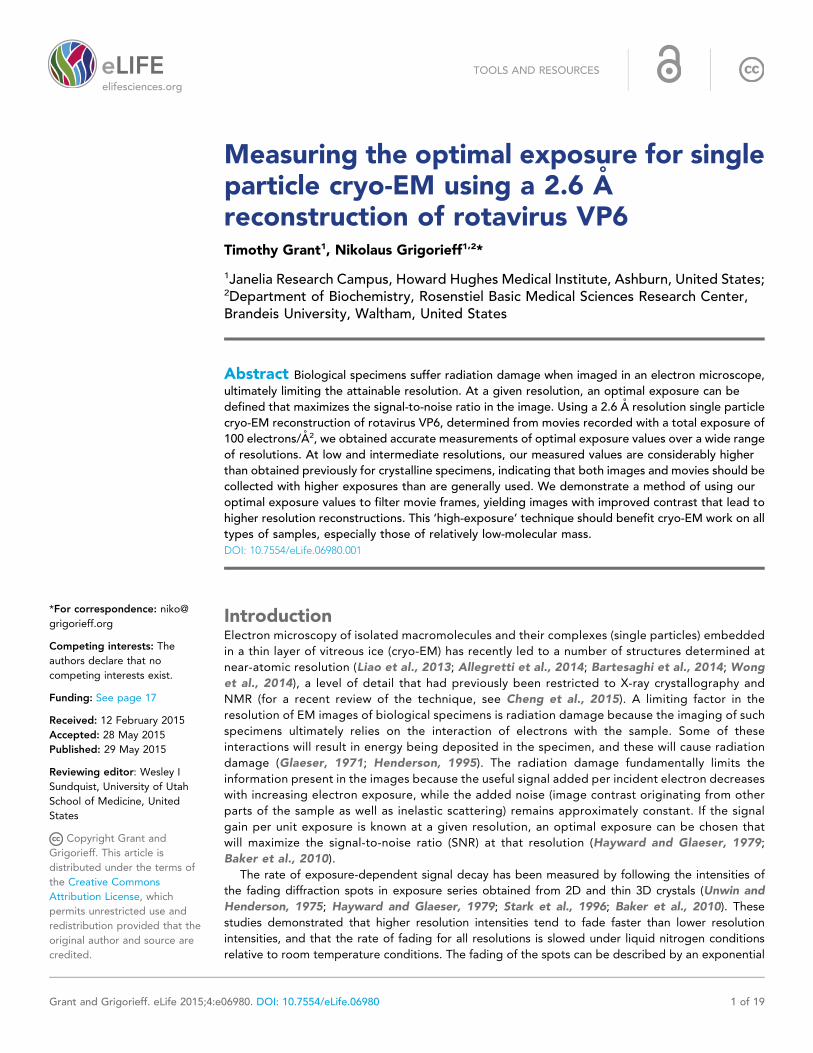
Measuring the optimal exposure for singleparticle cryo-EM using a 2.6 Areconstruction of rotavirus VP6Timothy Grant1, Nikolaus Grigorieff1,2*
1Janelia Research Campus, Howard Hughes Medical Institute, Ashburn, United States;2Department of Biochemistry, Rosenstiel Basic Medical Sciences Research Center,Brandeis University, Waltham, United States
Abstract Biological specimens suffer radiation damage when imaged in an electron microscope,
ultimately limiting the attainable resolution. At a given resolution, an optimal exposure can be
defined that maximizes the signal-to-noise ratio in the image. Using a 2.6 A resolution single particle
cryo-EM reconstruction of rotavirus VP6, determined from movies recorded with a total exposure of
100 electrons/A2, we obtained accurate measurements of optimal exposure values over a wide range
of resolutions. At low and intermediate resolutions, our measured values are considerably higher
than obtained previously for crystalline specimens, indicating that both images and movies should be
collected with higher exposures than are generally used. We demonstrate a method of using our
optimal exposure values to filter movie frames, yielding images with improved contrast that lead to
higher resolution reconstructions. This ‘high-exposure’ technique should benefit cryo-EM work on all
types of samples, especially those of relatively low-molecular mass.
DOI: 10.7554/eLife.06980.001
IntroductionElectron microscopy of isolated macromolecules and their complexes (single particles) embedded
in a thin layer of vitreous ice (cryo-EM) has recently led to a number of structures determined at
near-atomic resolution (Liao et al., 2013; Allegretti et al., 2014; Bartesaghi et al., 2014; Wong
et al., 2014), a level of detail that had previously been restricted to X-ray crystallography and
NMR (for a recent review of the technique, see Cheng et al., 2015). A limiting factor in the
resolution of EM images of biological specimens is radiation damage because the imaging of such
specimens ultimately relies on the interaction of electrons with the sample. Some of these
interactions will result in energy being deposited in the specimen, and these will cause radiation
damage (Glaeser, 1971; Henderson, 1995). The radiation damage fundamentally limits the
information present in the images because the useful signal added per incident electron decreases
with increasing electron exposure, while the added noise (image contrast originating from other
parts of the sample as well as inelastic scattering) remains approximately constant. If the signal
gain per unit exposure is known at a given resolution, an optimal exposure can be chosen that
will maximize the signal-to-noise ratio (SNR) at that resolution (Hayward and Glaeser, 1979;
Baker et al., 2010).
The rate of exposure-dependent signal decay has been measured by following the intensities of
the fading diffraction spots in exposure series obtained from 2D and thin 3D crystals (Unwin and
Henderson, 1975; Hayward and Glaeser, 1979; Stark et al., 1996; Baker et al., 2010). These
studies demonstrated that higher resolution intensities tend to fade faster than lower resolution
intensities, and that the rate of fading for all resolutions is slowed under liquid nitrogen conditions
relative to room temperature conditions. The fading of the spots can be described by an exponential
*For correspondence: niko@
grigorieff.org
Competing interests: The
authors declare that no
competing interests exist.
Funding: See page 17
Received: 12 February 2015
Accepted: 28 May 2015
Published: 29 May 2015
Reviewing editor: Wesley I
Sundquist, University of Utah
School of Medicine, United
States
Copyright Grant and
Grigorieff. This article is
distributed under the terms of
the Creative Commons
Attribution License, which
permits unrestricted use and
redistribution provided that the
original author and source are
credited.
Grant and Grigorieff. eLife 2015;4:e06980. DOI: 10.7554/eLife.06980 1 of 19
decay that is characterized by Ne, the resolution-dependent critical exposure after which spot
intensities are reduced to 1/e of their starting values. To perform similar experiments with non-
crystalline material, that is single particles, the resolution-dependent fading of the signal present in an
image (or average of images) has to be determined. Unlike diffraction spots obtained from crystals,
the signal in an image will give rise to signal amplitudes in the image Fourier transform. The squared
Fourier amplitudes are equivalent to crystal diffraction intensities but will be affected by a number of
additional factors, for example, the contrast transfer function (CTF) of the microscope and movement
of the specimen, both attenuating the amplitudes. However, assuming a linear imaging system and
constant amplitude-attenuating factors throughout an exposure series, the rate of fading of the signal
in an image can be determined from the fading of the signal amplitudes in the image Fourier
transform. While the fading of spots can be measured directly from diffraction patterns, the signal
amplitudes calculated from an image are superimposed on the noise generated by the stochastic
detection of electrons forming the image, as well as background due to the embedding ice and
support film if present. Therefore, instead of measuring signal amplitudes directly, they have to be
estimated from measurements of the SNR. Since the exposure, and therefore the noise, in each image
within a series remains approximately constant, the SNR is directly proportional to the signal in each
image. Analogous to the fading of diffraction spots (Hayward and Glaeser, 1979), the SNR of an
image recorded after a prior exposure of N electrons/A2 is therefore
SNRðk;NÞ=SNRðk; 0Þe− NNe ðkÞ; (1)
where k is the spatial frequency, N is the accumulated exposure, and Ne is the resolution-dependent
critical exposure defined above. We can see from Equation 1 that a plot of ln(SNR(k)) vs N should
have a slope of −1/Ne(k), and Baker et al. (2010) demonstrated that this relationship is true not just
in the case of measurements of instantaneous signal, but also in the case of a detector that
eLife digest Microscopes allow us to visualize objects that are invisible to the naked eye. One
type of microscope—called the electron microscope—produces images using beams of particles
known as electrons, which enables them to produce more detailed images than microscopes that use
light.
There are several ways to prepare samples for electron microscopy. For example, in ‘electron
cryo-microscopy’—or cryo-EM for short—a sample is rapidly frozen to preserve its features before it
is examined under the microscope. This technique generates images that can be analyzed by
computers to produce three-dimensional models of individual viruses, proteins, and other tiny
objects. Unfortunately, the samples need to be exposed to high-energy beams of electrons that will
damage the sample while the images are gathered, which results in sample movement and blurry
images that lack the finer details.
The contrast between the sample and its background is one of the factors that determine the final
quality of an image. The higher the contrast, the greater the level of structural information that can
be obtained, but this requires the use of longer exposures to the electron beam. To overcome this
issue, researchers found that instead of recording a single image, it is possible to record movies in
which the movement of the sample under the electron beam can be tracked. After the movies are
gathered, the movie frames are aligned using computer software to reduce the blurring caused by
the sample moving and can then be used to make three-dimensional models.
Grant and Grigorieff improved this method further by studying how quickly a large virus-like
particle called ‘rotavirus double-layered particle’ is damaged under the electron beam. These
experiments identified an optimum range of exposure to electrons that provides the highest image
contrast at any given level of detail. These findings were used to design an exposure filter that can be
applied to the movie frames, allowing Grant and Grigorieff to visualize features of the virus that had
not previously been observed by cryo-EM.
This method was also used to study an assembly of proteins known as the proteasome, which is
responsible for destroying old proteins. Grant and Grigorieff’s findings should be useful for cryo-EM
studies on many kinds of samples.
DOI: 10.7554/eLife.06980.002
Grant and Grigorieff. eLife 2015;4:e06980. DOI: 10.7554/eLife.06980 2 of 19
Tools and resources Biophysics and structural biology
integrates measured intensities over time. The SNR of an image will continue to increase with
electron exposures larger than the critical exposure. Hayward and Glaeser (1979) showed that the
signal present in crystal diffraction spots is maximized at an optimal exposure of ∼2.5 times the
critical exposure. The SNR increase per unit exposure is larger below the optimal exposure than the
corresponding rate of SNR decay beyond the optimal exposure; thus, it is typically better to slightly
overexpose a specimen than slightly underexpose. An exposure of 2.5 Ne is also expected to
optimize the signal in images at a given resolution due to the analogy between image and crystal
data as explained above.
Despite studies of the general effects of radiation damage on single-particle specimens (Conway
et al., 1993), direct measurement of the critical exposure on non-crystalline specimens has proven
difficult in the past for a number of reasons. Firstly, recording a series of images with increasing
exposure would have led to images with SNRs so low that they would be difficult to analyze.
Secondly, until recently the resolutions commonly obtained with the single-particle method were of
insufficient quality to follow radiation damage at near-atomic resolution (better than 4 A). Finally,
signal loss due to beam-induced specimen movement (Brilot et al., 2012; Campbell et al., 2012;
Li et al., 2013; Scheres, 2014) was hard to quantify, and thus, the effects of radiation damage and
movement could not be separated. The recent availability of direct electron detectors (Milazzo
et al., 2005; Faruqi and Henderson, 2007; Li et al., 2013) has largely alleviated these problems.
The ability to record movies instead of single images allows for easy collection of a continuous
exposure series, while allowing for measurement and correction of specimen movement (Brilot
et al., 2012; Campbell et al., 2012; Li et al., 2013; Scheres, 2014). Furthermore, the improved
detective quantum efficiency of the detectors (Ruskin et al., 2013; McMullan et al., 2014) has
enhanced the signal present in the images, and this enhancement combined with motion correction
has enabled single-particle reconstructions to reach higher resolutions. In this study, we used a K2
Summit direct detector (Gatan, Inc., Pleasanton, CA) to collect a single particle data set of rotavirus
double-layered particle (DLP) and estimate the critical exposure of a non-crystalline specimen.
Rotavirus DLP is a spherical particle with a diameter of about 700 A and a molecular mass of about 70
MDa (Grigorieff and Harrison, 2011). The capsid has icosahedral symmetry and consists
predominantly of viral proteins VP2 and VP6, forming an inner and outer layer, respectively. They
have a combined mass of about 44 MDa and package 11 or 12 copies of viral proteins VP1 and VP3,
as well as 11 dsRNA segments that make up the viral genome (Estrozi et al., 2013). VP6 assembles
into 260 trimers that arrange in a T = 13 surface lattice containing a total of 780 VP6 monomers. The
T = 13 lattice enables 13-fold averaging of density in addition to the 60-fold icosahedral symmetry.
The large size of DLP and its high symmetry make it an ideal specimen for this study, yielding high-
contrast particles with very low-alignment errors (Henderson et al., 2011) and almost a thousand
averaged subunits per particle.
The DLP data presented here are of sufficient quality to obtain sub-3-A resolution reconstructions
using just a few movie frames, enabling us to accurately measure the critical exposure over a large
range of resolutions. To test the new filtering scheme, we also show its application to a recently
published reconstruction of the Thermoplasma acidophilum 20S proteasome at 2.8 A resolution
(Campbell et al., 2015), demonstrating optimization of SNR in the final reconstruction and improved
alignment when the SNR in the images is very low.
Results
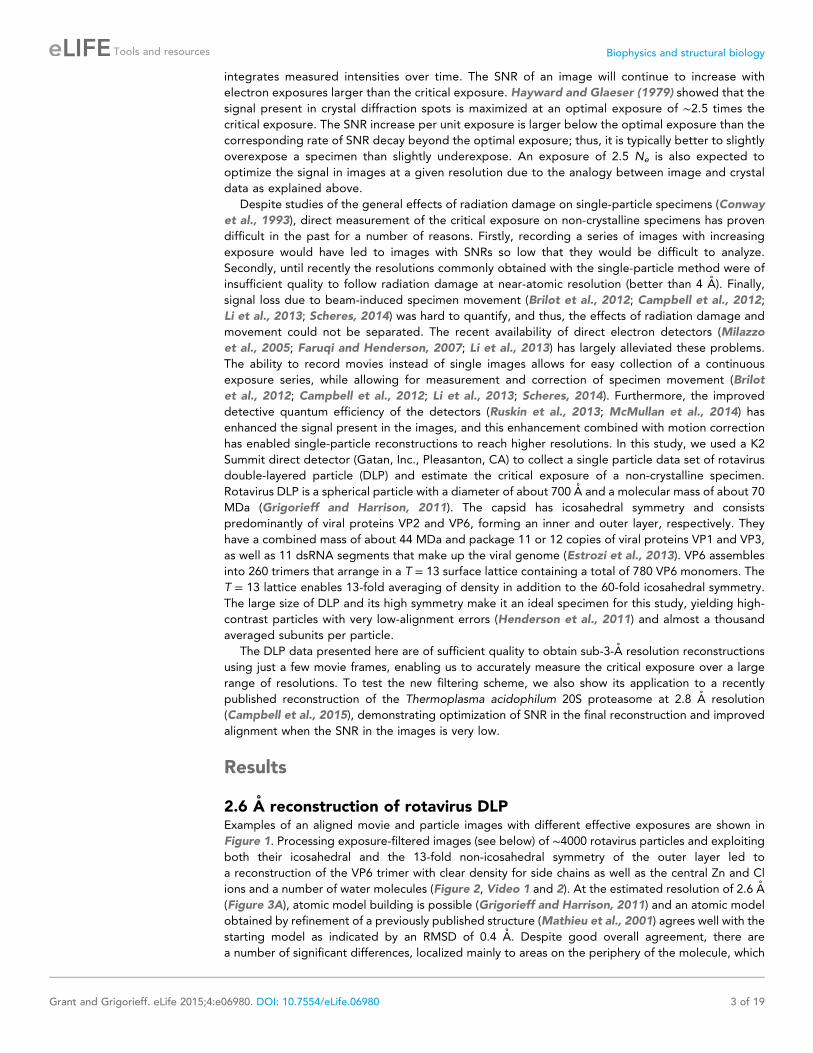
2.6 A reconstruction of rotavirus DLPExamples of an aligned movie and particle images with different effective exposures are shown in
Figure 1. Processing exposure-filtered images (see below) of ∼4000 rotavirus particles and exploiting
both their icosahedral and the 13-fold non-icosahedral symmetry of the outer layer led to
a reconstruction of the VP6 trimer with clear density for side chains as well as the central Zn and Cl
ions and a number of water molecules (Figure 2, Video 1 and 2). At the estimated resolution of 2.6 A
(Figure 3A), atomic model building is possible (Grigorieff and Harrison, 2011) and an atomic model
obtained by refinement of a previously published structure (Mathieu et al., 2001) agrees well with the
starting model as indicated by an RMSD of 0.4 A. Despite good overall agreement, there are
a number of significant differences, localized mainly to areas on the periphery of the molecule, which
Grant and Grigorieff. eLife 2015;4:e06980. DOI: 10.7554/eLife.06980 3 of 19
Tools and resources Biophysics and structural biology
may indicate effects of crystal packing and/or the presence of additional protein interactions in the full
capsid as opposed to the isolated VP6 subunit.
Calculating the Fourier Shell Correlation (FSC) (van Heel and Harauz, 1986) between the VP6 map
and the refined atomic model demonstrated a resolution of ∼2.7 A (Figure 3A). One possibility for the
difference between this and the ∼2.6 A obtained with the half map is the absence of full density for
the most radiation-sensitive side chains in the map, while they are present in the model. Assigning
Figure 1. (A) Example of an aligned movie sum of the rotavirus double-layered particle (DLP) sample imaged with
a total exposure of 100 e−/A2. (B) Particle sum created using all frames and (C) the first 3 frames of the movie,
demonstrating the kind of data used in the analysis. In all cases, the scale bar represents 500 A.
DOI: 10.7554/eLife.06980.003
Grant and Grigorieff. eLife 2015;4:e06980. DOI: 10.7554/eLife.06980 4 of 19
Tools and resources Biophysics and structural biology
higher atomic temperature factors to side chains with weak density may accommodate these
discrepancies, but we did not explore this in our model refinement.
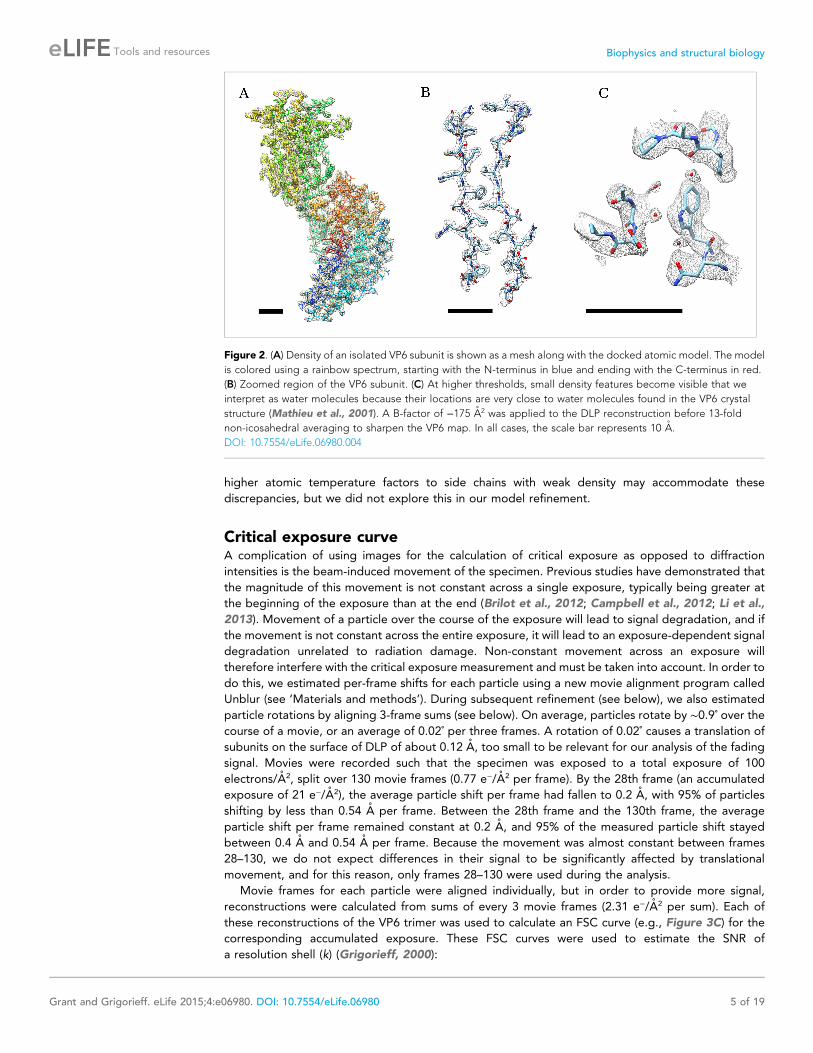
Critical exposure curveA complication of using images for the calculation of critical exposure as opposed to diffraction
intensities is the beam-induced movement of the specimen. Previous studies have demonstrated that
the magnitude of this movement is not constant across a single exposure, typically being greater at
the beginning of the exposure than at the end (Brilot et al., 2012; Campbell et al., 2012; Li et al.,
2013). Movement of a particle over the course of the exposure will lead to signal degradation, and if
the movement is not constant across the entire exposure, it will lead to an exposure-dependent signal
degradation unrelated to radiation damage. Non-constant movement across an exposure will
therefore interfere with the critical exposure measurement and must be taken into account. In order to
do this, we estimated per-frame shifts for each particle using a new movie alignment program called
Unblur (see ‘Materials and methods’). During subsequent refinement (see below), we also estimated
particle rotations by aligning 3-frame sums (see below). On average, particles rotate by ∼0.9˚ over thecourse of a movie, or an average of 0.02˚ per three frames. A rotation of 0.02˚ causes a translation of
subunits on the surface of DLP of about 0.12 A, too small to be relevant for our analysis of the fading
signal. Movies were recorded such that the specimen was exposed to a total exposure of 100
electrons/A2, split over 130 movie frames (0.77 e−/A2 per frame). By the 28th frame (an accumulated
exposure of 21 e−/A2), the average particle shift per frame had fallen to 0.2 A, with 95% of particles
shifting by less than 0.54 A per frame. Between the 28th frame and the 130th frame, the average
particle shift per frame remained constant at 0.2 A, and 95% of the measured particle shift stayed
between 0.4 A and 0.54 A per frame. Because the movement was almost constant between frames
28–130, we do not expect differences in their signal to be significantly affected by translational
movement, and for this reason, only frames 28–130 were used during the analysis.
Movie frames for each particle were aligned individually, but in order to provide more signal,
reconstructions were calculated from sums of every 3 movie frames (2.31 e−/A2 per sum). Each of
these reconstructions of the VP6 trimer was used to calculate an FSC curve (e.g., Figure 3C) for the
corresponding accumulated exposure. These FSC curves were used to estimate the SNR of
a resolution shell (k) (Grigorieff, 2000):
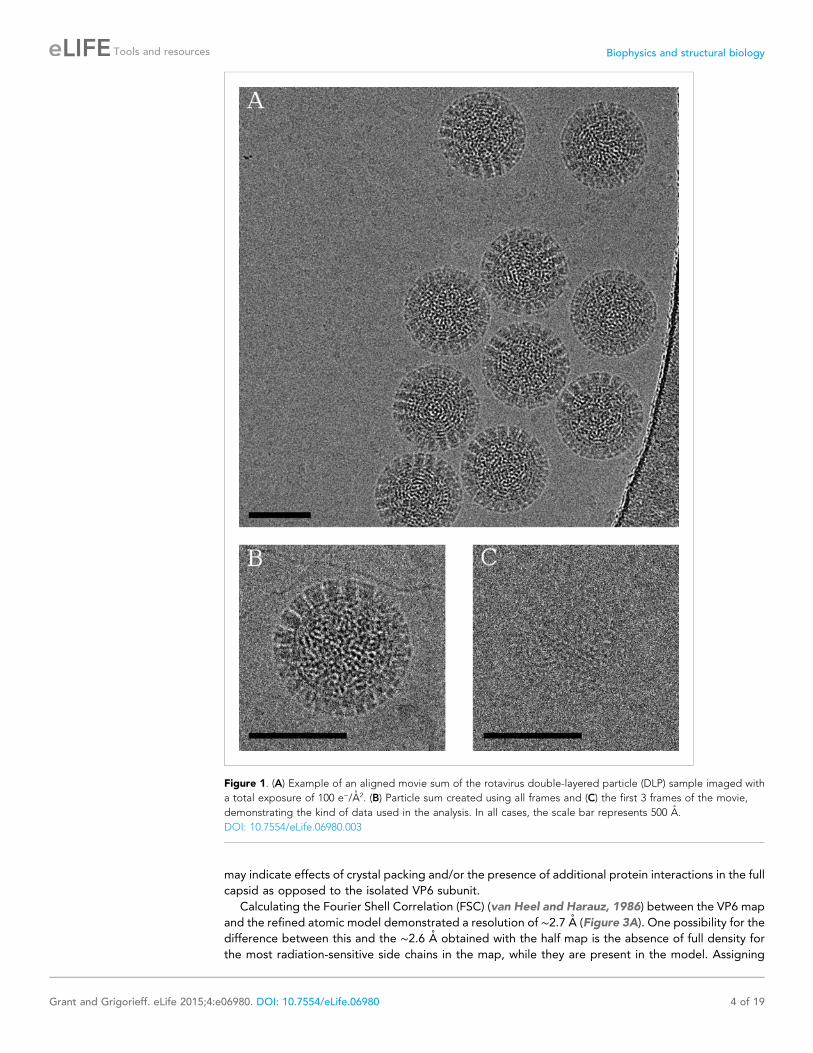
Figure 2. (A) Density of an isolated VP6 subunit is shown as a mesh along with the docked atomic model. The model
is colored using a rainbow spectrum, starting with the N-terminus in blue and ending with the C-terminus in red.
(B) Zoomed region of the VP6 subunit. (C) At higher thresholds, small density features become visible that we
interpret as water molecules because their locations are very close to water molecules found in the VP6 crystal
structure (Mathieu et al., 2001). A B-factor of −175 A2 was applied to the DLP reconstruction before 13-fold
non-icosahedral averaging to sharpen the VP6 map. In all cases, the scale bar represents 10 A.
DOI: 10.7554/eLife.06980.004
Grant and Grigorieff. eLife 2015;4:e06980. DOI: 10.7554/eLife.06980 5 of 19
Tools and resources Biophysics and structural biology

SNRðkÞ= 2FSCðkÞ1−FSCðkÞ: (2)
Thus, using the measured FSC curves and
Equation 2, we were able to plot ln(SNR) for
each resolution shell as a function of exposure.
For each plot, we performed linear regression
using the points from frame 28 up to the point at
which ln(SNR) fell below the 3σ value expected
from pure noise. Figure 4 shows the plots and
regressions found for a number of different
resolutions.
Good quality regressions were found for data
from ∼22 A to ∼3.8 A, and the critical exposure
values derived from these regressions are plotted
in Figure 5A. At resolutions higher than 3.8 A,
there were too few points (estimated SNR values)
for reliable fitting. At resolutions below 22 A, the
curves became much noisier resulting in poor
quality fits. This may be due to the fact that at
resolutions below 22 A, errors due to inelastic
scattering become more significant, and the FSC
values at these spatial frequencies are so high
(typically greater than 0.999) that small errors
lead to large changes in the estimated SNR.
Additionally, our VP6 reconstruction has only 4
resolution shells at resolutions lower than 22 A
(nominally at ∼27 A, ∼37 A, 55 A, and 110 A).
These low-resolution shells thus effectively con-
tain information from a wide range of frequen-
cies, which may also cause errors in the
estimation.
We could fit a function to the recorded data,
which takes the form
y = axb + c: (3)
The best fit to the data, with a R2 value of 0.997, was a = 0.245, b = −1.665, and c = 2.81, plotted in
Figure 5A together with the experimental data. This function can be used to estimate the
critical exposure at 300 kV; the critical exposure at 200 kV can be expected to be about 25% lower
(Yalcin et al., 2006). The optimal exposure, plotted in Figure 5B, is ∼2.5 times the critical exposure
(Hayward and Glaeser, 1979).
At higher spatial frequencies (∼4 A), our values agree well with values previously measured on
crystalline specimens (Figure 5B, Baker et al., 2010), but they deviate toward lower spatial
frequencies, suggesting that the signal at these frequencies in single-particle images is less sensitive
to electron exposure than in images of crystalline specimens. A possible explanation is that when
imaging crystalline specimens, there are two modes of damage, a short-range component caused by
damage to the molecules themselves and a long-range component caused by loss of crystalline order.
We would expect single particles to be affected only by the former and so appear to be less radiation
sensitive. Rotavirus DLP may also be affected by lattice distortions because the surface lattice formed
by the VP6 trimers may be considered analogous to the lattice of a small crystal. However, the extent
to which deformations will attenuate signal will depend on the size of the lattice: small deformations
can add up to larger unit cell displacements across larger distances compared to displacements across
smaller distances. The crystals used for electron diffraction typically measure 1 μm or more in diameter
(Unwin and Henderson, 1975), at least 5 times larger than the circumference of DLP. Furthermore,
Video 1. Density of an isolated VP6 subunit is shown as
a mesh along with the docked atomic model (see also
Figure 2A). The model is colored using a rainbow
spectrum, starting with the N-terminus in blue and
ending with the C-terminus in red.
DOI: 10.7554/eLife.06980.010
Grant and Grigorieff. eLife 2015;4:e06980. DOI: 10.7554/eLife.06980 6 of 19
Tools and resources Biophysics and structural biology
due to their geometry, 2D and thin 3D crystals
are prone to in-plane and out-of-plane distor-
tions, both of which can severely attenuate
diffraction intensities. It is therefore essential for
crystal diffraction studies to use a flat support
film, usually amorphous carbon. Studies of beam-
induced motion have shown that the observed
motion in cryo-EM specimens involves both the
ice and the carbon support (Glaser et al., 2011;
Brilot et al., 2012). Some of the beam-induced
motion may lead to distortions of the carbon
support, causing long-range distortions in the
crystals. Beam-induced distortions of the ice layer
embedding the DLP particles may also perturb
the particle structure. However, the tight packing
of the capsids around the RNA genome is likely
to yield a particle that is more resistant to
distortions than the crystals. We therefore expect
that, at least in terms of the structural properties
relevant for this study, DLP is much closer to
a single particle than a thin crystal. If the
icosahedral surface lattice of DLP is also affected
by lattice distortions due to radiation damage,
we would expect the critical exposure for smaller,
less symmetric samples to be higher still. A
further difference to the crystal studies is that
they used the fastest fading intensities in each
resolution bin for their analysis (Unwin and
Henderson, 1975; Hayward and Glaeser,
1979; Stark et al., 1996; Baker et al., 2010).
With a single-particle specimen, we are limited to
measuring the average loss of SNR in each
resolution bin, which by definition is lower than
the fastest fading components. However, the
difference between the average and fastest
fading components does not appear to be
enough to explain the observed differences.
Other factors may include the chemical makeup
of the specimen, such as the presence of nucleic acids in DLP, as well as buffer and solvent
components. However, the effect of these factors on radiation damage is not well understood.
The first 27 frames of the movie were excluded from the analysis so as to prevent beam-induced
movement from interfering with the results. Our results are therefore based upon data, which have
effectively been pre-exposed by ∼20 e−/A2. If radiation damage indeed occurs as a single-exponential
process, pre-exposure should have no effect on the result presented here. We cannot exclude the
possibility that the damage may occur in two (or more) phases and that we are only observing the final
phase, but there is no evidence for a multi-phased process, and previous studies on crystalline
specimens also demonstrate a single-exponential decay. Moreover, for lower resolutions at which
beam-induced movement is expected to have less of an effect, a plot of ln(SNR) vs accumulated
exposure across all frames shows a single-exponential process (see Figure 4). We also note that
a reconstruction calculated using only frames 25–27 (∼19 e−/A2–∼21 e−/A2) still yields a 3.35 A
resolution reconstruction with clear side chain density (see Figure 6), suggesting that the decay we
have measured is relevant to the kinds of structural information we are interested in. As expected, the
density of side chains fades with increasing exposure and dose deposited on the sample. The density
of carboxyl groups (e.g., Asp29, Figure 6) fades most rapidly and is already partially gone after an
exposure of about 3 e−/A2, while those of aromatic groups (e.g., Tyr24, Figure 6) persists even after
an exposure of about 35–40 e−/A2. This general pattern agrees with that observed before in a number
Video 2. Zoomed region of the VP6 subunit showing
two β-sheet strands (see also Figure 2B).
DOI: 10.7554/eLife.06980.011
Grant and Grigorieff. eLife 2015;4:e06980. DOI: 10.7554/eLife.06980 7 of 19
Tools and resources Biophysics and structural biology
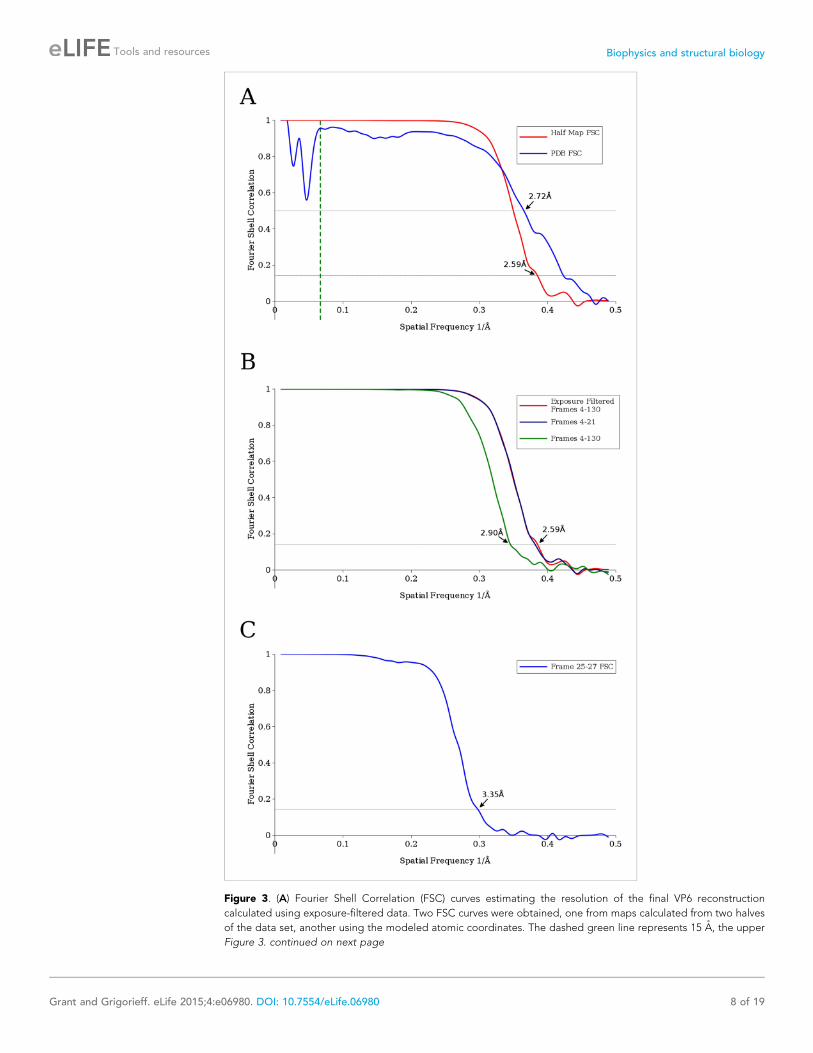
Figure 3. (A) Fourier Shell Correlation (FSC) curves estimating the resolution of the final VP6 reconstruction
calculated using exposure-filtered data. Two FSC curves were obtained, one from maps calculated from two halves
of the data set, another using the modeled atomic coordinates. The dashed green line represents 15 A, the upper
Figure 3. continued on next page
Grant and Grigorieff. eLife 2015;4:e06980. DOI: 10.7554/eLife.06980 8 of 19
Tools and resources Biophysics and structural biology

of cryo-EM (Allegretti et al., 2014; Bartesaghi et al., 2014; Fromm et al., 2015) and X-ray
crystallography studies (Fioravanti et al., 2007). We note also that the density of the α-helixbackbone remains visible even after an exposure of ∼50 e−/A2. This high exposure exceeds the
optimal exposure of about 30 e−/A2 at 8 A resolution where α-helical features become clearly visible.
Such high tolerance of secondary structural features to radiation damage may help in the alignment of
single-particle images recorded using high exposures (see below).
Exposure filteringWhen using a detector, which outputs single images, the optimal exposure curve (Figure 5B) can be
used to select the optimal exposure based on a targeted resolution, although this exposure will not be
optimal for other resolutions. However, as has been suggested before (Baker et al., 2010; Campbell
et al., 2012; Scheres, 2014), given a detector capable of recording movies, the optimal exposure
curve can be used to filter frames based on their individual exposures. Filtering the frames in this way
will result in a sum with an increased SNR relative to the unfiltered sum.
Equation 1 describes the attenuation of the image SNR caused by radiation damage with
increasing exposure. The attenuation of the SNR is the result of fading image Fourier amplitudes (A),
which will follow the square root of the exponential decay of the SNR:
Aðk;NÞ=Aðk; 0Þe− N2Ne ðkÞ: (4)
Figure 3. Continued
resolution limit used during parameter refinement. (B) FSC curves between half data set reconstructions of the VP6
subunit when using an exposure-filtered sum of frames 4–130, an unfiltered sum of frames 4–130, and an unfiltered
sum of frames 4–21, which were determined to be the best set of unfiltered frames by trial and error. Exposure
filtering was applied only to the final reconstruction, and not during refinement (C) FSC curve for the reconstruction
using only frames 25–27, indicating a resolution of ∼3.4 A after a pre-exposure of ∼19 e−/A2.
DOI: 10.7554/eLife.06980.005
Figure 4. Example plots of ln(SNR) vs accumulated exposure with associated linear fits at a number of different
resolutions. Data used in this study are shown in darker color, while data for early frames excluded from the analysis
due to specimen movement are shown in lighter color. The slopes of the lines become steeper as the resolution
increases, corresponding to faster fading of the signal. The linear plots fit the data well, suggesting that in the
analyzed regions a single-exponential process is dominant in the decay.
DOI: 10.7554/eLife.06980.006
Grant and Grigorieff. eLife 2015;4:e06980. DOI: 10.7554/eLife.06980 9 of 19
Tools and resources Biophysics and structural biology
The initial value of A at N = 0 is usually not known but is not needed for optimal exposure filtering;
only relative differences are significant (see below). Thus, the exposure-dependent amplitude
attenuation is given by
qðk;NÞ=e− N2Ne ðkÞ: (5)
Previous work has described the optimal 3D reconstruction from images, which have had their
amplitudes attenuated by the CTF (Sindelar and Grigorieff, 2012). We can easily extend this
formalism to take into account both the CTF and the amplitude attenuation due to radiation damage:
F3DðkÞ= ∑ni =1CTF
pi ðkÞqðk;NiÞFiðkÞ
∑ni =1
�|CTFiðkÞ|qðk;NiÞ
�2 +1�SNRðkÞ
: (6)
Figure 5. (A) The measured critical exposure curve plotting the critical exposure at each measured resolution and
the fit function for comparison. (B) Curve plotting the optimal exposure obtained in this study alongside that
obtained in a previous study on crystalline specimens, scaled by a factor of 1.25 to compensate for the fact that the
previous study was conducted at 200 kV (Baker et al., 2010).
DOI: 10.7554/eLife.06980.007
Grant and Grigorieff. eLife 2015;4:e06980. DOI: 10.7554/eLife.06980 10 of 19
Tools and resources Biophysics and structural biology

Here, the sum over i includes all frames of all movies contributing to Fourier coordinate k, F3D is the
3D reconstruction Fourier transform, while Fi represents the measured image Fourier terms. Ni is the
accumulated exposure of the frame, and SNR(k) is the average unattenuated SNR in the area of the
particle within a single frame (the ‘particle spectral SNR’, or PSSNR in [Sindelar and Grigorieff, 2012]).
While Equation 6 describes an optimal correction when 3D reconstructions are calculated from
individual movie frames, it is often more practical to calculate a filtered sum of the frames for each
aligned movie or individual particle. This sum can then be used for further processing without further
consideration of the movie frames. In this case, for simplicity, we assume that the defocus does not
change and thus disregard the CTF term, leaving it to be taken into account in later processing steps.
The filtered 2D image FW is then given by
FW ðkÞ= ∑ni =1qðk;NiÞFiðkÞ
∑ni =1q
2ðk;NiÞ+ 1�SNRðkÞ: (7)
SNR(k) is not known, but we can assume it to be very small for a single frame of a movie due to the
small exposure. Its reciprocal value is therefore large compared to the first term in the denominator,
which can be neglected, and thus
FW ðkÞ≈SNRðkÞ∑ni = 1qðk;NiÞFiðkÞ: (8)
SNR(k) is an average across a resolution shell, and thus, the term serves to weight resolution shells
with respect to each other to maximize the SNR of the final image. This will generally result in a low-
pass filtering of the sums and may affect later processing steps. Furthermore, an estimate of the SNR
is usually not available until later stages of processing. Thus, to minimize the alteration of features in
the original images by the exposure filter, we formulate the filter as a weighted sum that maximizes
the SNR in each resolution shell:
˜FW ðkÞ=∑n
i = 1qðk;NiÞFiðkÞffiffiffiffiffiffiffiffiffiffiffiffiffiffiffiffiffiffiffiffiffiffiffiffiffiffiffiffiffiffi∑n
i =1qðk;NiÞ2q : (9)
Exposure filtering using the above scheme, combined with the measured critical exposure curve,
has been integrated into the new Unblur program (see ‘Materials and methods’) allowing the
production of aligned and exposure-filtered movies. Increasing the SNR of the movie sum should
increase the accuracy of particle alignments leading to improved reconstructions, particularly in the
most difficult cases such as very small proteins. Furthermore, correct filtering of movie frames allows
Figure 6. Surface rendering of an isolated small helix from different 3-frame reconstructions shown with the docked
model. Each reconstruction is shown with its exposure range and resolution as calculated from the FSC using the
0.143 cut-off.
DOI: 10.7554/eLife.06980.008
Grant and Grigorieff. eLife 2015;4:e06980. DOI: 10.7554/eLife.06980 11 of 19
Tools and resources Biophysics and structural biology
the use of all later frames in the reconstruction with no need to test the inclusion of different numbers
of frames in order to find an optimum.
In order to assess the effectiveness of applying the exposure filter, we first used trial and error to
manually determine which range of frames, when summed, yielded the best VP6 reconstruction. The
best reconstruction was found when using frames 4–21. Separately, we calculated a reconstruction
using frames 4–130 (i.e., to the final frame of the movie), weighted with the exposure filter. The two
reconstructions are nearly identical as judged by the FSC and are both of better quality than
a reconstruction using the unfiltered sum of frames 4–130, suggesting that the exposure filter is
weighting correctly (see Figure 3B).
While the reconstructions calculated using exposure filtering and by selecting frames 4–21 have the
same resolution, the exposure-filtered reconstruction visually appears slightly less sharp. This higher
B-factor is to be expected due to the inclusion of comparatively stronger lower resolution signal in the
exposure-filtered sums when compared to the simple sum of frames 4–21. After scaling the amplitudes
to be the same for both reconstructions using diffmap (http://grigoriefflab.janelia.org/diffmap), the two
reconstructions are indistinguishable. In the case of DLPs, which exhibit extremely low-alignment error
using traditional processing (Henderson et al., 2011), increasing the SNR at low and intermediate
resolutions would not be expected to lead to improved alignment. However, additional resolution gains
can be expected for smaller particles with a lower molecular mass, when using exposure-filtered particle
sums (see below).
Application of the exposure filter to 20S proteasomeUsing recently published data to calculate a 2.8 A reconstruction of the 20S proteasome, a 700 kDa
complex with D7 symmetry (Campbell et al., 2015), we applied the exposure filter described above to
test if it also optimizes the reconstruction of a smaller, less symmetrical particle. Movies of 20S
proteasome consisted of 38 frames collected on a Gatan K2 detector using a total exposure of 53 e−/A2
(∼1.4 e−/A2 per frame). Using the frame alignment obtained by Campbell et al., we calculated four
different frame sums: using the exposure filter, unfiltered sums of the first 9 frames (corresponding to
an effective exposure of 12.6 e−/A2), the first 14 frames (corresponding to an effective exposure of
19.6 e−/A2), and all frames. An exposure of 12.6 e−/A2 approximates the optimal exposure at ∼3 A
resolution measured using rotavirus DLP, while an exposure of ∼20 e−/A2 is close to exposures used in
previous high-resolution cryo-EM studies (Zhang et al., 2008; Wolf et al., 2010) that were published
prior to the use of direct detectors and movies. The same particles selected and used by Campbell
et al. (49,954 particles) were extracted from these four sets of micrographs, aligned against an initial
model obtained from class averages (see ‘Materials and methods’) and refined using Frealign v9
(Lyumkis et al., 2013).
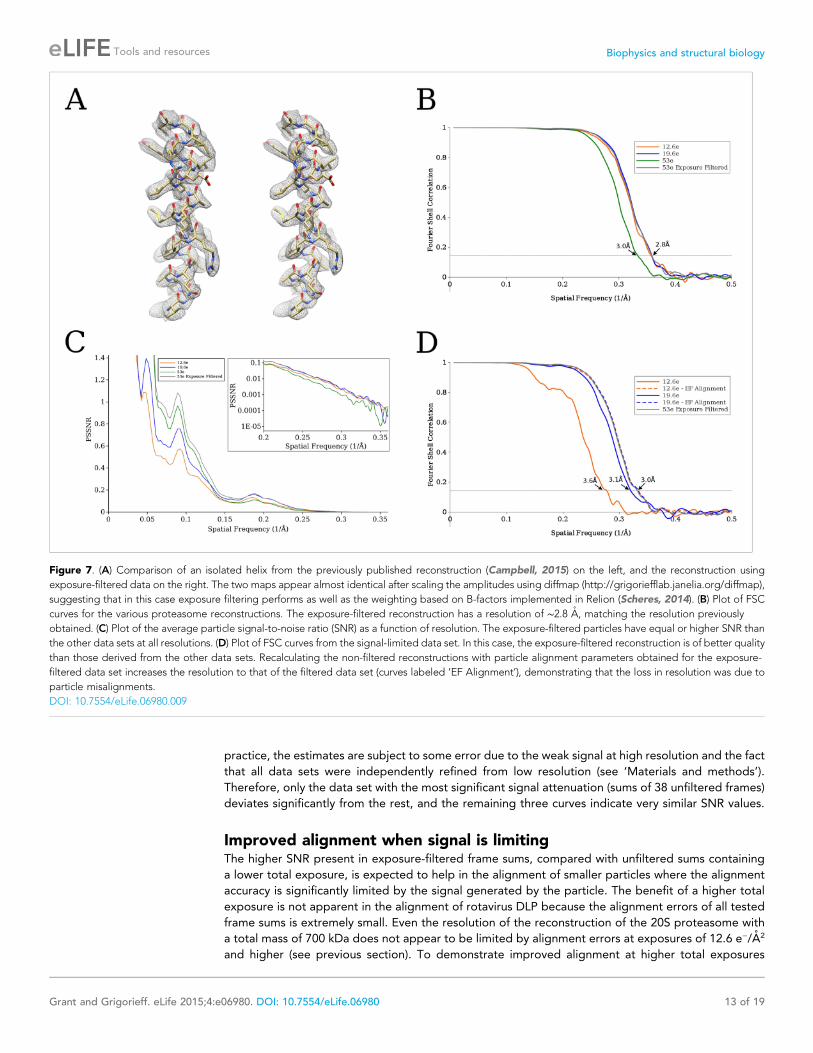
A comparison between the previously published structure and our structure (Figure 7A) suggests
that the exposure filter described here and the B-factor weighting implemented in Relion (Scheres,
2014; see below) and used by Campbell et al. perform equally well. Figure 7B shows FSC curves for
all four test cases, indicating a resolution of 2.8 A for all reconstructions except the one calculated
from unfiltered frame sums that included all 38 frames. The lower resolution of this last reconstruction
(about 3 A) is expected due to the effective total exposure of 53 e−/A2, which exceeds the optimal
exposure at 3 A by a factor of 4. The optimal exposure is also exceeded in the case of 19.6 e−/A2,
albeit only by a factor of 1.5, which does not appear to affect the resolution of the reconstruction
significantly. To better follow the effectiveness of the exposure filter, we also plotted the average
spectral SNR of the filtered particle images (PSSNR, see above). Figure 7C shows that the SNR of the
exposure-filtered sums of all frames equals or exceeds that of the other frame sums at all resolutions.
Without exposure filtering, summing all 38 frames produces SNR values that are similar to the filtered
sums at low resolution but are significantly lower as the resolution increases. At 3 A resolution, the
average SNR in the unfiltered sums is only about 30% of that of the filtered sums. The PSSNR curves
estimated for the unfiltered sums, calculated from the first 9 and 14 movie frames, start out lower at
low resolution than the other two curves as expected since they are missing the additional exposure to
boosts the low-resolution signal. At 3 A resolution, both curves converge with the curve calculated
form the filtered sums using all 38 frames. Based on the effective radiation damage reflected in the
data, we would expect the PSSNR at high resolution to be highest for the exposure-filtered sums,
followed by the unfiltered sums corresponding to 12.6 e−/A2, 19.6 e−/A2, and 53 e−/A2. However, in
Grant and Grigorieff. eLife 2015;4:e06980. DOI: 10.7554/eLife.06980 12 of 19
Tools and resources Biophysics and structural biology
practice, the estimates are subject to some error due to the weak signal at high resolution and the fact
that all data sets were independently refined from low resolution (see ‘Materials and methods’).
Therefore, only the data set with the most significant signal attenuation (sums of 38 unfiltered frames)
deviates significantly from the rest, and the remaining three curves indicate very similar SNR values.
Improved alignment when signal is limitingThe higher SNR present in exposure-filtered frame sums, compared with unfiltered sums containing
a lower total exposure, is expected to help in the alignment of smaller particles where the alignment
accuracy is significantly limited by the signal generated by the particle. The benefit of a higher total
exposure is not apparent in the alignment of rotavirus DLP because the alignment errors of all tested
frame sums is extremely small. Even the resolution of the reconstruction of the 20S proteasome with
a total mass of 700 kDa does not appear to be limited by alignment errors at exposures of 12.6 e−/A2
and higher (see previous section). To demonstrate improved alignment at higher total exposures
Figure 7. (A) Comparison of an isolated helix from the previously published reconstruction (Campbell, 2015) on the left, and the reconstruction using
exposure-filtered data on the right. The two maps appear almost identical after scaling the amplitudes using diffmap (http://grigoriefflab.janelia.org/diffmap),
suggesting that in this case exposure filtering performs as well as the weighting based on B-factors implemented in Relion (Scheres, 2014). (B) Plot of FSC
curves for the various proteasome reconstructions. The exposure-filtered reconstruction has a resolution of ∼2.8 A, matching the resolution previously
obtained. (C) Plot of the average particle signal-to-noise ratio (SNR) as a function of resolution. The exposure-filtered particles have equal or higher SNR than
the other data sets at all resolutions. (D) Plot of FSC curves from the signal-limited data set. In this case, the exposure-filtered reconstruction is of better quality
than those derived from the other data sets. Recalculating the non-filtered reconstructions with particle alignment parameters obtained for the exposure-
filtered data set increases the resolution to that of the filtered data set (curves labeled ‘EF Alignment’), demonstrating that the loss in resolution was due to
particle misalignments.
DOI: 10.7554/eLife.06980.009
Grant and Grigorieff. eLife 2015;4:e06980. DOI: 10.7554/eLife.06980 13 of 19
Tools and resources Biophysics and structural biology

when the signal is weak, we generated additional data sets by adding images of areas of empty ice to
the proteasome particle images. The ice images were taken from the same micrographs as the
particles they were added to, and they contained the same number of frames (total exposure) and
filtering. The ice images add approximately the same amount of noise and background that is also
present in the particle images, thus, reducing the effective SNR in the resulting images approximately
by 50%. At low resolution (special frequencies larger than 1/10 A−1), the new data sets should
therefore emulate data that would have been obtained by a particle of half the mass, that is, 350 kDa,
while at higher resolution (special frequencies smaller than 1/10 A−1) the data should approximate the
signal expected from a 175 kDa particle, that is, with a quarter of the mass (Rosenthal and
Henderson, 2003).
Figure 7D shows the results of the processing of three data sets with added ice background,
derived from exposure-filtered sums of 38 frames, as well as unfiltered sums of the first 9 and 14
frames (total exposures of 12.6 e−/A2, 19.6 e−/A2, respectively). Unlike the reconstruction calculated
from the exposure-filtered original data (see above), the reconstruction calculated form the exposure-
filtered images with added noise displays a significantly improved FSC curve compared with the other
two noise-added data sets. To test if the improved resolution with exposure filtering is due to the
improved alignment of the images, we also calculated reconstructions from the noise-added data sets
with total exposures of 12.6 e−/A2, 19.6 e−/A2 using the alignment parameters obtained from the
exposure-filtered data. As shown in Figure 7D, this parameter replacement increases the resolution
for the two unfiltered reconstructions to that of the filtered reconstruction, similar to the results
obtained for the original data sets in Figure 7B. The superior resolution of the exposure-filtered
reconstruction is therefore due to more accurate particle alignments. High-quality data sets of smaller
particles (about 300 kDa or less) collected using 50 to 100 e−/A2 exposures are currently not available
to demonstrate the improved particle alignment more directly with experimental data. However, the
alignment accuracy of these particles is expected to be limited by weaker contrast (Henderson, 1995),
and we expect improvements similar to those seen in our simulation when using exposures that
significantly exceed the optimal exposure and applying the exposure filter described here.
DiscussionThe optimal exposure curve we determined should correct well for radiation damage to the specimen,
which has a substantial effect on the relative signal content of individual movie frames, in particular the
later frames. As discussed earlier, the other major source of frame-dependent signal change is motion
of the specimen, which tends to degrade the signal of earlier frames. For optimal filtering of the data,
movement should also be included in the filtering, as should any other effects that change the relative
signal in different frames. Currently, the exposure filter does not take movement into account and so
will not filter the initial frames optimally. We plan to incorporate movement in a future version of the
algorithm.
An alternative method for frame filtering has recently been described (Scheres, 2014). This
methodology uses the data set itself to estimate per frame weights based on fitting relative B-factors
to reconstructions from individual frames. Although this is an elegant solution, which in the best case
handles weighting of both radiation damage and movement, filtering with the exposure curve
described in this paper should offer a number of advantages, at least in terms of filtering radiation
damage. First, our filter can be applied at the beginning of processing without assessing the data, and
thus, can help in the initial steps of picking particles and finding initial alignment and orientation
parameters. Indeed, one could use the two methods in combination, by using the exposure filter
described here for the initial refinement, then when a good quality reconstruction has been obtained,
using frame filtering based directly on the data. Second, for some data, the estimate for the B-factor
to be applied to each frame may be quite noisy and may lead to error, a problem, which is likely to be
exacerbated with smaller data sets. Furthermore, accurate estimation of the B-factor relies on high-
frequency signal and will thus fail on intermediate- and low-resolution structures. Third, even in
situations in which a B-factor can be estimated, it is unclear how well a B-factor estimated using
a specific resolution range will describe signal degradation due to radiation damage outside that
range. In contrast, our calculated optimal exposure curve describes experimentally determined values
at a wide range of resolutions. The tests carried out with the previously published 20S proteasome
data (see above) show that the filtering is indeed close to optimal, not only for rotavirus DLP but also
for smaller and less symmetrical particles, and that its performance matches that of B-factor
Grant and Grigorieff. eLife 2015;4:e06980. DOI: 10.7554/eLife.06980 14 of 19
Tools and resources Biophysics and structural biology
weighting. Finally, exposure filtering can also be applied when B-factors are difficult to determine,
such as in electron tomography. Using the filter described here, images collected at different
specimen tilts can be filtered to optimize the final SNR and resolution in a tomogram. While a similar
filtering could also be achieved using B-factors, the relatively low resolution of a tomogram and the
presence of structural heterogeneity would likely prevent the determination of appropriate B-factors.
The results we present here indicate that the electron exposures commonly used in cryo-EM
experiments (∼10–20 e−/A2) should be increased to obtain optimal image contrast. By using
a considerably larger total exposure, the SNR of the images at intermediate and low resolutions will
be increased, leading to greater accuracy in particle alignment and orientation determination in cases
where the accuracy is limited by the signal, which will in turn lead to better reconstructions. This
should especially be true for smaller particles where alignment errors can severely limit the attainable
resolution (Henderson et al., 2011).
Materials and methods
Specimen preparationRotavirus DLPs were prepared as previously described (Street et al., 1982). Three microliters of sample
with a concentration of 2.5–4 mg/ml was applied to C-flat 1.2/1.3 Cu 400 mesh grids (Protochips,
Raleigh, NC), which had previously been subjected to glow discharge for 45 s at 20 mA, and plunge-
frozen using an FEI Vitrobot Mark 2 (FEI Company, Hillsboro, OR) with a 4 or 6 s blot time and at relative
humidity between 65 and 80%.
Electron microscopyThe data were collected on an FEI Krios microscope (FEI Company, Hillsboro, OR) operating at 300
kV. Movies were collected on a Gatan K2 Summit direct electron detector (Gatan, Inc., Pleasanton,
CA) in super resolution mode with a calibrated pixel size of 0.512 A per super resolution pixel. The
pixel size was calibrated by maximizing the cross correlation between the whole DLP reconstruction
and a 3.8 A crystal structure of the entire DLP (McClain et al., 2010). Each exposure was 13 s long and
recorded as a movie of 130 frames. The exposure per frame as reported by Digital Micrograph (Gatan,
Inc., Pleasanton, CA) was 0.769 e−/A2, which corresponds to an exposure of 8 electrons/pixel/s on the
camera. Movies were collected at a range of underfocus between ∼0.4 μm and ∼2.0 μm. Throughout
the data collection, the exposure per movie was checked regularly to make sure it hadn’t deviated
from a total exposure of 100 e−/A2.
Image processingSuper-resolution movie frames were initially corrected for a magnification distortion present on our FEI
Titan Krios microscope by real space stretching using bilinear interpolation. The frames were
then downsampled by a factor of 2 using Fourier cropping to a pixel size of 1.023 A. The downsampled
frames were motion-corrected using newly written software called Unblur (Supplementary file 1). Unblur
is stand-alone software available for download from the Grigorieff lab web page (http://grigoriefflab.
janelia.org/unblur) and is based on iterative alignments of each raw frame to the current best total sum of
all other frames, leaving the frame which is currently being aligned out of the total sum to avoid the
frame ‘finding itself’ in the sum. After each iteration, a spline is fit to both the X and Y shifts to reduce
sensitivity to noise. Frame sums can be filtered according to the described exposure filter, or the filtering
step can be skipped. Frame sums of already aligned frames can be recalculated using the program
Summovie (Supplementary file 2), which is also available for download from the Grigorieff lab web page
(http://grigoriefflab.janelia.org/unblur). The filter constants (Equation 3) are not user accessible but can
easily be changed in the source code if needed.
4178 DLP particles were picked manually from the aligned movie sums, and extracted into 1024 ×1024 boxes. Filtered amplitude spectra were calculated for each particle and were used to estimate
the defocus and astigmatism values on a per-particle basis using the FindCTF program of the TIGRIS
package (http://tigris.sourceforge.net/). TIGRIS consists of a set of programs for single-particle image
analysis, including algorithms for CTF determination and correction, image alignment and
classification, 3D reconstruction and a fully-featured display. FindCTF attempts to determine the
optimal defocus parameters by maximizing the correlation between an amplitude spectra and
Grant and Grigorieff. eLife 2015;4:e06980. DOI: 10.7554/eLife.06980 15 of 19
Tools and resources Biophysics and structural biology
a theoretical CTF, first performing a brute-force parameter search followed by downhill simplex
optimization. Particles were then individually motion corrected using the Unblur algorithm on particles
boxed from individual frames. An initial model was calculated from a single DLP image using Angular-
Reconstitution in the IMAGIC package (van Heel et al., 1996). Initial parameters were obtained on
images resampled to 8 A per pixel via Fourier cropping, which were aligned to the initial model with
the brute force alignment program of the TIGRIS package. This alignment finds the highest
cross-correlation peak across a specified set of in-plane rotations (in this case every 1˚) of reference
projections (in this case projections of the model sampled at every 5˚). These parameters were further
refined using Frealign v9 (Lyumkis et al., 2013) using data sampled at 1.023 A per pixel, and using
information between 200 A and 15 A.
In order to increase the signal present in the raw frames, 3-frame sums of the motion corrected
particles were calculated, and these sub-sums were individually refined using Frealign again using data
between 200 A and 15 A. Individual reconstructions were calculated from each set of 3 frame sums,
providing 43 individual DLP reconstructions at increasing exposure. Frealign outputs two half map
reconstructions used for calculating an FSC curve. For the two half maps of each of the 43
reconstructions, additional 13-fold averaging of the VP6 trimer was performed using the AVE program
(Kleywegt and Read, 1997) and matrices derived from the asymmetric unit of the previously published
3.8 A crystal structure of the DLP (McClain et al., 2010). The resulting VP6 half maps were masked with
a soft-shaped mask and used to calculate FSC curves, resulting in 43 curves (e.g., Figure 3C) each
corresponding to a different exposure, which were used for the critical exposure estimation.
In order to obtain the highest resolution reconstruction, subsets of frames were manually selected
and a trial and error approach resulted in the determination that refinement using the sum of frames
4–21 and again the resolution range of 200 A to 15 A resulted in the highest resolution reconstruction
as determined by the FSC between two half maps masked with a soft-shaped mask. The resulting
resolution as determined by the 0.143 cut-off (Rosenthal and Henderson, 2003) was 2.59 A
(Figure 2A). Maps were rendered using UCSF Chimera (Pettersen et al., 2004). To render specific
sections of a map, a zone including specified amino acid residues within the fitted atomic model was
defined, and the only densities within a radius of 3 A of the zone were displayed (command ‘zone’ in
Chimera). Furthermore, disconnected density was removed from the display (command ‘hide dust’ in
Chimera) in maps shown in Figures 2A, 6 (except for the first panel), and Figure 7A.
An initial fit of a previously determined crystal structure (Mathieu et al., 2001) fit well for the
majority of the structure; however, it was clear that some regions needed adjustment, and therefore,
real-space refinement was carried out in Coot (Emsley et al., 2010) exploiting all restraints. As a
further validation, the resulting model was converted into a density map using the UCSF Chimera
package (Pettersen et al., 2004) specifying 2.5 A resolution, and an FSC curve between this density
map and the optimum reconstruction was calculated (Figure 2A). The resolution as determined by the
0.5 cut-off (Rosenthal and Henderson, 2003) was 2.72 A.
Analysis of the 20S proteasome data setAligned micrographs were downloaded from the EMPIAR database (EMPIAR-10023), particle locations,
and estimated defocus parameters corresponding to the best published reconstruction (Campbell
et al., 2015) were kindly provided by the authors. Particle sums corresponding to 12.6 e−/A2, 19.6 e−/A2,
and the total sum of 53 e−/A2 were calculated, along with particle sums for the whole 53 e−/A2 weighted
with the exposure filter. Signal-limited particle sums were created as follows. First an area devoid of
particles was selected from each movie sum. These were then extracted from movie sums
corresponding to 12.6 e−/A2, 19.6 e−/A2, and 53 e−/A2 weighted with the exposure filter. Particle
sums corresponding to each of these total exposures were then added to the empty area corresponding
to the movie sum they were extracted from.
Class averages were generated using MSA within IMAGIC and the exposure-filtered particles.
∼10 of these class averages were manually selected and given as input to e2initialmodel.py from the
EMAN2 package (Tang et al., 2007) to generate an initial model. This initial model was used as
a starting model for all subsequent refinements. Processing for all data sets followed the following
procedure. Particles sampled to a 5.3 A pixel size were aligned to the initial model using the TIGRIS
brute-force alignment program. These initial parameters were then refined using Frealign, starting
with a resolution cut-off of 10 A and gradually increasing to a resolution cut-off of 5 A for the final
Grant and Grigorieff. eLife 2015;4:e06980. DOI: 10.7554/eLife.06980 16 of 19
Tools and resources Biophysics and structural biology

rounds. For all reconstructions, FSCs were calculated between the Frealign output half maps after first
masking with a soft-shaped mask.
AcknowledgementsThe authors thank Stephen Harrison and members of his laboratory for rotavirus DLPs and for
comments on the manuscript, Axel Brilot for providing access to frozen DLP grids, Peter Rosenthal for
comments on the manuscript, and Alexis Rohou for many valuable discussions and comments on the
manuscript. The 20S proteasome data were collected at the National Resource for Automated
Molecular Microscopy, which is supported by a grant GM103310 from the National Institute of
General Medical Sciences. We thank Melody Campbell for supplying the particle coordinates used in
our proteasome tests.
Additional information
Funding
Funder Grant reference Author
Howard Hughes MedicalInstitute (HHMI)
Timothy Grant, NikolausGrigorieff
National Institute of GeneralMedical Sciences (NIGMS)
GM103310 Nikolaus Grigorieff
The funders had no role in study design, data collection and interpretation, or thedecision to submit the work for publication.
Author contributions
TG, Conception and design, Acquisition of data, Analysis and interpretation of data, Drafting or
revising the article; NG, Conception and design, Analysis and interpretation of data, Drafting or
revising the article
Additional filesSupplementary files
·Supplementary file 1. Archive containing the program Unblur. It contains the program precompiled
for use on a Linux 64-bit system and source code. This archive and future updates are also available for
download from the Grigorieff lab web page (http://grigoriefflab.janelia.org/unblur).DOI: 10.7554/eLife.06980.012
· Supplementary file 2. Archive containing the program Summovie. It contains the program
precompiled for use on a Linux 64-bit system and source code. This archive and future updates are
also available for download from the Grigorieff lab web page (http://grigoriefflab.janelia.org/unblur).DOI: 10.7554/eLife.06980.013
Major datasetsThe following datasets were generated:
Author(s) Year Dataset titleDataset IDand/or URL
Database, license, andaccessibility information
Grant T,Grigorieff N
2015 Single particle cryo-EMstructure of rotavirus VP6 at2.6 Angstrom resolution
http://www.rcsb.org/pdb/explore/explore.do?structureId=3J9S
Publicly available at RCSBProtein Data Bank(Accession No. 3J9S).
Grant T,Grigorieff N
2015 Single particle cryo-EMstructure of rotavirus VP6 at2.6 Angstroms resolution
http://www.ebi.ac.uk/pdbe/entry/emdb/EMD-6272
Publicly available at ElectronMicroscopy Data Bank(Accession No. 6272).
ReferencesAllegretti M, Mills DJ, McMullan G, Kuhlbrandt W, Vonck J. 2014. Atomic model of the F420-reducing [NiFe]hydrogenase by electron cryo-microscopy using a direct electron detector. eLife 3:e01963. doi: 10.7554/eLife.01963.
Grant and Grigorieff. eLife 2015;4:e06980. DOI: 10.7554/eLife.06980 17 of 19
Tools and resources Biophysics and structural biology
Baker LA, Smith EA, Bueler SA, Rubinstein JL. 2010. The resolution dependence of optimal exposures in liquidnitrogen temperature electron cryomicroscopy of catalase crystals. Journal of Structural Biology 169:431–437.doi: 10.1016/j.jsb.2009.11.014.
Bartesaghi A, Matthies D, Banerjee S, Merk A, Subramaniam S. 2014. Structure of β-galactosidase at 3.2-Aresolution obtained by cryo-electron microscopy. Proceedings of the National Academy of Sciences of USA 111:11709–11714. doi: 10.1073/pnas.1402809111.
Brilot AF, Chen JZ, Cheng A, Pan J, Harrison SC, Potter CS, Carragher B, Henderson R, Grigorieff N. 2012. Beam-induced motion of vitrified specimen on holey carbon film. Journal of Structural Biology 177:630–637. doi: 10.1016/j.jsb.2012.02.003.
Campbell MG, Cheng A, Brilot AF, Moeller A, Lyumkis D, Veesler D, Pan J, Harrison SC, Potter CS, Carragher B,Grigorieff N. 2012. Movies of ice-embedded particles enhance resolution in electron cryo-microscopy. Structure20:1823–1828. doi: 10.1016/j.str.2012.08.026.
Campbell MG, Veesler D, Cheng A, Potter CS, Carragher B. 2015. 2.8 A resolution reconstruction of the Thermoplasmaacidophilum 20S proteasome using cryo-electron microscopy. eLife 4:e06380. doi: 10.7554/eLife.06380.
Cheng Y, Grigorieff N, Penczek PA, Walz T. 2015. A primer to single-particle cryo-electron microscopy. Cell 161:438–449. doi: 10.1016/j.cell.2015.03.050.
Conway JF, Trus BL, Booy FP, Newcomb WW, Brown JC, Steven AC. 1993. The effects of radiation damage on thestructure of frozen hydrated HSV-1 capsids. Journal of Structural Biology 111:222–233. doi: 10.1006/jsbi.1993.1052.
Emsley P, Lohkamp B, Scott WG, Cowtan K. 2010. Features and development of Coot. Acta Crystallographica.Section D, Biological Crystallography 66:486–501. doi: 10.1107/S0907444910007493.
Estrozi LF, Settembre EC, Goret G, McClain B, Zhang X, Chen JZ, Grigorieff N, Harrison SC. 2013. Location of thedsRNA-dependent polymerase, VP1, in rotavirus particles. Journal of Molecular Biology 425:124–132. doi: 10.1016/j.jmb.2012.10.011.
Faruqi AR, Henderson R. 2007. Electronic detectors for electron microscopy. Current Opinion in Structural Biology17:549–555. doi: 10.1016/j.sbi.2007.08.014.
Fioravanti E, Vellieux FMD, Amara P, Madern D, Weik M. 2007. Specific radiation damage to acidic residues andits relation to their chemical and structural environment. Journal of Synchrotron Radiation 14:84–91. doi: 10.1107/S0909049506038623.
Fromm SA, Bharat TAM, Jakobi AJ, Hagen WJH, Sachse C. 2015. Seeing tobacco mosaic virus through directelectron detectors. Journal of Structural Biology 189:87–97. doi: 10.1016/j.jsb.2014.12.002.
Glaeser RM. 1971. Limitations to significant information in biological electron microscopy as a result of radiationdamage. Journal of Ultrastructure Research 36:466–482. doi: 10.1016/S0022-5320(71)80118-1.
Glaeser RM, McMullan G, Faruqi AR, Henderson R. 2011. Images of paraffin monolayer crystals with perfectcontrast: minimization of beam-induced specimen motion. Ultramicroscopy 111:90–100. doi: 10.1016/j.ultramic.2010.10.010.
Grigorieff N. 2000. Resolution measurement in structures derived from single particles. Acta Crystallographica.Section D, Biological Crystallography 56:1270–1277. doi: 10.1107/S0907444900009549.
Grigorieff N, Harrison SC. 2011. Near-atomic resolution reconstructions of icosahedral viruses from electron cryo-microscopy. Current Opinion in Structural Biology 21:265–273. doi: 10.1016/j.sbi.2011.01.008.
Hayward SB, Glaeser RM. 1979. Radiation damage of purple membrane at low temperature. Ultramicroscopy 04:201–210. doi: 10.1016/S0304-3991(79)90211-0.
Henderson R. 1995. The potential and limitations of neutrons, electrons and X-rays for atomic resolutionmicroscopy of unstained biological molecules. Quarterly Reviews of Biophysics 28:171–193. doi: 10.1017/S003358350000305X.
Henderson R, Chen S, Chen JZ, Grigorieff N, Passmore LA, Ciccarelli L, Rubinstein JL, Crowther RA, Stewart PL,Rosenthal PB. 2011. Tilt-pair analysis of images from a range of different specimens in single-particle electroncryomicroscopy. Journal of Molecular Biology 413:1028–1046. doi: 10.1016/j.jmb.2011.09.008.
Kleywegt GJ, Read RJ. 1997. Not your average density. Structure 5:1557–1569. doi: 10.1016/S0969-2126(97)00305-5.
Li X, Mooney P, Zheng S, Booth CR, Braunfeld MB, Gubbens S, Agard DA, Cheng Y. 2013. Electron counting andbeam-induced motion correction enable near-atomic-resolution single-particle cryo-EM. Nature Methods 10:584–590. doi: 10.1038/nmeth.2472.
Liao M, Cao E, Julius D, Cheng Y. 2013. Structure of the TRPV1 ion channel determined by electron cryo-microscopy. Nature 504:107–112. doi: 10.1038/nature12822.
Lyumkis D, Brilot AF, Theobald DL, Grigorieff N. 2013. Likelihood-based classification of cryo-EM images usingFREALIGN. Journal of Structural Biology 183:377–388. doi: 10.1016/j.jsb.2013.07.005.
Mathieu M, Petitpas I, Navaza J, Lepault J, Kohli E, Pothier P, Prasad BV, Cohen J, Rey FA. 2001. Atomic structureof the major capsid protein of rotavirus: implications for the architecture of the virion. The EMBO Journal 20:1485–1497. doi: 10.1093/emboj/20.7.1485.
McClain B, Settembre E, Temple BRS, Bellamy AR, Harrison SC. 2010. X-ray crystal structure of the rotavirus innercapsid particle at 3.8 A resolution. Journal of Molecular Biology 397:587–599. doi: 10.1016/j.jmb.2010.01.055.
McMullan G, Faruqi AR, Clare D, Henderson R. 2014. Comparison of optimal performance at 300keV of threedirect electron detectors for use in low dose electron microscopy. Ultramicroscopy 147:156–163. doi: 10.1016/j.ultramic.2014.08.002.
Milazzo A-C, Leblanc P, Duttweiler F, Jin L, Bouwer JC, Peltier S, Ellisman M, Bieser F, Matis HS, Wieman H, DenesP, Kleinfelder S, Xuong N-H. 2005. Active pixel sensor array as a detector for electron microscopy.Ultramicroscopy 104:152–159. doi: 10.1016/j.ultramic.2005.03.006.
Grant and Grigorieff. eLife 2015;4:e06980. DOI: 10.7554/eLife.06980 18 of 19
Tools and resources Biophysics and structural biology
Pettersen EF, Goddard TD, Huang CC, Couch GS, Greenblatt DM, Meng EC, Ferrin TE. 2004. UCSF Chimera–avisualization system for exploratory research and analysis. Journal of Computational Chemistry 25:1605–1612.doi: 10.1002/jcc.20084.
Rosenthal PB, Henderson R. 2003. Optimal determination of particle orientation, absolute hand, and contrast loss insingle-particle electron cryomicroscopy. Journal of Molecular Biology 333:721–745. doi: 10.1016/j.jmb.2003.07.013.
Ruskin RS, Yu Z, Grigorieff N. 2013. Quantitative characterization of electron detectors for transmission electronmicroscopy. Journal of Structural Biology 184:385–393. doi: 10.1016/j.jsb.2013.10.016.
Scheres SH. 2014. Beam-induced motion correction for sub-megadalton cryo-EM particles. eLife 3:e03665. doi: 10.7554/eLife.03665.
Sindelar CV, Grigorieff N. 2012. Optimal noise reduction in 3D reconstructions of single particles using a volume-normalized filter. Journal of Structural Biology 180:26–38. doi: 10.1016/j.jsb.2012.05.005.
Stark H, Zemlin F, Boettcher C. 1996. Electron radiation damage to protein crystals of bacteriorhodopsin atdifferent temperatures. Ultramicroscopy 63:75–80. doi: 10.1016/0304-3991(96)00045-9.
Street JE, Croxson MC, Chadderton WF, Bellamy AR. 1982. Sequence diversity of human rotavirus strainsinvestigated by northern blot hybridization analysis. Journal of Virology 43:369–378.
Tang G, Peng L, Baldwin PR, Mann DS, Jiang W, Rees I, Ludtke SJ. 2007. EMAN2: an extensible image processingsuite for electron microscopy. Journal of Structural Biology 157:38–46. doi: 10.1016/j.jsb.2006.05.009.
Unwin PN, Henderson R. 1975. Molecular structure determination by electron microscopy of unstained crystallinespecimens. Journal of Molecular Biology 94:425–440. doi: 10.1016/0022-2836(75)90212-0.
van Heel M, Harauz G. 1986. Resolution criteria for three-dimensional reconstruction. Optik 73:119–122.van Heel M, Harauz G, Orlova EV, Schmidt R, Schatz M. 1996. A new generation of the IMAGIC image processingsystem. Journal of Structural Biology 116:17–24. doi: 10.1006/jsbi.1996.0004.
Wolf M, Garcea RL, Grigorieff N, Harrison SC. 2010. Subunit interactions in bovine papillomavirus. Proceedings ofthe National Academy of Sciences of USA 107:6298–6303. doi: 10.1073/pnas.0914604107.
Wong W, Bai X, Brown A, Fernandez IS, Hanssen E, Condron M, Tan YH, Baum J, Scheres SHW. 2014. Cryo-EMstructure of the Plasmodium falciparum 80S ribosome bound to the anti-protozoan drug emetine. eLife 3:e03080. doi: 10.7554/eLife.03080.
Yalcin S, Gurler O, Gultekin A, Gundogdu O. 2006. An analytical expression for electron elastic scattering crosssection from atoms and molecules in 1.0 keV to 1.0 MeV energy range. Physics Letters A 356:138–145. doi: 10.1016/j.physleta.2006.04.037.
Zhang X, Settembre E, Xu C, Dormitzer PR, Bellamy R, Harrison SC, Grigorieff N. 2008. Near-atomic resolutionusing electron cryo-microscopy and single particle reconstruction. Proceedings of the National Academy ofSciences of USA 105:1867–1872. doi: 10.1073/pnas.0711623105.
Grant and Grigorieff. eLife 2015;4:e06980. DOI: 10.7554/eLife.06980 19 of 19
Tools and resources Biophysics and structural biology


![Solutions Based on Particle Swarm Optimization for Optimal ...linear constrained optimization problems derived from the hybrid optimal control problems [10], a general deterministic](https://img.pdfslide.net/doc/110x75/5f0228c87e708231d402dd83/solutions-based-on-particle-swarm-optimization-for-optimal-linear-constrained.jpg)