Embed Size (px)
Citation preview

Hosted by
An ROI-focused technology research and advisory firm.
We deliver ongoing advice, analysis, and modeling tools to help senior management quantify and prove the financial and business benefit their technology decisions bring to the corporation.
Research centers in Boston, Paris, and London.
About Nucleus Research

Hosted by
3% ROI?

Hosted by
23% ROI?

Hosted by
323% ROI?

Hosted by
4323% ROI?

Hosted by
Agenda
Identifying ROI
potential
Scoring the potential
Why measure
Calculations
Assessing benefits and
costs
The final steps
Hosted by
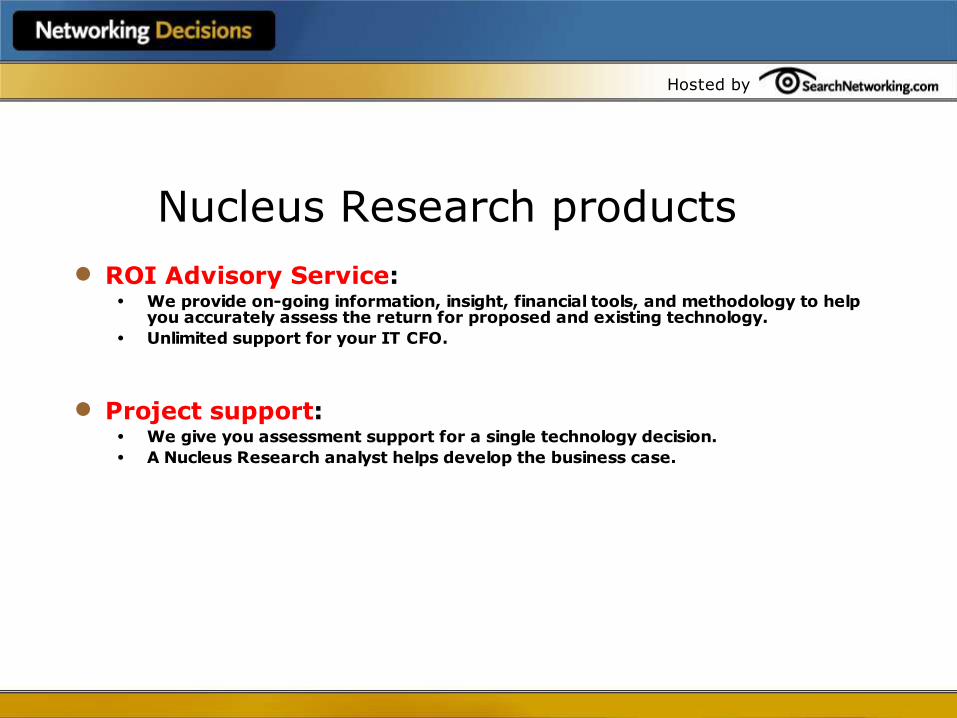
Nucleus Research products ROI Advisory Service:
• We provide on-going information, insight, financial tools, and methodology to help you accurately assess the return for proposed and existing technology.
• Unlimited support for your IT CFO.
Project support:• We give you assessment support for a single technology decision. • A Nucleus Research analyst helps develop the business case.
Hosted by
Clients

Hosted by
Let’s look at ROI…

Hosted by
The hard fact of technologyIf an application doesn’t generate a positive return, you shouldn’t have deployed it.
Deploying too many applicationswith a negative ROI (that can’t be blamed on others) can get the CIO fired.

Hosted by
Shiny object syndrome
Sometimes the best ROI is to let go!But how do you decide when to hold on?
Hosted by
The ROI from Wireless LANs
Increased productivity
Increased flexibility
Reduced network costs
Lower support costs

Hosted by
Five factors to consider when measuring the potential return

Hosted by
Factor 1 - Breadth
Does it impact a lot of people or only a few?
The greater the breadth of the application, the higher the potential return.
Hosted by
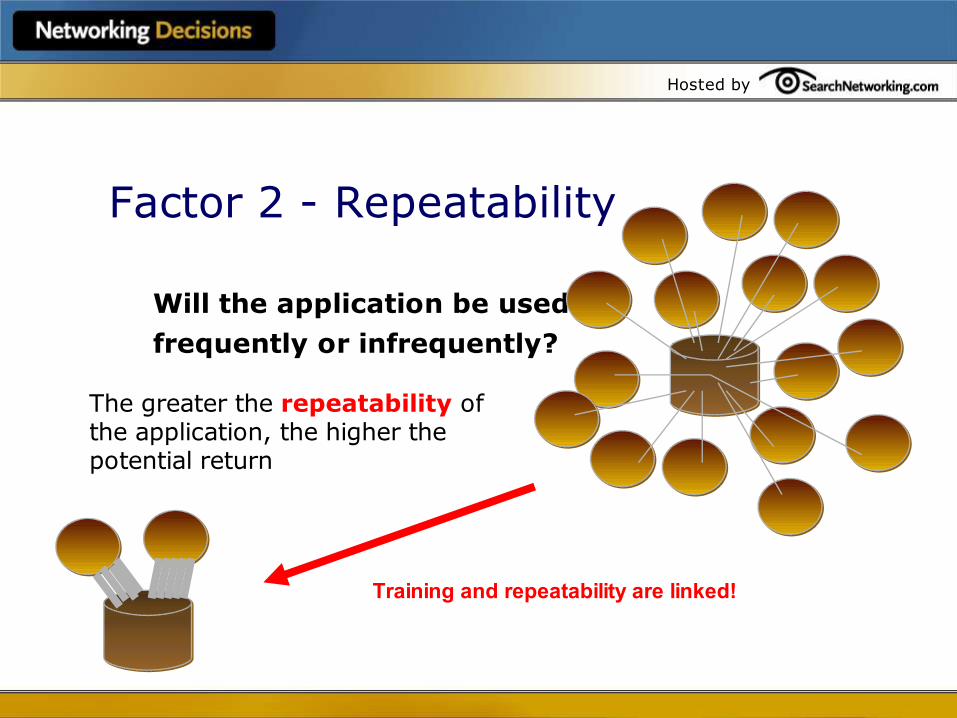
Factor 2 - Repeatability
Will the application be used frequently or infrequently?
The greater the repeatability of the application, the higher the potential return
Training and repeatability are linked!

Hosted by
Factor 3 - Cost
Is this a costly or relatively inexpensive task?
The greater the cost of the task, or the greater the benefit, the higher the potential return.
Workflow for new drug submission
Workflow for ordering new business cards

Hosted by
Factor 4 - CollaborationDoes this task involve collaboration among groups?
The greater the collaboration component of the task, the higher the potential return.
Individual information retrieval
Group discussion around information creation

Hosted by
Factor 5 - Knowledge
Will this task involve management of keyinformation?
The greater the use of knowledge management the higher the potential return.
Corporate sales customer information base
Daily cafeteria menu
Hosted by
Applying the factors to Wireless LANs
Breadth• Number of users?
• Partners or customers?
Repeatability• E-mail only?
• Sales/targeted use?
Cost• Replace, supplement, or displace?
Hosted by
Measuring Technology

Hosted by
Why use financial measurements?Old Days
Choice was limited and
the value was obvious.
Siebel Oracle
Interoffice mail email
Today
You have many choices,
often replacing current
strategies.
Decision must be based
on sound business
criteria.

Hosted by
Where to focus efforts?
Can you identify the areas that deliver maximum benefit?
Content management:
Benefit
0
102030
4050
607080
90
Paper Searching

Hosted by
Cost vs. benefit
Can you justify the upgrade or purchase decision?
• Will the company get back more than it spends?
• Did I get a fair price based on the benefits?
• Can I prove this to management?
• Can I prove this to the shareholders?

Hosted by
Prioritize projectsROI Payback
Project A 345% 18 months
Project D 128% 8 months
Project C 54% 1 month
Project B 120% 38 months
Project E 205% 19 months

Hosted by
Standard ROI process
FinancialResults
Category Assessment- Marketing materials- Trade pubs- Competition
Identify- Top areas of real benefit- Impact to company/group- Stakeholders
Quantify- Measure benefit areas- Confirm values - Survey - Direct observation - Estimate- Get benefit buy-in
Assess- Calculate Metrics- Reconfirm values- Perform sensitivity analysis- Assess expected case/worst case
Phase 1
Phase 3
Phase 2

Hosted by
Three steps to ROI:
IdentifyDefine the end result in financial terms and define the components that support the end result.
QuantifyMeasure the value of the application against the components.
AssessCalculate metrics and analyze the sensitivity of the results.

Hosted by
1) Identify the end result
Reduce time to market“Reduce the time to market for new products by 10%.”
Increase productivity“Provide tools that increase average worker productivity in marketing by 5%.”
Increase innovation“Increase the development of new products by 10% per year.”
Reduce cost“Reduce the cost of the accounting budget by 20%.”

Hosted by
1a) Identify components
Example: “Reduce time to market”
• Increase collaboration
• Provide efficient searching tools
• Streamline project management
• Automate common workflows
• Extend information base to suppliers and customers
• Include PR agency and outside contractors
• Integrate Marketing, Engineering, Sales, and Support

Hosted by
2) Quantify values
“Efficient searching tools will increase
productivity by 5%.”
“Project management tools are not
expected to change productivity.”
“Research base will increase re-use of information, resulting in a
reduction in personnel time of 10%.”
“Electronic assembly of project materials will reduce delivery
charges by $100,000.”

Hosted by
3) Assess results
Percentage of direct to indirect benefits
Reliance on one or two key benefits
Worst case
Payback and ROI
Alternatives
• Deployment strategies
• Lease vs. buy
• Other applications

Hosted by
The Calculations

Hosted by
Compare financial measurements to other internal
decisions and success factors
- NOT to the results of other companies!
Using financial measurements
Document Management?
Positive
ROI!

Hosted by
Short finance class…
Toolbox used to measure the value of technology:
• Net Present Value
• Payback Period
• Return on Investment
• IRR
• TCO
Hosted by
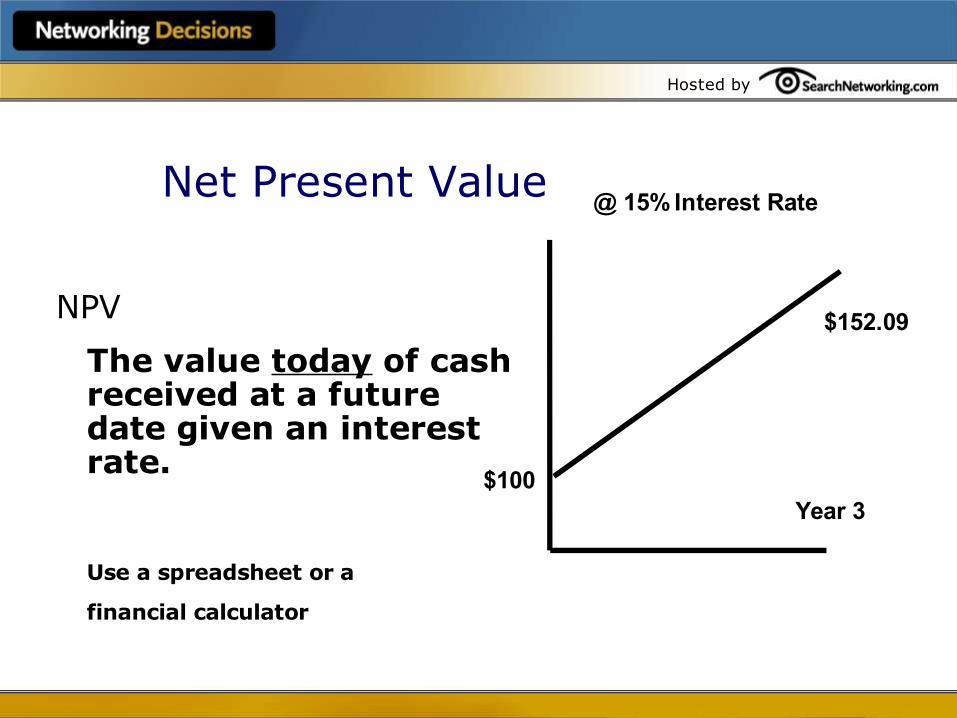
Net Present Value
NPV
The value today of cash received at a future date given an interest rate.
Use a spreadsheet or a
financial calculator
$100Year 3
$152.09
@ 15% Interest Rate
Hosted by
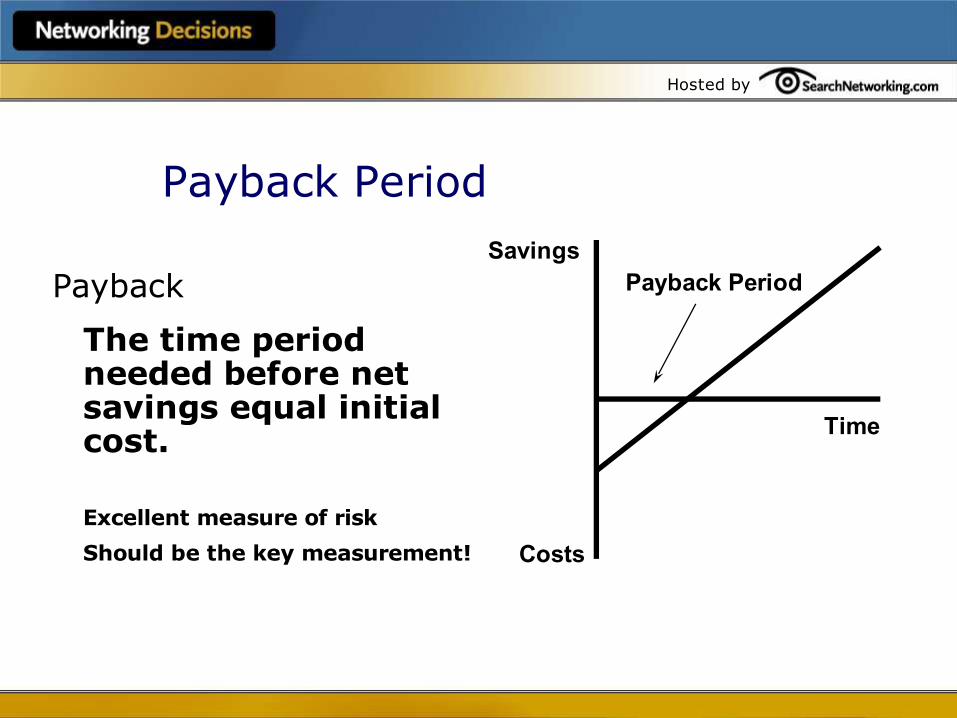
Payback Period
Payback
The time period needed before net savings equal initial cost.
Excellent measure of risk
Should be the key measurement!
Savings
Costs
Payback Period
Time

Hosted by
Payback and Risk
Payback indicates when ROI = 0
Short payback periods drive an aggressive deployment strategy:
Deploy today and – if necessary – discard tomorrow.
Value
Time

Hosted by
Return On Investment
ROI
The average total savings over 3 years divided by the cost.
Nucleus recommends a three year horizon but use a time period consistent with your organization’s standards.
(Year 1, Year 2, Year 3) / 3
Initial CostROI =

Hosted by
Internal Rate of Return
IRR
The interest rate that equates to the cash flows.
Never use IRR!
If you have to, use MIRR instead
$100
$199 $9
IRR = 100%
Year 1 Year 10
$100
$0 $102K
IRR = 100%
Year 1 Year 10

Hosted by
What about TCO?
Total Cost of Ownership looks at costs and ignores benefits.
• Good for comparing two similar applications
• Good for budgeting
• Bad for choosing applications
• Bad for prioritizing projects

Hosted by
What about the others? EVA - Economic Value Add(ed) is really ROI less the
cost of capital. It’s simple but eliminates an important ratio: Is an EVA=3% good or bad?
TEI - Total Economic Impact is really just ROI but explicitly includes direct and indirect benefits.
ROO - Return on Opportunity is TEI made fluffier.
ROA - Return on Assets is only interesting if there are sunk intangible costs.
cROI – False ROI inflated by vendor marketing folks.

Hosted by
Assessing costs and benefits
Hosted by
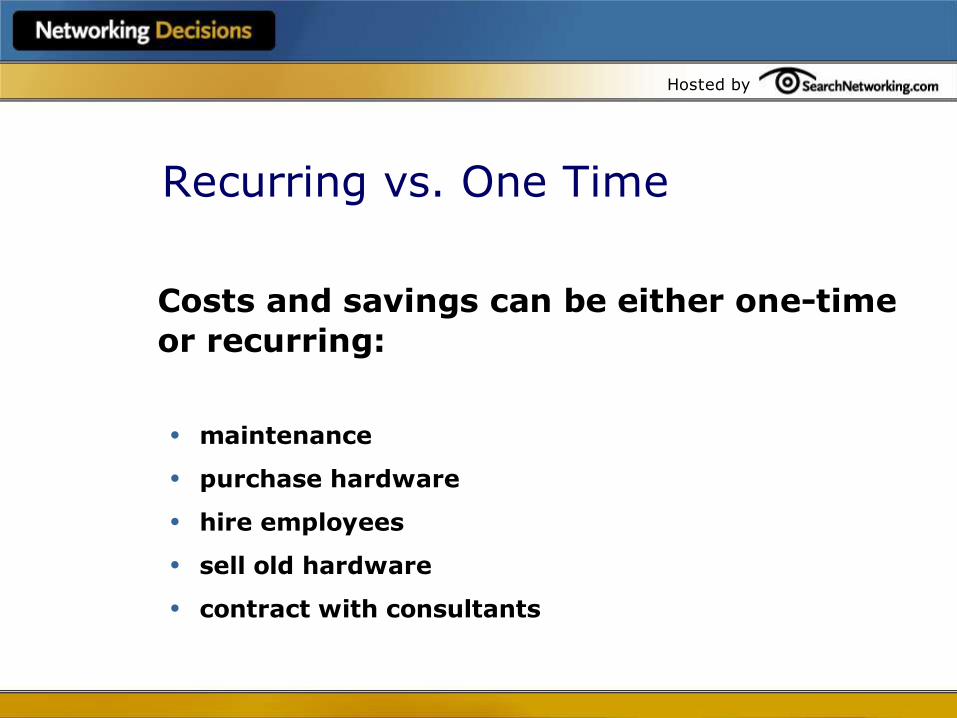
Recurring vs. One Time
Costs and savings can be either one-time or recurring:
• maintenance
• purchase hardware
• hire employees
• sell old hardware
• contract with consultants

Hosted by
Measuring costsBasic Rules
Count everything that is directly associated with the project.
(I purchased a web server for this project)
Don’t count infrastructure items not associated with the project.
(I used the existing web server)
Do count infrastructure items that were driven by the project.
(The company purchased a web server because of this project and two others like it - include 1/3 of the cost)
Hosted by
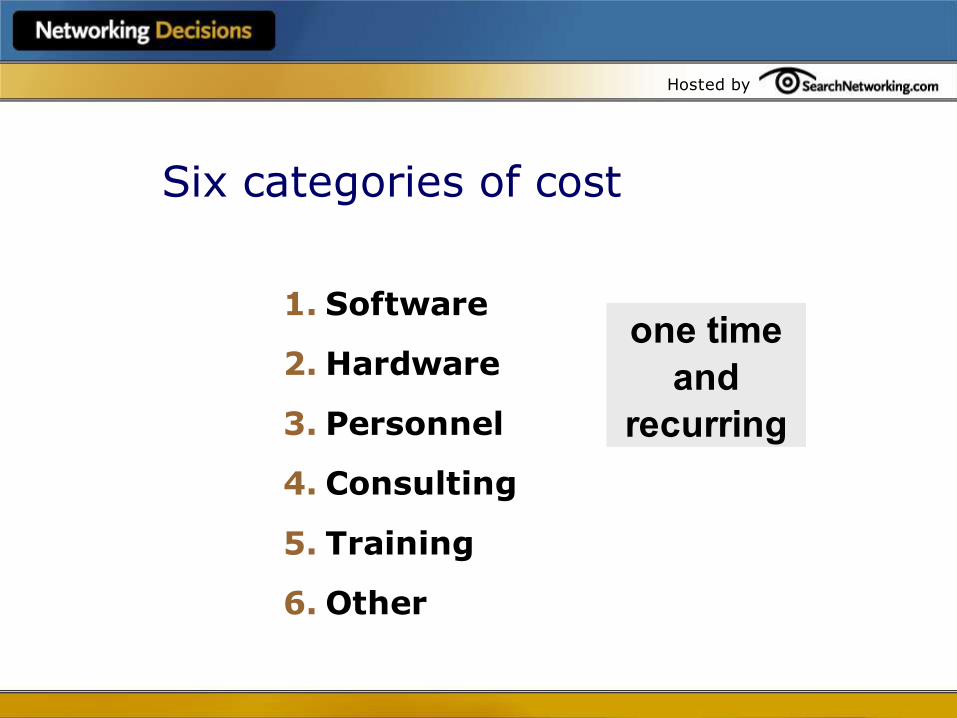
Six categories of cost
1. Software
2. Hardware
3. Personnel
4. Consulting
5. Training
6. Other
one timeand
recurring
Hosted by
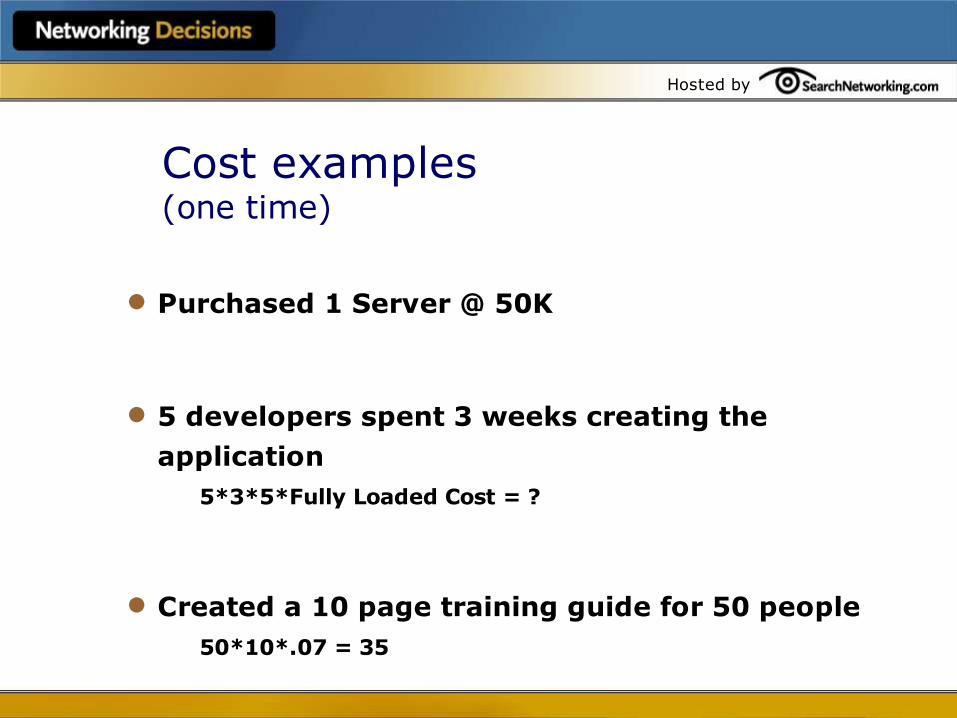
Cost examples (one time)
Purchased 1 Server @ 50K
5 developers spent 3 weeks creating the application
5*3*5*Fully Loaded Cost = ?
Created a 10 page training guide for 50 people50*10*.07 = 35

Hosted by
Cost examples (recurring)
Maintenance on the server is 5K per year.
The IS department has dedicated one-fifth of a person to maintaining the system.
I plan to hire consultants in years 2 and 3.

Hosted by
Measuring Benefit

Hosted by
Reduced the number of personnel.
Reduced costs to print and distribute the maintenance manual.
Avoided regulatory fines.
Reduced accounts receivable.
Reduced the cost to publish to the web.
Reduced travel costs.
Benefit examples - directly quantifiable
Hosted by
Benefit examples - productivity based
Reduced the time needed to
develop new software by 25%.
The financial audit takes 1 week
rather than 3 weeks.
Maintenance on an aircraft
takes 10% less time.
Increased software quality

Hosted by
Types of benefits
Believability
1st Order 2nd Order 3rd Order 4th Order
Direct savings- Reduction in cost
Indirect savings- Increase in worker productivity
Semi-direct savings- Expected reduction in cost
Very indirect savings- Increase in manager productivity
Hosted by
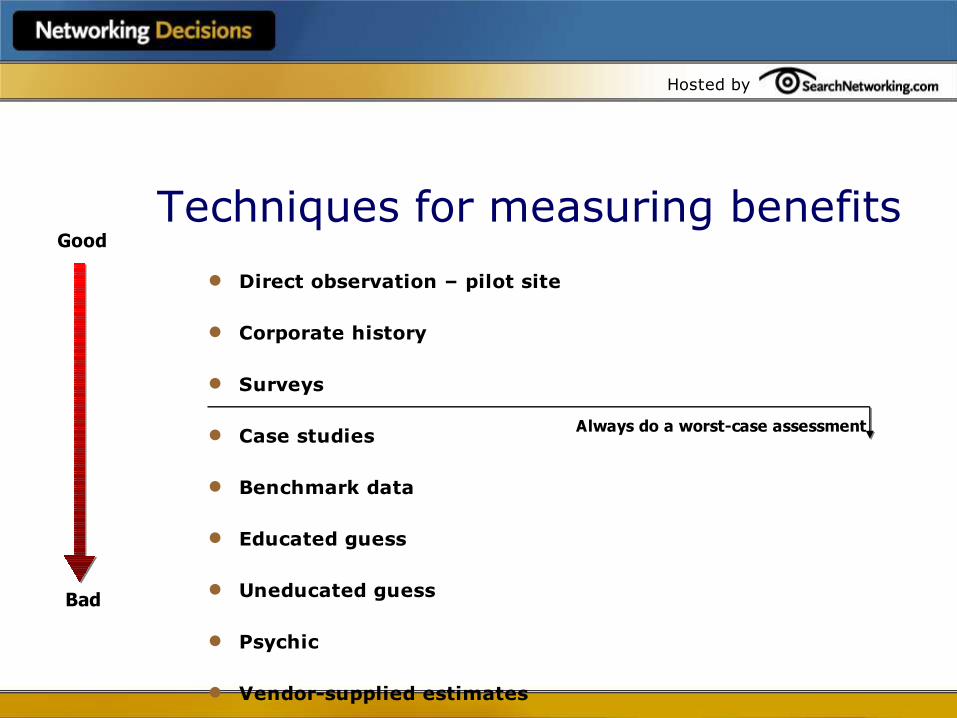
Techniques for measuring benefits
Direct observation – pilot site
Corporate history
Surveys
Case studies
Benchmark data
Educated guess
Uneducated guess
Psychic
Vendor-supplied estimates
Vendor ROI sales quick calculator
Good
Bad
Always do a worst-case assessment

Hosted by
Benefit achievabilityType of benefit
1st Order
2nd Order
3rd Order
4th Order
Measurement strategy
Observation Case studies Vendor calculatorEducated guess
Good
Caution Unlikely
Caution

Hosted by
Inefficient transfer of time
The fact of life: time saved does not equal time worked.
Use correction factors to adjust the estimate of time saved to a reasonable estimate of the value to the company.
Range from 0.1 to 1 to adjust time saved to time worked.
Hosted by
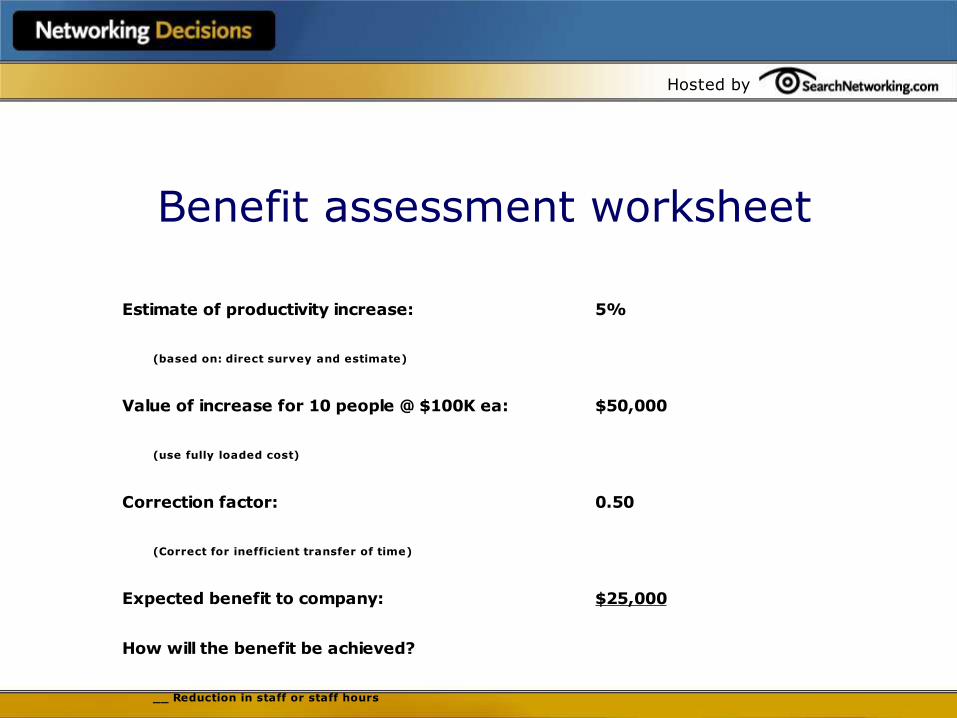
Benefit assessment worksheet
Estimate of productivity increase: 5%
(based on: direct survey and estimate)
Value of increase for 10 people @ $100K ea: $50,000
(use fully loaded cost)
Correction factor: 0.50
(Correct for inefficient transfer of time)
Expected benefit to company: $25,000
How will the benefit be achieved?
__ Reduction in staff or staff hours
__ Increase in productivity, limiting the need for more staff
__ Increase in profit to company
__ Gradual attrition over next 3 years (10%, 50%, 100%)
Worst-case benefit: $12,500
(In this case, assume 50% of initial estimate)

Hosted by
Benefit milestone
Commit to achievable milestones:
Target: $25,000 annual savings
Year 1: Reduce hourly cost by $2,500
Year 2: Reduce hourly cost by $12,500
Year 3: Reduce hourly cost by $25,000 or staff by 1 person
Assumption: No change in workload

Hosted by
Examples...

Hosted by
Example“The sales review process is shortened because instant updates are delivered to reviewers!”
How many steps in the review process?
Time saved at each step? (survey or direct observation)
Fully loaded cost per hour? (apply correction factor)

Hosted by
Example“We no longer need to send paper updates - we can deliver them electronically!”
Cost of printing and shipping each month?
Time saved by not updating? They may be goofing off so apply a correction factor!
Top-line productivity benefits?

Hosted by
Example“The software engineers were able to complete more work!”
What was the % growth in work?
What was the % growth in the department?
Calculate the # employees saved times the fully loaded
cost Didn’t need to hire so there is no one to goof off -- no correction factor.

Hosted by
Example“Providing access to information on the road increased productivity!”
Calculate time saved per employee Apply a correction factor!
Or
Calculate the impact on business profit• Sold more software?
• Repaired more aircraft?
• Wrote more insurance policies?
Hosted by
Example“Employees make better decisions and are happier!”
Great! (probably can’t count it)

Hosted by
The Tool
Hosted by
Fixing a negative ROI
Change the price!
Ramp costs with users
Reduce pre-start costsMoving cost out of the pre-start column increases ROI.
Evaluate productivityIs the correction factor aggressive?
Is the productivity benefit estimate too low?
Expand the opportunityCan you deploy to more people?
Hosted by
The right corporate ROI strategy includes:
Common metric for all projects. ROI and Payback
Standard correction factors for benefits.
Standard ROI tool and business case presentation.
Key personnel managing assessments armed with
information, case studies, benchmark data.

Hosted by
Summary
ROI from wireless LANs depend on applications, NOT technology.
Measuring ROI should be consistent and structured across your entire company.
Most successful deployments follow small steps rather than large-scale events.
Gauge the breadth and repeatability before you start.
Examine both expected and worst-case ROI.
The shorter the payback, the lower the risk.

Hosted by
Resources
Nucleus Research Web site:
www.NucleusResearch.com
Nucleus Research knowledge center Tutorial
B20 – ROI Quick Reference Guide
A11 – Managing Payback and Risk
A10 – Maximizing ROI
A21 – The Strengths and Weaknesses of TCO
A4 – Human Factors Impact Application Value