Embed Size (px)
Citation preview
© 2011 Macmillan Publishers Limited. All rights reserved.
nature photonics | VOL 5 | APRIL 2011 | www.nature.com/naturephotonics 189
focus | commentary
measuring the seemingly immeasurablerick trebino
this year celebrates the twentieth anniversary of frequency-resolved optical gating — the first and most general technique for measuring ultrashort laser pulses.
If measuring an event in time always requires a shorter one, how can the shortest possible event ever be measured?
This has been the dilemma facing laser scientists since the 1960s when laser pulses broke the nanosecond barrier and became the shortest technological events ever created — events that seemed impossible to measure.
Researchers quickly realized that the shortest event available was the pulse itself, which led to the birth of autocorrelation techniques in the late 1960s1. Autocorrelators split the pulse into two replicas, cross them in a nonlinear-optical medium such as a second-harmonic-generation (SHG) crystal, and then measure the second-harmonic pulse energy as a function of the relative delay between the two pulses. Second-harmonic light is only generated when the two pulse replicas overlap in time.
Autocorrelation techniques weren’t quite good enough, however, as the pulse was only as short as itself — not shorter.
Furthermore, they provided no information about the colour (phase variations) of the pulse. An interferometric autocorrelation technique was soon developed that yielded some phase information, but still not complete temporal information.
The measurement problem was solved in 1991 using a technique called frequency-resolved optical gating (FROG)2, which generates a spectrogram of the pulse by measuring the autocorrelator-generated second-harmonic spectrum as a function of the pulse delay (Fig. 1a). Mathematics was the key to the success of this technique; whereas traditional autocorrelation involves a highly ill-posed one-dimensional phase-retrieval problem, the mathematics
of FROG yields a well-behaved and well-posed two-dimensional phase-retrieval problem3. This is a consequence of a fascinating fact that image scientists had discovered only a few years earlier: one-dimensional phase retrieval fails because polynomials of one variable can always be factored, but two-dimensional phase retrieval succeeds because polynomials of two variables cannot. In other words, FROG can measure ultrashort pulses without a shorter event because the fundamental theorem of algebra fails for polynomials of two variables.
From a practical point of view, FROG does not require a shorter event than the pulse because short-time behaviour is resolved in the frequency domain through FROG’s spectral measurements.
Whereas autocorrelation yields a blurry, black and white picture of the pulse, FROG yields a high-resolution, full-colour image.
The main challenge in the development of FROG was to generate a fast and robust algorithm for retrieving pulses from
FROG
a b
Beam-splitter
Camera
Camera
Thin nonlinear
optical medium
Variabledelay
τ
λ GRENOUILLE
Fresnel biprism Thick nonlinear optical medium
0.5
0.4
0.3–20–40 –4040
–40 40
40200
–20 200
–20 200
Measured trace
Time domain Frequency domain
Retrieved trace
Wav
elen
gth
(µm
) 0.5
0.4
0.3Wav
elen
gth
(µm
)
0 1Delay (fs) Delay (fs)
Time (fs) Wavelength (nm)600 1,000800
Inte
nsity
Phas
e
π
–π
Spectrometer
Figure 1 | FROG and GRENOUILLE. a, Schematic of FROG and its simple variation ‘GRENOUILLE’, which replaces FROG’s beamsplitting, delaying and recombining optics with a simple Fresnel biprism and replaces the thin SHG crystal and spectrometer with a thick SHG crystal. b, FROG measurement of a 4.5 fs pulse. Note the excellent agreement between the measured and retrieved traces, which confirms the accuracy of the measurement. The red curve indicates intensity; blue: phase; green: spectrum; and violet: spectral phase. Figure b reproduced with permission from ref. 6, © 1998 OSA.
“the mathematics of FroG yields a well-behaved and well-posed two-dimensional phase retrieval problem”
© 2011 Macmillan Publishers Limited. All rights reserved.
190 nature photonics | VOL 5 | APRIL 2011 | www.nature.com/naturephotonics
commentary | focus
measured traces. This was solved by the use of the ‘generalized projections approach’, which can reliably retrieve extremely complex pulses3. In addition, the inherent speed of FROG, coupled with the vast increase in computer-processing speeds over the past twenty years, has brought typical pulse-retrieval times down to less than 50 ms.
Another challenge was to develop simple, inexpensive apparatus to suit the widespread deployment of FROG. This is important because complex measurement techniques are prone to error and are accessible only to those willing to invest considerable effort. Fortunately, an extremely simple version of FROG, known as GRENOUILLE (grating-eliminated no-nonsense observation of ultrafast incident laser light E-fields)4, has met this challenge. GRENOUILLE replaces the beamsplitter, delay line and beam-recombining optics with a single optical element — a Fresnel biprism — and replaces the thin SHG crystal and spectrometer with a thick SHG crystal (Fig. 1a).
The Fresnel biprism splits the pulse in two and crosses them in an automatically aligned configuration. It also introduces a delay to the transverse position, which eliminates the need for a delay line while also allowing for single-shot measurements. Because different colours are generated at different angles, the thick crystal not only performs the autocorrelation but also spectrally resolves the second-harmonic pulse — unlike the thin crystals used in autocorrelators and standard FROG set-
ups. Still in use in hundreds of laboratories across the globe, GRENOUILLE remained the world’s simplest pulse-measurement device until researchers realized that the Fresnel biprism and crystal could be combined in a single pentagonal SHG crystal, yielding an even simpler device for measuring few-picosecond pulses5.
FROG and GRENOUILLE have found many applications, the most important being for measuring the shortest laser pulses ever created. Figure 1b shows a FROG measurement of a 4.5 fs pulse — a world record at the time6. The ‘retrieved’ trace shown here is computed from the retrieved pulse intensity and phase, and can be used to ‘check’ the measured trace; if the measured and retrieved traces agree, the measurement is likely to be correct because the trace contains many more points than the pulse. This measurement corroboration — a rare privilege in optics — is important given the exotic nature of the events being measured.
FROG can be used to measure both simple and complex pulses, over a wide
range of wavelengths, averaged over many shots or on a single-shot basis3. As a result, FROG and its many variations have found many important applications. FROG has shown that material dispersion is generally the limiting factor when producing ultrafast laser pulses7; FROG also assesses complex-shaped pulses in telecommunications, achieves coherent control of chemical reactions8 and can even measure ultrabroadband supercontinua — arguably the most complex pulses ever generated9. Variations of FROG are also currently used to measure attosecond pulses10. In addition, using optical parametric amplification as the nonlinear effect, FROG has even been used to measure pulses comprising as little as ~100 photons11.
Interestingly, nearly forgotten in the effort to measure ever-shorter pulses were the many-picosecond to few-nanosecond pulses that inspired the field of pulse measurement in the first place. Such relatively long pulses (but still too short for traditional electronic techniques) have actually proven more challenging to measure than femtosecond pulses because they require thousands of times better spectral resolution and thousands of times longer delays. The required several-metre delay range has proven particularly challenging, especially because it must be accomplished for a single pulse and thus cannot involve averaging over many (potentially different) pulses. Fortunately, this problem was recently solved when researchers realized that an etalon can tilt the pulse by ~89.9° without distorting
x
λ
Camera
Cylindrical lens
Grating
Reference pulse
Unknown pulse
Lens
Fibres
a b
Measured field
Simulated field
–20
20
0
–20
20
0
100 –100
Tran
sver
se p
ositi
on (µ
m)
Time (fs) and propagation direction
–55 µm –45 µm –35 µm –25 µm –15 µm –5 µm 5 µm 15 µm 25 µmz =
789 nm 817 nm
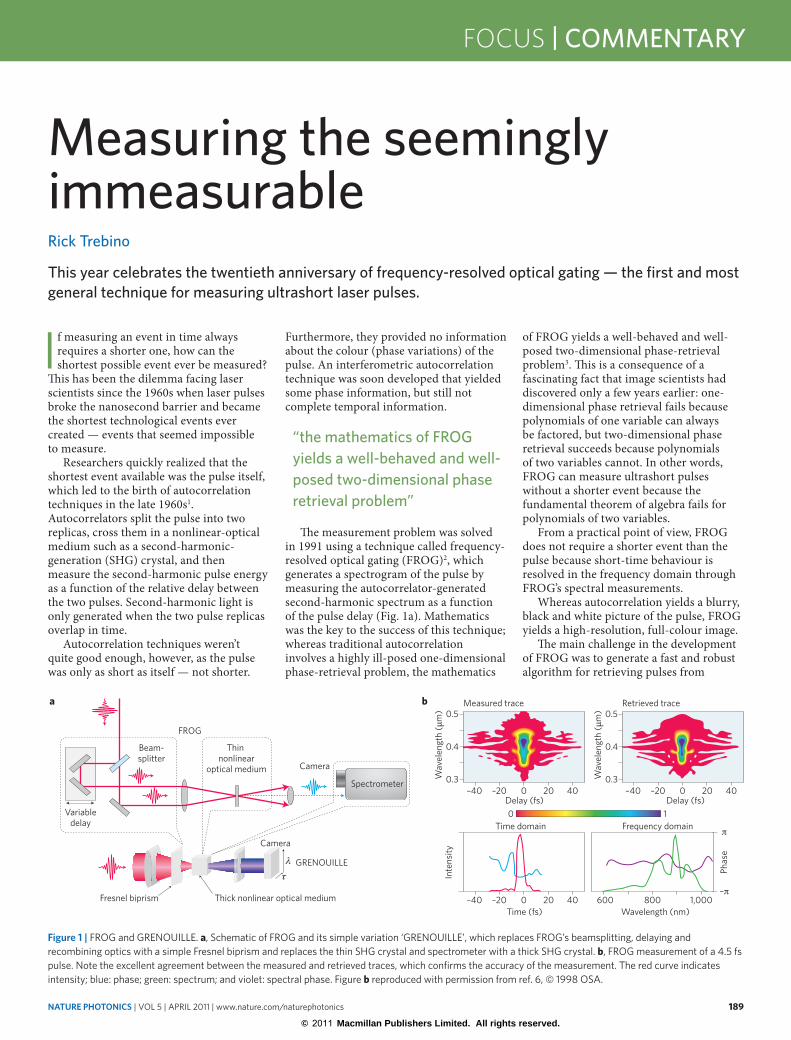
Figure 2 | SEA TADPOLE, a simple version of spectral interferometry. a, Experimental set-up. b, Spatiotemporal intensity and phase measurements of a focused pulse that has overfilled the lens and so generates a ‘fore-runner pulse’. Colour indicates the pulse phase, in terms of instantaneous frequency, at each point in space and time. Figure reproduced with permission from ref. 20, © 2008 OSA.
“FroG can be used to measure both simple and complex pulses, over a wide range of wavelengths, averaged over many shots or on a single- shot basis”
© 2011 Macmillan Publishers Limited. All rights reserved.
nature photonics | VOL 5 | APRIL 2011 | www.nature.com/naturephotonics 191
focus | commentary
it in time. Crossing two pulses tilted by ±89.9° yields the required delay range and is the basis of a simple nanosecond GRENOUILLE12, which has already proven to be very useful for measuring nanosecond pulses from high-power fibre lasers and coherently combining them into an even higher power beam.
Once the pulse has been measured, knowledge of its temporal intensity and phase allows it to be used as a reference for measuring even more challenging pulses or gaining complete spatiotemporal intensity and phase information. A particularly useful technique in this respect is spectral interferometry, which involves measuring the spectrum of the sum of the reference and unknown pulses. A simple Fourier-filtering inversion algorithm yields the unknown pulse13. Spectral interferometry does not require nonlinear optics, making it sensitive enough to measure pulses of less than one photon13. However, similarly to FROG, the challenge of this technique is to develop simple apparatus and a robust retrieval algorithm. Traditional spectral interferometry uses collinear beams, which significantly complicate the alignment
procedure. Furthermore, the algorithm used in spectral interferometry requires spectral fringes to be generated, thereby sacrificing most of the spectrometer’s spectral resolution and limiting this technique to use with relatively simple pulses.
Fortunately, spectral interferometry can also be performed using crossed beams and spatial fringes14, which can recover the full spectrometer resolution and are much easier to generate and align than spectral fringes. SEA TADPOLE (spatially encoded arrangement for temporal analysis by dispersing a pair of light E-fields) is
a recently developed simple version of spectral interferometry that uses this approach (Fig. 2a)15. SEA TADPOLE uses optical fibres for its input beams, which makes it easy to set up and maintain. Simple variations of this technique have been used to measure pulses with time–bandwidth products (how many peaks are in the pulse intensity; a measure of the pulse complexity) as large as 65,000 (ref. 16). This is comparable to the pulse complexities generated in the field of optical arbitrary-waveform generation — a new pulse-generation-and-measurement field in which researchers attempt to maximize pulse complexity17.
Using optical fibres as the input-pulse conduits for SEA TADPOLE is advantageous because it provides excellent spatial resolution, allowing the complete spatiotemporal intensity and phase of complex pulses to be measured with femtosecond temporal resolution and submicrometre spatial resolution. Spatiotemporal SEA TADPOLE measurements have directly demonstrated the boundary-wave picture of diffracting pulses18, proven the superluminal nature of Bessel pulses19 and confirmed the myriad of distortions predicted in focused ultrashort pulses20. Figure 2b shows SEA TADPOLE measurements of the complex spatiotemporal distortions near the focus of a pulse that has overfilled a lens, including the interesting ‘fore-runner pulse’.
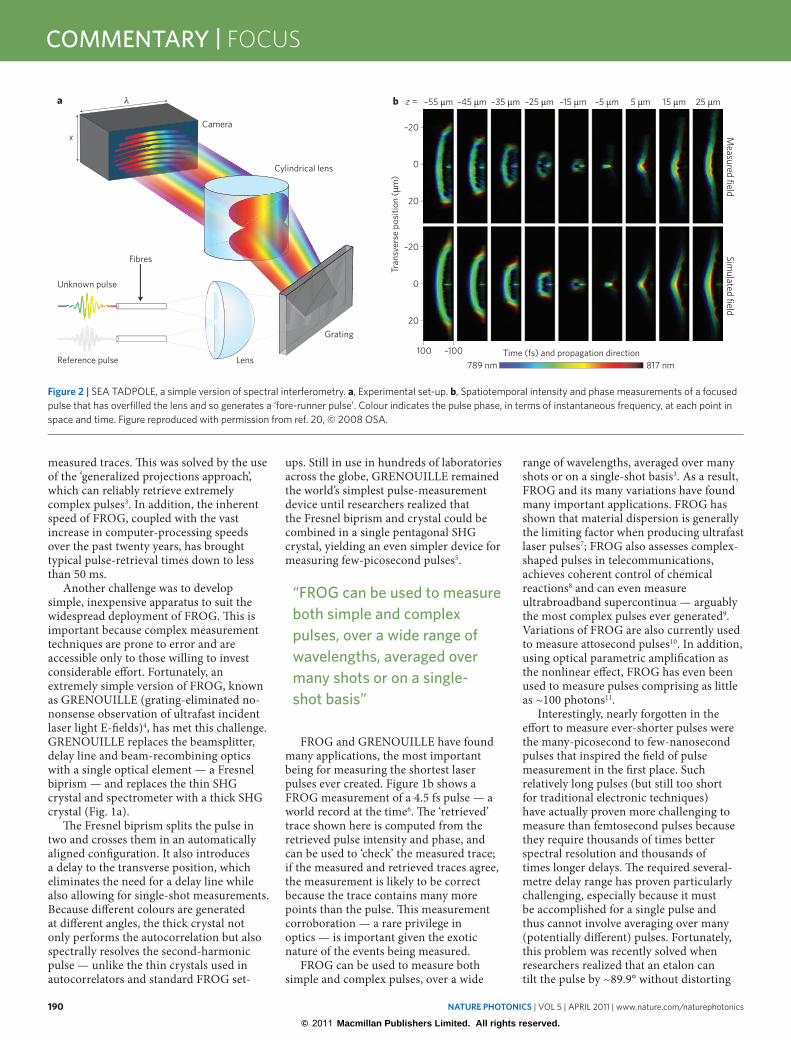
Because its input fibre must be scanned in space, spatiotemporal measurements using SEA TADPOLE are always multi-shot. Fortunately, a simple device called STRIPED FISH (spatially and temporally resolved intensity and phase evaluation device: full information from a single hologram) can perform spatiotemporal measurements on a single-shot basis (Fig. 3a). STRIPED FISH simultaneously generates a hologram for each wavelength in the pulse21, with each hologram yielding complete spatial intensity and phase information for that wavelength. All that is required is a FROG measurement of a spatially uniform (that is, spatially filtered) reference pulse.
STRIPED FISH generates its many holograms using a coarse grating that diffracts many pairs of beams onto a bandpass filter whose central wavelength depends on the angle of incident light. Because the coarse grating is slightly rotated with respect to the incident beams, it generates a tilted array of holograms that differ in colour (Fig. 3b).
STRIPED FISH provides single-shot intensity and phase information, in terms of both transverse spatial coordinates and
1.41.21.00.80.60.40.2
1.0
–1.0
0.5
–0.5–50
500 0x (mm)
Inte
nsity
(a.u
.)
t (fs)
ψ = 11.3 mrad 797 nm
775 nm
b
a
c
Reference pulse
Unknown pulse
Slightly rotated2D coarse grating
Manydi�erent coloured
hologramsVariable-wavelength
bandpass filterλ λ θ= ( )
Camera
Many beam pairs
Figure 3 | STRIPED FISH. a, Experimental set-up. A slightly rotated coarse grating generates multiple pairs of pulses, and a bandpass filter spectrally selects each pair. Central frequencies of the bandpass depend on the angle of incidence, thereby creating individual holograms for each wavelength present. Together with a FROG-measured reference pulse, this simple device measures the complete spatiotemporal intensity and phase of an arbitrary pulse in a single shot. b, Theoretical STRIPED FISH trace. c, STRIPED FISH measurement of a pulse with spatiotemporal distortions. Colour indicates the instantaneous frequency. This measurement shows the complete pulse intensity and phase in x, y and time dimensions, but with a suppressed y-axis for displaying the data on a 2D surface. Figure reproduced with permission from ref. 23, © 2008 OSA.
“only a few challenges remain, the first being to extend spatiotemporal measurement techniques to attosecond timescales and shorter (extreme-UV and X-ray) wavelengths”
© 2011 Macmillan Publishers Limited. All rights reserved.
192 nature photonics | VOL 5 | APRIL 2011 | www.nature.com/naturephotonics
commentary | focus
frequency. Longitudinal spatial dependence can be obtained from the retrieved pulse using the diffraction integral, thus allowing this technique to uncover all the spatiotemporal information present in a single arbitrary pulse. Although STRIPED FISH is a new technique that has so far only been used to measure relatively simple pulses (Fig. 3c), it also has the potential to measure very complex pulses. Because cameras have millions of pixels, pulses with space–time–bandwidth products of up to ~1,000,000 can potentially be measured using STRIPED FISH.
Only a few challenges remain, the first being to extend spatiotemporal measurement techniques to attosecond timescales and shorter (extreme-UV and X-ray) wavelengths, although this is severely complicated by the lack of simple components such as beamsplitters and nonlinear media operating in these spectral regimes. Measuring extremely intense pulses is also a challenge, as the pulse must not vaporize the device that is attempting to measure it. At the other
extreme, measuring extremely weak pulses is challenging because they are usually too weak to exhibit nonlinear-optical effects, although progress has been made in the form of a nonlinear-optical waveguide-based FROG22.
Although the ability to measure pulses with space–time–bandwidth products of ~1,000,000 might seem sufficient for most purposes, pulses become significantly more complex when they interact with diffuse real-world media such as human tissue. Devices capable of measuring even more complex pulses would certainly find important applications across a broad range of fields. ❐
Rick Trebino is at the Georgia Institute of Technology, Swamp Optics, LLC, Atlanta, Georgia 30332, USA. e-mail: [email protected]
references1. Maier, M., Kaiser, W. & Giordmaine, J. A. Phys. Rev. Lett. 17,
1275–1277 (1966).2. Kane, D. J. & Trebino, R. in Opt. Soc. Am. Annual Meeting, post-
deadline session (1991).
3. Trebino, R. Frequency-resolved optical gating: The measurement of ultrashort laser pulses (Kluwer Academic, 2002).
4. O’Shea, P., Kimmel, M., Gu, X. & Trebino, R. Opt. Lett. 26, 932–934 (2001).
5. Cohen, J., Lee, D., Chauhan, V., Vaughan, P. & Trebino, R. Opt. Express 18, 17484–17497 (2010).
6. Baltuška, A., Pshenichnikov, M. S. & Wiersma, D. A. Opt. Lett. 23, 1474–1476 (1998).
7. Taft, G. et al. Opt. Lett. 20, 743–745 (1995).8. Ohno, K., Tanabe, T. & Kannari, F. J. Opt. Soc. Am. B 19,
2781–2790 (2002).9. Gu, X. et al. Opt. Lett. 27, 1174–1176 (2002).10. Mairesse, Y. & Quéré, F. Phys. Rev. A 71, 011401 (2005).11. Zhang, J. et al. Opt. Express 11, 601–609 (2003).12. Bowlan, P. & Trebino, R. Opt. Express 19, 1367–1377 (2011).13. Fittinghoff, D. N. et al. Opt. Lett. 21, 884–886 (1996).14. Misawa, K. & Kobayashi, T. Opt. Lett. 20, 1550–1552 (1995).15. Bowlan, P., Gabolde, P. & Trebino, R. Opt. Express 15, 10219–
10230 (2007).16. Cohen, J., Bowlan, P., Chauhan, V., Vaughan, P. & Trebino, R.
Opt. Express 18, 24451–24460 (2010).17. Cundiff, S. T. & Weiner, A. M. Nature Photon. 4, 760–766 (2010).18. Lõhmus, M. et al. Lith. J. Phys. 50, 69–74 (2010).19. Bowlan, P. et al. Opt. Lett. 34, 2276–2278 (2009).20. Bowlan, P., Fuchs, U., Trebino, R. & Zeitner, U. D. Opt. Express 16,
13663–13675 (2008).21. Gabolde, P. & Trebino, R. Opt. Express 14, 11460 (2006).22. Yang, S.-D., Weiner, A. M., Parameswaran, K. R. & Fejer, M. M.
Opt. Lett. 30, 2164–2166 (2005).23. Gabolde, P. J. Opt. Soc. Am. B 25, A25–A33 (2008).


![[Scenic China] The Immeasurable China](https://img.pdfslide.net/doc/110x75/54b8dd1d4a7959b7198b456b/scenic-china-the-immeasurable-china.jpg)