Embed Size (px)
Citation preview

Federation for American Immigration Reform | 1
Measuring the Trump Administration’s Top Immigration Issues by the Numbers By Spencer Raley, Madison McQueen and Jason Pena | June 2021
There are literally thousands of immigration-related statistics that can be used to assess the success or failure of a country’s immigration policy. This can make the prospect of analyzing the results of policy changes overwhelming. Because of that, FAIR has compiled and organized the most important and commonly requested immigration-related statistics from throughout the Trump administration. These figures demonstrate several things:
§ Policies such as the Migrant Protection Protocols (MPP) were tremendously helpful in deterring illegal immigration and reducing asylum fraud.
§ The administration largely removed the handcuffs from federal law enforcement agencies, as evidenced by the steady increase in apprehensions and deportations from U.S. Customs and Border Protection (CBP) and Immigration and Customs Enforcement (ICE).
§ While the Trump administration implemented numerous immigration policies that protected American workers and deterred illegal immigration, there were still many loopholes in existing policy that encouraged additional illegal immigration and protected the interests of large corporations over small business and American workers. As such, the illegal alien population grew considerably, as did the backlog of cases currently before an immigration judge.
§ The COVID-19 pandemic led to abnormally low immigration-related figures for FY 2020. While some of this improvement can indeed be attributed to positive policy change, such as placing a temporary pause on many guestworker visa categories, most are due to a weakened economy and international travel restrictions. Because of this, totals for this year should be considered with a grain of salt.
The statistics and figures in this report can serve as an important basis of comparison between the Trump and Biden administrations. President Biden immediately scaled back or eliminated almost every policy implementation from the Trump administration. Conventional wisdom would suggest that with the reversal of these policies, the positive statistical developments will likely

Federation for American Immigration Reform | 2
reverse as well. This is already evident with the development of an ongoing crisis at the southern border that developed soon after President Biden’s election.
CBP is one of the federal law enforcement agencies under the Department of Homeland Security (DHS). It is charged with enforcing U.S. regulations on customs, immigration and trade. The agency’s most extensive duties include protecting and patrolling all U.S. borders. Apprehensions refer to the temporary detainment of an individual suspected to be illegally present in the U.S. and typically results in an arrest. Apprehensions make up roughly 80 percent of all official CBP encounters at the Southern Border. The Trump administration saw a record number of apprehensions occur during FY 2019.1 This was due in large part to the booming economy in the United States, along with numerous mass-migration advocacy groups helping illegal aliens file bogus asylum claims. These apprehensions dropped significantly with the implementation of MPP, which required asylum applicants remain in Mexico while their cases were processed instead of being released into the country. Since the vast majority of asylum applications are found to have no merit, this discouraged individuals from making the long and dangerous trek to the United States. Apprehensions once again increased in early FY 2021, with nearly the entirety of the surge occurring after Joe Biden won the presidential election. The number of apprehensions at the southern border doubled in November 2020 (68,512 individuals) compared to November 2019 (33,524 individuals) and have been increasing ever since.2 In fact, FY 2021 will almost certainly see numbers higher than any year during the Trump administration.3 This is entirely the result of the Biden administration’s promises of amnesty, as well as the removal of all programs the Trump administration put into place to deter illegal immigration. Inadmissible aliens are those migrants encountered at ports of entry who are seeking lawful admission into the U.S. but are determined to be inadmissible. This encompasses a number of potential situations, including those who withdraw an application for admission and return to their countries of origin, and those who present inaccurate or insufficient documentation. The total number of inadmissible aliens encountered remained relatively static throughout the Trump administration, increasing by less than 15 percent between FY 2017 and FY 2019, before decreasing drastically in FY 2020.4 5 6 Again, as for many immigration-related statistics,
415,173
521,090
977,509
458,088
2,371,860
FY 2017
FY 2018
FY 2019
FY 2020
Total
CBP Apprehensions and Inadmissble Totals (Southern Border)

Federation for American Immigration Reform | 3
the drop in FY 2020 was due to a drastic decrease in crossings at the southern border. Inadmissible encounters were especially impacted since many who fall into this category are typically those who are attempting to enter the country on a short-term basis for reasons other than work. Since these kinds of admissions were largely paused during the COVID-19 pandemic, it makes sense that fewer individuals would attempt to enter the country for this purpose.
Total enforcement actions include both northern and southern border data, as well as actions by the Office of Field Operations (OFO) and the United States Border Patrol (USBP). Total enforcement actions for FY 2020 include Title 42 expulsions and Title 8 Apprehensions.7 Beginning in March 2020, the Trump administration ordered the expulsion of individuals who pose a potential health risk due to COVID-19, either by previously announced travel restrictions or because they unlawfully entered the country to bypass health screening measures. As a result, in accordance with Title 42 of U.S. Code Section 265, qualifying individuals would not be held in congregate areas for processing but rather be immediately expelled to the country of last transit. The number of total enforcement actions by CBP dropped in FY 2020 due to the coronavirus pandemic slowing activity at the southern border. However, encounters of unlawfully present or inadmissible migrants were rising in an alarming fashion prior to the COVID-19 era. This increase was primarily due to a growing number of migrants claiming asylum at the southern border. Between 2012 and 2020, the rate of denied asylum applications rose drastically from approximately 45 percent to more than 70 percent. This is due in part to the fact that, prior to the Trump administration’s implementation of MPP in late FY 2019, most asylum applicants were released into the country pending their court dates. A large number of these applicants never showed up for their proceedings, opting instead to disappear into the country. Since MPP eliminated most incentives for filing a bogus asylum claim by requiring applicants remain in a safe third-party country until their court proceedings take place, this contributed to the decrease in the number of claims made in the final year of the Trump administration.
526,901
683,178
1,148,024
646,822
3,004,925
FY 2017
FY 2018
FY 2019
FY 2020
Total
CBP Total Enfrocement Actions (Southern and Northern Border)

Federation for American Immigration Reform | 4
DHS combines data from both CBP and ICE.8 The DHS apprehension data is larger than the combined totals of ICE and CBP apprehensions. This is likely due to data corrections made by the DHS, arrests made by 287g affiliates, or apprehensions by other agencies which are then turned over to DHS.
The 287g program allows for certain local and state law enforcement officers to partner with DHS in the apprehension and processing of those who are residing in the country illegally. This program is important because it helps relieve some of the currently overwhelming workload shouldered by ICE officials, especially with the ongoing crisis at the southern border. Unfortunately, the Biden administration is curtailing the use of this program, and it’s very existence is in danger.9 Ending the 287g program puts American communities at risk because it forces local jurisdictions to release potentially dangerous foreign-born lawbreakers back into their communities versus turning them over to ICE for removal.
Returns are the confirmed movement of an inadmissible or deportable alien out of the United States not based on an order of removal.10 Often, illegal crossers from Mexico that are apprehended by Border Patrol are given the option to voluntarily return to Mexico. This allows authorities to return illegal aliens back to their home country without going through the deportation proceedings that take more time to complete. Others are individuals who were residing in the United States illegally, but DHS has credible information that the individual left the country and had not returned by the time these annual statistics were curated. Returns increased throughout the Trump administration (2020 figures were unavailable at the time this report was published). This is likely due to two reasons:
461,540 572,566
1,013,539
504,254
2,551,899
-
500,000
1,000,000
1,500,000
2,000,000
2,500,000
3,000,000
FY 2017 FY 2018 FY 2019 FY 2020 Total
DHS Apprehension Totals
100,695 159,940 171,445
432,080
-
100,000
200,000
300,000
400,000
500,000
FY 2017 FY 2018 FY 2019 Total
DHS Returns
Federation for American Immigration Reform | 5
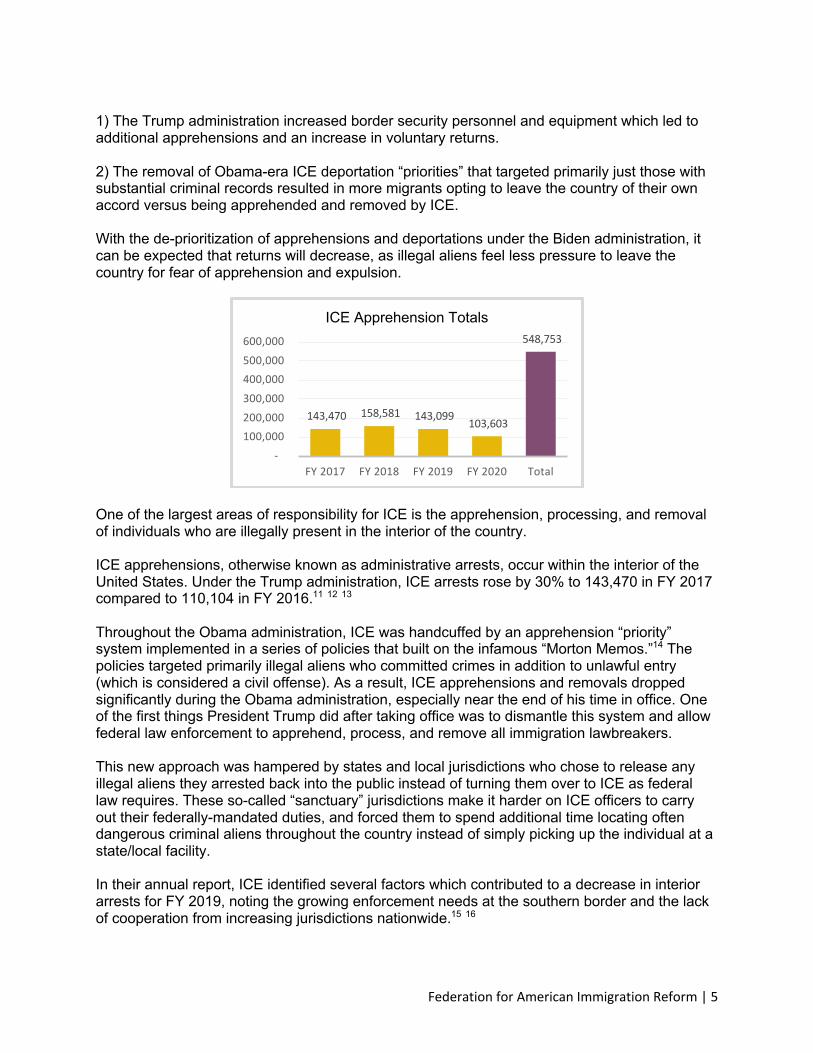
1) The Trump administration increased border security personnel and equipment which led to additional apprehensions and an increase in voluntary returns. 2) The removal of Obama-era ICE deportation “priorities” that targeted primarily just those with substantial criminal records resulted in more migrants opting to leave the country of their own accord versus being apprehended and removed by ICE. With the de-prioritization of apprehensions and deportations under the Biden administration, it can be expected that returns will decrease, as illegal aliens feel less pressure to leave the country for fear of apprehension and expulsion.
One of the largest areas of responsibility for ICE is the apprehension, processing, and removal of individuals who are illegally present in the interior of the country. ICE apprehensions, otherwise known as administrative arrests, occur within the interior of the United States. Under the Trump administration, ICE arrests rose by 30% to 143,470 in FY 2017 compared to 110,104 in FY 2016.11 12 13 Throughout the Obama administration, ICE was handcuffed by an apprehension “priority” system implemented in a series of policies that built on the infamous “Morton Memos.”14 The policies targeted primarily illegal aliens who committed crimes in addition to unlawful entry (which is considered a civil offense). As a result, ICE apprehensions and removals dropped significantly during the Obama administration, especially near the end of his time in office. One of the first things President Trump did after taking office was to dismantle this system and allow federal law enforcement to apprehend, process, and remove all immigration lawbreakers. This new approach was hampered by states and local jurisdictions who chose to release any illegal aliens they arrested back into the public instead of turning them over to ICE as federal law requires. These so-called “sanctuary” jurisdictions make it harder on ICE officers to carry out their federally-mandated duties, and forced them to spend additional time locating often dangerous criminal aliens throughout the country instead of simply picking up the individual at a state/local facility. In their annual report, ICE identified several factors which contributed to a decrease in interior arrests for FY 2019, noting the growing enforcement needs at the southern border and the lack of cooperation from increasing jurisdictions nationwide.15 16
143,470 158,581 143,099 103,603
548,753
-100,000 200,000 300,000 400,000 500,000 600,000
FY 2017 FY 2018 FY 2019 FY 2020 Total
ICE Apprehension Totals

Federation for American Immigration Reform | 6
ICE removals are simply the deportation of individuals who were apprehended in the interior of the country. These deportations rose every year during the Trump administration except for FY 2020, when COVID-19 precautions hindered apprehension and removal efforts.17 18 19 20 As noted in the previous section, the Obama-era apprehension and deportation “priorities” prevented ICE from fully completing their duties. These rules were eliminated during the Trump administration, which lead to an increase in apprehensions, and subsequently, deportations. Unfortunately, the Biden administration has restored these damaging Obama-era deportation priorities. Because of this, it can be reasonably expected that ICE removals will once again decrease. Moreover, the Biden administration has re-instated Obama-era “catch and release” policies that require CBP release individuals into the country. When this is combined with the new deportation “priorities,” it can be expected that the illegal alien population will increase drastically since CBP must release immigration lawbreakers into the country and ICE is not allowed to remove them. Throughout his presidency, Donald Trump prioritized the apprehension and deportation of illegal aliens. This commitment is reflected in the totals presented here, especially in regard to ICE removals, which increased every year until the pandemic-dampened year of 2020.
The illegal alien population grew considerably during the Trump administration. This can be attributed to a number of reasons, including a strong economy throughout most of his presidency. However, it can also be attributed to a failure to enforce some existing laws or implement important policies that would deter migrants from coming to the United States
226,119 256,085 359,885
185,884
1,027,973
-200,000 400,000 600,000 800,000
1,000,000 1,200,000
FY 2017 FY 2018 FY 2019 FY 2020 Total
ICE Removals
12.5
13.5
14.3 14.5
11.5 12.0 12.5 13.0 13.5 14.0 14.5 15.0
2017 2018 2019 2020
Illegal Alien Population (In Millions)

Federation for American Immigration Reform | 7
illegally, such as mandatory E-Verify or the prosecution of businesses that hire those who are not authorized to work in the United States. When former President Trump took office, the illegal alien population stood at approximately 12.5 million. When he left, it had bloomed to 14.5 million. The bulk of this increase took place in 2018 and 2019. The impacts of COVID-19 led to only marginal growth in the illegal alien population during 2020. As FAIR has noted elsewhere, the illegal alien population is set to surge under the Biden administration. If he implements all of his preferred policies, the population could exceed 20 million.21 Of course, the Biden administration has also promised to grant amnesty to essentially all illegal aliens. While this would immediately lower the number of those residing in the United States without authorization, the negative impacts on taxpayers would only increase, as this population would also immediately become eligible for federal welfare programs. Previous reports by FAIR have revealed that illegal aliens earn far less on average than American citizens or lawfully present immigrants.22
One additional element that hinders ICE from deporting more immigration violators is the growing backlog of immigration court cases. In FY 2017, there were 629,051 pending immigration cases.23 The following fiscal years saw increases in pending cases, subsequently causing the backlog to worsen. The lack of adequate immigration judges and staff to handle these cases has contributed to the backlog as well.24 Under the Trump administration, more immigration judges were hired to alleviate the burden.25 However, the border crisis of FY 2019, which included American-based organizations helping migrants exploit loopholes and abuse the asylum system, led to an extreme uptick in asylum applications. The vast majority of these applications are found to be fraudulent, and more than half of all applicants never even show up for their hearings.26 Because of this, the immigration caseload has risen to unprecedented numbers. If not for the implementation of MPP, which required migrants wait in a safe third-party country while their asylum claims are processed, these figures would be far higher. Since President Biden rescinded the program, apprehensions and subsequent notices- to-appear have skyrocketed.
629,051 768,251 1,023,767
1,262,765
3,683,834
-
1,000,000
2,000,000
3,000,000
4,000,000
FY 2017 FY 2018 FY 2019 FY 2020 Total
Backlog of Pending Immigration Cases
Federation for American Immigration Reform | 8
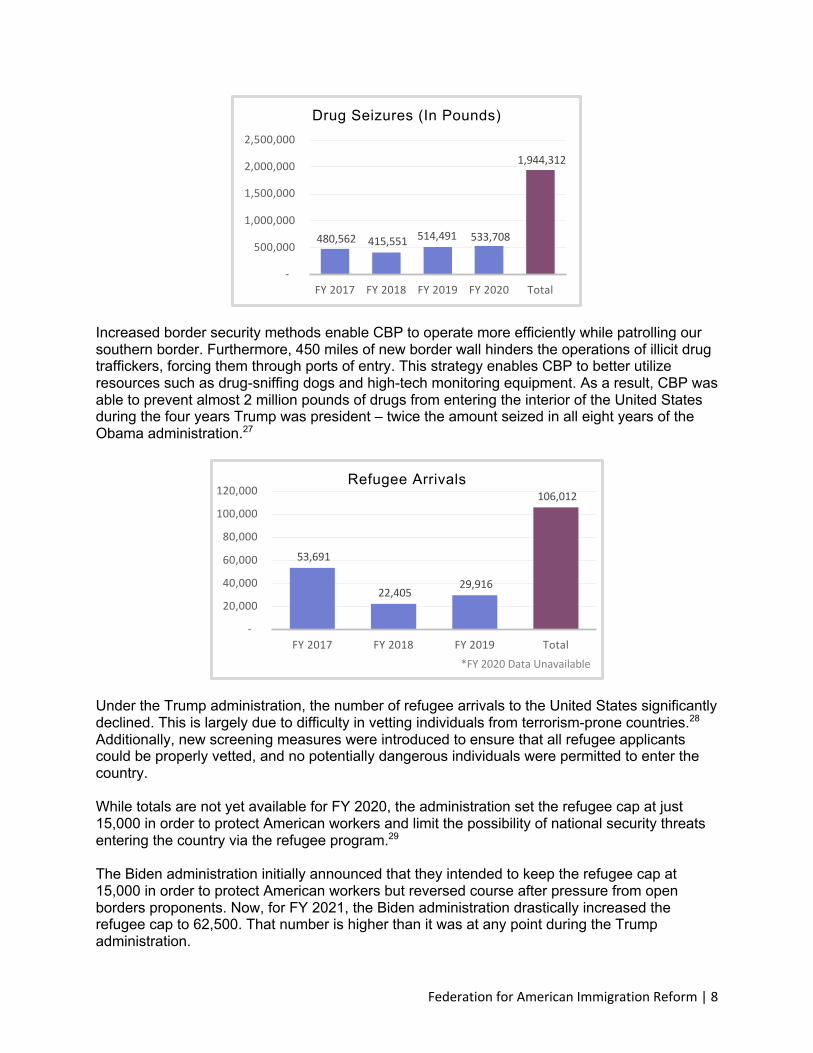
Increased border security methods enable CBP to operate more efficiently while patrolling our southern border. Furthermore, 450 miles of new border wall hinders the operations of illicit drug traffickers, forcing them through ports of entry. This strategy enables CBP to better utilize resources such as drug-sniffing dogs and high-tech monitoring equipment. As a result, CBP was able to prevent almost 2 million pounds of drugs from entering the interior of the United States during the four years Trump was president – twice the amount seized in all eight years of the Obama administration.27
Under the Trump administration, the number of refugee arrivals to the United States significantly declined. This is largely due to difficulty in vetting individuals from terrorism-prone countries.28 Additionally, new screening measures were introduced to ensure that all refugee applicants could be properly vetted, and no potentially dangerous individuals were permitted to enter the country. While totals are not yet available for FY 2020, the administration set the refugee cap at just 15,000 in order to protect American workers and limit the possibility of national security threats entering the country via the refugee program.29 The Biden administration initially announced that they intended to keep the refugee cap at 15,000 in order to protect American workers but reversed course after pressure from open borders proponents. Now, for FY 2021, the Biden administration drastically increased the refugee cap to 62,500. That number is higher than it was at any point during the Trump administration.
480,562 415,551 514,491 533,708
1,944,312
-
500,000
1,000,000
1,500,000
2,000,000
2,500,000
FY 2017 FY 2018 FY 2019 FY 2020 Total
Drug Seizures (In Pounds)
53,691
22,405 29,916
106,012
-
20,000
40,000
60,000
80,000
100,000
120,000
FY 2017 FY 2018 FY 2019 Total
Refugee Arrivals
*FY 2020 Data Unavailable

Federation for American Immigration Reform | 9
Grants for asylum increased under the Trump administration.30 Fiscal Year 2017 had 26,199 grants for asylum of foreign nationals. In FY 2018, the number of asylum grants that were issued totaled 37,567. The latest data on asylum admissions revealed 46,508 grants for asylum were issued in FY 2019.31 These statistics counter the false assertion that former President Trump “dismantled” the American asylum system, as current President Joe Biden claims.32 FY 2019 saw the most Asylum claims approved in the 21st Century. And, the administration did this while greatly reducing asylum fraud by implementing MPP which, as previously mentioned, limited the ability of applicants to disappear into the country and never show up for their court dates. These asylum agreements with Mexico and the Central American countries of El Salvador, Honduras, and Guatemala were immediately revoked by the incoming Biden administration, despite their tremendous success. As a result, a record number of individuals are once again flooding the southern border, hoping to take advantage of a once-again flawed asylum system. While data for FY 2020 is not yet available, approximately 92,800 affirmative asylum applications and 151,800 defensive asylum applications were filed in the year. Based on prevailing approval rates (which are extremely low), the number of accepted asylum applications most likely decreased in FY 2020. As for almost all other statistics included in this report, the reason for the decrease can largely be attributed to the impacts of COVID-19.
26,199 37,567
46,508
110,274
-
20,000
40,000
60,000
80,000
100,000
120,000
FY 2017 FY 2018 FY 2019 Total
Asylum
*FY 2020 Data Unavailable
701,900 666,582 676,422
2,044,904
-
500,000
1,000,000
1,500,000
2,000,000
2,500,000
FY 2017 FY 2018 FY 2019 Total
Visa Overstays
* FY 2020 Data Unavailable

Federation for American Immigration Reform | 10
Visa overstays occur when a foreign national remains in the United States past their designated date to return home. These overstays account for approximately 60 percent of the illegal immigrant population.33 The bulk of visa overstays comes from those who overstay tourist visas. While most of these overstayers leave within a year, hundreds of thousands of these individuals remain indefinitely, and resettle into the country.34 In FY 2017, there were 701,900 visa overstays. The number of visa overstays decreased to 666,582 the following year before rising slightly in FY 2019. While data remains unavailable for FY 2020, it can safely be assumed that this figure dropped significantly as far fewer visas were issued due to the COVID-19 pandemic, and very few tourists were allowed into the United States. As the United States continues to restrict entry by tourists, it can be expected that figures near the beginning of the Biden administration may remain low. However, again, with the de-prioritization of apprehensions and deportations as directed by the president, we can expect more and more individuals to overstay their visas once international travel returns to pre-pandemic levels. When there is little risk of removal from the country, many illegal aliens will simply opt to enter the country as a tourist, and then remain in the country beyond their designated date to return home.
9,681,913 9,028,026 8,742,068
4,013,210
31,465,217
-
5,000,000
10,000,000
15,000,000
20,000,000
25,000,000
30,000,000
35,000,000
FY 2017 FY 2018 FY 2019 FY 2020 Total
Total Nonimmigrant Visas Issued

Federation for American Immigration Reform | 11
Nonimmigrant work and study visas are for foreign nationals who have gained authorization to enter the United States on a temporary basis for purposes other than tourism. Under the Trump administration, the issuance of nonimmigrant visas gradually declined. In FY 2017, the total number of work visas issued was 9,681,913. The visa categories that accumulated large numbers of foreign nationals were the H-1B, H-2A, H-2B, F-1, and J-1.35 36 37 38 The latest cumulative data available prior to the COVID pandemic shows the grand total of visas issued at 8,742,068. While the total number of work visas given under the Trump administration has declined, other visa categories have experienced higher entries of foreign workers. The H-2A visa category, for example, increased its cap under the administration. In fact, there were more H-2A visas given during the pandemic-stricken year of 2020, when millions of Americans were without work, than in any other year of Trump’s presidency.39
179,049 179,660 188,123 124,983
671,815
-
200,000
400,000
600,000
800,000
FY 2017 FY 2018 FY 2019 FY 2020 Total
H-1B Nonimmigrant Visas Issued
83,600 83,744 97,623 61,865
326,832
-
100,000
200,000
300,000
400,000
FY 2017 FY 2018 FY 2019 FY 2020 Total
H-2B Nonimmigrant Visas Issued
343,811 342,639 353,279
108,510
1,148,239
-200,000 400,000 600,000 800,000
1,000,000 1,200,000 1,400,000
FY 2017 FY 2018 FY 2019 FY 2020 Total
J-1 Nonimmigrant Visas Issued
161,583 196,409 204,801 213,394
776,187
-
200,000
400,000
600,000
800,000
1,000,000
FY 2017 FY 2018 FY 2019 FY 2020 Total
H-2A Nonimmigrant Visas Issued
393,573 362,929 364,204
111,387
1,232,093
-
500,000
1,000,000
1,500,000
FY 2017 FY 2018 FY 2019 FY 2020 Total
F-1 Nonimmigrant Visas Issued

Federation for American Immigration Reform | 12
Still, in FY 2020, the total number of visas issued decreased by 4,728,858, or 54 percent. These measures ensured millions of jobs which would normally go to foreign laborers were given to U.S. citizens instead. This is another move that the Biden administration has reversed despite the unemployment rate in the United States remaining much higher than its pre-pandemic levels.
The Deferred Action for Childhood Arrivals (DACA) program is an initiative created by the Obama administration in 2012 that granted a “soft amnesty” to illegal aliens that entered the United States before the age of 16. Under DACA, recipients receive identity documents, work permits, and temporary relief from deportation. Former President Donald Trump attempted to end DACA throughout his administration, but all attempts were blocked by activist judges. These injunctions were highly questionable, as the program was almost certainly illegal to begin with.40 Under the Trump administration, the number of illegal aliens enrolled in DACA slowly decreased each fiscal year. In FY 2017, there were approximately 689,800 active DACA recipients.41 42 43 By the end of FY 2020, the number of active recipients decreased to 643,560.44 The Trump administration attempted to end DACA in June of 2020, but the Supreme Court blocked any efforts to dismantle the program until the case could be decided in its entirety. Subsequently, the Trump administration refused to accept any more applications for DACA. Since taking office, President Biden has not only began approving new applications for DACA but has promised amnesty to all DACA-eligible individuals, whether they apply for the program or not.45 Conclusion In general, the Trump administration made it much easier for immigration law enforcement officers to do their job and remove immigration lawbreakers from the United States. This is reflected in the preceding data ranging over his four years as president. However, there were still numerous holes in our nation’s immigration policies that allowed the illegal alien population
689,800 688,860 649,070 643,560
2,671,290
-
500,000
1,000,000
1,500,000
2,000,000
2,500,000
3,000,000
FY 2017 FY 2018 FY 2019 FY 2020 Total
Approximate Active DACA Recipients
*All numbers have been rounded

Federation for American Immigration Reform | 13
to increase during his tenure. Furthermore, large corporations continued to largely get away with prioritizing foreign labor over unemployed American citizens. In sharp contrast to the Trump administration, President Biden has already repealed most of the Trump-era policies that helped reduce asylum fraud, discourage illegal immigration, and protect the American worker. It can be expected that the progress made in all of these policy areas will not just disappear, but that things will become far worse than they ever were during the Trump administration. For example, it is expected that there will be more apprehensions at the southern border in FY 2021 than occurred at any time during both the Trump and Obama administrations. As the American public continues to recover from the COVID-19 pandemic, it makes sense that immigration policy should continually be adjusted to represent the best interests of American citizens. The Biden administration has shown that they have no intentions of doing so. By contrast, all of his moves so far have served only the interests of immigration lawbreakers and large corporations that would prefer to hire cheap foreign labor over Americans. This report should serve as a tool to gauge how President Biden’s radical open borders agenda compares to the Trump administration’s attempt to bring our immigration system back in ch References
1 U.S. Customs and Border Protection, “Southwest Border Migration FY 2019,” Accessed April 1, 2021, https://www.cbp.gov/newsroom/stats/sw-border-migration/fy-2019. 2 U.S. Customs and Border Protection, “Southwest Border Migration FY 2020,” Accessed April 1, 2021, https://www.cbp.gov/newsroom/stats/sw-border-migration-fy2020#:~:text=In%20Fiscal%20Year%20(FY)%202020,entry%20on%20our%20Southwest%20Border. 3 Ibid 4 U.S. Customs and Border Protection, “Southwest Border Migration FY 2017,” Accessed April 1, 2021, https://www.cbp.gov/newsroom/stats/sw-border-migration-fy2017. 5 U.S. Customs and Border Protection, “Southwest Border Migration FY 2018,” Accessed April 1, 2021, https://www.cbp.gov/newsroom/stats/sw-border-migration/fy-2018. 6 U.S. Customs and Border Protection, “Southwest Border Migration FY 2018,” Accessed April 1, 2021, https://www.cbp.gov/newsroom/stats/sw-border-migration/fy-2018. 7 U.S. Customs and Border Protection, “CBP Enforcement Statistics Fiscal Year 2021,” Accessed April 1, 2021, https://www.cbp.gov/newsroom/stats/cbp-enforcement-statistics. 8 U.S. Department of Homeland Security, “Table 33. Aliens Apprehended: Fiscal years 1925 to 2019,” Accessed April 1, 2021, https://www.dhs.gov/immigration-statistics/yearbook/2019/table33. 9 “The Biden Agenda for the Latino Community,” Joe Biden for President: Official Campaign, Accessed May, 2021, https://joebiden.com/latino-agenda/ 10 U.S. Department of Homeland Security, “Table 39. Aliens or Returned: Fiscal Years 1892 to 2019,” Accessed April 1, 2021, https://www.dhs.gov/immigration-statistics/yearbook/2019/table39.

Federation for American Immigration Reform | 14
11 U.S. Immigration Customs and Enforcement, “FY 2017 ERO Administrative Arrests,” Accessed April 1, 2021, https://www.ice.gov/sites/default/files/documents/Document/2017/localStats2017b.pdf 12 U.S. Immigration Customs and Enforcement, “FY 2018 End of Year Rollout,” Accessed April 1, 2021, https://www.ice.gov/sites/default/files/documents/Report/2018/ero-fy18-localstatistics.pdf. 13 U.S. Immigration Customs and Enforcement, “ERO Administrative Arrests by Field Office (Area of Responsibility) and Month,” Accessed April 1, 2021, https://www.ice.gov/doclib/news/library/reports/annual-report/ero-fy20-localstatistics.pdf. 14 Lazaro Zamora, “Comparing Trump and Obama’s Deportation Priorities,” Bipartisan Policy Center, February 27, 2017, U.S. Customs and Border Protection, “Southwest Border Migration FY 2020,” Accessed April 1, 2021, https://bipartisanpolicy.org/blog/comparing-trump-and-obamas-deportation-priorities/. 15 U.S. Immigration Customs and Enforcement, “ERO Administrative Arrests by Field Office (Area of Responsibility) and Month,” Accessed April 1, 2021, https://www.ice.gov/sites/default/files/documents/Report/2019/ero-fy19-localstatistics.pdf. 16 U.S. Immigration and Customs Enforcement, “U.S. Immigration and Customs Enforcement Fiscal Year 2019 Enforcement and Removal Operations Report,” Accessed April 15, 2021, https://www.ice.gov/sites/default/files/documents/Document/2019/eroReportFY2019.pdf 17 U.S. Immigration Customs and Enforcement, “Fiscal Year 2017 ICE Enforcement and Removal Operations Report,” December 2017, https://www.ice.gov/removal-statistics/2017. 18 U.S. Immigration Customs and Enforcement, “Fiscal Year 2018 ICE Enforcement and Removal Operations Report,” December 2018, https://www.ice.gov/features/ERO-2018. 19 U.S. Immigration Customs and Enforcement, “U.S. Immigration Customs and Enforcement Fiscal Year 2019 Enforcement and Removal Operations Report,” December 2019, https://www.ice.gov/features/ERO-2019. 20 U.S. Immigration Customs and Enforcement, “ICE Annual Report Fiscal Year 2020,” December 2020, https://www.ice.gov/doclib/news/library/reports/annual-report/iceReportFY2020.pdf. 21 Spencer Raley, Madison McQueen, and Jason Pena, “By the Numbers: How the Biden/Harris Immigration Platform Will Fuel a Staggering Increase of Immigrants and Population Growth,” Federation for American Immigration Reform, September 2020, https://www.fairus.org/issue/amnesty/numbers-how-biden-harris-immigration-platform. 22 Matt O’Brien and Spencer Raley,”The Fiscal Burden of Illegal Immigration on the United States Taxpayers,” Federation for American Immigration Reform, September 2017, https://www.fairus.org/issue/publications-resources/fiscal-burden-illegal-immigration-united-states-taxpayers. 23 TRAC Immigration, “Immigration Court Backlog Tool,” Accessed April 1, 2021, http://trac.syr.edu/phptools/immigration/court_backlog/. 24 Andrew R. Arthur, “The Massive Increase in the Immigration Court Backlog,” Center for Immigration Studies, July 2017, https://cis.org/Report/Massive-Increase-Immigration-Court-Backlog. 25 Molly O’ Toole, “Justice Department Touts New Immigration Judges Amid Struggle to Reduce Backlog,” Los Angeles Times, March 25, 2019, https://www.latimes.com/politics/la-na-pol-trump-immigration-judges-backlog-20190315-story.html. 26 Immigration Policy Tracking Project, “EOIR Releases Fact Sheet on “Myths vs. Facts About Immigration Proceedings”, Accessed April 13, 2021, https://immpolicytracking.org/policies/eoir-releases-factsheet-myths-vs-facts-about-immigration-proceedings/#/tab-policy-documents.

Federation for American Immigration Reform | 15
27 U.S. Customs and Border Protection, “CBP Enforcement Statistics Fiscal Year 2021,” Accessed April 1, 2021, https://www.cbp.gov/newsroom/stats/cbp-enforcement-statistics. 28 U.S. Department of Homeland Security, “Table 13. Refugee Arrivals: Fiscal Years 1980 to 2019,” Accessed April 1, 2021, https://www.dhs.gov/immigration-statistics/yearbook/2019/table13. 29 Camilo Montoya-Galvez,” Trump Administration Sets Refugee Cap at 15,000, a new Record Low,” CBS News, October 1, 2020, https://www.cbsnews.com/news/trump-administration-refugee-resettlement-cap-historic-low/. 30 U.S. Department of Homeland Security, “Table 16, Individuals Granted Asylum Affirmatively or Defensively: Fiscal: Fiscal Years 1990 to 2019,” Accessed January 28, 2021, https://www.dhs.gov/immigration-statistics/yearbook/2019/table16. 31 Ibid. 32 The White House, “Fact Sheet: President Biden Outlines Steps to Reform Our Immigration System by Keeping Families Together, Addressing the Root Causes of Irregular Migration, and Streamlining the Legal Immigration System,” February 2, 2021, https://www.whitehouse.gov/briefing-room/statements-releases/2021/02/02/fact-sheet-president-biden-outlines-steps-to-reform-our-immigration-system-by-keeping-families-together-addressing-the-root-causes-of-irregular-migration-and-streamlining-the-legal-immigration-syst/. 33 Richard Gonzales, “For 7th Consecutive Year, Visa Overstays Exceeded Illegal Border Crossings,” NPR, January 16, 2019, https://www.npr.org/2019/01/16/686056668/for-seventh-consecutive-year-visa-overstays-exceeded-illegal-border-crossings. 34 U.S. Department of Homeland Security, “Entry/Exist Overstays Report,” January 2016, https://www.dhs.gov/publication/entryexit-overstay-report. 35 U.S. Department of State, “Worldwide NIV Workload by Visa Category FY 2017,” Accessed April 1, 2021, https://travel.state.gov/content/dam/visas/Statistics/Non-Immigrant-Statistics/NIVWorkload/FY 2017NIVWorkloadbyVisaCategory.pdf. 36 U.S. Department of State, “Worldwide NIV Workload by Visa Category FY 2018,” Accessed April 1, 2021, https://travel.state.gov/content/dam/visas/Statistics/Non-Immigrant-Statistics/NIVWorkload/FY2018NIVWorkloadbyVisaCategory.pdf. 37 U.S. Department of State, “Worldwide NIV Workload by Visa Category FY 2019,” Accessed April 1, 2021, https://travel.state.gov/content/dam/visas/Statistics/Non-Immigrant-Statistics/NIVWorkload/FY2019NIVWorkloadbyVisaCategory.pdf 38 U.S. Department of State, “Worldwide NIV Workload by Visa Category FY 2020,” Accessed April 1, 2021, https://travel.state.gov/content/dam/visas/Statistics/Non-Immigrant-Statistics/NIVWorkload/FY2020NIVWorkloadbyVisaCategory.pdf. 39 Jennifer Hickey, “Expanding The H-2B Visa Program Is A Very, Very Bad Idea, ImmigrationReform.com, May 8, 2019, https://www.immigrationreform.com/2019/05/08/expanding-the-h-2b-visa-program-is-a-very-very-bad-idea-immigrationreform-com/. 40 Spencer Raley, Madison McQueen, and Jason Pena, “America Last: How the Biden Mass Amnesty is Worse Than Every Other Amnesty Attempt in U.S. History,” Federation for American Immigration Reform, February 2021, https://www.fairus.org/issue/amnesty/america-last-biden-mass-amnesty-worse-us-history. 41 U.S. Citizenship and Immigration Services, “Approximate Active DACA Recipients: Country of Birth,” Accessed April 1, 2021, https://www.uscis.gov/sites/default/files/document/data/daca_population_data.pdf. 42 U.S. Citizenship and Immigration Services, “Approximate Active DACA Recipients: Country of Birth,” Accessed April 1, 2021, https://www.uscis.gov/sites/default/files/document/data/DACA_Population_Data_Nov_30_2018.pdf.

Federation for American Immigration Reform | 16
43 U.S. Citizenship and Immigration Services, “Approximate Active DACA Recipients: As of December 31, 2019,” Accessed April 1,, 2021, https://www.uscis.gov/sites/default/files/document/data/DACA_Population_Receipts_since_Injunction_Dec_31_2019.pdf. 44 U.S. Citizenship and Immigration Services, “Approximate Active DACA Recipients: As of March 31, 2020,” Accessed April 1, 2021,” https://www.uscis.gov/sites/default/files/document/data/Approximate%20Active%20DACA%20Receipts%20-%20March%2031%2C%202020.pdf. 45 Ibid