Embed Size (px)
DESCRIPTION
We apply a direct approach to estimate domestic value added embedded in the People’s Republic of China’s (PRC) exports. The estimates suggest that the domestic value added of processing exports and processing high-tech exports gradually increased from 30% and 25%, to 44% and 45%, respectively, between 1997 and 2012. On the other hand, the domestic content of processing exports with supplied materials fell to 14% from the peak of 35%. In 2012, the domestic value added of the PRC’s total exports remained below 77%. Our estimates prove to be the upper limits of the corresponding trade in value added. Compared to our estimates, the Organisation for Economic Co-operation and Development’s Trade in Value Added database (TiVA) significantly overestimates the domestic content of the PRC’s exports. TiVA’s estimates are also inconsistent with the fact that the share of processing exports in the PRC’s total exports has decreased steadily. In addition, we show that the PRC’s processing exports demonstrate significant heterogeneity across its trading partners; processing exports account for a large portion of total exports to high income countries but a relatively small portion of exports to low income countries. This heterogeneity implies that the domestic content of the PRC’s exports varies significantly by destination.
Citation preview

ADBI Working Paper Series
Measuring Value Added in the People’s Republic of China’s Exports: A Direct Approach
Yuqing Xing
No. 493 August 2014
Asian Development Bank Institute
The Working Paper series is a continuation of the formerly named Discussion Paper series; the numbering of the papers continued without interruption or change. ADBI’s working papers reflect initial ideas on a topic and are posted online for discussion. ADBI encourages readers to post their comments on the main page for each working paper (given in the citation below). Some working papers may develop into other forms of publication.
Suggested citation:
Xing, Y. 2014. Measuring Value Added in the People’s Republic of China’s Exports: A Direct Approach. ADBI Working Paper 493. Tokyo: Asian Development Bank Institute. Available: http://www.adbi.org/working-paper/2014/08/06/6372.measuring.value.added.prc.exports/ Please contact the author for information about this paper.
Email: [email protected]
Yuqing Xing is Director of Capacity Building and Training at the Asian Development Bank Institute, Tokyo.
The views expressed in this paper are the views of the author and do not necessarily reflect the views or policies of ADBI, ADB, its Board of Directors, or the governments they represent. ADBI does not guarantee the accuracy of the data included in this paper and accepts no responsibility for any consequences of their use. Terminology used may not necessarily be consistent with ADB official terms.
Working papers are subject to formal revision and correction before they are finalized and considered published.
In this working paper, “$” refers to US dollars, unless otherwise stated.
Asian Development Bank Institute Kasumigaseki Building 8F 3-2-5 Kasumigaseki, Chiyoda-ku Tokyo 100-6008, Japan Tel: +81-3-3593-5500 Fax: +81-3-3593-5571 URL: www.adbi.org E-mail: [email protected] © 2014 Asian Development Bank Institute
ADBI Working Paper 493 Xing
Abstract We apply a direct approach to estimate domestic value added embedded in the People’s Republic of China’s (PRC) exports. The estimates suggest that the domestic value added of processing exports and processing high-tech exports gradually increased from 30% and 25%, to 44% and 45%, respectively, between 1997 and 2012. On the other hand, the domestic content of processing exports with supplied materials fell to 14% from the peak of 35%. In 2012, the domestic value added of the PRC’s total exports remained below 77%. Our estimates prove to be the upper limits of the corresponding trade in value added. Compared to our estimates, the Organisation for Economic Co-operation and Development’s Trade in Value Added database (TiVA) significantly overestimates the domestic content of the PRC’s exports. TiVA’s estimates are also inconsistent with the fact that the share of processing exports in the PRC’s total exports has decreased steadily. In addition, we show that the PRC’s processing exports demonstrate significant heterogeneity across its trading partners; processing exports account for a large portion of total exports to high income countries but a relatively small portion of exports to low income countries. This heterogeneity implies that the domestic content of the PRC’s exports varies significantly by destination. JEL Classification: F1
ADBI Working Paper 493 Xing
Contents 1. Introduction ................................................................................................................ 3
2. Estimating Value Added in Trade: A Simple Approach .............................................. 5
3. Estimating Domestic Value Added of the People’s Republic of China’s Exports ........ 8
4. Domestic Value Added of People’s Republic of China’s Exports by
Trading Partner ........................................................................................................ 11
5. Comparing Our Estimates with the OECD TiVA Database ....................................... 13
6. Concluding Remarks ............................................................................................... 14
References ......................................................................................................................... 16
ADBI Working Paper 493 Xing
1. INTRODUCTION The proliferation of global value chains (GVCs) has fundamentally challenged the economic implications of conventional trade statistics recorded with gross values of cross-border goods flows. In open macroeconomic models, imports of a country are generally assumed to represent domestic demand for foreign goods and services. However, in supply chain trade, a substantial part of a country’s imports have nothing to do with domestic demand, but are induced by the demand of the destination market located at the end of the GVC. As an example, the People’s Republic of China (PRC), the global assembly center of manufacturing products, imported $480 billion, about 27% of its total imports in 2012, not for domestic consumption or for investment, but for manufacturing products serving foreign demand. Empirical studies usually apply gross exports to measure export capacity of an economy and assume the technology embedded in the exports represents the technology capacity of the exporting countries. In supply chain trade, many countries involved in GVCs need to import parts and components as intermediate inputs. As a result, gross values of exports consist of a significant portion of value added generated by foreign countries, and thus greatly exaggerate actual export capacities, in particular of countries specializing in assembly and other labor intensive tasks. Similarly, each individual country along GVCs performs only limited tasks required for the finished product. Overall technology achievement embedded in the finished product represents the combination of technology capacities of all countries participating in the supply chains. It is thus misleading to utilize the product as a proxy of technology advancement for a country which performs limited tasks in the production of the finished product. The iPhone is a typical example. All iPhones sold in the global market are exclusively assembled in and exported from the PRC. However, using the iPhone as a proxy to gauge the PRC’s technology capability and competitiveness in smart phones would be misleading, as workers in the PRC simply assemble imported parts together and contribute only 3.6% of the total value added of a ready-to-use iPhone (Xing and Detert 2010).
To a large extent, the rapid expansion of GVCs has facilitated rising trade volumes worldwide. Technological progress in production fragmentation, advancement in logistics, and liberalization in trade and foreign direct investment have enabled multinational enterprises (MNEs) to divide production processes and optimally allocate tasks in various geographic locations. Technological innovation and cross-country production fragmentation of leading multinational enterprises have consistently induced and amplified trade flows. Meanwhile, methods for computing trade flows remain the same and there has been little reform in trade statistics incorporating fundamental changes brought by the proliferation of GVCs. With the outdated trade statistics, many economic analyses on trade balances, dynamic changes of export structures, revealed comparative advantages, and so on reach conclusions inconsistent with reality. For instance, Rodrik (2006) argues the sophistication of the PRC’s exports far exceeded that defined by its income level; Merri (2009) claims the PRC surpassed the United States (US), European Union (EU)-27, and Japan and emerged as the largest high-tech exporting country; Scott (2011) estimates US trade with the PRC between 2001 and 2010 eliminated 1.9 million jobs in manufacturing. These studies ignore the fact that the PRC is just a part of the GVC of the underlying products; mistakenly assuming that everything shipped out of the PRC is completely manufactured in the country.
To improve our understanding of the contribution of supply chain trade to economic development, bilateral trade relations, and technological innovation, it is essential to accurately measure the contribution of each country in the value chain. Hummels, Ishii, and Yi (2001) use input–output tables to estimate the import content of exports, defined as vertical specialization.
3
ADBI Working Paper 493 Xing
They find that the ratios of import content accounted for more than 20% of exports in the underlining countries. The research emphasizes the level of specialization rather than new measures of trade flows. Koopman, Wang, and Wei (2009) argue that import content is higher if processing exports are pervasive. They divide the PRC’s exports into normal and processing exports and find that the import content of the PRC’s processing exports exceed 50%.
Global imbalances were argued to be a major factor causing the 2008 global financial crisis. At the center of the debate on global imbalances, is the imbalance between the PRC and the US. Many economists prescribed a significant appreciation of the yuan as an effective policy option to mitigate the imbalance and prevent similar crises in the future. Xing and Detert (2010) use the iconic iPhone as a case and argue that existing trade statistics create a distorted trade pattern and significantly exaggerate the PRC’s exports volumes as well as its trade surplus with the US. The Sino–US trade deficit is not a simple bilateral issue but to a large extent a multilateral one. The surge in iPhone exports to the US from the PRC and the corresponding trade imbalance has nothing to do with the PRC’s technology advancement or improvements in comparative advantages. The study illustrates unambiguously the inconsistency of conventional trade statistics with supply chain trade and provides persuasive arguments for reforming conventional trade statistics.
The findings of Xing and Detert (2010) were extensively reported and analyzed by mainstream media such as the Wall Street Journal and the Financial Times. The involvement of the global mainstream media in the debates on pitfalls of conventional trade statistics have given rise to a momentum for creating value added trade statistics. IDE-JETRO (2012) first employed Asian input–output tables covering nine Asian countries as well as the US to calculate domestic and foreign content in exports. The study suggests that the value of the US trade deficit with the PRC in 2005 can be halved if the value added approach is adopted. In January, 2013, the Organisation for Economic Co-operation and Development (OECD) and the World Trade Organization (WTO) jointly launched the preliminary database of trade in value added (TiVA), covering 40 countries with a breakdown into 18 sectors (OECD–WTO 2013). In the race to reevaluate global trade in value added, UNCTAD (2013) also published estimates of trade in value added and analyzed the nexus between GVC participation and economic development. The report suggests that GVC participation facilitates job creation, knowledge transfer, and economic growth. Koopman, Wang, and Wei (2012) provide a rigorous theoretical framework to compute trade in value added with input–output tables. In particular, they show a way to decompose the double counting component—imports embedded with domestic value added.
Theoretically, input–output tables are a powerful tool for mapping directions and origins of trade in value added among trading nations. However, the results of input–output tables are estimates derived with strong assumptions (Degain and Maurer, forthcoming). As a matter of fact, the estimation of value added in trade with input–output tables relies on estimates of input–output coefficients and assumes that the ratio of import content is identical between exports and goods sold for domestic market. Although conventional trade data fails to outline actual distribution of value added among trading nations, the data itself is highly accurate and reliable in terms of measuring quantities of goods crossing borders. How reliable are the estimates of trade in value added with input–output tables? If the estimates of trade in value added carry very large errors, economic analysis based on the estimates will lead to similar mistakes. It is essential to scrutinize the reliability and accuracy of the estimates derived from input–output tables before we conduct rigorous econometric analysis.
In this paper, we introduce a new method, which is independent of input–out tables, to estimate the domestic content of exports. This method depends on the availability of statistics on aggregate imports used for producing exports. Due to the limitation of trade data, this approach may not accurately measure domestic content embedded in exports. However, it does provide
4
ADBI Working Paper 493 Xing
an upper limit of domestic content and can be used as a benchmark to examine the accuracy and reliability of the estimates derived from input–output tables.
Processing trade makes up about 40% of the PRC’s trade and the PRC’s customs regularly publishes statistics on processing trade in some categories. We apply this approach to the PRC and compare our results with that of the OECD TiVA database. The comparison suggests that OECD TiVA substantially overestimates the domestic content of the PRC’s exports. TiVA estimation is also inconsistent with the fact that the share of processing exports has gradually declined.
Moreover, an investigation of the importance of processing exports in the PRC’s exports to its major trading partners reveals significant heterogeneity. Processing exports account for more than 60% of the PRC’s gross exports to a few industrialized countries, such as the US and Japan, while it accounts for less than 20% to some developing countries. In general, processing exports contain a large portion of foreign value added compared to normal exports. This heterogeneity of processing exports implies that the domestic content of the PRC’s exports varies substantially by trading partner. Consumer preferences of destination markets and the location of trading partners in global value chains also determine the domestic value added of the PRC’s exports in bilateral trade.
The rest of the paper is organized as follows: in the next section we introduce our approach; in section 3 we apply the method to the PRC’s data; in section 4, we examine the heterogeneity of the PRC’s processing exports over its major trading partners; then we compare our estimates with that of the OECD TiVA in section 5. Section 6 summarizes the major findings.
2. ESTIMATING VALUE ADDED IN TRADE: A SIMPLE APPROACH
Many countries grant tariff free status to imports used for producing exports and provide special tax incentives to firms exporting products manufactured with imported materials. To enjoy these benefits, firms importing intermediate inputs, are required to declare the purpose of their imports and whether their exports are made with imported intermediate materials. In these countries, aggregated data on imports by purpose and exports with or without imported content are available. The PRC customs collects and publishes the data of processing imports and with this data, we are able to estimate the domestic value added as:
, (A)
where denotes the share of domestic value added in exports, is gross exports, and is gross imports employed for producing exports. Equation (A) is a simple and straightforward way to compute the share of domestic value added in exports. The accuracy of the estimates depends on data availability. In supply chain trade, exports often contain foreign valued added while imports may include domestic value added, a so called double counting issue. The mixture of domestic and foreign content in exports and imports complicates the computation of domestic value added. However, if we trace the movement of goods across borders, it is not difficult to understand that the difference between total exports and total imports used to produce the exports should be equal to domestic value added. Intuitively, any foreign intermediate good is first added to total imports; when the final good is exported, the entire value, including the foreign content, is counted as a part of exports. Therefore, taking the
5

ADBI Working Paper 493 Xing
difference of the two aggregates will automatically cancel out foreign value added included in both aggregated imports and exports. Similarly, in the case of domestic goods, which are exported then imported back for further processing, the same value is recorded in both total exports and imports. If a good is eventually shipped abroad as a final good, its domestic value will be captured by the difference and there is no double counting issue. We will prove this intuitive explanation mathematically below.
Theorem: If is the aggregated gross exports of a country and is the aggregated gross imports used for producing exports , the domestic value added of is equal to , regardless of whether contains foreign value added or contains domestic value added.
Proof: Assume that a country exports different final goods: ,…, . Good becomes final consumption1 abroad in the first round of being exported; good is exported in the first round, then imported back with additional foreign value added and becomes final consumption abroad after further domestic processing and being exported in round 2; good becomes final consumption in round . Before a good becomes final consumption, its domestic and foreign value added continues to increase in each round of export and import. Now, we turn to calculating the cumulative domestic value added associated with each good, then the sum of total value added of these goods.
According to the definition, becomes final consumption abroad in the first round of being exported. Its gross export value can be defined as
TEg1 = e1
1 + m11
(1) where indicates domestic value added and foreign value added embedded in . The total gross imports associated with producing good E1 are:
IMEg1 = m1
1 (2) Subtracting equation (2) from equation (1) yields the domestic value added of good E1 :
TEg1 − IMEg
1 = e11 (3)
We can apply similar analysis to goods , which becomes final consumption abroad in the second round of exporting. In round one, it is exported with gross value , where
denotes domestic value added and is imported foreign content, then re-imported with gross import value after further processing abroad, where represents the new foreign value added after foreign companies process the original value . is exported as final consumption in round 2 with incremental domestic value , which is added after further processing at home. Hence, total gross exports associated with good are: = + (4) and the total gross imports used for producing final is:
(5)
1 Here “final consumption” means that goods exported will not imported back in any form.
6
ADBI Working Paper 493 Xing
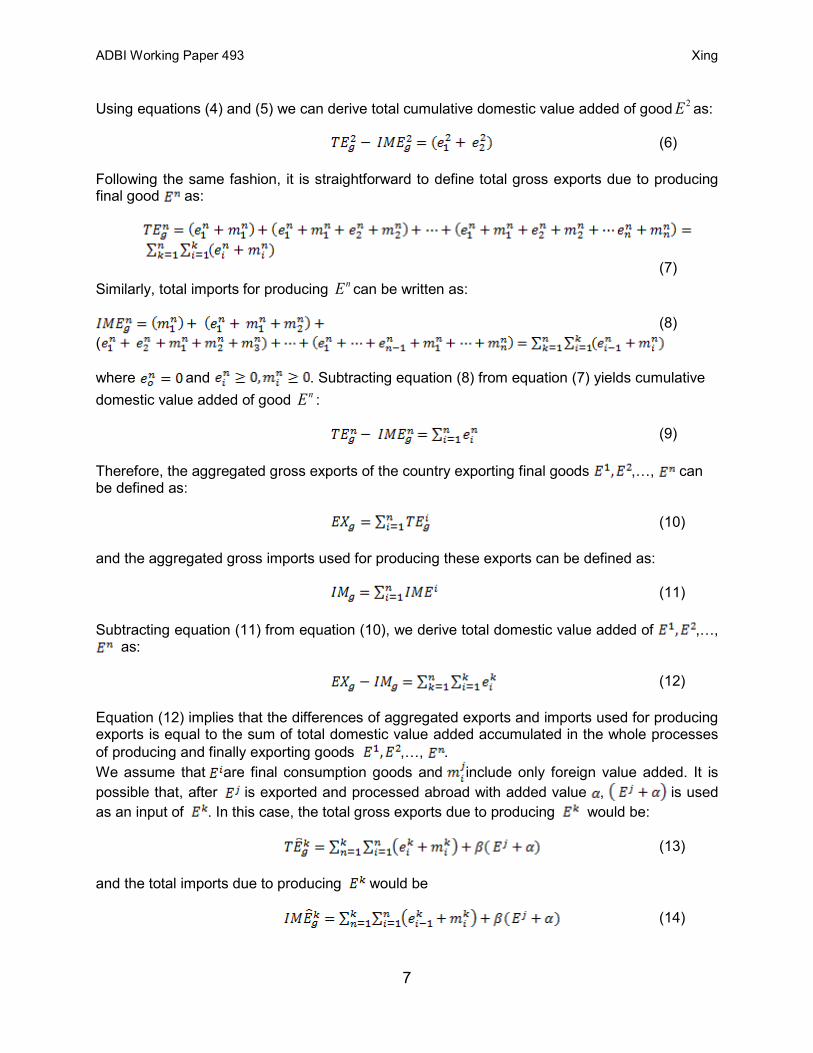
Using equations (4) and (5) we can derive total cumulative domestic value added of good E2 as:
(6) Following the same fashion, it is straightforward to define total gross exports due to producing final good as:
(7) Similarly, total imports for producing En can be written as:
(8) ( where and . Subtracting equation (8) from equation (7) yields cumulative domestic value added of good En : (9) Therefore, the aggregated gross exports of the country exporting final goods ,…, can be defined as: (10) and the aggregated gross imports used for producing these exports can be defined as: (11) Subtracting equation (11) from equation (10), we derive total domestic value added of ,…,
as:
(12) Equation (12) implies that the differences of aggregated exports and imports used for producing exports is equal to the sum of total domestic value added accumulated in the whole processes of producing and finally exporting goods ,…, . We assume that are final consumption goods and include only foreign value added. It is possible that, after is exported and processed abroad with added value , is used as an input of . In this case, the total gross exports due to producing would be:
(13) and the total imports due to producing would be
(14)
7

ADBI Working Paper 493 Xing
where , assuming that in round that ) is imported as an input for producing :
TEgk − IMEg
k = eik
i=1
k
∑ (15)
which is the total cumulative value added in the process of manufacturing good Ek . It is the same as equation (12). Hence, adding inputs from other domestically produced goods does not change the result of the calculation.
Since (TEgj − IMEg
j ) = eij
i=1
j
∑ captures the total cumulative value added of E j for any ,
the total value added calculated by equation (12) remains the same.
3. ESTIMATING DOMESTIC VALUE ADDED OF THE PEOPLE’S REPUBLIC OF CHINA’S EXPORTS
We apply equation (A) to estimate domestic value added of the PRC’s exports in the following categories: (1) processing exports; (2) processing exports with imported materials; (3) processing exports with supplied materials; (4) processing high-tech exports; and (5) total exports. The PRC’s customs statistics classifies trade into ordinary and processing trade. Processing imports are defined as goods that are brought into the PRC to be used as intermediate goods in the manufacture of final products. Processing imports are duty free, and neither imported inputs nor finished goods produced using processing imports enter the PRC’s domestic market. The processed final goods are subsequently re-exported from the PRC and are classified as processing exports. There are two kinds of processing exports: processing exports with supplied materials and processing exports with imported materials. In the former case, firms in the PRC receive parts and components from foreign firms for further processing but do not provide financial payment for the supplied materials to the foreign firms. They receive processing fees after delivering processed products to the foreign firms. At the beginning of the PRC’s opening, because of the shortage of foreign exchange reverses, many domestic firms signed cooperation agreements with foreign firms to engage in simple assembly with supplied materials. In the latter case, domestic firms purchased intermediate goods from abroad and then exported products made with imported materials either to original materials suppliers or third parties.
Producing exports require energy, which may be produced with imported oil, natural gas, and coal. Imported raw materials such as copper and iron ore may also be used in the production of exports. These kinds of inputs are generally not included in processing import statistics. If we use the published processing import statistics to calculate domestic content, equation (A) can be revised as:
Value Added =EX − PIM −α
EX≤
EX − PIMEX
(B)
where α represents imported intermediate inputs not included in processing imports. Because we are unable to estimateα , the domestic value added estimated with equation (A) is an approximation and should be regarded as the upper limit of actual domestic content.
8
ADBI Working Paper 493 Xing
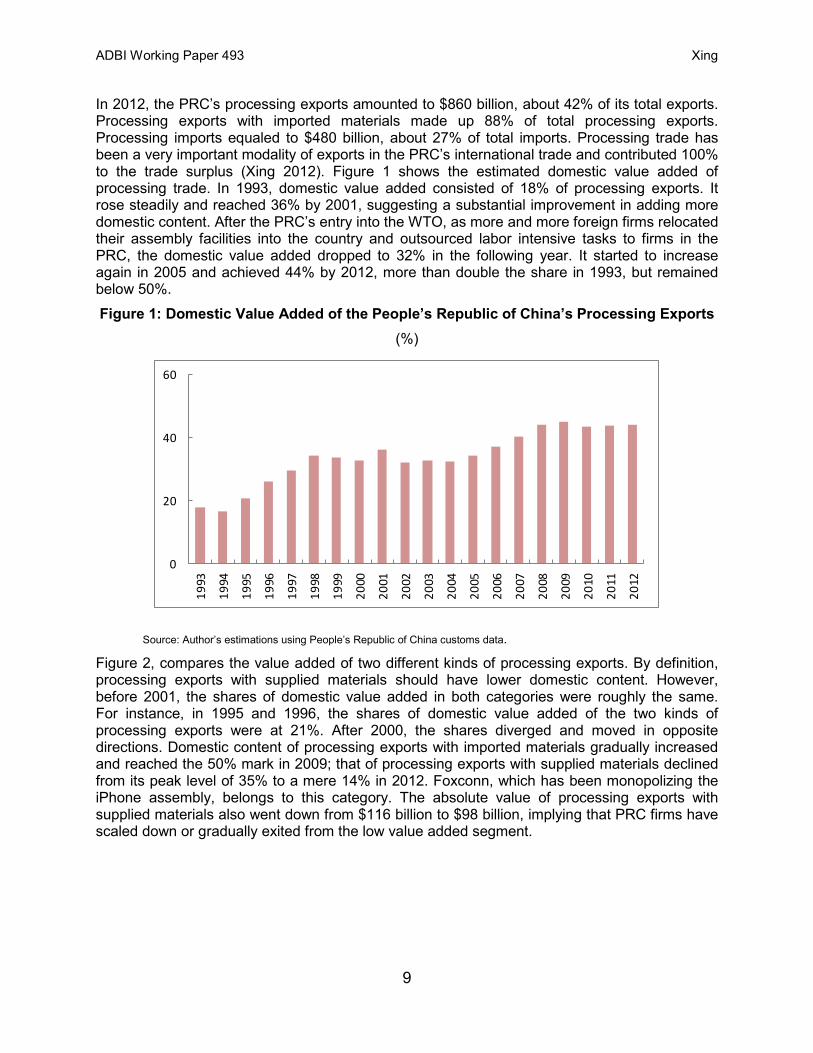
In 2012, the PRC’s processing exports amounted to $860 billion, about 42% of its total exports. Processing exports with imported materials made up 88% of total processing exports. Processing imports equaled to $480 billion, about 27% of total imports. Processing trade has been a very important modality of exports in the PRC’s international trade and contributed 100% to the trade surplus (Xing 2012). Figure 1 shows the estimated domestic value added of processing trade. In 1993, domestic value added consisted of 18% of processing exports. It rose steadily and reached 36% by 2001, suggesting a substantial improvement in adding more domestic content. After the PRC’s entry into the WTO, as more and more foreign firms relocated their assembly facilities into the country and outsourced labor intensive tasks to firms in the PRC, the domestic value added dropped to 32% in the following year. It started to increase again in 2005 and achieved 44% by 2012, more than double the share in 1993, but remained below 50%.
Figure 1: Domestic Value Added of the People’s Republic of China’s Processing Exports (%)
0
20
40
60
1993
1994
1995
1996
1997
1998
1999
2000
2001
2002
2003
2004
2005
2006
2007
2008
2009
2010
2011
2012
Source: Author’s estimations using People’s Republic of China customs data.
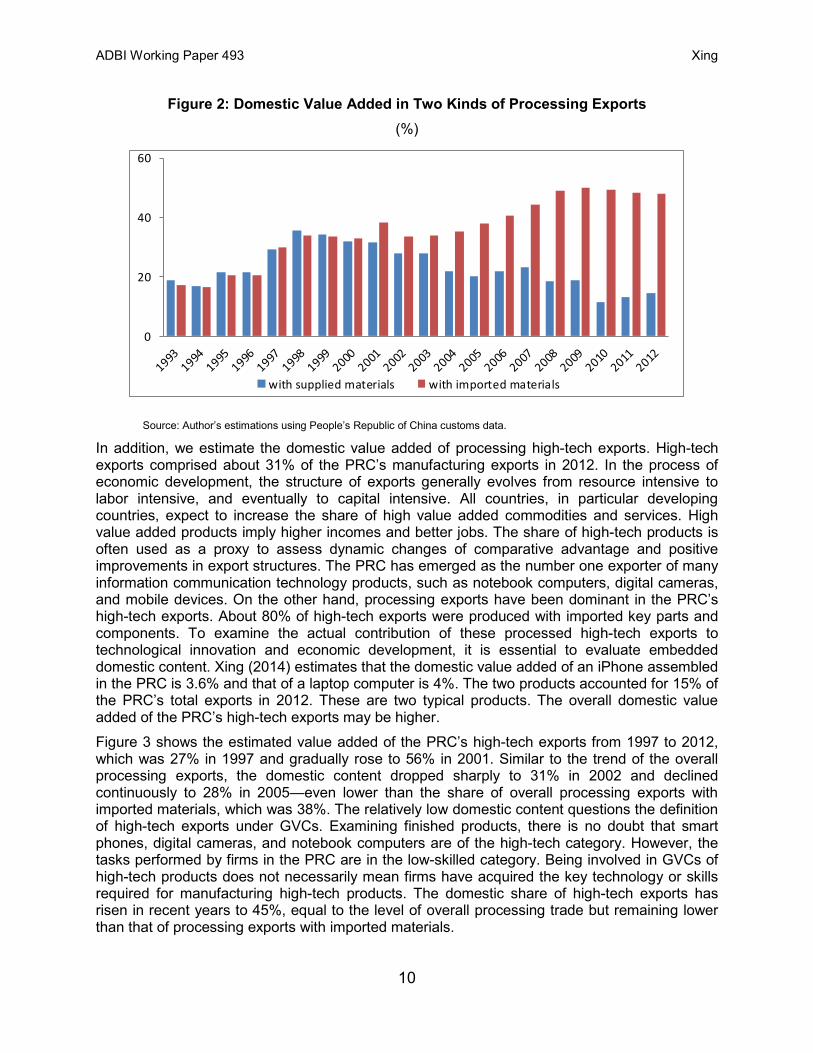
Figure 2, compares the value added of two different kinds of processing exports. By definition, processing exports with supplied materials should have lower domestic content. However, before 2001, the shares of domestic value added in both categories were roughly the same. For instance, in 1995 and 1996, the shares of domestic value added of the two kinds of processing exports were at 21%. After 2000, the shares diverged and moved in opposite directions. Domestic content of processing exports with imported materials gradually increased and reached the 50% mark in 2009; that of processing exports with supplied materials declined from its peak level of 35% to a mere 14% in 2012. Foxconn, which has been monopolizing the iPhone assembly, belongs to this category. The absolute value of processing exports with supplied materials also went down from $116 billion to $98 billion, implying that PRC firms have scaled down or gradually exited from the low value added segment.
9
ADBI Working Paper 493 Xing
Figure 2: Domestic Value Added in Two Kinds of Processing Exports (%)
0
20
40
60
with supplied materials with imported materials
Source: Author’s estimations using People’s Republic of China customs data.
In addition, we estimate the domestic value added of processing high-tech exports. High-tech exports comprised about 31% of the PRC’s manufacturing exports in 2012. In the process of economic development, the structure of exports generally evolves from resource intensive to labor intensive, and eventually to capital intensive. All countries, in particular developing countries, expect to increase the share of high value added commodities and services. High value added products imply higher incomes and better jobs. The share of high-tech products is often used as a proxy to assess dynamic changes of comparative advantage and positive improvements in export structures. The PRC has emerged as the number one exporter of many information communication technology products, such as notebook computers, digital cameras, and mobile devices. On the other hand, processing exports have been dominant in the PRC’s high-tech exports. About 80% of high-tech exports were produced with imported key parts and components. To examine the actual contribution of these processed high-tech exports to technological innovation and economic development, it is essential to evaluate embedded domestic content. Xing (2014) estimates that the domestic value added of an iPhone assembled in the PRC is 3.6% and that of a laptop computer is 4%. The two products accounted for 15% of the PRC’s total exports in 2012. These are two typical products. The overall domestic value added of the PRC’s high-tech exports may be higher.
Figure 3 shows the estimated value added of the PRC’s high-tech exports from 1997 to 2012, which was 27% in 1997 and gradually rose to 56% in 2001. Similar to the trend of the overall processing exports, the domestic content dropped sharply to 31% in 2002 and declined continuously to 28% in 2005—even lower than the share of overall processing exports with imported materials, which was 38%. The relatively low domestic content questions the definition of high-tech exports under GVCs. Examining finished products, there is no doubt that smart phones, digital cameras, and notebook computers are of the high-tech category. However, the tasks performed by firms in the PRC are in the low-skilled category. Being involved in GVCs of high-tech products does not necessarily mean firms have acquired the key technology or skills required for manufacturing high-tech products. The domestic share of high-tech exports has risen in recent years to 45%, equal to the level of overall processing trade but remaining lower than that of processing exports with imported materials.
10

ADBI Working Paper 493 Xing
Figure 3: Domestic Value Added in in the People’s Republic of China’s High-Tech Exports
(%)
0
10
20
30
40
50
6019
97
1998
1999
2000
2001
2002
2003
2004
2005
2006
2007
2008
2009
2010
2011
2012
Source: Author’s estimations using People’s Republic of China customs data
4. DOMESTIC VALUE ADDED OF PEOPLE’S REPUBLIC OF CHINA’S EXPORTS BY TRADING PARTNER
As argued by Xing and Detert (2010), current trade statistics give rise to serious distortions in measuring bilateral trade balances. A value added approach should be employed to correctly measure bilateral trade balances, in particular for countries utilized by multinational enterprises as export platforms, such as the PRC. To do so, estimating the domestic value added of aggregated exports is far from sufficient. Information on domestic value added of bilateral trade is necessary. Assuming that the share of domestic value added of exports follows a uniform distribution is not appropriate and is misleading. Consumers’ preferences vary across countries. Consumers in developed countries tend to be relatively more brand sensitive than those in developing countries. It is highly likely that assembled products in the PRC with global brands are mostly exported to industrialized countries, while the PRC’s exports with local brands target developing countries. In addition, consumption bundles of high income countries differ substantially from those of low income countries. Heterogeneity of consumer preferences over countries suggests that the domestic content of the PRC’s exports changes across its trading partners. Resource endowments and relative technological differences can affect the export composition of the PRC’s bilateral trade and thus the corresponding domestic value added. Moreover, countries involved in the same GVCs perform distinctive tasks. The bilateral trade patterns of a country with its upstream partners may be different from those with its downstream partners. Xing (2012) shows that the US and the EU are the major destination markets of the PRC’s processing exports, while East Asian economies are the major sources of processing
11

ADBI Working Paper 493 Xing
imports. Hence, the domestic content of the PRC’s exports to the source market should be different of that to the destination market. How important is this heterogeneity? Is it trivial and can be it ignored when estimating trade in value added?
As showed previously, the domestic value added of processing exports with imported materials is about 48%, while that of processing exports with supplied materials is much lower, about 14%. Unambiguously, the weight of processing exports affects the overall value added of exports, in particular when processing exports comprise a large portion of exports.
To examine the cross-economy heterogeneity of processing exports, we calculate shares of processing exports in the PRC’s top 40 destination markets in 2012. It is well known that Hong Kong, China has been functioning as a transit port for the PRC’s exports to the rest of the world. We exclude Hong Kong, China in the comparison. Instead, we allocate processing exports to Hong Kong, China proportionally to the rest of the economies. Figure 4 presents the results.
Figure 4: Processing Exports and Domestic Value Added of the People’s Republic of China by Trading Partner, 2012
(%)
0102030405060708090
100
Net
herl
ands
Sing
apor
e
Repu
blic
of K
orea
Uni
ted
Stat
es
Japa
n
Finl
and
Mex
ico
Taip
ei,C
hina
Ger
man
y
Fran
ce
Uni
ted
King
dom
Cana
da
Pola
nd
Aust
ralia
Belg
ium
Thai
land
Italy
Turk
ey
Braz
il
Mya
nmar
Arge
ntin
a
Uni
ted
Arab
Em
irate
s
Indo
nesia
Pana
ma
Viet
Nam
Spai
n
Phili
ppin
es
Indi
a
Russ
ian
Fede
ratio
n
Vene
zuel
a
Chile
Saud
i Ara
bia
Sout
h A
fric
a
Paki
stan
Ukr
aine
Bang
lade
sh
Iran
Nig
eria
Egyp
t
Kaza
khst
an
Processing Exports Domestic Value Added
Source: Author’s calculations. Clearly shares of processing exports vary significantly across trading partners. Generally the share tends to be high for developed economies, and makes up 67%, 60%, and 59% of the PRC’s exports to the Netherlands, Singapore, and the US. On the other hand, processing exports represent a relatively small portion of exports to developing economies, for instance, about 15%, 14% and 12% to Nigeria, Egypt, and Kazakhstan, respectively. The simple descriptive analysis implies that processing exports serve mainly industrialized economies. Applying equation (A), we estimate upper limits of the domestic value added of the PRC’s exports to these 40 economies. The estimates suggest that domestic value added of the exports to the Netherlands and the US are 55% and 61%, respectively. The upper limits of some lower income economies, such as Egypt, Pakistan, and Kazakhstan exceed 90%. Hence, the heterogeneity of the domestic value added of the PRC’s exports across destinations is too large to be ignored in the estimation of trade in value added.
12
ADBI Working Paper 493 Xing
5. COMPARING OUR ESTIMATES WITH THE OECD TIVA DATABASE
All published estimates of trade in value added are derived from international input–output tables. Compared with the input–output approach, the methodology adopted here is simple and straightforward. An interesting question is how reliable the estimates of this study are and whether there exists a large difference between estimates derived with the two different approaches. To answer this question, we compare our estimates with those derived from input–output tables. To do so, we first estimate the domestic content of the PRC’s total exports. Because we are unable to calculate how much imported raw materials and energy is used in manufacturing exports, we simply exclude the value of these inputs and assume that reported processing imports represent the “entire foreign content” embedded in the PRC’s exports. Obviously, this simplification leads to an overestimation of the domestic content. The estimates, however, can be used as an upper limit to check the accuracy and reliability of the estimates with the input–output approach. We compare the estimates of this study with that of the OECD from 1995 to 2009. Since processing exports play a critical role in determining the share of domestic content, we include shares of processing exports in the comparison.
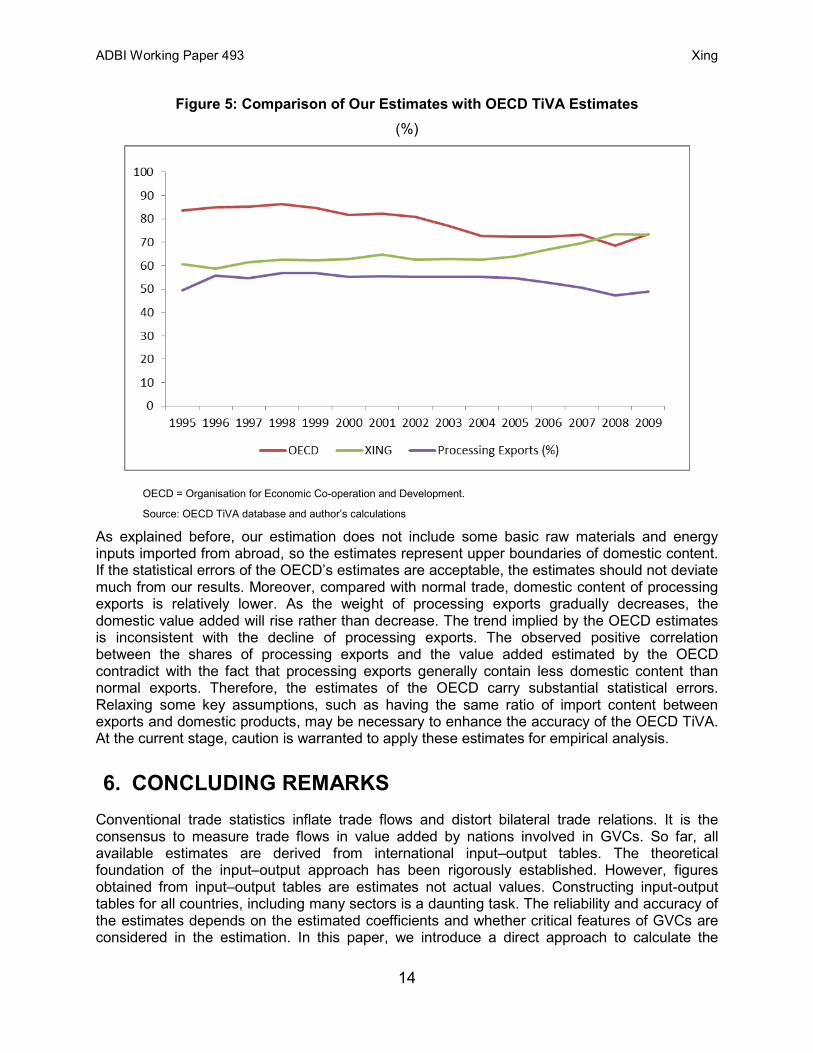
Figure 5 shows year-by-year comparisons of the estimates. The OECD estimates for the years 1995–2007 are much higher than those estimated in this study. The differences are significant and of more than 18 percentage points for more than half of the estimates. In 2000, according to the OECD, domestic content made up 81.7% of the PRC’s exports while our estimate suggests a share of 62.9%. Similarly, the OECD concludes that 72.3% of value added of the exports was generated domestically in 2005, but this study finds that the domestic content was no more than 64%. Furthermore, the estimates of the OECD indicate a declining trend of domestic content from 83.6% to 73.4% during the period 1995–2009; our estimates imply a rising trend from 60.8% to 73.2%. Moreover, the changing dynamics implied by the estimates of the OECD are inconsistent with those of processing exports. According to the OECD, domestic value added rose from 83.6% to 86.4% from 1995 to 1999, while the share of processing exports jumped to 57% from 49.5%. The increase of processing exports suggests that the domestic value added of the PRC’s exports should decrease rather than increase. The estimates of the OECD contradict to intuition. Moreover, by 2009, the share of processing exports dropped to 49%, but the OECD estimates suggest that the domestic content also fell to 73.4%. The decrease in processing exports implies an increase in the share of normal exports, which are supposed to have relatively higher domestic content than processing exports. Thus, the share of the domestic value added of the PRC’s total exports should be expected to rise during the period. The decrease implied by the OECD estimate cannot be justified theoretically.
13
ADBI Working Paper 493 Xing
Figure 5: Comparison of Our Estimates with OECD TiVA Estimates (%)
OECD = Organisation for Economic Co-operation and Development.
Source: OECD TiVA database and author’s calculations
As explained before, our estimation does not include some basic raw materials and energy inputs imported from abroad, so the estimates represent upper boundaries of domestic content. If the statistical errors of the OECD’s estimates are acceptable, the estimates should not deviate much from our results. Moreover, compared with normal trade, domestic content of processing exports is relatively lower. As the weight of processing exports gradually decreases, the domestic value added will rise rather than decrease. The trend implied by the OECD estimates is inconsistent with the decline of processing exports. The observed positive correlation between the shares of processing exports and the value added estimated by the OECD contradict with the fact that processing exports generally contain less domestic content than normal exports. Therefore, the estimates of the OECD carry substantial statistical errors. Relaxing some key assumptions, such as having the same ratio of import content between exports and domestic products, may be necessary to enhance the accuracy of the OECD TiVA. At the current stage, caution is warranted to apply these estimates for empirical analysis.
6. CONCLUDING REMARKS Conventional trade statistics inflate trade flows and distort bilateral trade relations. It is the consensus to measure trade flows in value added by nations involved in GVCs. So far, all available estimates are derived from international input–output tables. The theoretical foundation of the input–output approach has been rigorously established. However, figures obtained from input–output tables are estimates not actual values. Constructing input-output tables for all countries, including many sectors is a daunting task. The reliability and accuracy of the estimates depends on the estimated coefficients and whether critical features of GVCs are considered in the estimation. In this paper, we introduce a direct approach to calculate the
14
ADBI Working Paper 493 Xing
domestic value added of the PRC’s exports. We prove mathematically that the method can be used to calculate domestic content without the double counting problem. The major pitfall of the method is that imported raw materials and energy inputs are omitted, thus domestic value added tends to be overestimated. Our estimates should therefore be considered as an upper limit of domestic value added. We also analyze the heterogeneity of the PRC’s processing exports over its major trading partners and find that shares of processing exports to high income economies are generally higher than those to low income economies, suggesting that domestic content varies across destination markets. Comparison between the results of this study and the OECD TiVA database indicates that the OECD substantially overestimates the domestic value added of the PRC’s exports, and the time trend suggested by the OECD estimates is inconsistent with the fact that the share of processing exports has gradually declined over time.
15

ADBI Working Paper 493 Xing
REFERENCES Degain, C. and Maurer, A. Forthcoming. Global Value Chains: Implications for Trade Statistics
and Trade Policy. In Innovative Analytical Approaches to Modern International Trade along Global Value Chains, edited by Y. Xing.
Hummels, D., J. Ishii, and K. Yi. 2001. The Nature and Growth of Vertical Specialization in the World Trade. Journal of International Economics 54: 75–96.
IDE-JETRO and WTO. 2012. Trade Patterns and Global Value Chains in East Asia, Tokyo: IDE-JETRO.
Koopman, R., Z. Wang, and J. We. 2009. A world Factory in Global Production Chains: Estimating Imported Value Added in Chinese Exports. Discussion Paper No. 7430. London: Centre for Economic Policy Research.
Koopman R., Z. Wang, and S. J. Wei. 2012. The Value-Added Structure of Gross Exports and Global Production Network. Paper presented at the Final WIOD Conference “Cause and Consequences of Globalization,” April. Groningen, the Netherlands.
Meri, T. 2009. China Passes the EU in High-Tech Exports. Science and Technology, Eurostat Statistics in Focus. Accessed 24 September 2013. http://epp.eurostat.ec.europa.eu/cache/ITY_OFFPUB/KS-SF-09-025/EN/KS-SF-09-025-EN.PDF
OECD–WTO. 2013. Trade in Value-Added: Concepts, Methodologies and Challenges, Loint OECD–WTO Note. http://www.oecd.org/sti/ind/49894138.pdf
Rodrik, D. 2006. What’s So Special about China’s Exports. NBER Working Paper No. 11947. Cambridge, MA: National Bureau of Economic Research.
Scott, R. E. 2012. The China Toll: Growing US Trade Deficit with China Cost More than 2.7 Million Jobs between 2001 and 2011, with Losses in Every State. EPI Briefing Paper No.345. EPI.
UNCTAD. 2013. World Investment Report 2013, Geneva: United Nations Publication.
Xing, Y. 2012. Processing Trade, Exchange Rates and China’s Bilateral Trade Balance. Journal of Asian Economics 23(5): 540–547.
Xing, Y. 2014. China’s High-tech Exports: the Myth and Reality. Asian Economic Papers 13(1): 109–123.
Xing, Y., and N. Detert. 2010. How the iPhone Widens the United States Trade Deficit with the People’s Republic of China. ADBI Working Paper 257. Tokyo: Asian Development Bank Institute.
16


![U.S. Representation in International Standards Development ... · [XXXX] is China’s top exporter of feed milling equipment, representing more than 50% of China’s exports in 2014](https://img.pdfslide.net/doc/110x75/5ea74a75292bd3336336cafc/us-representation-in-international-standards-development-xxxx-is-chinaas.jpg)