Embed Size (px)
Citation preview
1
Measuring Value Based Care with Patient Reported Outcomes
Session #49, February 20, 2017
Laurence Higgins, MD, Brigham and Women’s Hospital
Scott Bradley, MBA, OM1

2
Speaker Introduction
Scott Bradley, MEM, MBA
VP Product Strategy
OM1
Laurence Higgins, MBA, MD
Chief of Sports Medicine/Shoulder Service, Dept. Orthopedic Surgery
Brigham and Women’s Hospital

3
Conflict of InterestScott Bradley, MEM, MBA
Salary: Employed by OM1
Royalty: None
Receipt of Intellectual Property Rights/Patent Holder: None
Consulting Fees (e.g., advisory boards): None
Fees for Non-CME Services Received Directly from a Commercial Interest or their Agents (e.g.,
speakers’ bureau): None
Contracted Research: None
Ownership Interest (stocks, stock options or other ownership interest excluding diversified mutual
funds): Equity ownership in OM1

4
Conflict of InterestLaurence Higgins, MD, MBA
Salary: Advisor for OM1
Royalty: None
Receipt of Intellectual Property Rights/Patent Holder: None
Consulting Fees (e.g., advisory boards): None
Fees for Non-CME Services Received Directly from a Commercial Interest or their Agents (e.g.,
speakers’ bureau): None
Contracted Research: None
Ownership Interest (stocks, stock options or other ownership interest excluding diversified mutual
funds): None

5
Agenda
Scott Bradley, VP Product Strategy
• The missing link in value-based care
• Design for Success
• “Behind the Scenes”
Larry Higgins, MD
• Value-Based Care: CJR Bundle
• Using PROs in practice

6
Learning Objectives
• Describe Patient Reported Outcomes, their history, and how they differ from
patient satisfaction ratings.
• Assess the clinical use-cases for patient reported outcomes supporting
value-based care.
• Evaluate and critique technology and design using principles of patient
outcomes measurement.

7
An Introduction of How Benefits Were Realized for the Value of Health ITInclude one slide at the beginning of the presentation that links and frames the presentation to demonstrate the benefits realized for one or more STEPS™ value categories. Use metrics where possible.
Please see STEPS™ slide templates & guidelines for detailed instructions on utilizing the STEPS™ framework in your HIMSS17 presentation.
8
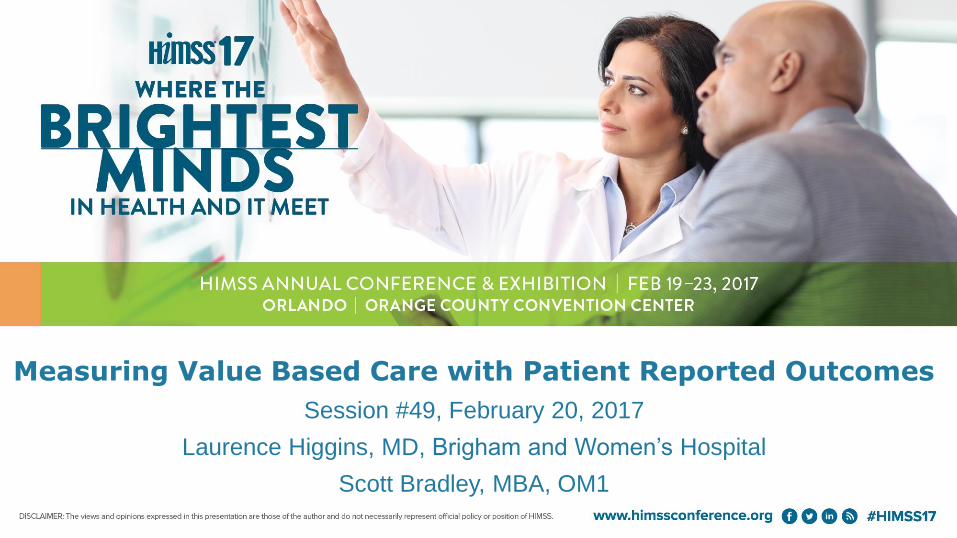
Involving patients in
patient reported
outcomes and shared-
decision making leads to
improved patient and
provider satisfaction.
Measuring PROs
supports patient
engagement. Individual
outcomes are
fundamental to
managing populations.
Success with Value-
Based Care plans
requires a quantified
measure of outcomes.
You can’t improve what
you can’t measure.

9
Val D’Isere - Edelweiss

10
What is Value? It's personal...
ME - Outcome
OTHERS -
Cost?
Time?
Resources?
Payment?
VALUE = outcome/cost

11
Our future?

12
HHS Goals

13
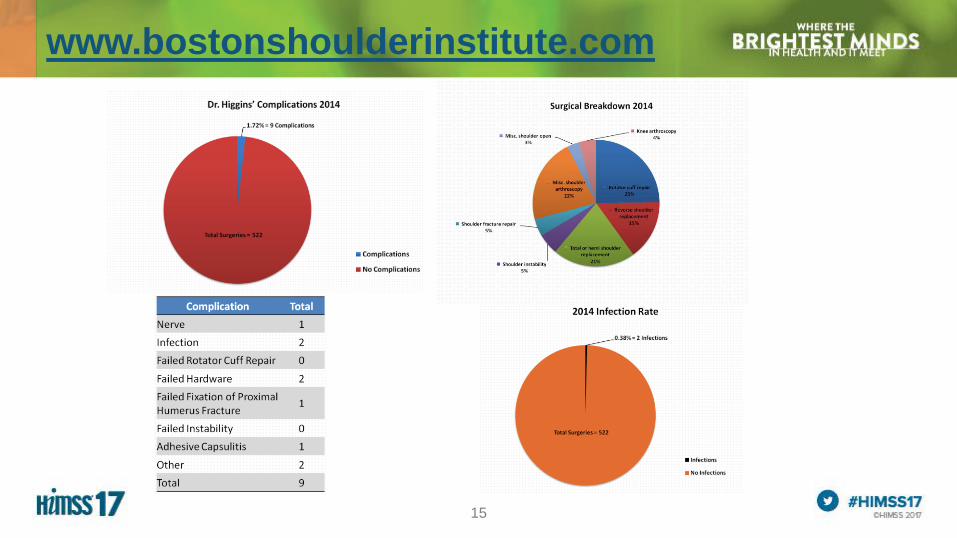
Outcomes publications

16
Overriding Goals
Determine true cost
of care
Encourage
transparency in
outcomes
Foster collaboration
through IPU
Re-evaluate and
improve
continuously
Value-Based Delivery
Shoulder Care
“If you can’t measure it, you can’t manage it. If you can’t
manage it, you can’t improve it.”
Galileo, Lord Kelvin, Peter Drucker, Edward Deming,
Bob Kaplan & Dave Norton.
17
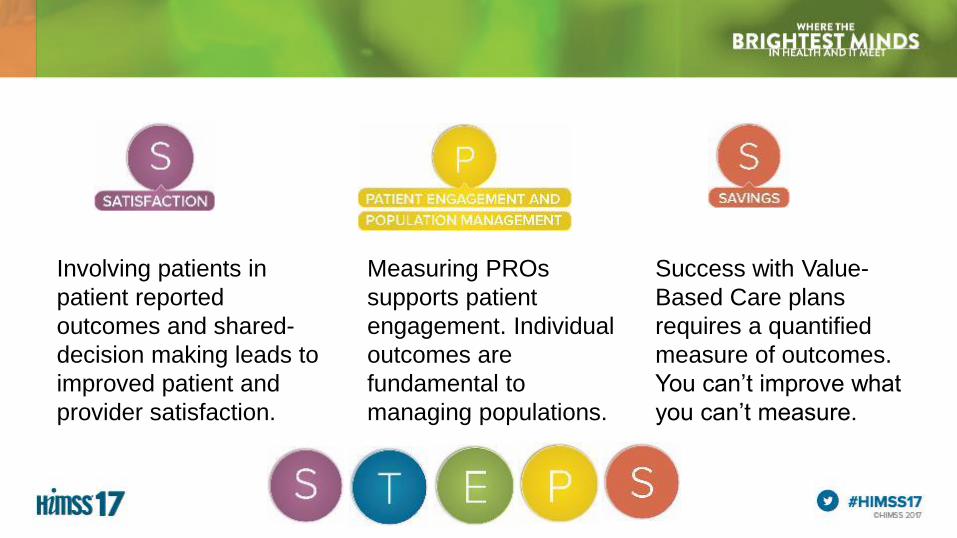
Rotator Cuff Disease TDABC Project
TDABC Study Care CycleDiagnosis
Phase
Imaging
Pre-Op PT
MD Visit
17

18
18

19
Determined Resources
For each process step we must identify:
1. Time to perform activity
2. Personnel
3. Consumable supplies
4. Equipment
5. Space
RESOURCE CONSUMPTION EQUATION:
Time
(min)
Resources incurred (qty)
• Personnel
• Space
• Equipment
• Consumables
• Allocated overhead
xxProbability
(%)x
Capacity Cost Rate ($/min)
• Personnel
• Space
• Equipment
• Consumables
• Allocated overhead
20
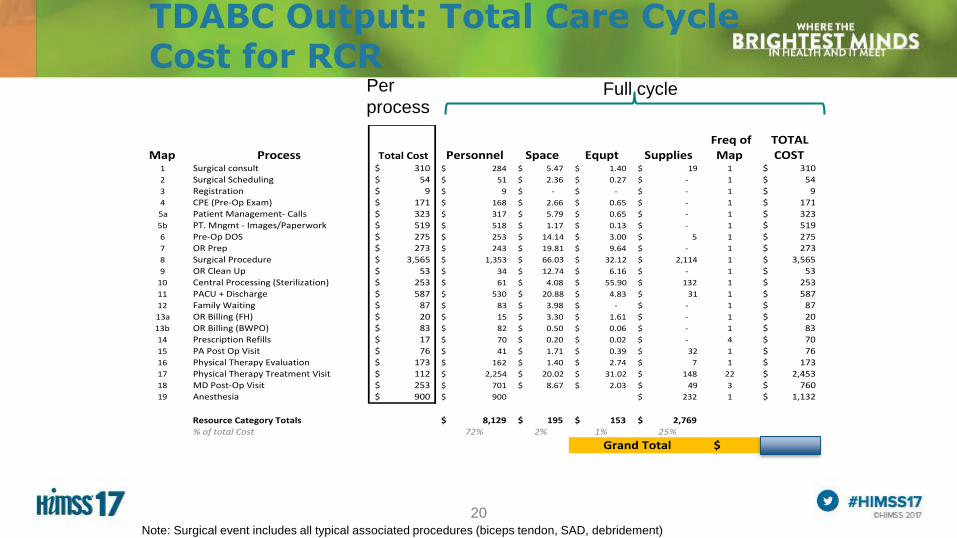
TDABC Output: Total Care Cycle Cost for RCR
Full cycle Per
process
Note: Surgical event includes all typical associated procedures (biceps tendon, SAD, debridement)
Map Process TotalCost Personnel Space Equpt SuppliesFreqofMap
TOTALCOST
1 Surgicalconsult 310$ 284$ 5.47$ 1.40$ 19$ 1 310$
2 SurgicalScheduling 54$ 51$ 2.36$ 0.27$ -$ 1 54$
3 Registration 9$ 9$ -$ -$ -$ 1 9$
4 CPE(Pre-OpExam) 171$ 168$ 2.66$ 0.65$ -$ 1 171$
5a PatientManagement-Calls 323$ 317$ 5.79$ 0.65$ -$ 1 323$
5b PT.Mngmt-Images/Paperwork 519$ 518$ 1.17$ 0.13$ -$ 1 519$
6 Pre-OpDOS 275$ 253$ 14.14$ 3.00$ 5$ 1 275$
7 ORPrep 273$ 243$ 19.81$ 9.64$ -$ 1 273$
8 SurgicalProcedure 3,565$ 1,353$ 66.03$ 32.12$ 2,114$ 1 3,565$
9 ORCleanUp 53$ 34$ 12.74$ 6.16$ -$ 1 53$10 CentralProcessing(Sterilization) 253$ 61$ 4.08$ 55.90$ 132$ 1 253$
11 PACU+Discharge 587$ 530$ 20.88$ 4.83$ 31$ 1 587$
12 FamilyWaiting 87$ 83$ 3.98$ -$ -$ 1 87$
13a ORBilling(FH) 20$ 15$ 3.30$ 1.61$ -$ 1 20$13b ORBilling(BWPO) 83$ 82$ 0.50$ 0.06$ -$ 1 83$
14 PrescriptionRefills 17$ 70$ 0.20$ 0.02$ -$ 4 70$
15 PAPostOpVisit 76$ 41$ 1.71$ 0.39$ 32$ 1 76$
16 PhysicalTherapyEvaluation 173$ 162$ 1.40$ 2.74$ 7$ 1 173$17 PhysicalTherapyTreatmentVisit 112$ 2,254$ 20.02$ 31.02$ 148$ 22 2,453$
18 MDPost-OpVisit 253$ 701$ 8.67$ 2.03$ 49$ 3 760$19 Anesthesia 900$ 900$ 232$ 1 1,132$
ResourceCategoryTotals 8,129$ 195$ 153$ 2,769$
%oftotalCost 72% 2% 1% 25%
11,245$GrandTotal

21
TDABC Output: Total Care Cycle Cost for RCR
Full cycle Per
process
Note: Surgical event includes all typical associated procedures (biceps tendon, SAD, debridement)
Map Process TotalCost Personnel Space Equpt SuppliesFreqofMap
TOTALCOST
1 Surgicalconsult 310$ 284$ 5.47$ 1.40$ 19$ 1 310$2 SurgicalScheduling 54$ 51$ 2.36$ 0.27$ -$ 1 54$
3 Registration 9$ 9$ -$ -$ -$ 1 9$
4 CPE(Pre-OpExam) 171$ 168$ 2.66$ 0.65$ -$ 1 171$
5a PatientManagement-Calls 323$ 317$ 5.79$ 0.65$ -$ 1 323$
5b Pt.Mngmt-Images/Paperwork 519$ 518$ 1.17$ 0.13$ -$ 1 519$6 Pre-OpDOS 275$ 253$ 14.14$ 3.00$ 5$ 1 275$
7 ORPrep 273$ 243$ 19.81$ 9.64$ -$ 1 273$
8 SurgicalProcedure 3,565$ 1,353$ 66.03$ 32.12$ 2,114$ 1 3,565$9 ORCleanUp 53$ 34$ 12.74$ 6.16$ -$ 1 53$
10 CentralProcessing(Sterilization) 253$ 61$ 4.08$ 55.90$ 132$ 1 253$
11 PACU+Discharge 587$ 530$ 20.88$ 4.83$ 31$ 1 587$12 FamilyWaiting 87$ 83$ 3.98$ -$ -$ 1 87$
13a ORBilling(FH) 20$ 15$ 3.30$ 1.61$ -$ 1 20$
13b ORBilling(BWPO) 83$ 82$ 0.50$ 0.06$ -$ 1 83$
14 PrescriptionRefills 17$ 70$ 0.20$ 0.02$ -$ 4 70$
15 PAPostOpVisit 76$ 41$ 1.71$ 0.39$ 32$ 1 76$
16 PhysicalTherapyEvaluation 173$ 162$ 1.40$ 2.74$ 7$ 1 173$
17 PhysicalTherapyTreatmentVisit 112$ 2,254$ 20.02$ 31.02$ 148$ 22 2,453$
18 MDPost-OpVisit 253$ 701$ 8.67$ 2.03$ 49$ 3 760$19 Anesthesia 900$ 900$ 232$ 1 1,132$
ResourceCategoryTotals 8,129$ 195$ 153$ 2,769$
%oftotalCost 72% 2% 1% 25%
11,245$GrandTotal

22
RCR Post Op Care of the Future- Simulation
22
POST OP CARE OF THE FUTURE
Treatment Type Single Visit CURRENT MODEL
HIGH VALUE RESOURCE
MODEL
Cost # Total Cost # Total COST
PA POST-OP VISITS $ 76 1
$
76 1 $ 76
MD POST-OP VISIT $ 253 3
$
760 2 $ 507
PT EVALUATION $ 173 1
$
173 1 $ 173
PT TREATMENT VISIT $ 112 22
$
2,453 22 $ 2,453
PAPERWORK RELATED TO PT $ 12 22
$
268 22 $ 268
PAPERWORK RELATED TO OTHER POST-OP CARE $ 12 3
$
37 3 $ 37
MD PHONE CALL TO PATIENT/THERAPIST $ 171 1
$
171 2 $ 341
POD#1 - FELLOW/PA PHONE CALL TO PATIENT $ 22 1
$
22 1 $ 22
FELLOW/PA PHONE CALL TO PATIENT $ 22 3
$
65 3 $ 65
PA - RX REFILL $ 18 3
$
53 3 $ 53
X-BOX $ 399 0 $ - 0 $ -
GROUP PHYSICAL THERAPY $ 22 0 $ - 0 $ -
$
4,57
6$
3,641

23

24
Patient
Patient MY, Age: 64, M
Procedure: Primary R-side
RCR
Dec 2014
Recovery Curve

25
Patient sustained
a fall @ 7 weeks

26
Outcome delivered

27
Value delivered

28

29

30

31
32

33
I. The missing link in value-based care
II. Design for Success
III.“Behind the Scenes”
34
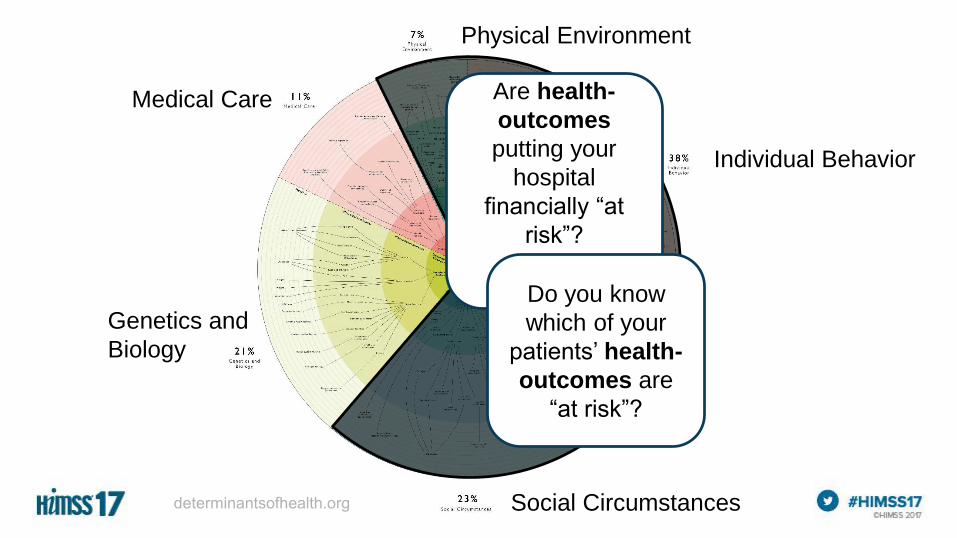
Medical Care
Individual Behavior
Social Circumstances
Genetics and
Biology
Physical Environment
Are health-
outcomes
putting your
hospital
financially “at
risk”?
Do you know
which of your
patients’ health-
outcomes are
“at risk”?
35
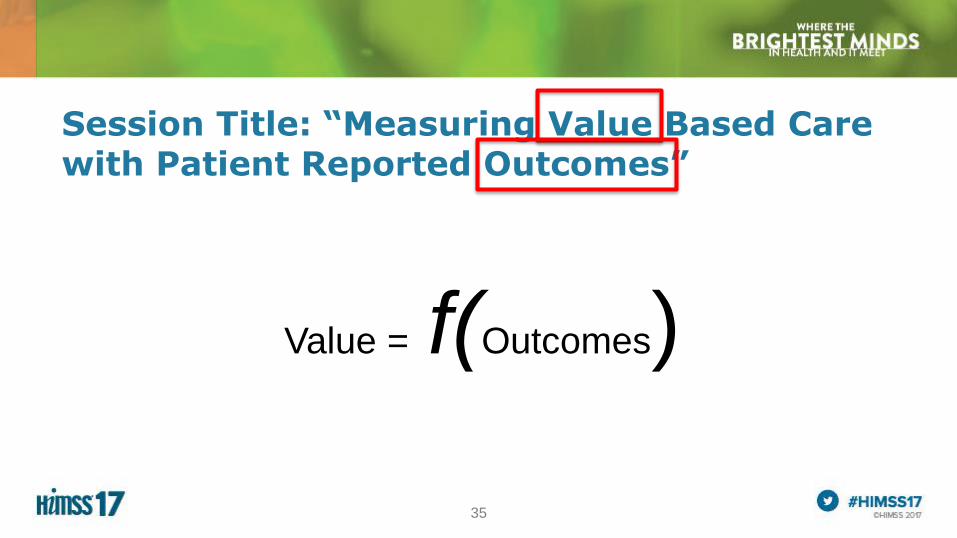
Session Title: “Measuring Value Based Care with Patient Reported Outcomes”
Value = f(Outcomes)
36
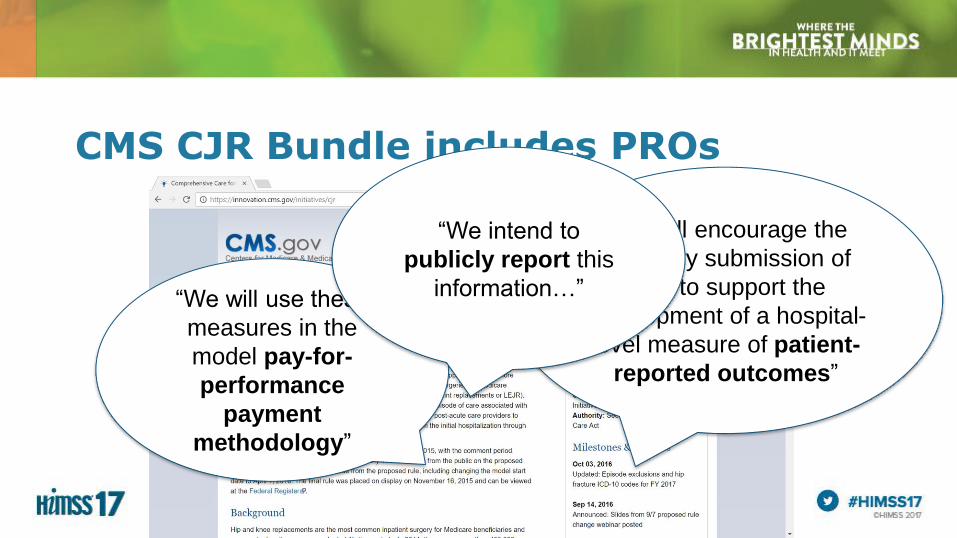
CMS CJR Bundle includes PROs
“We will encourage the
voluntary submission of
data to support the
development of a hospital-
level measure of patient-
reported outcomes”
“We will use these
measures in the
model pay-for-
performance
payment
methodology”
“We intend to
publicly report this
information…”
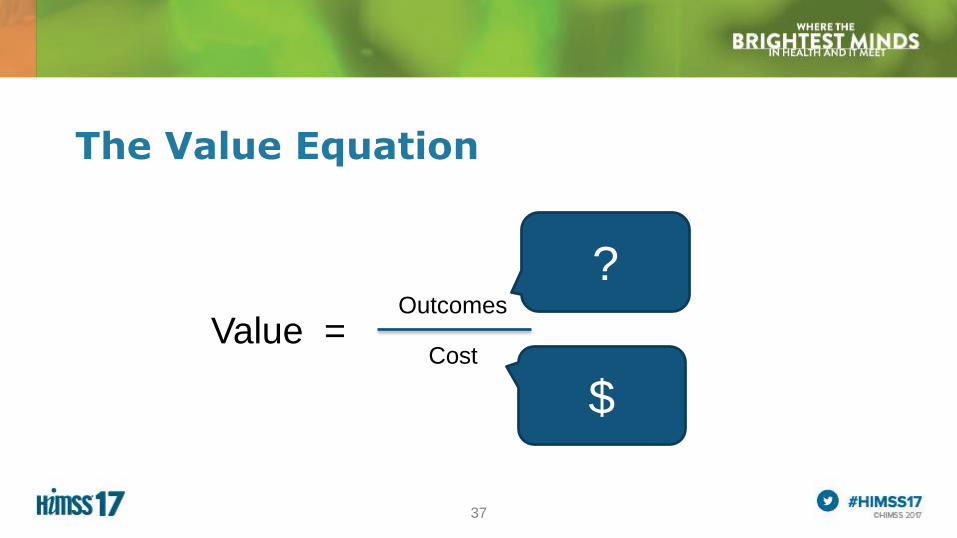
37
The Value Equation
Value = Outcomes
Cost
$
?

“…quality measurement focuses
overwhelmingly on care processes. For
example, of the 78 Healthcare Effectiveness
Data and Information Set (HEDIS)
measures… all but 5 are clearly process
measures, and none are true outcomes.
Process measurement, though a useful
internal strategy for health care institutions, is
not a substitute for measuring outcomes.”

39

40
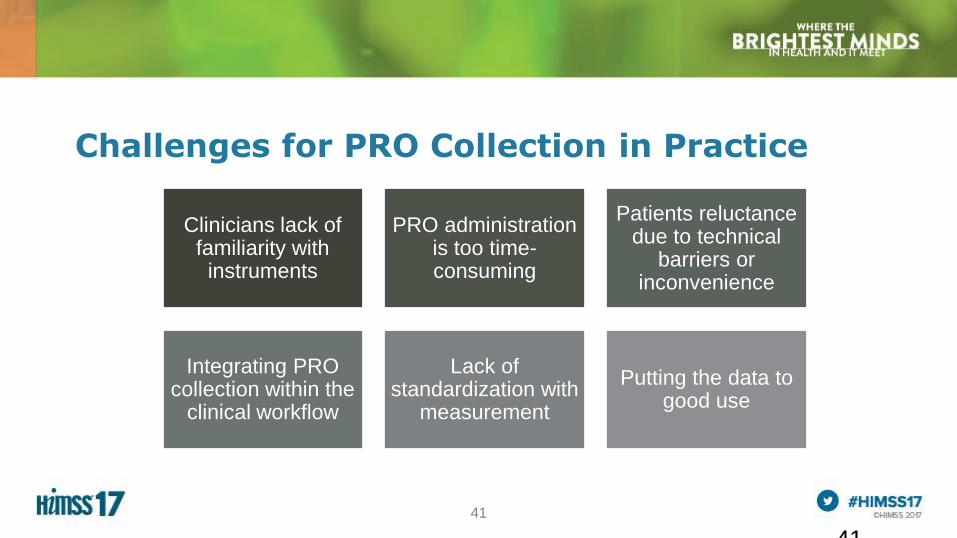
41
Challenges for PRO Collection in Practice
41
Clinicians lack of familiarity with
instruments
PRO administration is too time-consuming
Patients reluctance due to technical
barriers or inconvenience
Integrating PRO collection within the
clinical workflow
Lack of standardization with
measurement
Putting the data to good use

42

4343
ParticipantDemographics
Genetics
Family/Participant/Social History
Functional/Performance Status
Health Behaviors
Environmental Exposures
Preferences for Care
DiseaseDiagnosis
Risk Factors
Staging Systems
Genetics of Disease
Tissue or Infectious Agent
Biomarkers
Comorbidities/Symptoms
Assessment Scales
Physical Findings
Severity
Disease Understanding
ProviderTraining/Experience
Geography
Practice Setting
Academic vs. Community
TypeSurgical
Medical
Device
Alternative
Education
IntentPalliative/Management vs. Curative
SurvivalOverall Mortality
Cause-Specific Mortality
Disease Free Survival/Other
Clinical ResponseRecurrence/Exacerbation/Improvement
Progression/Change in Status/Other
Events of InterestAdverse
Events/Exacerbations/Complications
Patient ReportedFunctioning
Quality of Life
Other
Resource UtilizationInpatient Hospitalization/
Office Visits/ED Visits/
Productivity/
Additional
Treatments/Procedures/Direct
Cost/Other------------------------------
Impact on Non-Participant
Experience of Care
Characteristics Treatment Outcomes
Gliklich RE, Leavy MB, Karl J, Campion DM, Levy D, Berliner E. A framework for creating standardized outcome measures for patient registries. J Comp Eff Res. 2014;3(5):473-480.

44
Health Concepts
• Conceptual framework for a condition
Focus Groups
• Groups of Patients with a condition
• Structured interviews to determine areas of focus
Items
• Structured questions e.g. Likert, VAS.
• Factor Analysis
ItemReduction
• Number of items reduced by removing redundancy and items that don’t matter
Reliability
• Are there consistent results obtained from use of the tool?
Validity
• Does it measure what its intended to measure?
Responsiveness
• Is the tool sensitive to real clinical change?
Creating a PRO Instrument
45
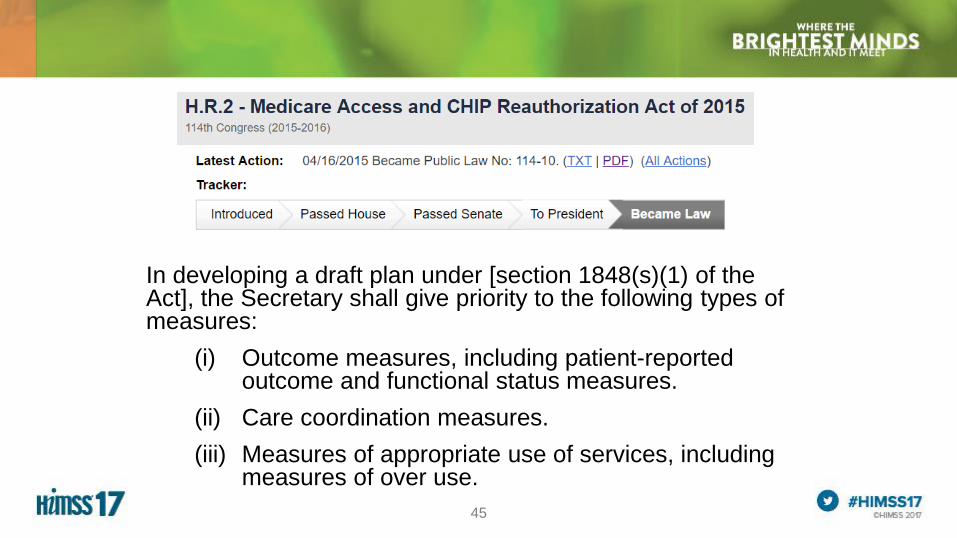
In developing a draft plan under [section 1848(s)(1) of the Act], the Secretary shall give priority to the following types of measures:
(i) Outcome measures, including patient-reported outcome and functional status measures.
(ii) Care coordination measures.
(iii) Measures of appropriate use of services, including measures of over use.

46
The 90-day episode for CJR

47
4 60 13.2
+2 points (PRO)No Reconciliation
Eligible for increase in target price
Below acceptable Acceptable Good Excellent
3% discount 2.5% discount 2% discount 1.5% discount
48
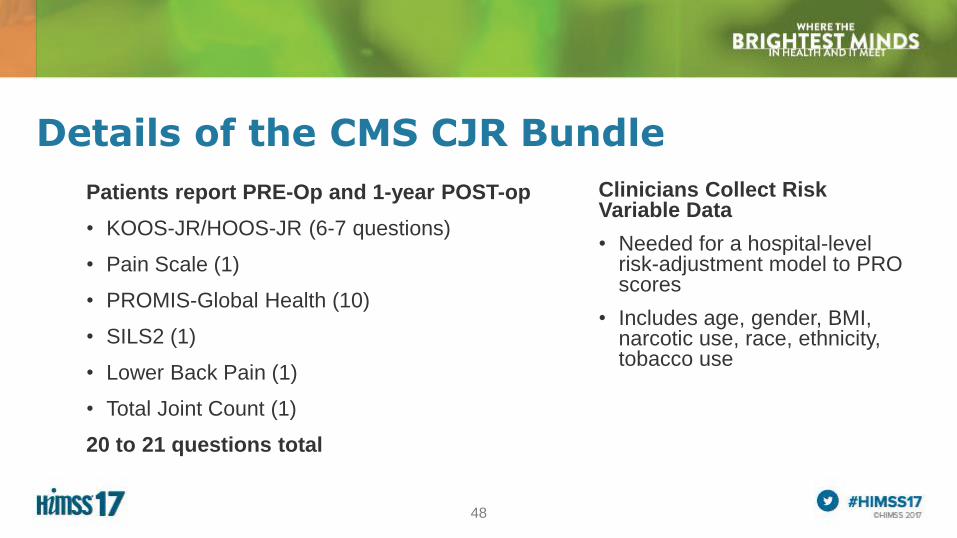
Details of the CMS CJR Bundle
Patients report PRE-Op and 1-year POST-op
• KOOS-JR/HOOS-JR (6-7 questions)
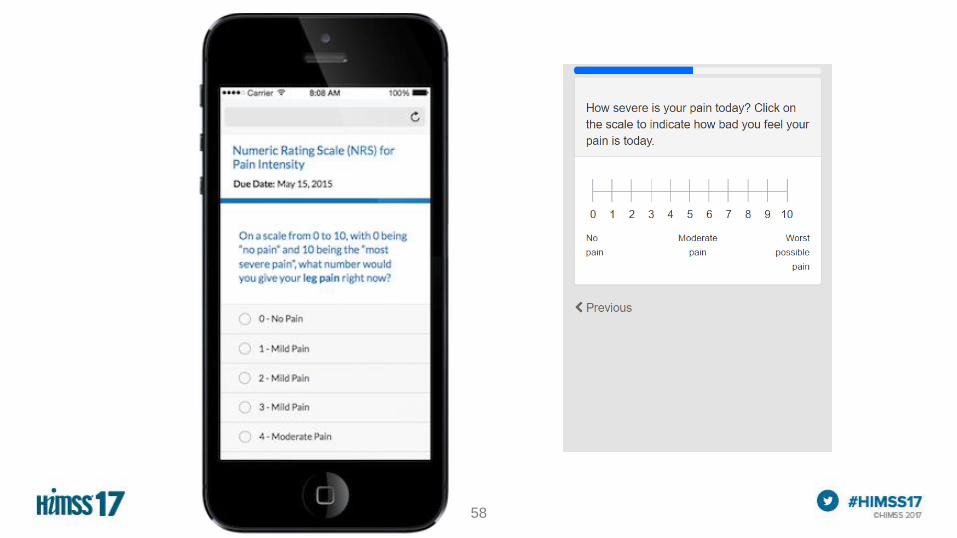
• Pain Scale (1)
• PROMIS-Global Health (10)
• SILS2 (1)
• Lower Back Pain (1)
• Total Joint Count (1)
20 to 21 questions total
Clinicians Collect Risk Variable Data
• Needed for a hospital-level risk-adjustment model to PRO scores
• Includes age, gender, BMI, narcotic use, race, ethnicity, tobacco use
49
49
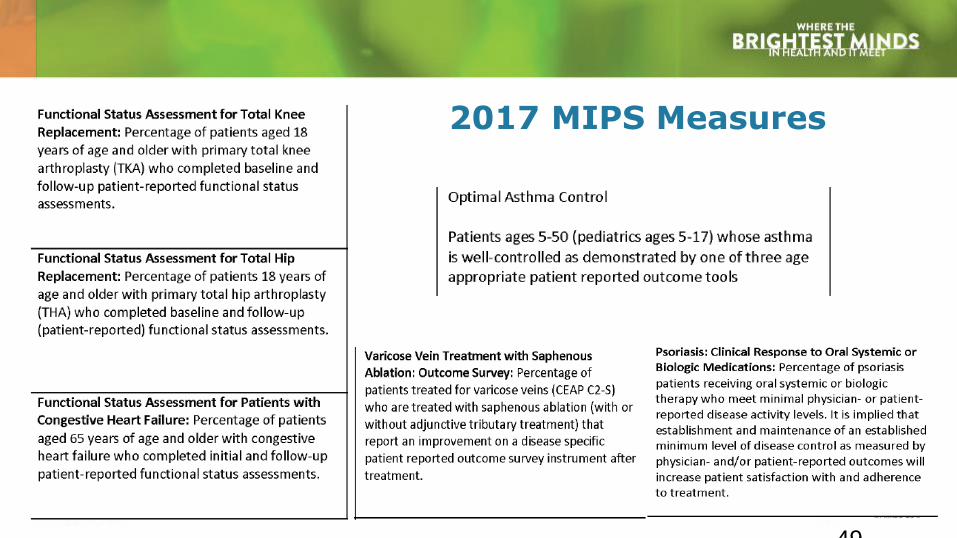
2017 MIPS Measures

50
I. The missing link in value-based care
II. Design for Success
III.“Behind the Scenes”

52
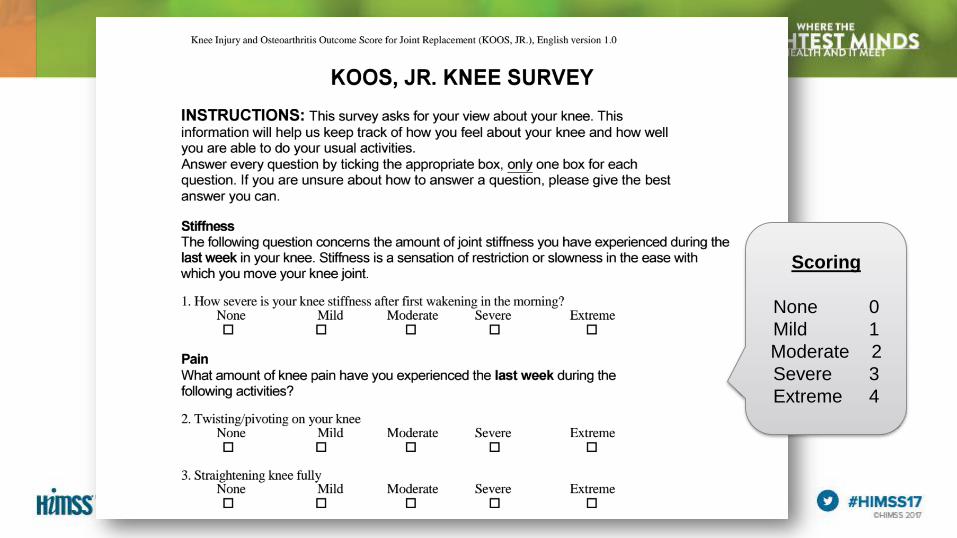
Scoring
None 0
Mild 1
Moderate 2
Severe 3
Extreme 4
53
X
X
X
X
X
X
X
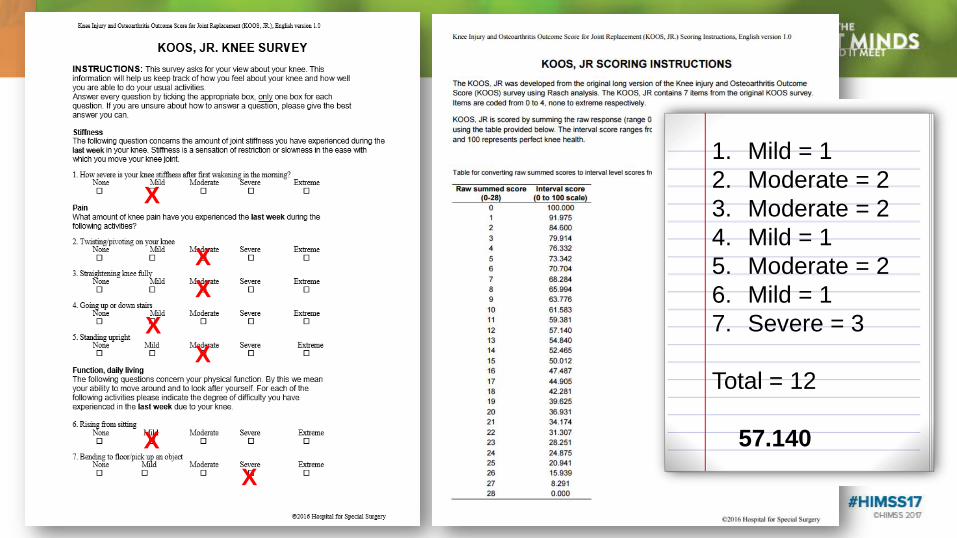
1. Mild = 1
2. Moderate = 2
3. Moderate = 2
4. Mild = 1
5. Moderate = 2
6. Mild = 1
7. Severe = 3
Total = 12
57.140
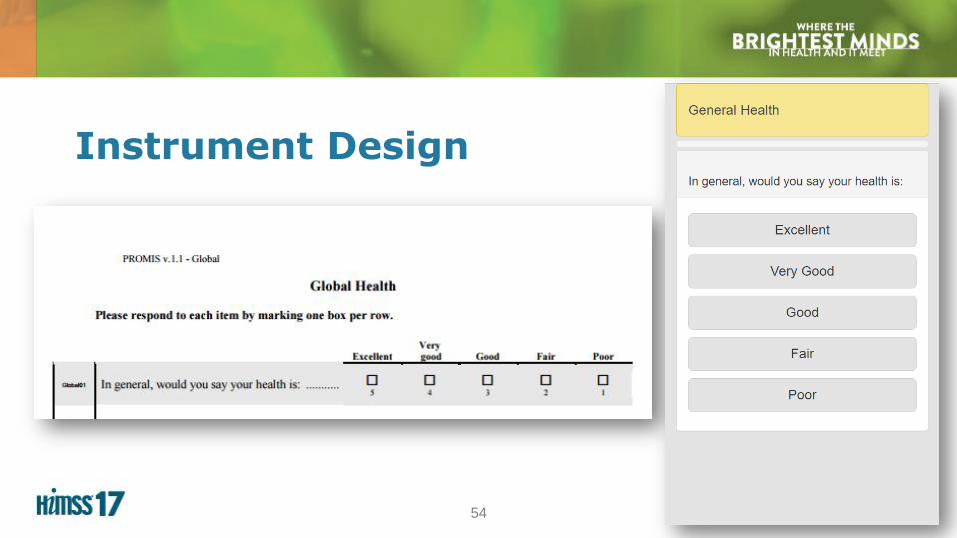
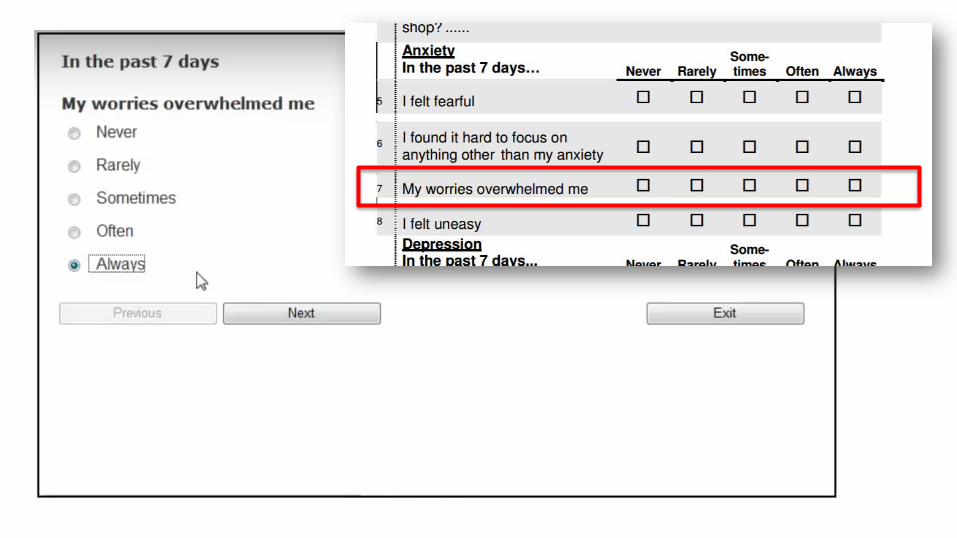
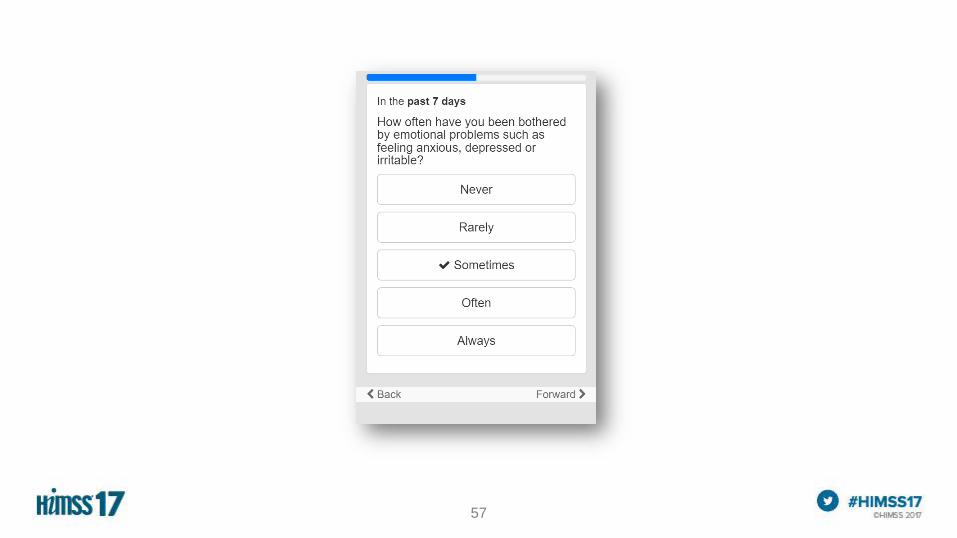
54
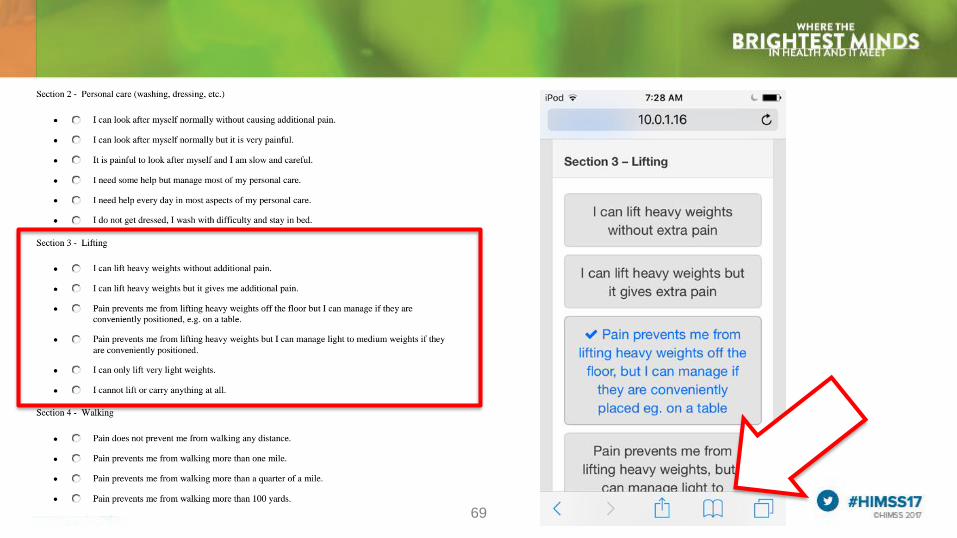
Instrument Design

56
57
58

60

61

62

63

64

65
Success Factors
Enterprise-strategy to PRO use in practice
Automation
Multilingual
Consumer-friendly (UX) and spam-free*
Surrogate data-entry
Multiple data-entry modalities
Clinical integration, including EMR integration
Secure and scalable technology
Reasonable cost
Supports MIPS, APM and value-based programs
65
66
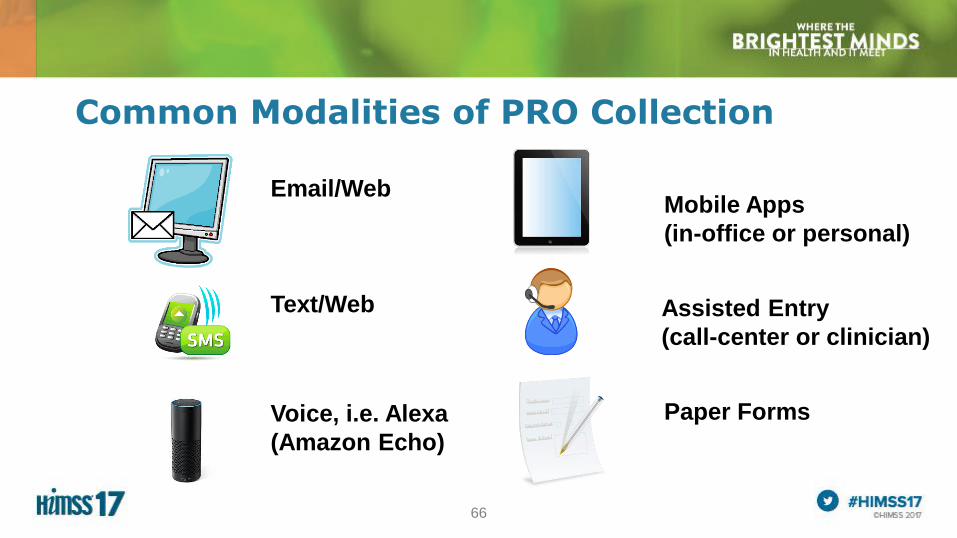
Common Modalities of PRO Collection
Email/Web
Text/Web
Mobile Apps
(in-office or personal)
Assisted Entry
(call-center or clinician)
Paper FormsVoice, i.e. Alexa
(Amazon Echo)

67
I. The missing link in value-based care
II. Design for Success
III.“Behind the Scenes”
68
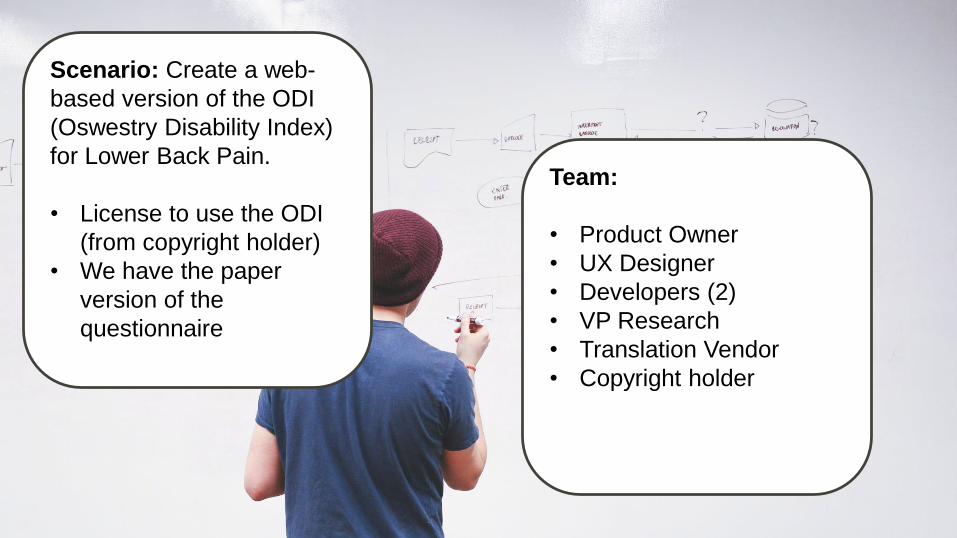
Scenario: Create a web-
based version of the ODI
(Oswestry Disability Index)
for Lower Back Pain.
• License to use the ODI
(from copyright holder)
• We have the paper
version of the
questionnaire
Team:
• Product Owner
• UX Designer
• Developers (2)
• VP Research
• Translation Vendor
• Copyright holder
69

70
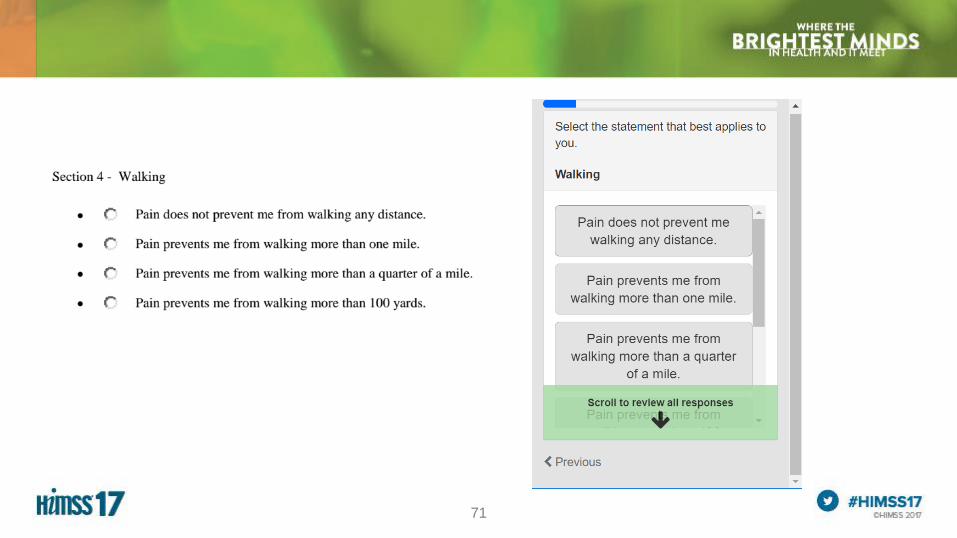
71

72

73
10 Usability Heuristics for User Interface Design
1. Visibility of system status
2. Match between system and the real world
3. User control and freedom
4. Consistency and standards
5. Error prevention
6. Recognition rather than recall
7. Flexibility and efficiency of use
8. Aesthetic and minimalist design
9. Help users recognize, diagnose, and recover from errors
10.Help and documentation

74
A Summary of How Benefits Were Realized for the Value of Health IT
Involving patients in patient reported
outcomes and shared-decision making
leads to improved patient and provider
satisfaction.
Measuring PROs supports patient
engagement. Individual outcomes are
fundamental to managing populations.
Success with Value-Based Care plans
requires a quantified measure of
outcomes. You can’t improve what you
can’t measure.
75
Questions
Please complete the online session evaluation
Scott Bradley, MEM, MBA
www.linkedin.com/in/scottbradley
Laurence Higgins, MBA, MD
617-732-8891
www.linkedin.com/in/larry-higgins-7028b212