Embed Size (px)
Citation preview
Measuring Voters’ Knowledge of Political News∗
Preliminary
Charles Angelucci† Andrea Prat‡Columbia University
April 2020
AbstractWe propose a methodology to measure voters’ knowledge of news about recent
important political events that combines a transparent protocol for identifyingstories, an incentivized quiz to elicit awareness, and estimation of a model ofindividual knowledge that includes story difficulty, partisanship, and memorydecay. We apply our methodology to measure knowledge of news about the USFederal government in a monthly sample of 1,000 US residents repeated eighttimes. People in the most informed tercile are 72% more likely than people inthe bottom tercile to know the main story of the month. We also documentlarge inequalities across socioeconomic groups (defined by age, race, gender, andincome), with the best-informed group over 16 percentage points more likely tobe aware of the typical news story compared to the least-informed group. Wefind that voters are 7-19% less likely to know stories that reflect poorly on theirpreferred political party. Time also matters, with each month passing loweringthe odds of knowing the typical news story by 5 percentage points. We repeatour study on news about the Democratic Party primaries.
∗We would like to thank Laurent Bouton, Julia Cage, Teresa Esteban Casanelles, Simone Galperti,Leo Goldman, Amit Khandelwal, Jose L. Montiel Olea, Suresh Naidu, Jacopo Perego, Vincent Pons,Miklos Sarvary, Andrey Simonov, Sevgi Yuksel, and seminar audiences at Columbia University, theUniversity of Exeter, Harvard University, the 4th Summer Workshop in Political Economy at EIEF,and the Rational Inattention and Political Economy Conference at UC San Diego for useful suggestionsand comments. We are grateful to Szymon Sacher for outstanding research assistance. We gratefullyacknowledge funding received from The Media and Technology Program at the Columbia BusinessSchool†3022 Broadway, New York, NY 10027. Email: [email protected]‡3022 Broadway, New York, NY 10027. Email: [email protected]
1
1 Introduction
The media plays an important role in providing voters with the information they need
to keep government accountable. Informed voters are aware of what the government
does and are thus in a position to punish or reward the incumbent at the next election.
The central role played by the media in maintaining government accountability is well-
documented by a growing body of literature in political economy. For example, in
the US, Snyder and Stromberg [2010] find that political districts with greater media
coverage elect representatives who work harder to promote their constituents’ interests.
Similarly, in Uganda, Reinikka and Svensson [2005] document that schools in areas with
greater newspaper coverage are better run. This logic applies to new media: Gavazza
et al. [2018] show that the expansion of broadband internet in the UK crowded out
local news and ultimately reduced local public spending.1,2
A government that is aware of the link between information and voting behavior is
also more likely to cater to the better-informed groups of voters. This proposition has
received empirical support: for example, Stromberg [2004] shows that US counties with
higher radio ownership received greater funding from the Federal Government during
the New Deal. The logic can be formalized in a simple model of retrospective voting
[Stromberg, 2001, Prat and Stromberg, 2013]. An incumbent politician knows that
voters care about her policy choices. If different social groups have different levels of
information, better informed groups will be more responsive to the incumbent’s behavior
1Other papers showing an effect of news coverage on political outcomes include Eisensee andStromberg [2007], Ferraz and Finan [2008], Gerber et al. [2009], Enikolopov et al. [2011], Banerjeeet al. [2012], Kendall et al. [2015], Labonne et al. [2019], Arias et al. [2018], and Arias et al. [2019].See Stromberg [2015] for a survey of the literature linking mass media and political outcomes.
2Media bias can also affect political outcomes [e.g., DellaVigna and Kaplan, 2007, Martin et al.,2017]. On the relationship between media bias and political outcomes see also Gentzkow et al. [2015].
2
and the latter will design policies that cater to them.3 Inequalities in knowledge of the
news are thus likely to exacerbate other existing types of inequalities [Delli Carpini and
Keeter, 1996].
Voters’ knowledge of political news is, therefore, a key ingredient of a number of
political economy models. Those theories do not just consider average news knowledge
but also how knowledge is distributed across stories and across voters. Indeed, there
exists a sizeable body of work that measures voter knowledge, and some of it focuses
on news knowledge.
Polling and research organizations regularly report survey results on voter knowledge
[e.g., Pew, 2017, Eurobarometer, 2017].4 On the academic side, the public opinion
literature has provided a number of measures for political knowledge. Price and Zaller
[1993] measure recall of 16 news stories. Examples of survey questions include: “Do you
remember any recent stories about Marine Colonel Oliver North receiving a sentence for
his conviction in the Iran-Contra Affair? [If yes:] Do you recall anything about what
sentence he received?” and “Do you recall any stories about a U.S. Supreme Court
decision this summer on abortion? [If yes:] Do you remember what the court decided?”
They find that respondents’ background level of political knowledge is the strongest
predictor of current news recall across a wide range of topics.
The canonical work in this area is Delli Carpini and Keeter [1996], who collate
about 3,700 questions asked in various surveys from 1940 to 1993, with the objective to
measure the American public’s level of political knowledge. They divide questions
3A simple model (developed in Appendix A) shows that, if ρg is the average news knowledge levelin social group g, a re-election seeking incumbent will choose her behavior as if maximizing a welfarefunction where each group’s weight is proportional to its news knowledge level.
4The American National Election Studies (ANES) also include two questions on politicalknowledge: ‘Which party had most members of congress before the election?’ and ‘Which partyhad most members of congress after the election?’.
3
into five categories, one of which is domestic politics. In the last year for which
they have information (1990), the statements are: “Who will pay for S&L bailout?”;
“Why is the Hubel telescope in the news?”; “Did Bush veto a plant closing bill?”;
“What is the illiteracy rate in US?”; “What is the percentage of population that is
hispanic/back/Jewish?”.5
In recent years, news knowledge has been examined from the perspective of fake
news. Some commentators have argued that misinformation spread through social
media has played an important role in elections and referenda around the world [e.g.,
Levitin, 2016, Stengel, 2019]. Alcott and Gentzkow [2017] measure consumption and
recall of fake news in the 2016 election, and Barrera Rodriguez et al. [2018] investigate
the role played by fake news and fact-checking on French voters’ beliefs and political
preferences. Lazer et al. [2018] discuss the prevalence and impact of the phenomenon
and potential interventions. More recently, Allcott et al. [2019] measure the effect of
Facebook on news knowledge.6 To measure knowledge, they include a list of 15 true and
false statements and ask respondents to select which, in their opinion, are true. The
true statements are borrowed from recent articles published in the New York Times,
the Wall Street Journal, Fox News, CNN, MSCNBC, and US News & World Report.
The false statements are either modifications of existing articles from the same sources
or recent fake news identified by third-party fact-checkers. Allcott et al. [2019] show
that Facebook usage tends to reduce knowledge of the news.
Any news knowledge measurement exercise faces an initial challenge: what set of
5Relatedly, Prior and Lupia [2008] measure political knowledge by administering surveys thatinclude 14 questions about facts relevant to the 2004 presidential election. They find that typical surveymethods (quick, unincentivized questions) likely underestimate citizens’ true knowledge of politics.
6See also Chen and Yang [2019] on the relationship between consumption of uncensored informationand knowledge of current events in China.
4
knowledge items should voters be tested on? As the examples above illustrate, this
challenge is hard because the set of possible political news items is unstructured,
heterogeneous, and virtually unbounded. To the best of our knowledge, the existing
literature approaches this challenge by letting the researchers – or the polling company
– select the set of news stories over which survey respondents are quizzed. While this
methodology is natural, it has drawbacks in terms of interpretation and replicability.
Only the researcher knows what universe of knowledge items he or she considered and
what criterion he or she used to select within that universe the items that ended up on
the survey. Only that particular researcher is in a position to replicate the knowledge
selection process at a different time.
This paper contributes to the literature in three ways. First, we develop and
implement a simple news selection protocol that is outside the control of the researcher.
Second, this leads to a stable news-generating stochastic process that we use to
estimate a structural model of voter knowledge. Third, the structural model allows
us to disentangle the effect of some of the factors that affect knowledge such as news
characteristics, individual characteristics, partisan congruence, and time passing.
Our news selection process consists of two steps: (i) Selection of the universe of
relevant news items. The protocol selects a news source, sets an inclusion criterion,
and identifies the set of stories that satisfy that criterion. The researcher has no hand
on the content and wording of the stories. (ii) Selection of the knowledge items to be
included in the test. The protocol specifies a process to select a subset of (i). This step
may rely on the subjective judgment of other agents, but the process must be codified.
For (i), this paper uses the set of all Reuters news wires devoted to US national politics.
For (ii), we assemble a panel of professional journalists and ask them to select – within
the subset identified in (i) – the three most important stories of the month about the
5
Federal Government. We then conduct surveys to measure US voters’ knowledge of
these stories.
The importance of a story is clearly a subjective matter, and any attempt to measure
importance ultimately relies on someone’s judgment. The proposed approach does not
aim at universality or objectivity but just transparency. The subjectivity in our protocol
can be ascribed to well-defined set of actors: a large for-profit organization like Reuters
and a panel of professional journalists. The protocol provides a way of identifying the
most important Federal Government stories according to mainstream journalism.
We exploit the protocol in a number of ways. Chiefly, we repeat the survey for
eight months on eight different panels of approximately 1,000 US citizens. On several
occasions, we also included 1- and 2-month-old stories, to measure knowledge decay over
time. Finally, we extend the protocol to news about the Democratic Party presidential
primaries, chosen among the same set of Reuters news wires about national politics
and ranked by the same panel of journalists.
Once news stories about the Federal Government are selected, we measure knowledge
in a financially incentivized survey in many ways similar to those used by, for instance,
Allcott et al. [2019], Guess [2015], Prior et al. [2015], Bullock et al. [2015], and Chen
and Yang [2019].7 Respondents are selected by polling company YouGov to produce a
nationally representative sample of US voters. As part of the survey, respondents take
multiple quizzes. In each quiz, we present our respondents with six items: the three
most important knowledge items of the month according to our panel of journalists
as well three plausible but utterly false statements. Consistent with our approach to
7On the role of partisanship and incentives to recall information accurately see Prior et al. [2015]and Bullock et al. [2015]. Both papers show that monetary incentives lead to less party cheerleaderbehavior in answering survey questions. On the effects of monetary incentives in surveys that measurepolitical knowledge see also Prior and Lupia [2008].
6
real news, we rely on the panel of journalists to create the false statements. The fake
statements cover the Federal Government and are written in the same, journalistic style
as the true knowledge items. Survey respondents are given 60 seconds to select the 3
statements which, to the best of their recollection, are true. They receive a monetary
reward in case all three true knowledge items are chosen.8
The survey data is used to estimate the distributions of parameters of a news
knowledge model. In our model knowledge is a continuous variable: when a respondent
is confronted with a news story (true or false), she assigns a probability of truth between
zero and one that depends on (i) features of the story like salience and partisanship
(e.g., whether the story reflects favorably on the Republican Party) and (ii) features
of the respondent like knowledge and ideology. The respondent uses these assigned
probabilities to select the three stories he or she thinks are most likely to be true.
The model yields a discrete choice specification that can be estimated with standard
Bayesian techniques. While every news story is different and may be harder or
easier, the stochastic generating process for both true and fake stories is exogenously
given. The main object of interest is the posterior distribution of the respondent-level
knowledge parameter, but we also obtain estimates for the salience and partisanship of
each story, as well as the effect of time passing on news knowledge.
In our main analysis, we measure voters’ knowledge of news stories about the
Federal Government. An agent’s knowledge of a particular news story is the estimated
probability the agent assigns to that story being true. Our findings can therefore be
reported at different knowledge levels. If for now we define “awareness” as attributing
8This approach implicitly defines knowledge as awareness of a fact. A deeper notion of knowledgeentails understanding that fact. One may be aware that President Trump was impeached withouttruly understanding what the impeachment process is. One limitation of our approach is that we onlyattempt to measure this more superficial form of knowledge.
7
a chance equal to at least 75% that a news story is true, according to our estimates the
average voter is aware of approximately half of the three most important news stories
of the month. About 66% of US voters know the most important (according to the
journalists) story of the month, and the share of US voters who know the second and
third most important stories of the month falls to 50% and 38%, respectively.
Significant heterogeneity across voters exists. For instance, the average voter in
the top-third of the distribution is aware of roughly 1.7 out of 3 news stories. By
contrast, the average voter in the bottom-third of the distribution is aware of roughly
1.1 news stories. Further, we find a relatively large effect of partisanship/congruence
on knowledge, with respondents being 7-19% more likely to be aware of news stories
that reflect favorably on their preferred political party. Time also significantly affects
knowledge of political news: we document that one month of time (respectively, two
months of time) reduces by 4 percentage points (respectively, 7 percentage points) the
share of voters who are aware of a given story. We also measure inequalities in news
knowledge across socioeconomic groups (defined by age, gender, race, and income).
According to our estimates, the best-informed group is over 16 percentage points more
likely to be aware of the typical news story compared to the least-informed group.9
Finally, we investigate the relationship between news diets and knowledge of the news.
We find that news consumption (defined both in number of news outlets and time
usage) positively predicts knowledge of the news. We also show that knowledge of the
news varies by news outlet, with, for example, Google News users being 1.8 percentage
points more likely than Facebook users to know the typical news story of the month
(among voters who rely on 2 or fewer news outlets).
9As noted by Prior [2014], text surveys such as ours may exaggerate knowledge inequalities byomitting visual clues (e.g., by not including pictures of actors mentioned in the news and included inour surveys).
8
We provide a number of extensions. First, we illustrate the replicability of our
methodology by focusing on a different set of knowledge items. For three months in a
row, we rely on our panel of journalists to select the 3 most important stories of the
month regarding the Democratic Party presidential primaries. In addition to showcasing
the robustness of our method, this extension allows us to measure how much attention
voters pay to a key political event. Second, we replicate our main analysis about the
Federal Government by relying on a different sample of respondents recruited through
Amazon Mechanical Turk (MTurk).
The rest of the paper is structured as follows. Section 2 reviews the news-generating
process, the survey design, and the information we collected. Section 3 describes the
model as well as our estimation approach. Section 4 reports our main results. Section
5 presents various extensions of our analysis as well as robustness checks. Section 6
concludes.
2 Design
The key components in our analysis are knowledge quizzes, in which respondents are
rewarded if they succeed in choosing the 3 true knowledge items included in a list
of 3 true and 3 false knowledge items. In this section, we review the protocol we
have employed to generate the true and false knowledge items. We also describe the
information we have collected through the surveys and some of the key variables we are
able to construct.
9
2.1 News Generating Process
We design a protocol to identify the three most important news stories of the month
that deal with the US Federal Government.
Universe of Relevant Knowledge Items. We rely on Reuters’ publicly-available
wire stories about US national politics to approximate the universe of relevant
knowledge items.10 This choice allows us to focus on essential and basic facts covered
by mainstream media. Each wire story is composed of a headline, a brief summary, a
picture, and a longer article. There are approximately 80 wire stories a week.
Generating 3 True and 3 False Knowledge Items. We rely on a panel of 3
professional journalists whom we recruited through the Columbia School of Journalism.
To avoid recency effects, each week, each journalist is asked to select and rank the 5
most important wire stories of the week according to him/her.11 Specifically, journalists
are provided with each wire story’s headline and brief summary. Journalists are also
given the url to the longer articles. Because multiple wire stories can deal with the same
underlying “meta story” (e.g., “Coronavirus” or “Trump Impeachment Enquiry”), we
ask the journalists to select only one wire story per meta story.12 At the end of every
month, we take the four previous weeks’ selected wire stories (up to 3×4×5 of them) and
pool them into their relevant meta stories (since different weeks’ wire stories can deal
with the same underlying event). We filter out the wire stories that do not cover the10Reuters’ wires dedicated to US national politics can be found at
https://www.reuters.com/news/archive/politicsNews. The typical wire headline is short andfactual, for example: Trump to hold press conference on coronavirus on Saturday in White House.
11Although we give significant discretion to our jury members in selecting the most importantstories, we do ask them to adopt US-centered criteria of importance. All our jury members are UScitizens.
12In the rare occasions where the boundaries of a meta story are blurry, journalists are allowed tocommunicate and resolve ambiguity.
10
Federal Government (by far, most stories deal with the Federal Government).13,14 We
then present each meta story and associated wire stories to our panel and ask them to
select the three most important meta stories.15 Once the three stories are selected, each
story is allocated to a journalist who is asked to write a short statement summarizing
the story or summarizing the most important fact behind the story (e.g., The U.S
Senate acquitted Trump of impeachment charges). This protocol allows us to select,
each month, the three most important news stories about the Federal Government.
As we explain below, our main instrument to estimate voters’ knowledge of
political news consists of asking them to select three out of six statements. Three
of these statements correspond to the three true statements described in the previous
paragraph. The remaining three statements are false short statements about the Federal
Government. We relied on our panel of journalists to produce these plausible but utterly
false short statements about the Federal Government. Among other pre-specified rules,
journalists were instructed to write false statements of roughly equal length as the
true statements, and in the same journalistic style.16 For each survey, a journalist was
randomly assigned to select the three fake statements from the list produced by the
whole panel.
13We adopt the US definition of the “Federal Government” as being composed of the legislative,executive, and judicial branches.
14In Section 5, we conduct our analysis by focusing on the Democratic Party presidential primariesinstead.
15Specifically, we ask each panel member to rank these stories and we then aggregate these choices.We rely on randomization to break eventual ties.
16We also instructed the panel to avoid writing negations of events that really took place. Weconducted Google searches to ensure our fake stories did not actually occur.
11
2.2 Survey Design
This paper exploits data gathered from 8 online surveys we conducted through polling
company YouGov.17 The first survey took place on the 17th of December 2018 and
the last survey on the 17th of February 2020.18 For each survey, we asked YouGov to
enroll a representative sample of the US citizen adult population.19 All surveys were
administered to 1,000 individuals, except for one survey which was administered to 1,500
individuals.20 YouGov is able to draw respondents from a pool of 2 million members in
the US, and it provides a wide array of high-quality background information concerning
each survey respondent (demographics, income, education, ideology, party affiliation,
interest in politics, etc.). Importantly, this information was collected by YouGov long
before respondents took our survey. Responses regarding political preferences or general
attitudes are therefore unaffected by our survey. Additionally, we asked a series of
questions regarding news consumption habits. Our survey took respondents on average
5-6 minutes to complete. Participants received about $1.9 on average (paid via gift
cards) in exchange for completing the survey.21
Table 1 provides basic descriptive statistics regarding the socioeconomic
17See https://today.yougov.com/find-solutions/omnibus/ for information on YouGov.18Notice our time period does not coincide with a presidential election. Recent research suggests that
it is the information acquired over long periods of time (as opposed to during the weeks immediatelypreceding an election) that determine the most voters’ beliefs [Le Pennec and Pons, 2019].
19To construct the sample, YouGov employs a two-step procedure. In the first step,a random sample is drawn from the population (using either Census information orthe American Community Survey). This sample is referred to as the target sample.In the second step, a matching technique is utilized to match each member of thetarget sample with members of YouGov’s pool of respondents. For further details, seehttps://smpa.gwu.edu/sites/g/files/zaxdzs2046/f/downloads/YG˙Matching˙and˙weighting˙basic˙description.pdf.
20We also instructed YouGov to avoid enrolling individuals who participated in prior editions of thesurvey (this restriction was lifted during our eighth survey).
21Our description of the survey is based on the last survey we administered. Some modificationswere gradually introduced as we conducted more surveys. We highlight these modifications whenrelevant.
12
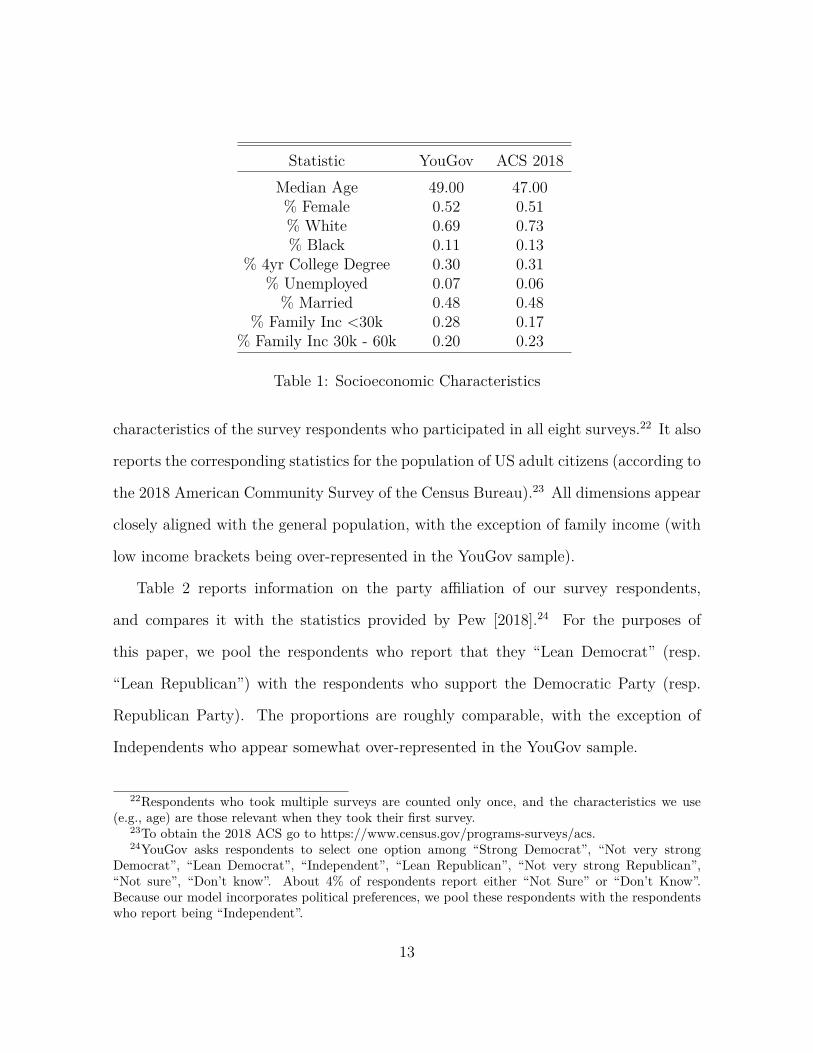
Statistic YouGov ACS 2018Median Age 49.00 47.00% Female 0.52 0.51% White 0.69 0.73% Black 0.11 0.13
% 4yr College Degree 0.30 0.31% Unemployed 0.07 0.06
% Married 0.48 0.48% Family Inc <30k 0.28 0.17
% Family Inc 30k - 60k 0.20 0.23
Table 1: Socioeconomic Characteristics
characteristics of the survey respondents who participated in all eight surveys.22 It also
reports the corresponding statistics for the population of US adult citizens (according to
the 2018 American Community Survey of the Census Bureau).23 All dimensions appear
closely aligned with the general population, with the exception of family income (with
low income brackets being over-represented in the YouGov sample).
Table 2 reports information on the party affiliation of our survey respondents,
and compares it with the statistics provided by Pew [2018].24 For the purposes of
this paper, we pool the respondents who report that they “Lean Democrat” (resp.
“Lean Republican”) with the respondents who support the Democratic Party (resp.
Republican Party). The proportions are roughly comparable, with the exception of
Independents who appear somewhat over-represented in the YouGov sample.
22Respondents who took multiple surveys are counted only once, and the characteristics we use(e.g., age) are those relevant when they took their first survey.
23To obtain the 2018 ACS go to https://www.census.gov/programs-surveys/acs.24YouGov asks respondents to select one option among “Strong Democrat”, “Not very strong
Democrat”, “Lean Democrat”, “Independent”, “Lean Republican”, “Not very strong Republican”,“Not sure”, “Don’t know”. About 4% of respondents report either “Not Sure” or “Don’t Know”.Because our model incorporates political preferences, we pool these respondents with the respondentswho report being “Independent”.
13
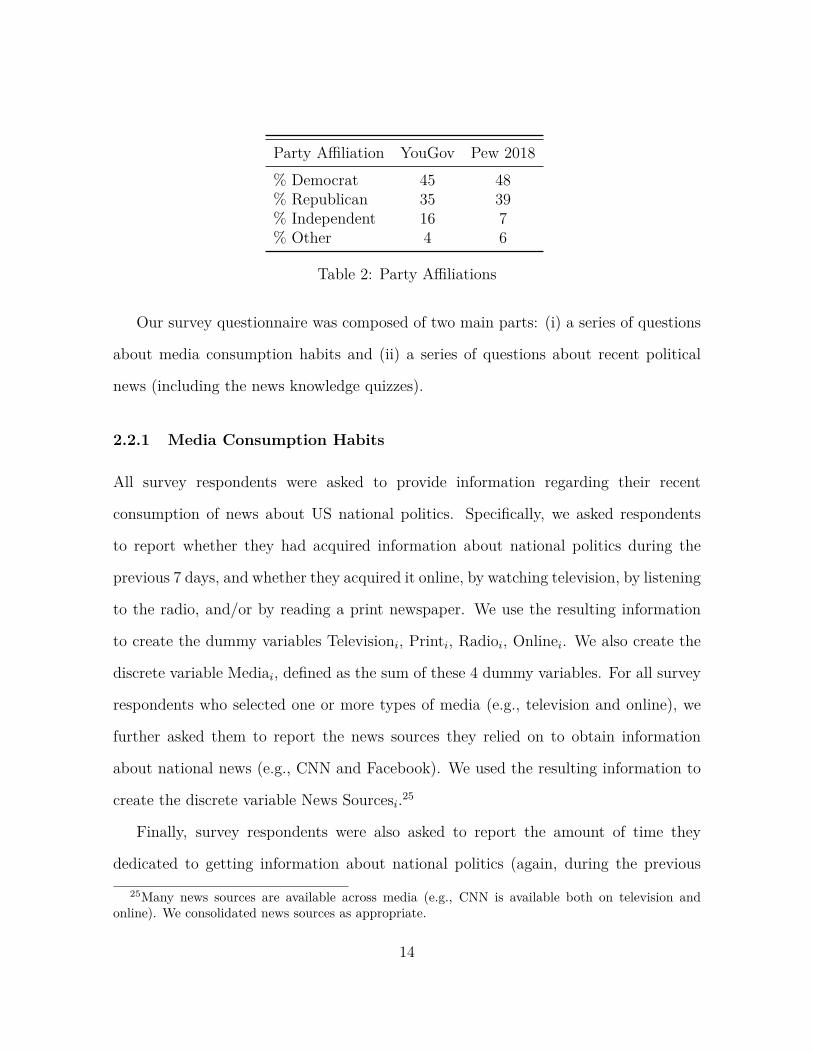
Party Affiliation YouGov Pew 2018% Democrat 45 48% Republican 35 39% Independent 16 7% Other 4 6
Table 2: Party Affiliations
Our survey questionnaire was composed of two main parts: (i) a series of questions
about media consumption habits and (ii) a series of questions about recent political
news (including the news knowledge quizzes).
2.2.1 Media Consumption Habits
All survey respondents were asked to provide information regarding their recent
consumption of news about US national politics. Specifically, we asked respondents
to report whether they had acquired information about national politics during the
previous 7 days, and whether they acquired it online, by watching television, by listening
to the radio, and/or by reading a print newspaper. We use the resulting information
to create the dummy variables Televisioni, Printi, Radioi, Onlinei. We also create the
discrete variable Mediai, defined as the sum of these 4 dummy variables. For all survey
respondents who selected one or more types of media (e.g., television and online), we
further asked them to report the news sources they relied on to obtain information
about national news (e.g., CNN and Facebook). We used the resulting information to
create the discrete variable News Sourcesi.25
Finally, survey respondents were also asked to report the amount of time they
dedicated to getting information about national politics (again, during the previous
25Many news sources are available across media (e.g., CNN is available both on television andonline). We consolidated news sources as appropriate.
14
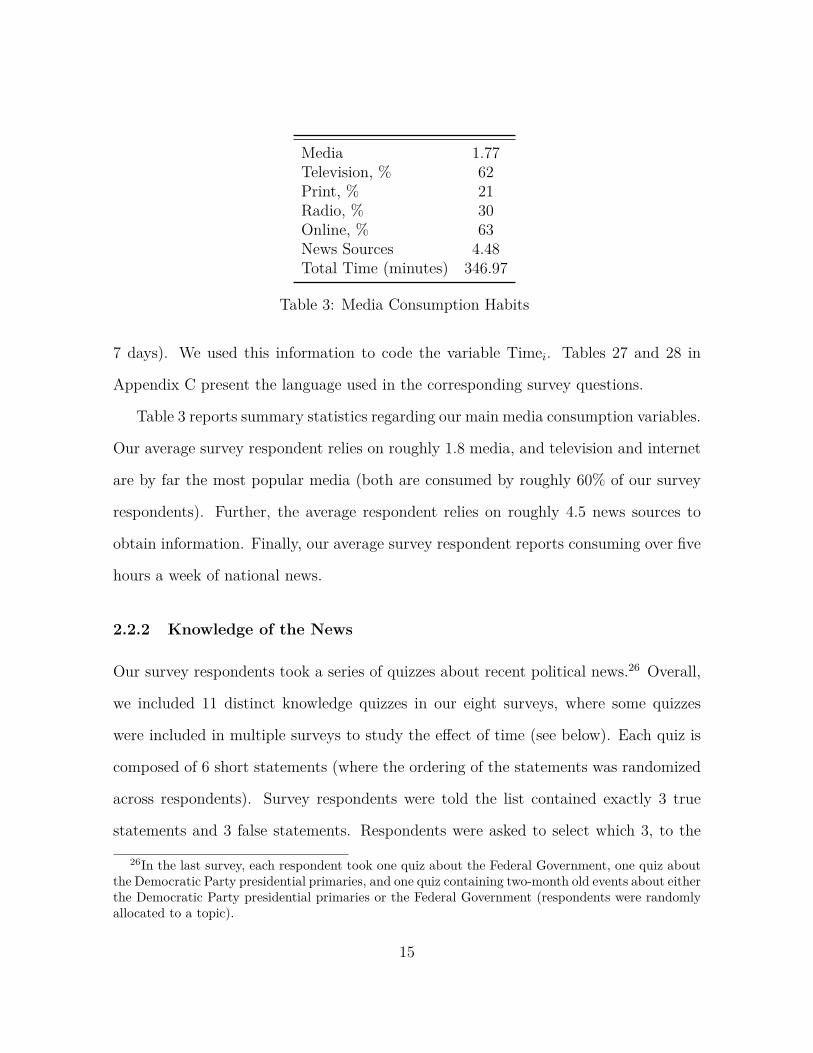
Media 1.77Television, % 62Print, % 21Radio, % 30Online, % 63News Sources 4.48Total Time (minutes) 346.97
Table 3: Media Consumption Habits
7 days). We used this information to code the variable Timei. Tables 27 and 28 in
Appendix C present the language used in the corresponding survey questions.
Table 3 reports summary statistics regarding our main media consumption variables.
Our average survey respondent relies on roughly 1.8 media, and television and internet
are by far the most popular media (both are consumed by roughly 60% of our survey
respondents). Further, the average respondent relies on roughly 4.5 news sources to
obtain information. Finally, our average survey respondent reports consuming over five
hours a week of national news.
2.2.2 Knowledge of the News
Our survey respondents took a series of quizzes about recent political news.26 Overall,
we included 11 distinct knowledge quizzes in our eight surveys, where some quizzes
were included in multiple surveys to study the effect of time (see below). Each quiz is
composed of 6 short statements (where the ordering of the statements was randomized
across respondents). Survey respondents were told the list contained exactly 3 true
statements and 3 false statements. Respondents were asked to select which 3, to the
26In the last survey, each respondent took one quiz about the Federal Government, one quiz aboutthe Democratic Party presidential primaries, and one quiz containing two-month old events about eitherthe Democratic Party presidential primaries or the Federal Government (respondents were randomlyallocated to a topic).
15
best of their ability, were the correct statements. To avoid individuals from obtaining
information somewhere else, respondents were given 60 seconds to make their selection
(a timer was added from the second survey onward to help respondents estimate the
amount of time they had left). Whereas no monetary incentives were given during the
first survey (in addition to the base compensation), from the second survey onward we
offered an extra $1 (paid via a giftcard) to all respondents who selected all three correct
statements. All survey respondents were revealed the correct answers once they took
the quiz. Tables 30-37 in Appendix C include all quizzes that we administered through
our series of surveys.
All surveys included one or two knowledge quizzes about current news stories (less
than four weeks old). In a number of surveys, we also included one-month and two-
month old knowledge quizzes, that is, knowledge quizzes that were included in previous
surveys. In particular, six knowledge quizzes were included in surveys that were
administered one month apart. Of these, one knowledge quiz was also included in
a survey administered two months after it was first included in a survey. For these
quizzes, we therefore observe the respondents’ selection of statements as time passes.
We use this source of variation to capture the effect of time passing on voters’ knowledge
of political news. Table 40 in Appendix C reports how the various quizzes were allocated
to the various surveys we administered.
Across all surveys and quizzes, our average survey respondent selected
approximately 2.17 true statements.27
In the last four surveys, we also asked our survey respondents to report their feelings
27Presumably because of the 60-second limit, some respondents ended up selecting strictly fewerthan 3 statements. A tiny share of respondents also selected strictly more than 3 statements. Overall,about 19% of respondents selected a number of statements different from 3. We exclude theserespondents from our analysis and discuss the potential biases this exclusion introduces when relevant.
16
towards the six statements contained in the quiz they completed. Specifically, for each
true statement, respondents were asked how favorably, in their opinion, the statement
reflected on the Republican Party. Similarly, for each false statement, respondents
were asked how favorably, in their opinion, the statement would have reflected on
the Republican Party had it been true. Respondents were allowed to select one
option among “very unfavorable”, “unfavorable”, “neither unfavorable nor favorable”,
“‘favorable”, and “very favorable”. We used the resulting information about the average
respondent’s feeling toward statement j to create the continuous variable bj ∈ [−∞,∞].
To construct it, we first map the answers such that “neither unfavorable nor favorable”
is represented by 0, “very unfavorable” is represented by -1 and “very favorable” is
represented by 1. Then, for each statement, we take the average of this measure
across respondents, and rescale the resulting variable to have a standard deviation
equal to 1. Across all surveys and quizzes, the average true statement has b = −0.11,
that is, the average survey respondent felt that the average true statement reflected
slightly unfavorably on the Republican Party. Similarly, across all surveys and quizzes,
the average false statement received a score of b = 0.16, that is, the average survey
respondent felt that the average false statement reflected slightly favorably on the
Republican Party. Tables 38 and 39 in Appendix C present the language used in
the corresponding survey questions.
2.2.3 Discussion
We could have designed our survey in a number of alternative ways. For example, we
could have made it such that each respondent’s task consisted of either (i) determining
whether each statement in a list of 6 statements was true or false or (ii) choosing
the 3 true statements included in a list of 3 pairs containing each 1 true and 1 false
17
statement. The first alternative is formally identical to our setting if respondents are
told that exactly half of the 6 statements are true and if they are allowed to read all 6
statements before making up their mind. Anchoring respondents’ prior is desirable for
the purposes of estimating our model (for which we must specify respondents’ prior).
Moreover, not allowing respondents to read all 6 statements before determining which
3 are more likely to be true (that is, forcing respondents to declare statements as true
or false sequentially) would prevent them from fully utilizing their knowledge, which we
are attempting to measure. In other words, under the first alternative to our setting,
we would make assumptions and choices that would render it formally identical to our
current setting. Moreover, the second alternative is dominated by our quiz format
because it would generate a distribution in the number of true statements selected
by individuals with given knowledge levels with greater variance, which would make
it harder for our model to measure knowledge precisely. Last, an even more obvious
alternative to our quiz design consists of asking respondents to report directly the
confidence they ascribe to each statement being true. Precisely eliciting such beliefs
is notoriously difficult and we prefer to indirectly infer them by asking respondents to
solve a task.
We conclude with a final remark about aided versus unaided recall. Our method
measures aided recall. Formally speaking, what we measure is respondents’ ability to
assess the plausibility of various knowledge items, which presumably is directly related
to their knowledge level. An alternative approach – one that would measure unaided
recall – would consist of (i) informing respondents of the existence of a list of 3 true
knowledge items about recent political events related to the US Federal Government
(selected by our panel of mainstream journalists) and (ii) asking respondents to guess
18
these knowledge items.28 Although in theory this alternative approach would get closer
to measuring respondents’ knowledge of the news, it would involve a number of indirect
steps (e.g., modeling respondents’ ability to second-guess the journalists’ opinions) that
would make the estimation of a knowledge model difficult in practice.
3 Model
We develop our model in three steps. We begin with formulating the basic general
problem an agent faces when she is trying to assign a probability of truth to a statement,
which is a standard application of Bayesian binary hypothesis testing. In the second
step we consider an agent who is asked to pick the statement that is most likely to
be true out of a set of statements and we show that, under standard assumptions, the
problem corresponds to a familiar parameterized discrete choice problem. Finally, we
apply this theoretical framework to the survey instrument we are using to arrive at the
econometric model that we will be using in the rest of the paper. In the last subsection,
we clarify the link between our model and the existing statistical literature.
3.1 The News Knowledge Problem
Agent i is trying to establish the truth of statement j, which we call τj ∈ {0, 1},
where 0 represents a false statement and 1 a true statement. The agent observes a signal
yij about the statement. For simplicity, assume the signal is continuously distributed
and has full support on the real line. The signal’s conditional distribution depends on
the truth τj, on the statement’s characteristics aj (e.g., straightforwardness, salience,
or familiarity) and the number of months t since the story became true, and on the
28We thank Miklos Sarvary for this comment.
19
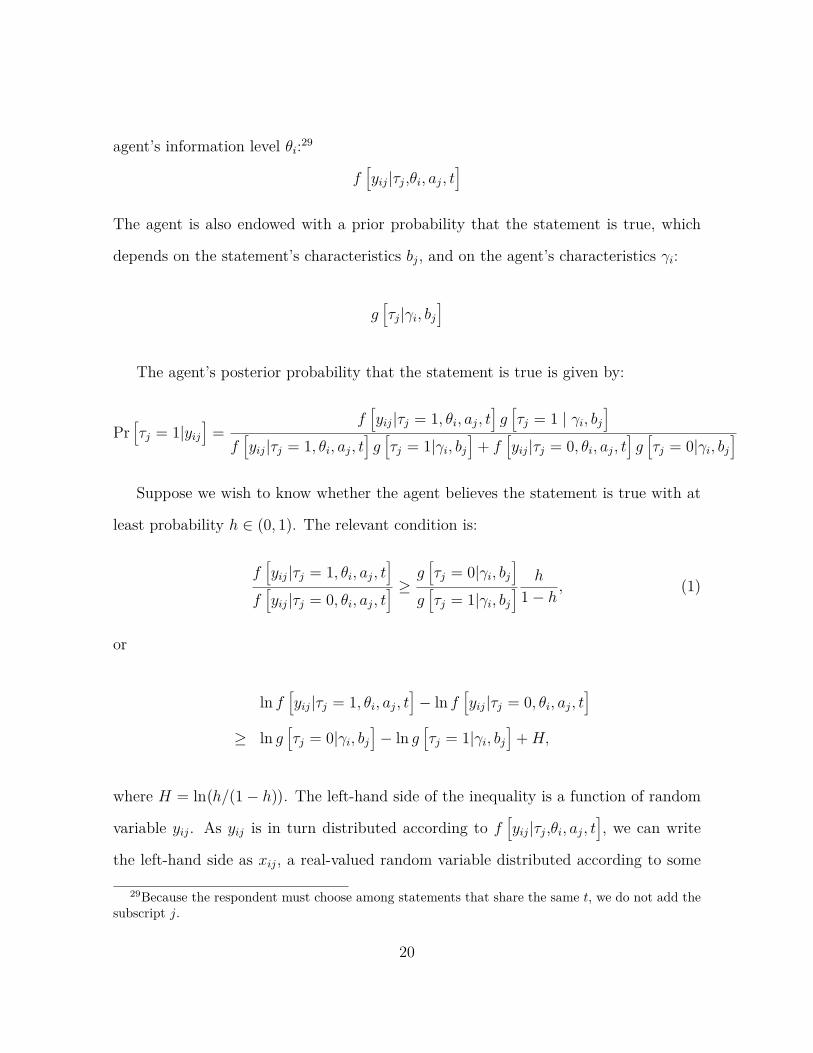
agent’s information level θi:29
f[yij|τj,θi, aj, t
]The agent is also endowed with a prior probability that the statement is true, which
depends on the statement’s characteristics bj, and on the agent’s characteristics γi:
g[τj|γi, bj
]
The agent’s posterior probability that the statement is true is given by:
Pr[τj = 1|yij
]=
f[yij|τj = 1, θi, aj, t
]g[τj = 1 | γi, bj
]f[yij|τj = 1, θi, aj, t
]g[τj = 1|γi, bj
]+ f
[yij|τj = 0, θi, aj, t
]g[τj = 0|γi, bj
]
Suppose we wish to know whether the agent believes the statement is true with at
least probability h ∈ (0, 1). The relevant condition is:
f[yij|τj = 1, θi, aj, t
]f[yij|τj = 0, θi, aj, t
] ≥ g[τj = 0|γi, bj
]g[τj = 1|γi, bj
] h
1− h, (1)
or
ln f[yij|τj = 1, θi, aj, t
]− ln f
[yij|τj = 0, θi, aj, t
]≥ ln g
[τj = 0|γi, bj
]− ln g
[τj = 1|γi, bj
]+H,
where H = ln(h/(1− h)
). The left-hand side of the inequality is a function of random
variable yij. As yij is in turn distributed according to f[yij|τj,θi, aj, t
], we can write
the left-hand side as xij, a real-valued random variable distributed according to some
29Because the respondent must choose among statements that share the same t, we do not add thesubscript j.
20
f[xij|τj, θi, aj, t
]. The first part of the right-hand side is a deterministic function of γi
and bj, which we write as g[γi, bj
].
Thus, the agent assigns at least probability h to the statement if
xij ≥ g[γi, bj
]+H. (2)
Let F be the cumulative distribution function of f . For any level h, the probability
that the agent assigns at least probability h to statement j is
1− F[g[γi, bj
]+H
].
This expression is a characterization of the agent’s belief in the truth of statement j in
terms of the threshold h and the underlying parameters γi and bj.
3.2 A Discrete Choice Model
We now make a number of functional assumptions that lead to a tractable and
familiar logit specification. Assume that the random variable on the left-hand side of
(2) can be written as:
xij =(2τj − 1
)ajθiδ
−t − εij
where εij follows an extreme value distribution of type I. We interpret θi ≥ 0 as agent
i’s signal precision and aj ≥ 0 as the straightforwardness (the contrary of difficulty) of
the news story. The parameter δ captures the effect of time passing, where t = 0, 1, · · ·
represents number of months since a news story came out/became true.
21
Also assume the prior term can be written as
g[γi, bj
]= −αbjγi.
We interpret bj ∈ (−1, 1) as the partisanship of the news story: a high (resp. low) bj
denotes a story that reflects favorably (resp. unfavorably) on the Republican Party.
We interpret γi ∈ {−1, 0, 1} as agent i’s ideology: a high γi denotes a a stronger
pro-Republican bias. This term captures the tendency of voters to believe statements
that agree with their ideology and the parameter α ≥ 0 measures the strength of this
congruency bias. The higher αbjγi, the more likely the voter will believe the story to
be true.
This is equivalent to agent i assigning to statement j a plausibility value
zij =(2τj − 1
)ajθiδ
−t + αbjγi − εij
The plausibility value is a random variable with support (−∞,∞), and mean(2τj − 1
)ajθiδ
−t + αbjγi.
Now suppose the agent is given a set J of statements and asked to pick the one
that is most likely to be true. Each statement j is characterized by its truth τj, its
straightforwardness aj, and its partisanship bj. The error term is i.i.d. The agent will
select the statement with the highest plausibility value zj. This is similar to a standard
logit discrete choice model and it leads to the following:
Proposition 1 The probability agent i believes statement j is the most likely to be true
22
among the set J of statements is
πij =exp
((2τj − 1
)ajθiδ
−t + αbjγi
)∑k∈J exp
((2τk − 1) akθiδ−t + αbkγi
) (3)
The comparative statics of the expressions above is intuitive.30 If j is a true (false)
statement, πij is increasing (decreasing) in i’s knowledge and j’s straightforwardness.
As the agent becomes infinitely knowledgeable (θi → ∞) or the statement becomes
infinitely easy (aj →∞), the probability tends to 1 if the statement is true and to zero
if it is false.
Recall that the location parameter of the standard Gumbel distribution does not
affect πij. To fix a value for the location parameter, we assume that E[εij]
is such that
the probability that the agent places at least a 0.5 probability on a totally uninformative
statement (aj = 0) on which she has no prior view (bj = 0) is 0.5 (i.e., Pr[εi,j ≤ 0
]=
0.5). This requires setting the location parameter of the Gumbel distribution at −λ,
where λ is Euler’s constant (approximately 0.57), and it implies that the CDF of εij is
Φ(εij)
= e−e−λ . Thus, the probability that the agent assigns at least probability h to
statement j being true is given by:
ρij (h) =exp
((2τj − 1
)ajθiδ
−t + αbjγi
)exp
((2τj − 1
)ajθiδ−t + αbjγi
)+ h
1−h
. (4)
30The expression above holds under the assumption that the random variable εij is independentacross the six statements. In practical terms, this means that the statements are not related in waysthat make their plausibility value correlated. An obvious violation occurs when two statements refer torelated stories “President Trump visited France” and “President Trump met with Emmanuel Macron.”We believe the independence condition is satisfied in practice within every round as both the truestories and the fake stories are designed to belong to distinct meta-stories (see Section 2).
23
3.3 Econometric Model
We assume that the respondent observes all six plausibility values and then chooses
the 3 statements with the 3 highest associated values. For the purposes of our estimation
exercise, we rely on the probability of selecting any three statements {j, j′, j′′} for all
possible orderings of the plausibility values associated to the statements j, j′, and j′′.
Given our logit specification, the probability of selecting statements {j, j′, j′′} in this
exact order is given by: πij∈J · πij′∈J\{j} · πij′′∈J\{j,j′}.
Our objective is to estimate, for each respondent i, a posterior distribution of
knowledge level θi ∈ (−∞,∞) and, for each statement j (whether true or false),
posterior distributions of aj ∈ (−∞,∞). In addition, we estimate the posterior
distributions of population parameters δ ∈ (0,∞) and α ∈ (−∞,∞).31,32
In what follows let g ∈ G denote a socioeconomic group, where groups are defined
as intersections of 4 demographic characteristics: Age (below/above median), Gender,
Family Income (below/above median), and race (white and minority).
We estimate the model by Bayesian methods, specifically Hamiltonian Monte Carlo
[Hoffman and Gelman, 2014] implemented in Stan [Carpenter et al., 2017]. To that
end, we specify common prior distributions θi ∼ N(µg, σ2) and aj ∼ N(0, 1), with
hyperpriors µg ∼ N(0, 10), ∀g, and σ ∼ exp(14).33 The remaining prior distributions
31Notice that, to be meaningful, the economic model requires condition θ ≥ 0. In our estimationexercise, we do not impose this constraint. As we report below, the posterior distribution of θ werecover has negligible mass below 0.
32A common problem with this family of models [e.g., Bock, 1972, and see discussion of the literaturebelow] is that θ and a are identified through their product, so there always exists one additional degreeof freedom. This problem is solved by “anchoring” one of the two variables to some arbitrary scale.Consistent with our Bayesian approach, in our analysis the anchoring is achieved by assuming that ais distributed according to a standard normal.
33Following Bock [1972] we impose the restriction that∑6
j=1 aj = 0 by fixing a6 = −∑6
j=1 aj .In the absence of this restriction, one could add any constant to all the a’s without affecting theprobability of selecting a given statement j.
24
are specified as α ∼ N(0, 10) and δ ∼ N(1, 1). Notice that we allow for varying group-
level means for the prior distribution of θ (i.e., θi|i∈g ∼ N(µg, σ
)).34
The key identifying assumption is that the processes that generate the a’s and the
θ’s are stochastically independent. While some months our panel of journalists selects
real and fake stories that are easier or harder and YouGov selects better or worse
respondents (though that is less likely, given our sample size), what is required is that
these two sources of variations are not systematically correlated.
We propose a three-step procedure to estimate the parameters of the model. In step
1, we arbitrarily fix θi = 1, ∀i ∈ I, and estimate the remaining parameters. In step 2,
we fix aj to equal its posterior mean from Step 1 and estimate µg, ∀g, and σ. Finally,
in Step 3, we fix µg, ∀g, and σ at their posterior means from Step 2 and reestimate
(θi)i∈I , aj, α, and δ.
We conclude with some final remarks. For each respondent, we separately observe
γi ∈ {−1, 0, 1}, where −1 means “Democrat”, 0 means “Independent”, and 1 means
“Republican”. Also, recall that in the last four surveys, we separately asked the
respondents to report their sentiment towards all true and false statements. We can
thus directly use this information to create the variable bj.35 Because we did not ask
these questions in the first four surveys, we first estimate our model by relying on
an alternative measure of congruence. Specifically, for each statement we compute the
difference between the share of Republicans and Democrats who selected that statement
34An alternative approach consists of assuming a common mean for the prior distribution of θ acrossall individuals and groups. Such an approach would be rather conservative when quantifying knowledgedifferences across groups. Given the limited data available at the individual level, the posteriordistributions of individual knowledge θi have a relatively large variance. As a direct consequence,the common prior assumption would pull individual estimates toward the mean. Nevertheless, resultsunder this alternative approach are very similar to those with group-level means, with the exceptionof our results on inequalities (with smaller differences across groups).
35In our data, bj goes approximately from −0.41 to 0.55.
25
and normalize that variable to have a standard deviation equal to 1. Although this
approach suffers from a possible reverse causality problem, we first use it in our main
analysis. Later on, we will restrict our attention to the last four surveys and rely
exclusively on the separately-observed measure of congruence.
3.4 Literature Discussion
The model we develop here is loosely related to Item Response Theory (IRT), a set
of statistical models that are used to analyze test results with the objective of inferring
the difficulty of the test questions and the traits of the test takers [Van der Linden
and Hambleton, 1997]. However, we face two important differences with standard
approaches in this literature.
In standard IRT applications such as the Rasch model [Rasch, 1960], the researcher
can rank alternatives a priori (usually because an answer can only be right or wrong).
Here, instead we cannot a priori rank different statement bundles that contain different
subsets of true statements. Suppose that A, B, and C are true statements and D, E,
and F are false statements: it is not ex ante clear whether choosing, say, (A, B, D) is
better than choosing (A, C, E). We are closest to an extension of IRT called Nominal
Response Model (NRM), developed by Bock [1972], which allows items to be ranked in
a partially unknown manner.
However, we cannot use any of the IRT models, including NRM, directly because of
one important difference. The objective of all IRT tests is to measure the underlying skill
of test takers. Instead, we are interested in measuring two factors: the underlying skill
of our respondent (the precision of their signal) and the effect of partisan congruence.
The latter effect is well-known to be important in political knowledge but it is not
26
salient in educational testing.
We therefore must augment Bock [1972] by developing a model where individuals
have two traits, skill and ideology, and news stories have two characteristics, difficulty
and partisanship. The combination of ideology and partisanship determines response
rates in a non-monotonic way: it increases or decreases the probability that a person
chooses a certain true or false statement depending on the congruence between the
person’s ideology and the statement’s partisanship.
4 Analysis
4.1 Knowledge of the News
Within our framework, the probability that individual i with signal precision θi
assigns a probability equal to or higher than h to statement j being true is equal to
ρij (h) (see (4)).
Our first results shed light on the average voter’s knowledge of political news. For
each statement j and individual i, and for any confidence level h, we can compute the
posterior distribution of ρi,j (h) as well as its average. In particular, let F (θ) represent
the posterior distribution of θ in the sample. One can then compute∫θ∈R ρ(h|θ)dF (θ),
whose empirical analog is given by 1IN
∑i
∑n ρ(h|θi,n) (where I is the number of
individuals and N is the number of draws from the posterior distribution of θi).36
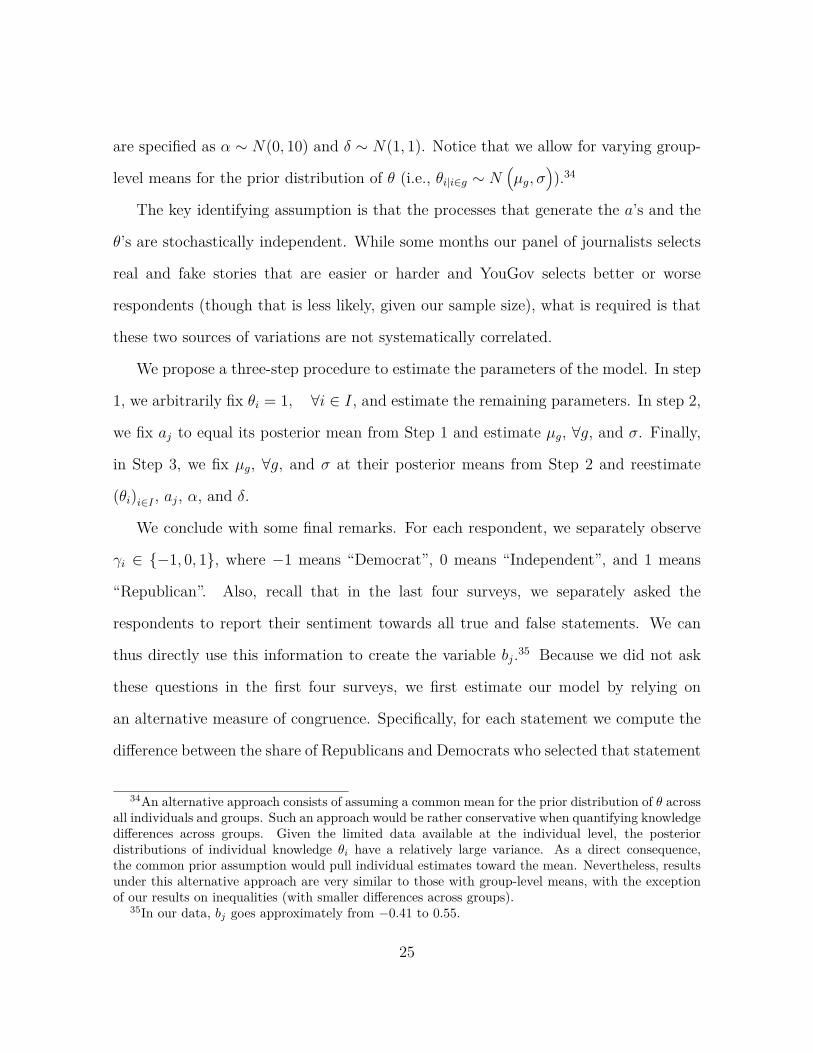
Figure 1 plots the average value of ρi,j (h) for all values of h ∈ [0, 1], by distinguishing
between the top 3 stories of the month about the Federal Government. Recall that the
ranking of news stories by importance is provided by our panel of journalists. Even
36We refer to the average voter for simplicity. Formally speaking, though, we compute the averageprobability that a voter selected at random according to F (θ) “knows” a given story.
27
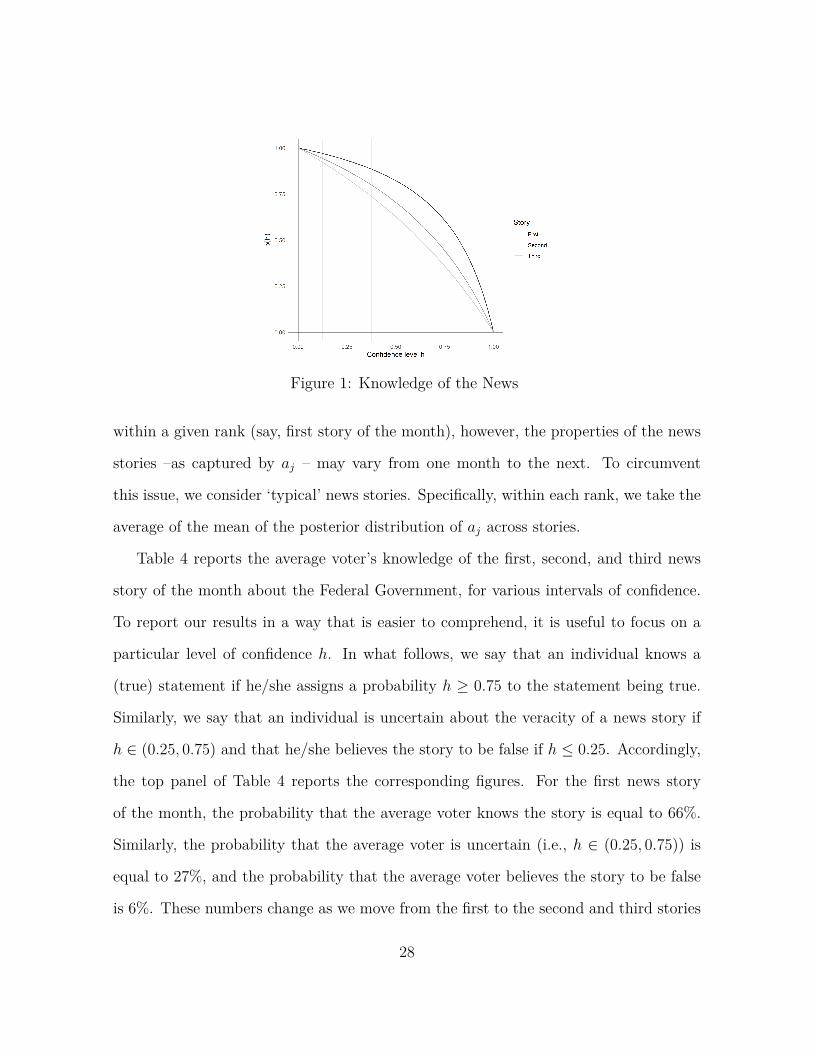
Figure 1: Knowledge of the News
within a given rank (say, first story of the month), however, the properties of the news
stories –as captured by aj – may vary from one month to the next. To circumvent
this issue, we consider ‘typical’ news stories. Specifically, within each rank, we take the
average of the mean of the posterior distribution of aj across stories.
Table 4 reports the average voter’s knowledge of the first, second, and third news
story of the month about the Federal Government, for various intervals of confidence.
To report our results in a way that is easier to comprehend, it is useful to focus on a
particular level of confidence h. In what follows, we say that an individual knows a
(true) statement if he/she assigns a probability h ≥ 0.75 to the statement being true.
Similarly, we say that an individual is uncertain about the veracity of a news story if
h ∈ (0.25, 0.75) and that he/she believes the story to be false if h ≤ 0.25. Accordingly,
the top panel of Table 4 reports the corresponding figures. For the first news story
of the month, the probability that the average voter knows the story is equal to 66%.
Similarly, the probability that the average voter is uncertain (i.e., h ∈ (0.25, 0.75)) is
equal to 27%, and the probability that the average voter believes the story to be false
is 6%. These numbers change as we move from the first to the second and third stories
28
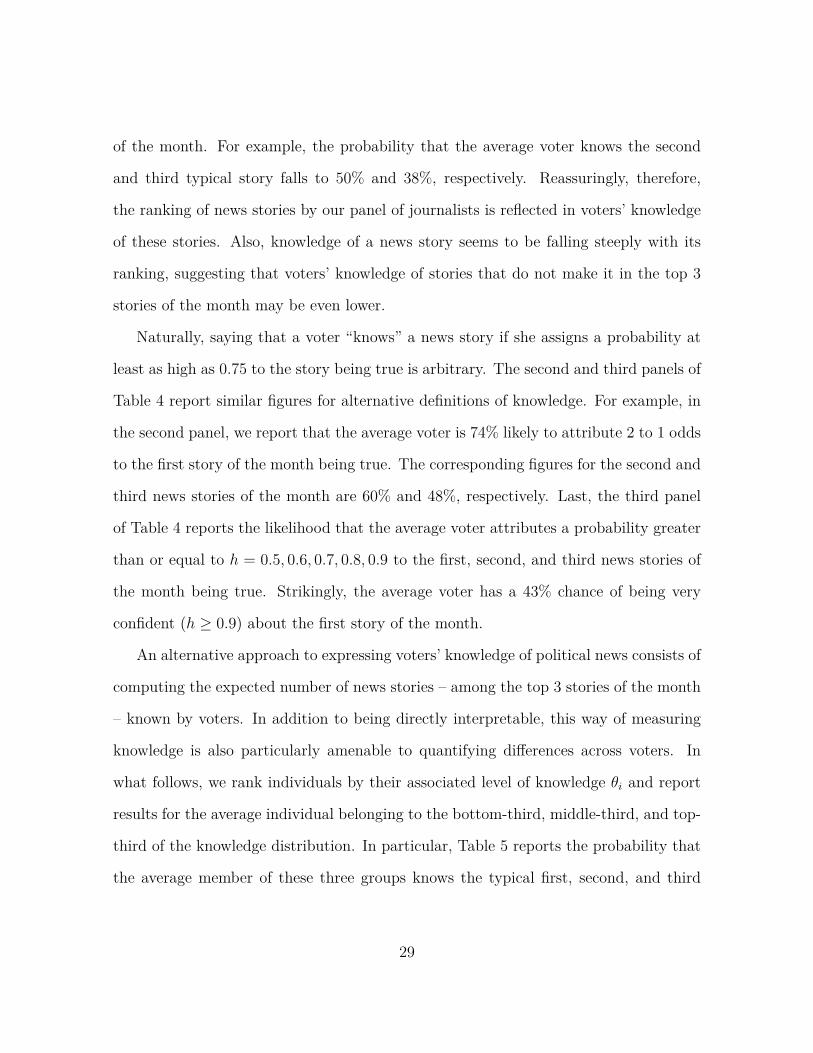
of the month. For example, the probability that the average voter knows the second
and third typical story falls to 50% and 38%, respectively. Reassuringly, therefore,
the ranking of news stories by our panel of journalists is reflected in voters’ knowledge
of these stories. Also, knowledge of a news story seems to be falling steeply with its
ranking, suggesting that voters’ knowledge of stories that do not make it in the top 3
stories of the month may be even lower.
Naturally, saying that a voter “knows” a news story if she assigns a probability at
least as high as 0.75 to the story being true is arbitrary. The second and third panels of
Table 4 report similar figures for alternative definitions of knowledge. For example, in
the second panel, we report that the average voter is 74% likely to attribute 2 to 1 odds
to the first story of the month being true. The corresponding figures for the second and
third news stories of the month are 60% and 48%, respectively. Last, the third panel
of Table 4 reports the likelihood that the average voter attributes a probability greater
than or equal to h = 0.5, 0.6, 0.7, 0.8, 0.9 to the first, second, and third news stories of
the month being true. Strikingly, the average voter has a 43% chance of being very
confident (h ≥ 0.9) about the first story of the month.
An alternative approach to expressing voters’ knowledge of political news consists of
computing the expected number of news stories – among the top 3 stories of the month
– known by voters. In addition to being directly interpretable, this way of measuring
knowledge is also particularly amenable to quantifying differences across voters. In
what follows, we rank individuals by their associated level of knowledge θi and report
results for the average individual belonging to the bottom-third, middle-third, and top-
third of the knowledge distribution. In particular, Table 5 reports the probability that
the average member of these three groups knows the typical first, second, and third
29
Confidence First story Second story Third story0 - 0.25 0.06 0.11 0.160.25 - 0.75 0.27 0.39 0.460.75 - 1 0.66 0.5 0.380 - 0.33 0.09 0.15 0.220.33 - 0.66 0.17 0.25 0.30.66 - 1 0.74 0.6 0.480.5 - 1 0.84 0.74 0.640.6 - 1 0.78 0.66 0.550.7 - 1 0.71 0.56 0.440.8 - 1 0.61 0.43 0.320.9 - 1 0.43 0.26 0.17
Table 4: Knowledge of the News
news story of the month.37 The reported numbers are suggestive of relatively large
heterogeneity in knowledge across voters. For example, whereas the average voter in
the top-third of the distribution has a 73.8% chance of knowing the first news story of
the month, the average voter in the bottom-third has only a 42.9% chance of knowing
the story. Using these numbers, one computes that – of the top three news stories of the
month – the average voter in the bottom-third of the distribution knows approximately
1.1 stories, the average voter in the middle-third knows approximately 1.4 stories, and
the average voter in the top-third knows close to 1.7 stories.
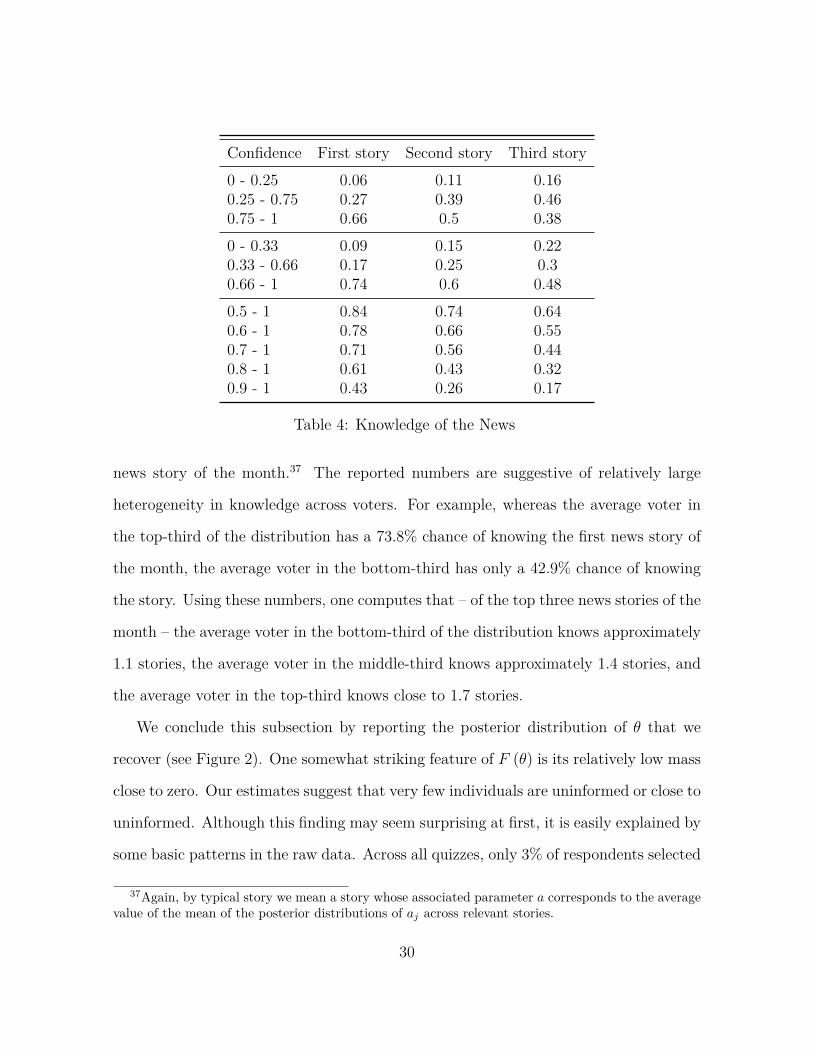
We conclude this subsection by reporting the posterior distribution of θ that we
recover (see Figure 2). One somewhat striking feature of F (θ) is its relatively low mass
close to zero. Our estimates suggest that very few individuals are uninformed or close to
uninformed. Although this finding may seem surprising at first, it is easily explained by
some basic patterns in the raw data. Across all quizzes, only 3% of respondents selected
37Again, by typical story we mean a story whose associated parameter a corresponds to the averagevalue of the mean of the posterior distributions of aj across relevant stories.
30
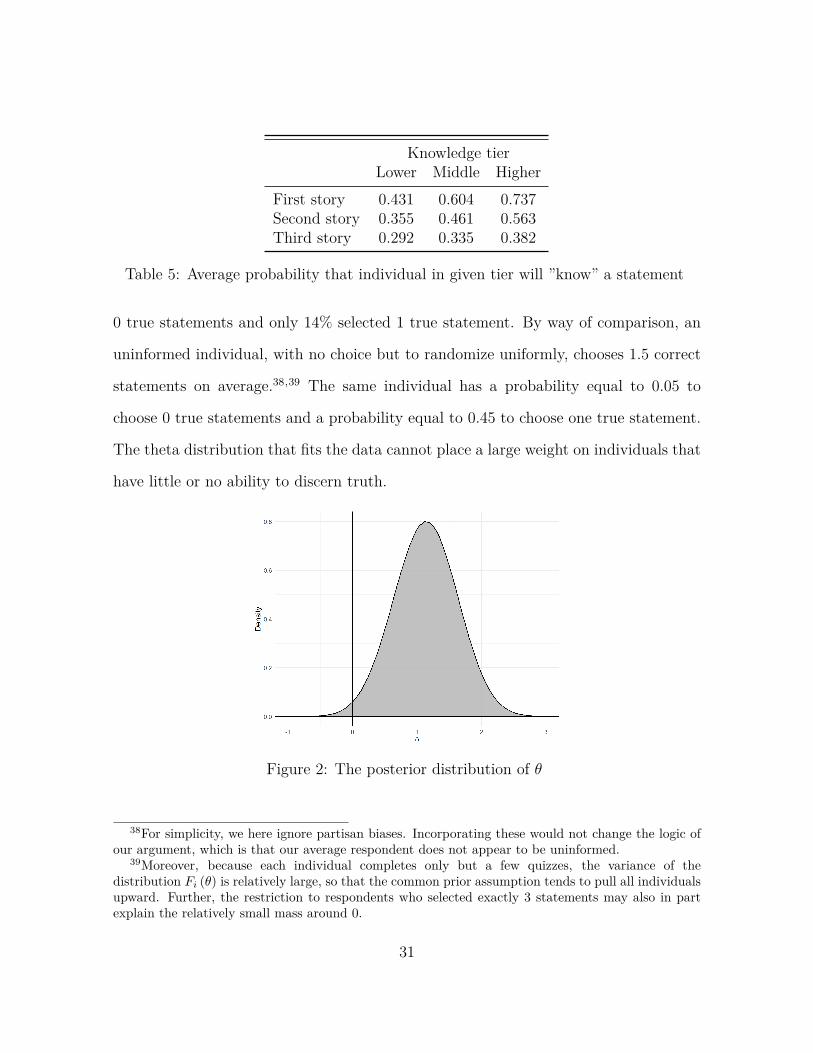
Knowledge tierLower Middle Higher
First story 0.431 0.604 0.737Second story 0.355 0.461 0.563Third story 0.292 0.335 0.382
Table 5: Average probability that individual in given tier will ”know” a statement
0 true statements and only 14% selected 1 true statement. By way of comparison, an
uninformed individual, with no choice but to randomize uniformly, chooses 1.5 correct
statements on average.38,39 The same individual has a probability equal to 0.05 to
choose 0 true statements and a probability equal to 0.45 to choose one true statement.
The theta distribution that fits the data cannot place a large weight on individuals that
have little or no ability to discern truth.
Figure 2: The posterior distribution of θ
38For simplicity, we here ignore partisan biases. Incorporating these would not change the logic ofour argument, which is that our average respondent does not appear to be uninformed.
39Moreover, because each individual completes only but a few quizzes, the variance of thedistribution Fi (θ) is relatively large, so that the common prior assumption tends to pull all individualsupward. Further, the restriction to respondents who selected exactly 3 statements may also in partexplain the relatively small mass around 0.
31
4.2 Heterogeneity across News Stories
Next we explore various dimensions of heterogeneity across news stories. Table
6 lists all true statements that were included in the various quizzes and surveys.
Similarly, Table 7 lists all false statements that were included in the various quizzes and
surveys. For each statement, the tables report the date, the share of survey respondents
who selected the statement when completing the quiz (“raw mean”), the mean of the
posterior distribution of aj, the predicted share of respondents who – according to our
model’s estimates – will select the statement when completing the quiz, as well as the
probability that the average voter assigns probability h to statement j being true (where
we distinguish between three intervals of confidence h).
As suggested by the tables, there exists significant heterogeneity across news stories
(within both the true and false statements). Some statements were selected by
virtually all our survey respondents and others were selected only by a tiny share
of respondents. Recall that the parameter aj captures how responsive the likelihood
of selecting statement j is to knowledge θ. What the tables suggest is that some true
statements are much more easily detectable as true by knowledgeable respondents than
others.40 Similarly, some false statements are much more easily detectable as false by
knowledgeable respondents than others.
Next, the tables report, for each statement, the predicted probability that the
average voter selects it when completing the quiz (taking into account the characteristics
of the remaining 5 statements that were included in the same quiz). As suggested by
the numbers, our model approximates the actual data well, irrespective of whether a
statement is chosen by few or many respondents.
40For two statements, being more knowledgeable was seemingly a disadvantage.
32
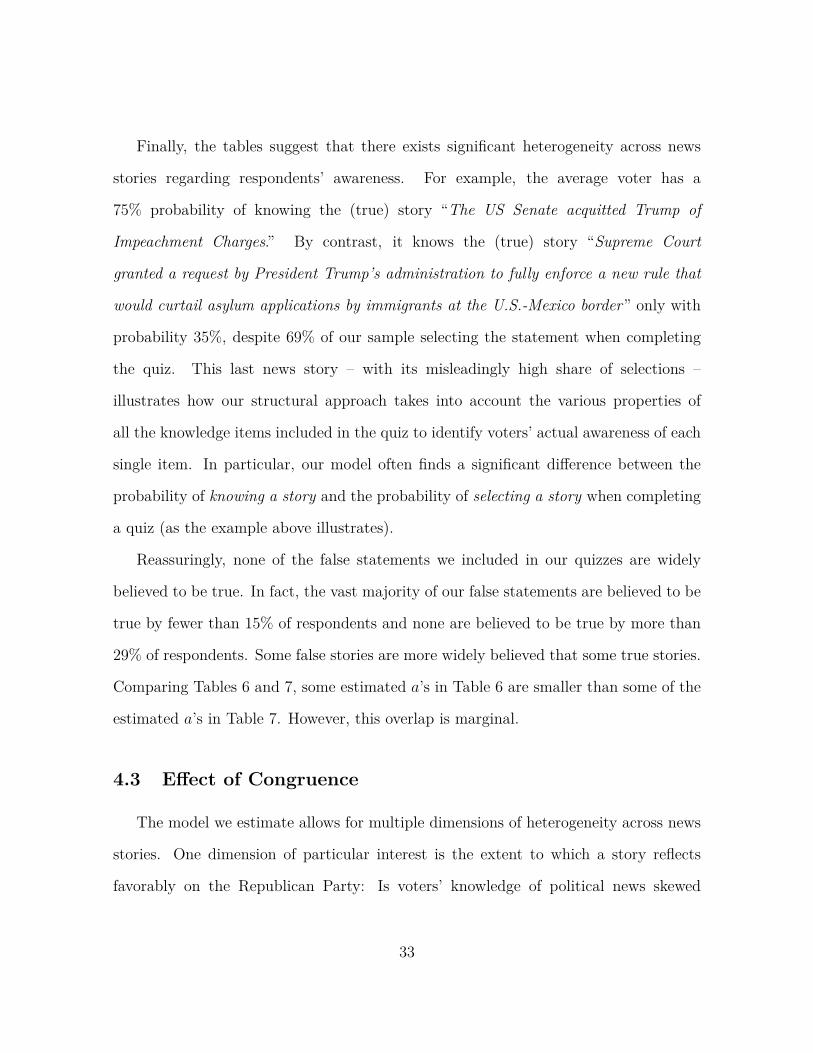
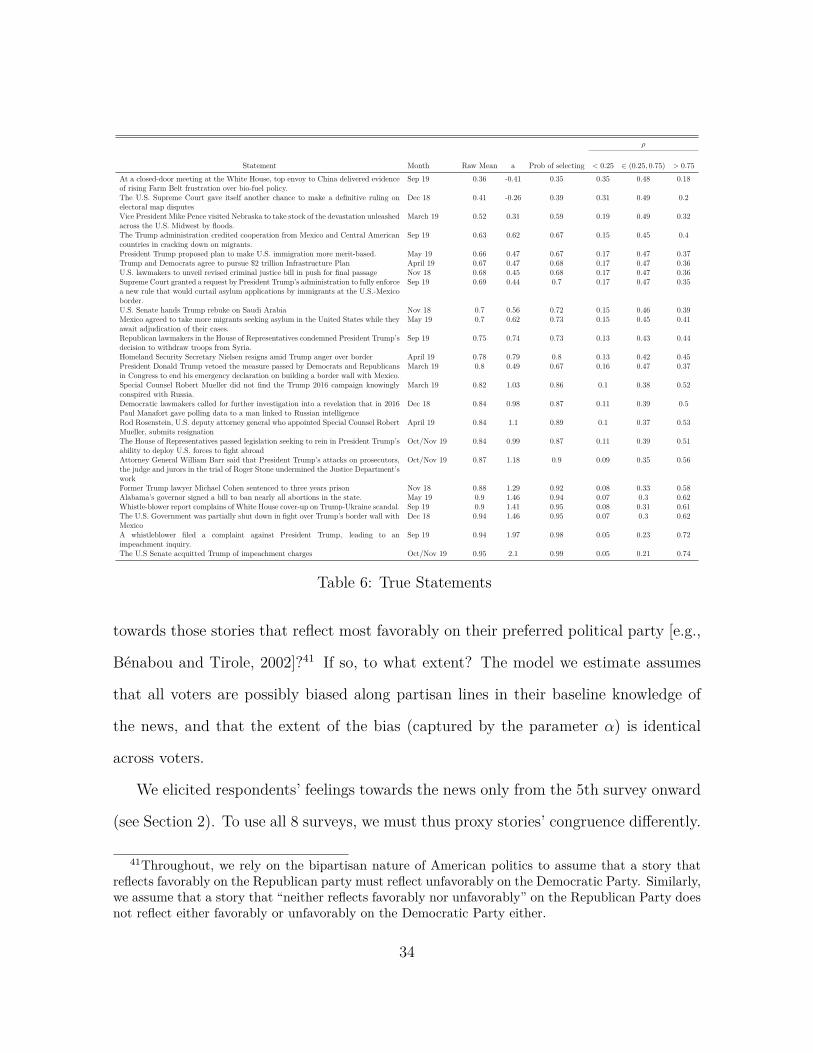
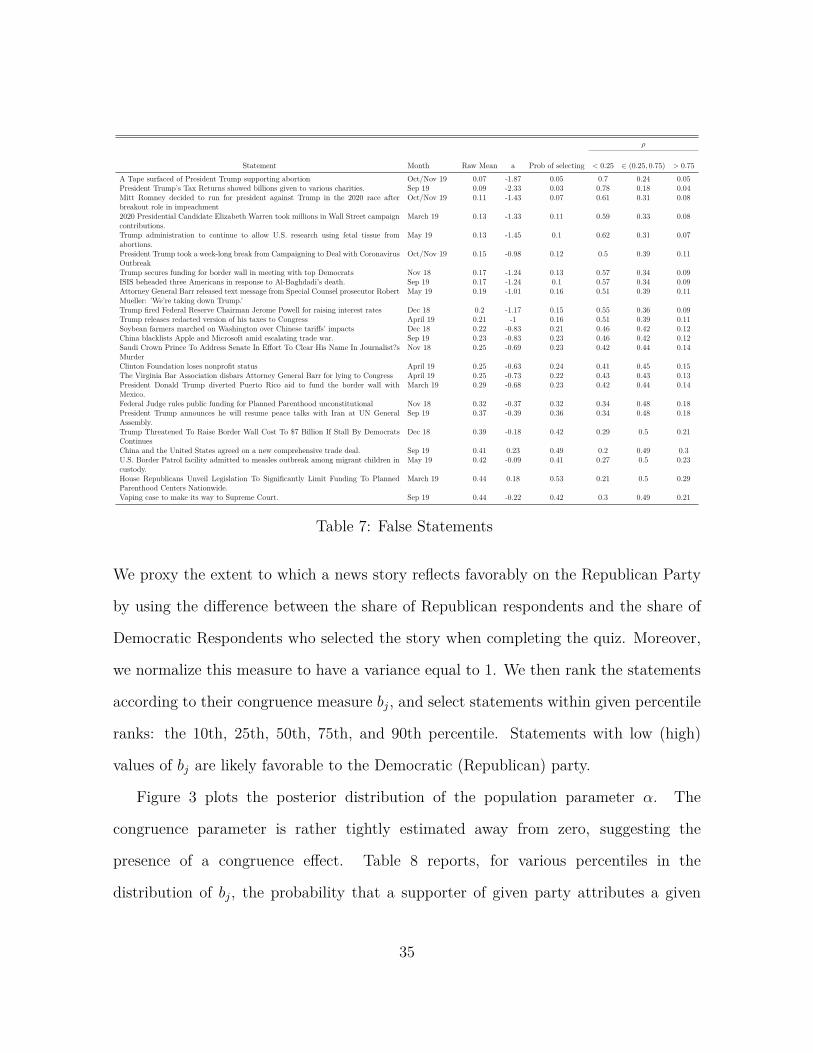
Finally, the tables suggest that there exists significant heterogeneity across news
stories regarding respondents’ awareness. For example, the average voter has a
75% probability of knowing the (true) story “The US Senate acquitted Trump of
Impeachment Charges.” By contrast, it knows the (true) story “Supreme Court
granted a request by President Trump’s administration to fully enforce a new rule that
would curtail asylum applications by immigrants at the U.S.-Mexico border” only with
probability 35%, despite 69% of our sample selecting the statement when completing
the quiz. This last news story – with its misleadingly high share of selections –
illustrates how our structural approach takes into account the various properties of
all the knowledge items included in the quiz to identify voters’ actual awareness of each
single item. In particular, our model often finds a significant difference between the
probability of knowing a story and the probability of selecting a story when completing
a quiz (as the example above illustrates).
Reassuringly, none of the false statements we included in our quizzes are widely
believed to be true. In fact, the vast majority of our false statements are believed to be
true by fewer than 15% of respondents and none are believed to be true by more than
29% of respondents. Some false stories are more widely believed that some true stories.
Comparing Tables 6 and 7, some estimated a’s in Table 6 are smaller than some of the
estimated a’s in Table 7. However, this overlap is marginal.
4.3 Effect of Congruence
The model we estimate allows for multiple dimensions of heterogeneity across news
stories. One dimension of particular interest is the extent to which a story reflects
favorably on the Republican Party: Is voters’ knowledge of political news skewed
33
ρ
Statement Month Raw Mean a Prob of selecting < 0.25 ∈ (0.25, 0.75) > 0.75At a closed-door meeting at the White House, top envoy to China delivered evidenceof rising Farm Belt frustration over bio-fuel policy.
Sep 19 0.36 -0.41 0.35 0.35 0.48 0.18
The U.S. Supreme Court gave itself another chance to make a definitive ruling onelectoral map disputes
Dec 18 0.41 -0.26 0.39 0.31 0.49 0.2
Vice President Mike Pence visited Nebraska to take stock of the devastation unleashedacross the U.S. Midwest by floods.
March 19 0.52 0.31 0.59 0.19 0.49 0.32
The Trump administration credited cooperation from Mexico and Central Americancountries in cracking down on migrants.
Sep 19 0.63 0.62 0.67 0.15 0.45 0.4
President Trump proposed plan to make U.S. immigration more merit-based. May 19 0.66 0.47 0.67 0.17 0.47 0.37Trump and Democrats agree to pursue $2 trillion Infrastructure Plan April 19 0.67 0.47 0.68 0.17 0.47 0.36U.S. lawmakers to unveil revised criminal justice bill in push for final passage Nov 18 0.68 0.45 0.68 0.17 0.47 0.36Supreme Court granted a request by President Trump’s administration to fully enforcea new rule that would curtail asylum applications by immigrants at the U.S.-Mexicoborder.
Sep 19 0.69 0.44 0.7 0.17 0.47 0.35
U.S. Senate hands Trump rebuke on Saudi Arabia Nov 18 0.7 0.56 0.72 0.15 0.46 0.39Mexico agreed to take more migrants seeking asylum in the United States while theyawait adjudication of their cases.
May 19 0.7 0.62 0.73 0.15 0.45 0.41
Republican lawmakers in the House of Representatives condemned President Trump’sdecision to withdraw troops from Syria.
Sep 19 0.75 0.74 0.73 0.13 0.43 0.44
Homeland Security Secretary Nielsen resigns amid Trump anger over border April 19 0.78 0.79 0.8 0.13 0.42 0.45President Donald Trump vetoed the measure passed by Democrats and Republicansin Congress to end his emergency declaration on building a border wall with Mexico.
March 19 0.8 0.49 0.67 0.16 0.47 0.37
Special Counsel Robert Mueller did not find the Trump 2016 campaign knowinglyconspired with Russia.
March 19 0.82 1.03 0.86 0.1 0.38 0.52
Democratic lawmakers called for further investigation into a revelation that in 2016Paul Manafort gave polling data to a man linked to Russian intelligence
Dec 18 0.84 0.98 0.87 0.11 0.39 0.5
Rod Rosenstein, U.S. deputy attorney general who appointed Special Counsel RobertMueller, submits resignation
April 19 0.84 1.1 0.89 0.1 0.37 0.53
The House of Representatives passed legislation seeking to rein in President Trump’sability to deploy U.S. forces to fight abroad
Oct/Nov 19 0.84 0.99 0.87 0.11 0.39 0.51
Attorney General William Barr said that President Trump’s attacks on prosecutors,the judge and jurors in the trial of Roger Stone undermined the Justice Department’swork
Oct/Nov 19 0.87 1.18 0.9 0.09 0.35 0.56
Former Trump lawyer Michael Cohen sentenced to three years prison Nov 18 0.88 1.29 0.92 0.08 0.33 0.58Alabama’s governor signed a bill to ban nearly all abortions in the state. May 19 0.9 1.46 0.94 0.07 0.3 0.62Whistle-blower report complains of White House cover-up on Trump-Ukraine scandal. Sep 19 0.9 1.41 0.95 0.08 0.31 0.61The U.S. Government was partially shut down in fight over Trump’s border wall withMexico
Dec 18 0.94 1.46 0.95 0.07 0.3 0.62
A whistleblower filed a complaint against President Trump, leading to animpeachment inquiry.
Sep 19 0.94 1.97 0.98 0.05 0.23 0.72
The U.S Senate acquitted Trump of impeachment charges Oct/Nov 19 0.95 2.1 0.99 0.05 0.21 0.74
Table 6: True Statements
towards those stories that reflect most favorably on their preferred political party [e.g.,
Benabou and Tirole, 2002]?41 If so, to what extent? The model we estimate assumes
that all voters are possibly biased along partisan lines in their baseline knowledge of
the news, and that the extent of the bias (captured by the parameter α) is identical
across voters.
We elicited respondents’ feelings towards the news only from the 5th survey onward
(see Section 2). To use all 8 surveys, we must thus proxy stories’ congruence differently.
41Throughout, we rely on the bipartisan nature of American politics to assume that a story thatreflects favorably on the Republican party must reflect unfavorably on the Democratic Party. Similarly,we assume that a story that “neither reflects favorably nor unfavorably” on the Republican Party doesnot reflect either favorably or unfavorably on the Democratic Party either.
34
ρ
Statement Month Raw Mean a Prob of selecting < 0.25 ∈ (0.25, 0.75) > 0.75A Tape surfaced of President Trump supporting abortion Oct/Nov 19 0.07 -1.87 0.05 0.7 0.24 0.05President Trump’s Tax Returns showed billions given to various charities. Sep 19 0.09 -2.33 0.03 0.78 0.18 0.04Mitt Romney decided to run for president against Trump in the 2020 race afterbreakout role in impeachment
Oct/Nov 19 0.11 -1.43 0.07 0.61 0.31 0.08
2020 Presidential Candidate Elizabeth Warren took millions in Wall Street campaigncontributions.
March 19 0.13 -1.33 0.11 0.59 0.33 0.08
Trump administration to continue to allow U.S. research using fetal tissue fromabortions.
May 19 0.13 -1.45 0.1 0.62 0.31 0.07
President Trump took a week-long break from Campaigning to Deal with CoronavirusOutbreak
Oct/Nov 19 0.15 -0.98 0.12 0.5 0.39 0.11
Trump secures funding for border wall in meeting with top Democrats Nov 18 0.17 -1.24 0.13 0.57 0.34 0.09ISIS beheaded three Americans in response to Al-Baghdadi’s death. Sep 19 0.17 -1.24 0.1 0.57 0.34 0.09Attorney General Barr released text message from Special Counsel prosecutor RobertMueller: ’We’re taking down Trump.’
May 19 0.19 -1.01 0.16 0.51 0.39 0.11
Trump fired Federal Reserve Chairman Jerome Powell for raising interest rates Dec 18 0.2 -1.17 0.15 0.55 0.36 0.09Trump releases redacted version of his taxes to Congress April 19 0.21 -1 0.16 0.51 0.39 0.11Soybean farmers marched on Washington over Chinese tariffs’ impacts Dec 18 0.22 -0.83 0.21 0.46 0.42 0.12China blacklists Apple and Microsoft amid escalating trade war. Sep 19 0.23 -0.83 0.23 0.46 0.42 0.12Saudi Crown Prince To Address Senate In Effort To Clear His Name In Journalist?sMurder
Nov 18 0.25 -0.69 0.23 0.42 0.44 0.14
Clinton Foundation loses nonprofit status April 19 0.25 -0.63 0.24 0.41 0.45 0.15The Virginia Bar Association disbars Attorney General Barr for lying to Congress April 19 0.25 -0.73 0.22 0.43 0.43 0.13President Donald Trump diverted Puerto Rico aid to fund the border wall withMexico.
March 19 0.29 -0.68 0.23 0.42 0.44 0.14
Federal Judge rules public funding for Planned Parenthood unconstitutional Nov 18 0.32 -0.37 0.32 0.34 0.48 0.18President Trump announces he will resume peace talks with Iran at UN GeneralAssembly.
Sep 19 0.37 -0.39 0.36 0.34 0.48 0.18
Trump Threatened To Raise Border Wall Cost To $7 Billion If Stall By DemocratsContinues
Dec 18 0.39 -0.18 0.42 0.29 0.5 0.21
China and the United States agreed on a new comprehensive trade deal. Sep 19 0.41 0.23 0.49 0.2 0.49 0.3U.S. Border Patrol facility admitted to measles outbreak among migrant children incustody.
May 19 0.42 -0.09 0.41 0.27 0.5 0.23
House Republicans Unveil Legislation To Significantly Limit Funding To PlannedParenthood Centers Nationwide.
March 19 0.44 0.18 0.53 0.21 0.5 0.29
Vaping case to make its way to Supreme Court. Sep 19 0.44 -0.22 0.42 0.3 0.49 0.21
Table 7: False Statements
We proxy the extent to which a news story reflects favorably on the Republican Party
by using the difference between the share of Republican respondents and the share of
Democratic Respondents who selected the story when completing the quiz. Moreover,
we normalize this measure to have a variance equal to 1. We then rank the statements
according to their congruence measure bj, and select statements within given percentile
ranks: the 10th, 25th, 50th, 75th, and 90th percentile. Statements with low (high)
values of bj are likely favorable to the Democratic (Republican) party.
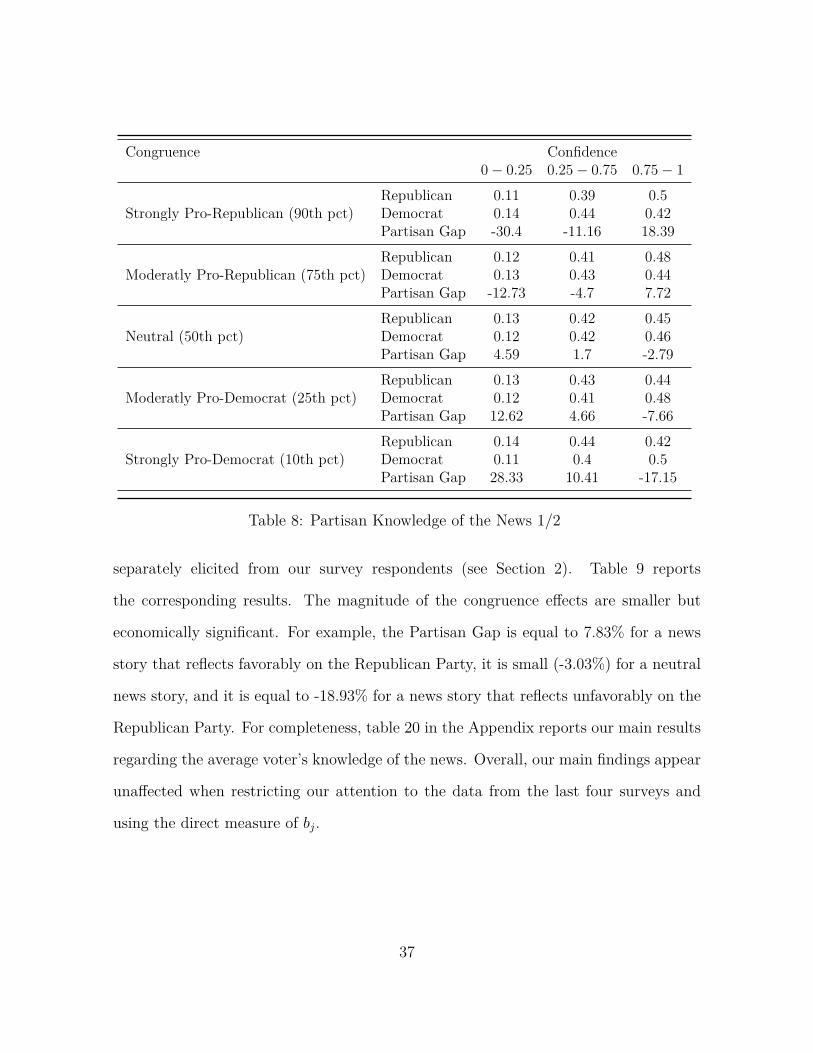
Figure 3 plots the posterior distribution of the population parameter α. The
congruence parameter is rather tightly estimated away from zero, suggesting the
presence of a congruence effect. Table 8 reports, for various percentiles in the
distribution of bj, the probability that a supporter of given party attributes a given
35
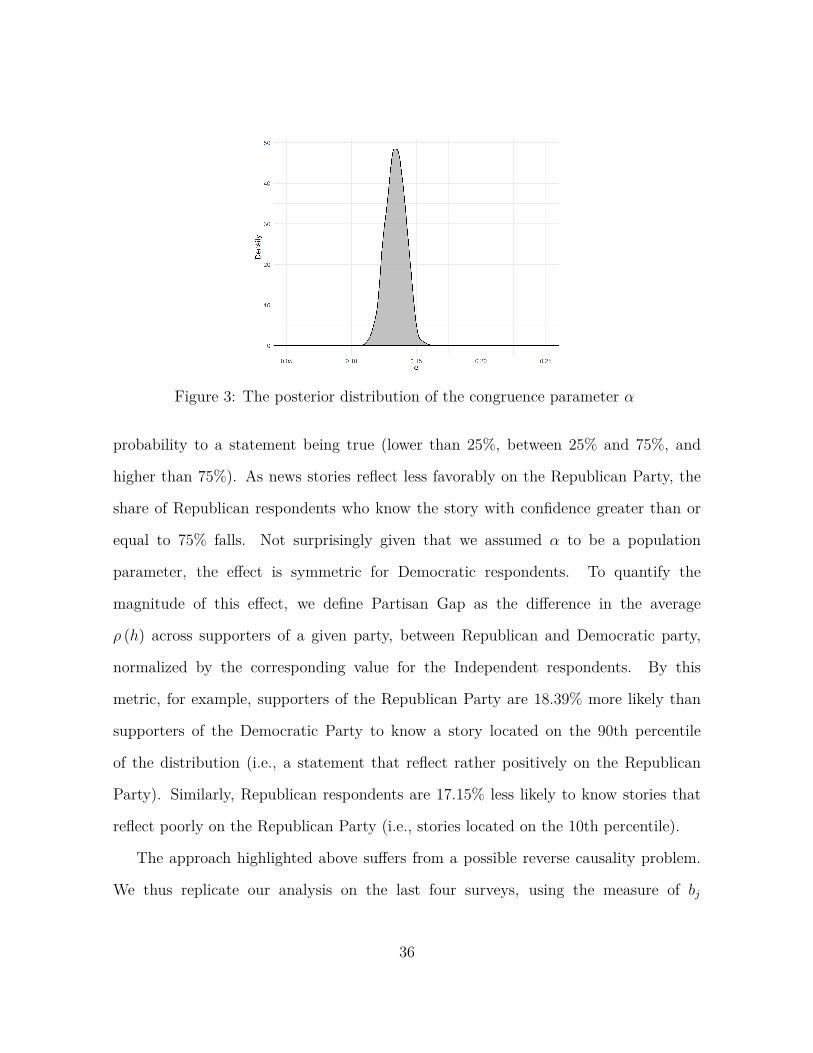
Figure 3: The posterior distribution of the congruence parameter α
probability to a statement being true (lower than 25%, between 25% and 75%, and
higher than 75%). As news stories reflect less favorably on the Republican Party, the
share of Republican respondents who know the story with confidence greater than or
equal to 75% falls. Not surprisingly given that we assumed α to be a population
parameter, the effect is symmetric for Democratic respondents. To quantify the
magnitude of this effect, we define Partisan Gap as the difference in the average
ρ (h) across supporters of a given party, between Republican and Democratic party,
normalized by the corresponding value for the Independent respondents. By this
metric, for example, supporters of the Republican Party are 18.39% more likely than
supporters of the Democratic Party to know a story located on the 90th percentile
of the distribution (i.e., a statement that reflect rather positively on the Republican
Party). Similarly, Republican respondents are 17.15% less likely to know stories that
reflect poorly on the Republican Party (i.e., stories located on the 10th percentile).
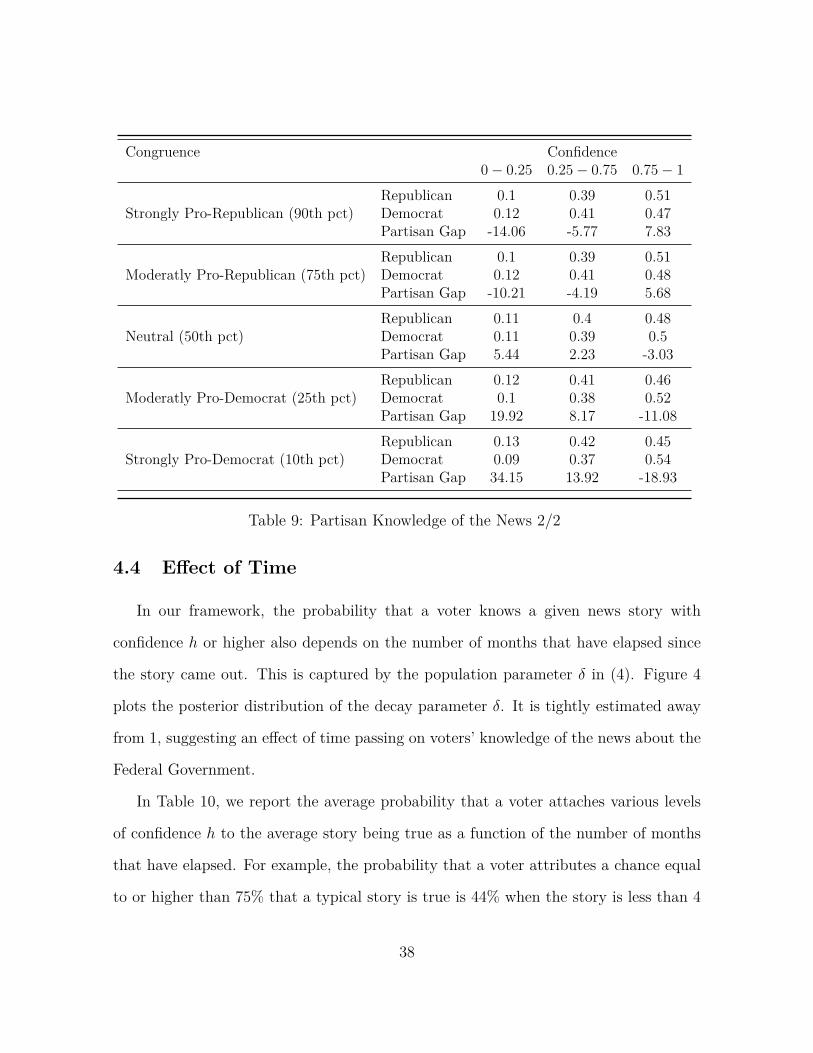
The approach highlighted above suffers from a possible reverse causality problem.
We thus replicate our analysis on the last four surveys, using the measure of bj
36
Congruence Confidence0− 0.25 0.25− 0.75 0.75− 1
Strongly Pro-Republican (90th pct)Republican 0.11 0.39 0.5Democrat 0.14 0.44 0.42Partisan Gap -30.4 -11.16 18.39
Moderatly Pro-Republican (75th pct)Republican 0.12 0.41 0.48Democrat 0.13 0.43 0.44Partisan Gap -12.73 -4.7 7.72
Neutral (50th pct)Republican 0.13 0.42 0.45Democrat 0.12 0.42 0.46Partisan Gap 4.59 1.7 -2.79
Moderatly Pro-Democrat (25th pct)Republican 0.13 0.43 0.44Democrat 0.12 0.41 0.48Partisan Gap 12.62 4.66 -7.66
Strongly Pro-Democrat (10th pct)Republican 0.14 0.44 0.42Democrat 0.11 0.4 0.5Partisan Gap 28.33 10.41 -17.15
Table 8: Partisan Knowledge of the News 1/2
separately elicited from our survey respondents (see Section 2). Table 9 reports
the corresponding results. The magnitude of the congruence effects are smaller but
economically significant. For example, the Partisan Gap is equal to 7.83% for a news
story that reflects favorably on the Republican Party, it is small (-3.03%) for a neutral
news story, and it is equal to -18.93% for a news story that reflects unfavorably on the
Republican Party. For completeness, table 20 in the Appendix reports our main results
regarding the average voter’s knowledge of the news. Overall, our main findings appear
unaffected when restricting our attention to the data from the last four surveys and
using the direct measure of bj.
37
Congruence Confidence0− 0.25 0.25− 0.75 0.75− 1
Strongly Pro-Republican (90th pct)Republican 0.1 0.39 0.51Democrat 0.12 0.41 0.47Partisan Gap -14.06 -5.77 7.83
Moderatly Pro-Republican (75th pct)Republican 0.1 0.39 0.51Democrat 0.12 0.41 0.48Partisan Gap -10.21 -4.19 5.68
Neutral (50th pct)Republican 0.11 0.4 0.48Democrat 0.11 0.39 0.5Partisan Gap 5.44 2.23 -3.03
Moderatly Pro-Democrat (25th pct)Republican 0.12 0.41 0.46Democrat 0.1 0.38 0.52Partisan Gap 19.92 8.17 -11.08
Strongly Pro-Democrat (10th pct)Republican 0.13 0.42 0.45Democrat 0.09 0.37 0.54Partisan Gap 34.15 13.92 -18.93
Table 9: Partisan Knowledge of the News 2/2
4.4 Effect of Time
In our framework, the probability that a voter knows a given news story with
confidence h or higher also depends on the number of months that have elapsed since
the story came out. This is captured by the population parameter δ in (4). Figure 4
plots the posterior distribution of the decay parameter δ. It is tightly estimated away
from 1, suggesting an effect of time passing on voters’ knowledge of the news about the
Federal Government.
In Table 10, we report the average probability that a voter attaches various levels
of confidence h to the average story being true as a function of the number of months
that have elapsed. For example, the probability that a voter attributes a chance equal
to or higher than 75% that a typical story is true is 44% when the story is less than 4
38
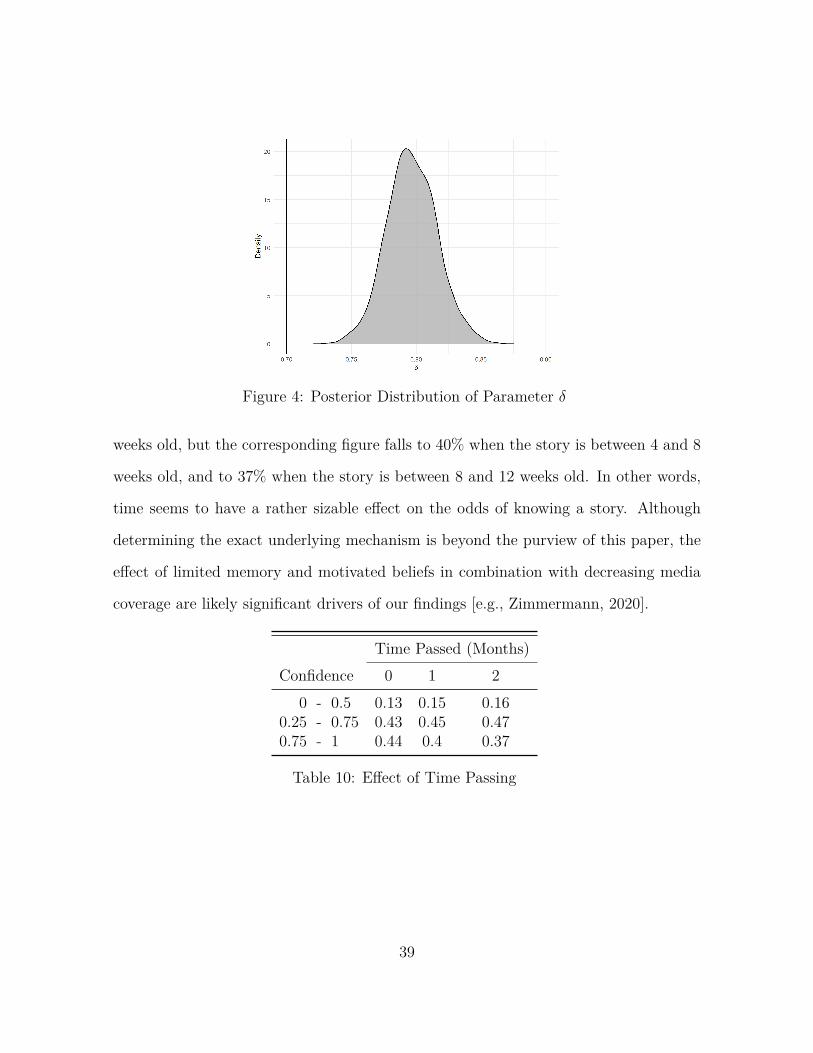
Figure 4: Posterior Distribution of Parameter δ
weeks old, but the corresponding figure falls to 40% when the story is between 4 and 8
weeks old, and to 37% when the story is between 8 and 12 weeks old. In other words,
time seems to have a rather sizable effect on the odds of knowing a story. Although
determining the exact underlying mechanism is beyond the purview of this paper, the
effect of limited memory and motivated beliefs in combination with decreasing media
coverage are likely significant drivers of our findings [e.g., Zimmermann, 2020].
Time Passed (Months)Confidence 0 1 2
0 - 0.5 0.13 0.15 0.160.25 - 0.75 0.43 0.45 0.470.75 - 1 0.44 0.4 0.37
Table 10: Effect of Time Passing
39
4.5 Inequalities
As mentioned above, there exists an important literature documenting the
relationship between media coverage and voters’ information and, in turn, the
relationship between voters’ information and the attention received from politicians.
One important channel through which this accountability channel operates is through
voting. If voters are aware of the policies and actions implemented by politicians,
the latter have greater incentives to cater to voters’ preferences to increase their odds
of reelection. Our analysis so far has mostly documented the level of knowledge
about political news exhibited by the “average voter.” Investigating the distribution
of knowledge across socioeconomic groups is also of interest. As politicians are likely
aware of the link between information and voting, they have incentives to skew their
policies towards the better informed groups of voters.
To illustrate some of these dynamics, in Appendix A we develop a simple model
of retrospective voting inspired by Stromberg [2001], Prat and Stromberg [2013], and
Matejka and Tabellini [2017]. In the model, various groups of voters differ in their
policy preferences ug (·), their size sg, and information levels ρg (the share of informed
individuals in group g). We show that an incumbent politician seeking reelection has
incentives to allocate weights equal to ρgρsg on the various groups of voters, where
ρ denotes the average voter’s level of information. By contrast, a utilitarian social
planner would allocate weights equal to sg. In other words, the incumbent politician
places greater weight on the better informed groups of voters, thereby exacerbating
other possible existing inequalities.
In this section, we quantify the extent of knowledge inequalities across socioeconomic
groups. Table 11 reports, for the 16 socioeconomic groups our model explicitly identifies
40
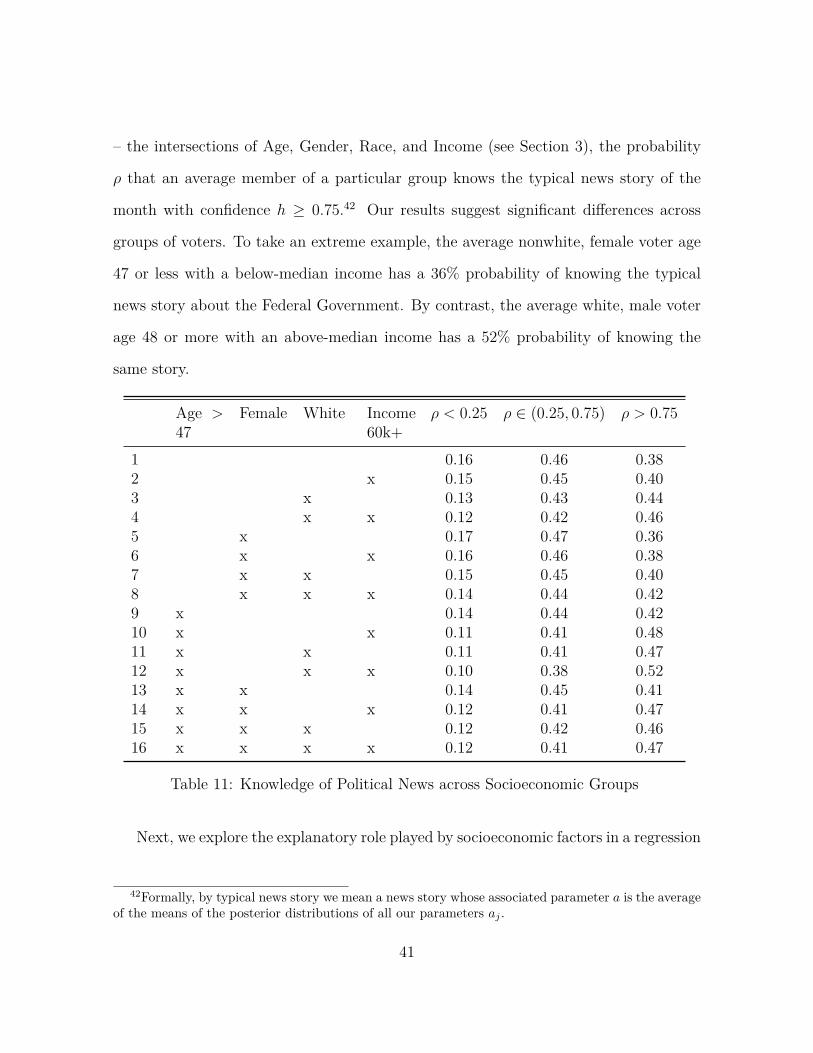
– the intersections of Age, Gender, Race, and Income (see Section 3), the probability
ρ that an average member of a particular group knows the typical news story of the
month with confidence h ≥ 0.75.42 Our results suggest significant differences across
groups of voters. To take an extreme example, the average nonwhite, female voter age
47 or less with a below-median income has a 36% probability of knowing the typical
news story about the Federal Government. By contrast, the average white, male voter
age 48 or more with an above-median income has a 52% probability of knowing the
same story.
Age >47
Female White Income60k+
ρ < 0.25 ρ ∈ (0.25, 0.75) ρ > 0.75
1 0.16 0.46 0.382 x 0.15 0.45 0.403 x 0.13 0.43 0.444 x x 0.12 0.42 0.465 x 0.17 0.47 0.366 x x 0.16 0.46 0.387 x x 0.15 0.45 0.408 x x x 0.14 0.44 0.429 x 0.14 0.44 0.4210 x x 0.11 0.41 0.4811 x x 0.11 0.41 0.4712 x x x 0.10 0.38 0.5213 x x 0.14 0.45 0.4114 x x x 0.12 0.41 0.4715 x x x 0.12 0.42 0.4616 x x x x 0.12 0.41 0.47
Table 11: Knowledge of Political News across Socioeconomic Groups
Next, we explore the explanatory role played by socioeconomic factors in a regression
42Formally, by typical news story we mean a news story whose associated parameter a is the averageof the means of the posterior distributions of all our parameters aj .
41
format.43 Column (1) in Table 21 (see Appendix B) looks at the effects of various
socioeconomic factors on the probability that a voter knows the typical news story about
the Federal Government with confidence h ≥ 0.75. All our coefficients are estimated
very precisely. Age is the most important characteristic, with voters age 47 or more
being 5.6 percent points more likely to know the typical story. Intuitively, college
education and income also positively predict knowledge, by 0.8 and 2.7 percentage
points respectively. By contrast, women and racial minorities are associated with lower
knowledge of the news. Women are 3.1 percentage points less likely to know the typical
story about the Federal Government. Hispanics and African-Americans are 3.7 and
4.1 percentage points less likely to know the typical news story, respectively. Column
(2) adds political affiliations (where the excluded category are ‘Independents’) and
Column 3 adds general engagement with party politics (partisanship). The coefficients
on political parties are small and they switch sign depending on whether partisanship
is included. Partisanship increases the odds of knowing the typical news story by
0.4 percentage points. Table 22 (where column (1) reproduces column (3) in Table
21) includes media consumption habits. In both Columns (2) and (3) the number of
news outlets and time usage (in minutes) are significantly positively associated with
knowledge of the news, and the coefficients on the socioeconomic factors are largely
unchanged by the inclusion of these news consumption habits (as well as extra media
controls in column (3)). Finally, Table 23 (which reproduces Table 21’s column (3) and
Table 22’s column (3)) adds Political Interest as a control variable. Political Interest has
43Recall that our model allows for different group-level means µg across 16 groups defined by Age,Gender, Race, and Income. This approach tends to give these four socioeconomic characteristics greaterweight in explaining θi (and thus ρi (h)) compared to other characteristics (e.g., interest in politics,or media usage). For this reason, the coefficients associated to Age, Gender, Race, and Income arerelatively large in our regression analysis. By and large, not prioritizing these four variables would stilllead to larger coefficients on socioeconomic variables, but the differences would diminish noticeably.
42
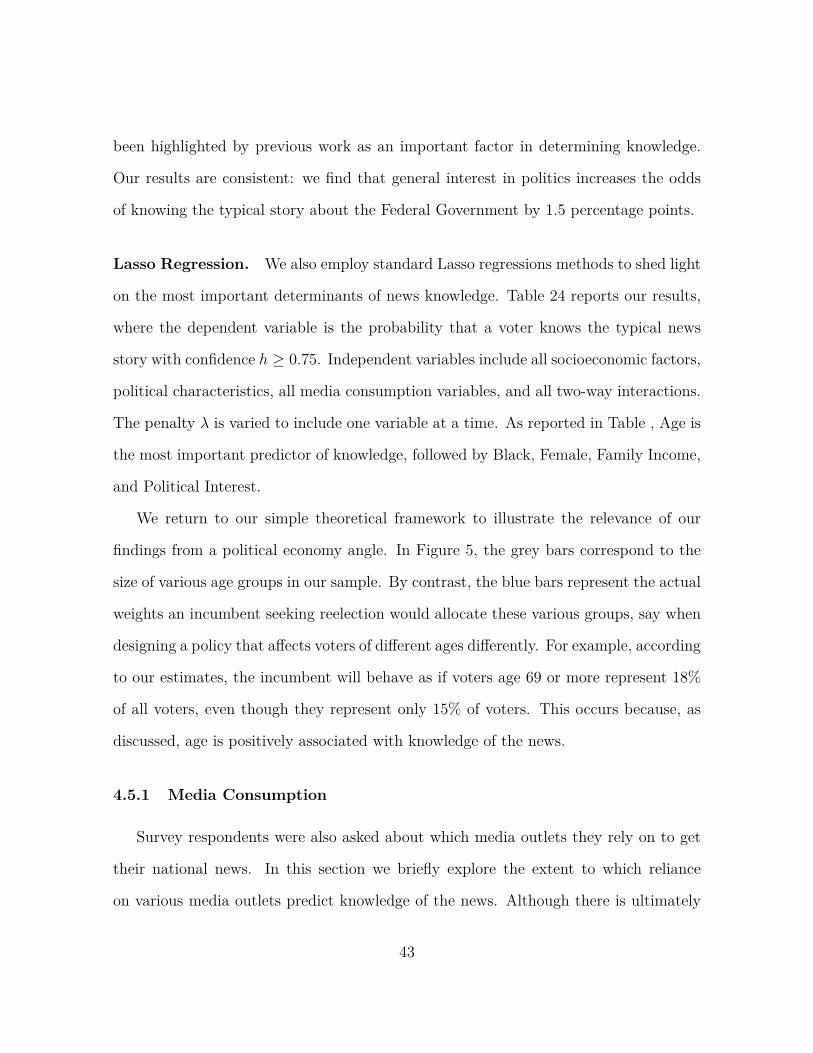
been highlighted by previous work as an important factor in determining knowledge.
Our results are consistent: we find that general interest in politics increases the odds
of knowing the typical story about the Federal Government by 1.5 percentage points.
Lasso Regression. We also employ standard Lasso regressions methods to shed light
on the most important determinants of news knowledge. Table 24 reports our results,
where the dependent variable is the probability that a voter knows the typical news
story with confidence h ≥ 0.75. Independent variables include all socioeconomic factors,
political characteristics, all media consumption variables, and all two-way interactions.
The penalty λ is varied to include one variable at a time. As reported in Table , Age is
the most important predictor of knowledge, followed by Black, Female, Family Income,
and Political Interest.
We return to our simple theoretical framework to illustrate the relevance of our
findings from a political economy angle. In Figure 5, the grey bars correspond to the
size of various age groups in our sample. By contrast, the blue bars represent the actual
weights an incumbent seeking reelection would allocate these various groups, say when
designing a policy that affects voters of different ages differently. For example, according
to our estimates, the incumbent will behave as if voters age 69 or more represent 18%
of all voters, even though they represent only 15% of voters. This occurs because, as
discussed, age is positively associated with knowledge of the news.
4.5.1 Media Consumption
Survey respondents were also asked about which media outlets they rely on to get
their national news. In this section we briefly explore the extent to which reliance
on various media outlets predict knowledge of the news. Although there is ultimately
43
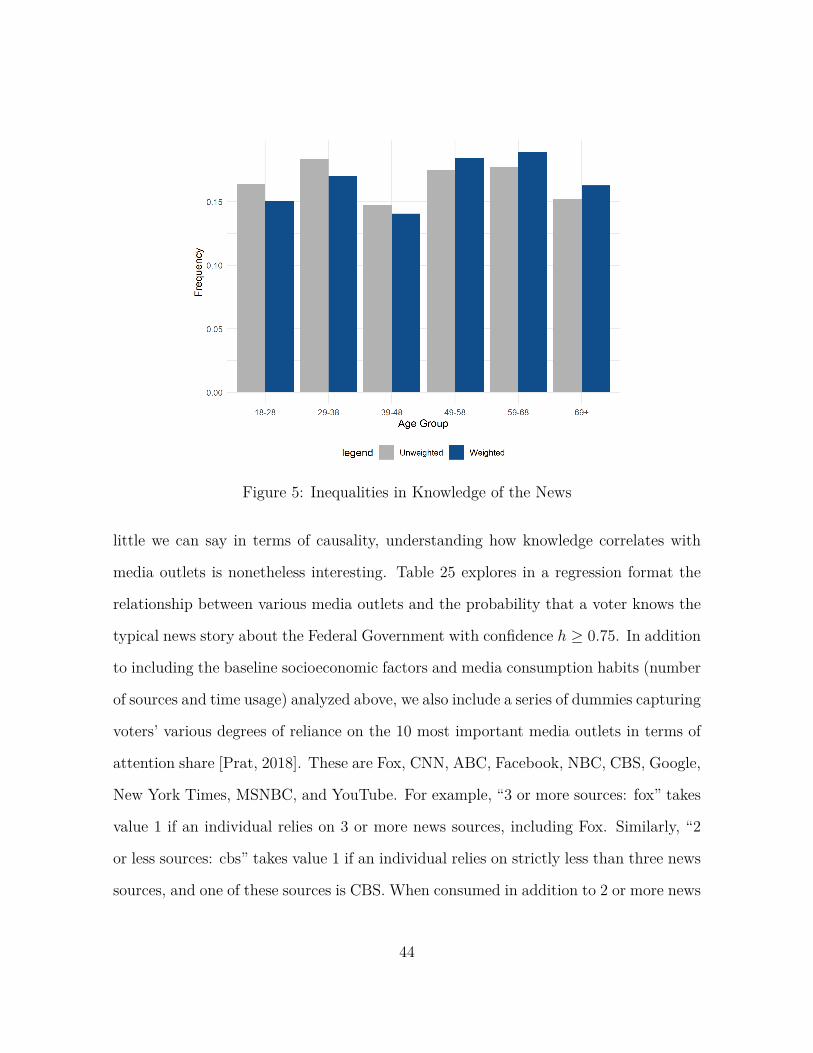
Figure 5: Inequalities in Knowledge of the News
little we can say in terms of causality, understanding how knowledge correlates with
media outlets is nonetheless interesting. Table 25 explores in a regression format the
relationship between various media outlets and the probability that a voter knows the
typical news story about the Federal Government with confidence h ≥ 0.75. In addition
to including the baseline socioeconomic factors and media consumption habits (number
of sources and time usage) analyzed above, we also include a series of dummies capturing
voters’ various degrees of reliance on the 10 most important media outlets in terms of
attention share [Prat, 2018]. These are Fox, CNN, ABC, Facebook, NBC, CBS, Google,
New York Times, MSNBC, and YouTube. For example, “3 or more sources: fox” takes
value 1 if an individual relies on 3 or more news sources, including Fox. Similarly, “2
or less sources: cbs” takes value 1 if an individual relies on strictly less than three news
sources, and one of these sources is CBS. When consumed in addition to 2 or more news
44
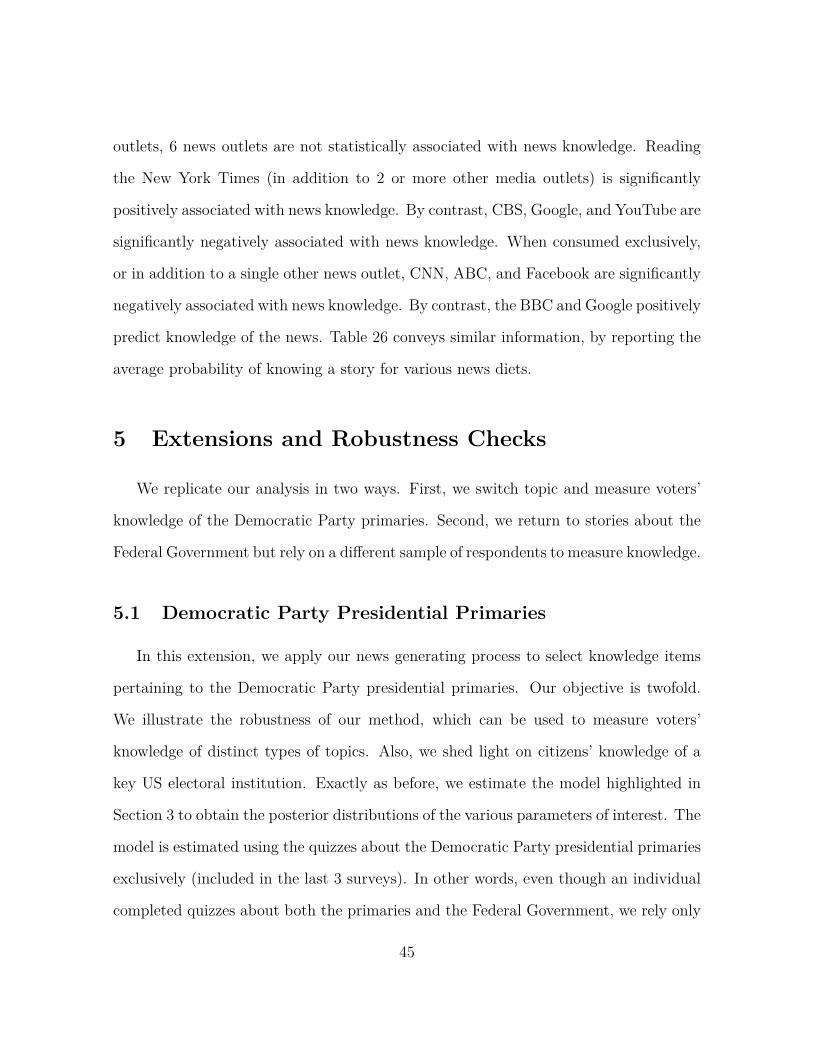
outlets, 6 news outlets are not statistically associated with news knowledge. Reading
the New York Times (in addition to 2 or more other media outlets) is significantly
positively associated with news knowledge. By contrast, CBS, Google, and YouTube are
significantly negatively associated with news knowledge. When consumed exclusively,
or in addition to a single other news outlet, CNN, ABC, and Facebook are significantly
negatively associated with news knowledge. By contrast, the BBC and Google positively
predict knowledge of the news. Table 26 conveys similar information, by reporting the
average probability of knowing a story for various news diets.
5 Extensions and Robustness Checks
We replicate our analysis in two ways. First, we switch topic and measure voters’
knowledge of the Democratic Party primaries. Second, we return to stories about the
Federal Government but rely on a different sample of respondents to measure knowledge.
5.1 Democratic Party Presidential Primaries
In this extension, we apply our news generating process to select knowledge items
pertaining to the Democratic Party presidential primaries. Our objective is twofold.
We illustrate the robustness of our method, which can be used to measure voters’
knowledge of distinct types of topics. Also, we shed light on citizens’ knowledge of a
key US electoral institution. Exactly as before, we estimate the model highlighted in
Section 3 to obtain the posterior distributions of the various parameters of interest. The
model is estimated using the quizzes about the Democratic Party presidential primaries
exclusively (included in the last 3 surveys). In other words, even though an individual
completed quizzes about both the primaries and the Federal Government, we rely only
45
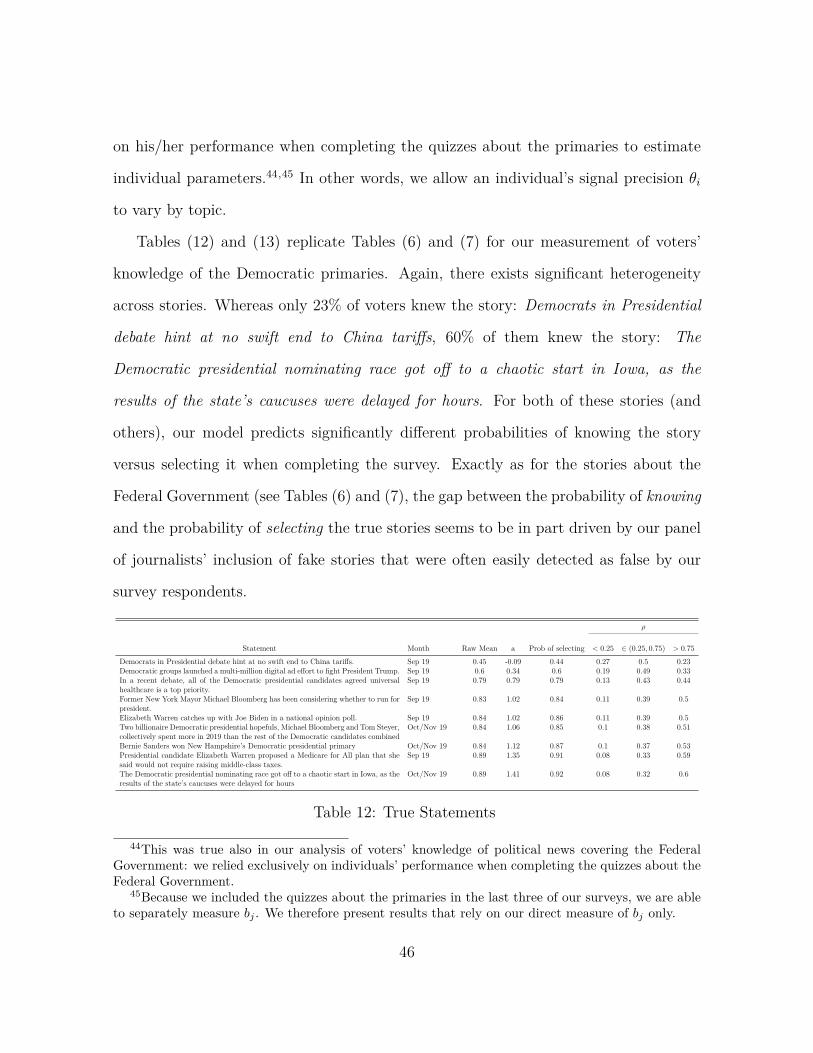
on his/her performance when completing the quizzes about the primaries to estimate
individual parameters.44,45 In other words, we allow an individual’s signal precision θi
to vary by topic.
Tables (12) and (13) replicate Tables (6) and (7) for our measurement of voters’
knowledge of the Democratic primaries. Again, there exists significant heterogeneity
across stories. Whereas only 23% of voters knew the story: Democrats in Presidential
debate hint at no swift end to China tariffs, 60% of them knew the story: The
Democratic presidential nominating race got off to a chaotic start in Iowa, as the
results of the state’s caucuses were delayed for hours. For both of these stories (and
others), our model predicts significantly different probabilities of knowing the story
versus selecting it when completing the survey. Exactly as for the stories about the
Federal Government (see Tables (6) and (7), the gap between the probability of knowing
and the probability of selecting the true stories seems to be in part driven by our panel
of journalists’ inclusion of fake stories that were often easily detected as false by our
survey respondents.
ρ
Statement Month Raw Mean a Prob of selecting < 0.25 ∈ (0.25, 0.75) > 0.75Democrats in Presidential debate hint at no swift end to China tariffs. Sep 19 0.45 -0.09 0.44 0.27 0.5 0.23Democratic groups launched a multi-million digital ad effort to fight President Trump. Sep 19 0.6 0.34 0.6 0.19 0.49 0.33In a recent debate, all of the Democratic presidential candidates agreed universalhealthcare is a top priority.
Sep 19 0.79 0.79 0.79 0.13 0.43 0.44
Former New York Mayor Michael Bloomberg has been considering whether to run forpresident.
Sep 19 0.83 1.02 0.84 0.11 0.39 0.5
Elizabeth Warren catches up with Joe Biden in a national opinion poll. Sep 19 0.84 1.02 0.86 0.11 0.39 0.5Two billionaire Democratic presidential hopefuls, Michael Bloomberg and Tom Steyer,collectively spent more in 2019 than the rest of the Democratic candidates combined
Oct/Nov 19 0.84 1.06 0.85 0.1 0.38 0.51
Bernie Sanders won New Hampshire’s Democratic presidential primary Oct/Nov 19 0.84 1.12 0.87 0.1 0.37 0.53Presidential candidate Elizabeth Warren proposed a Medicare for All plan that shesaid would not require raising middle-class taxes.
Sep 19 0.89 1.35 0.91 0.08 0.33 0.59
The Democratic presidential nominating race got off to a chaotic start in Iowa, as theresults of the state’s caucuses were delayed for hours
Oct/Nov 19 0.89 1.41 0.92 0.08 0.32 0.6
Table 12: True Statements
44This was true also in our analysis of voters’ knowledge of political news covering the FederalGovernment: we relied exclusively on individuals’ performance when completing the quizzes about theFederal Government.
45Because we included the quizzes about the primaries in the last three of our surveys, we are ableto separately measure bj . We therefore present results that rely on our direct measure of bj only.
46
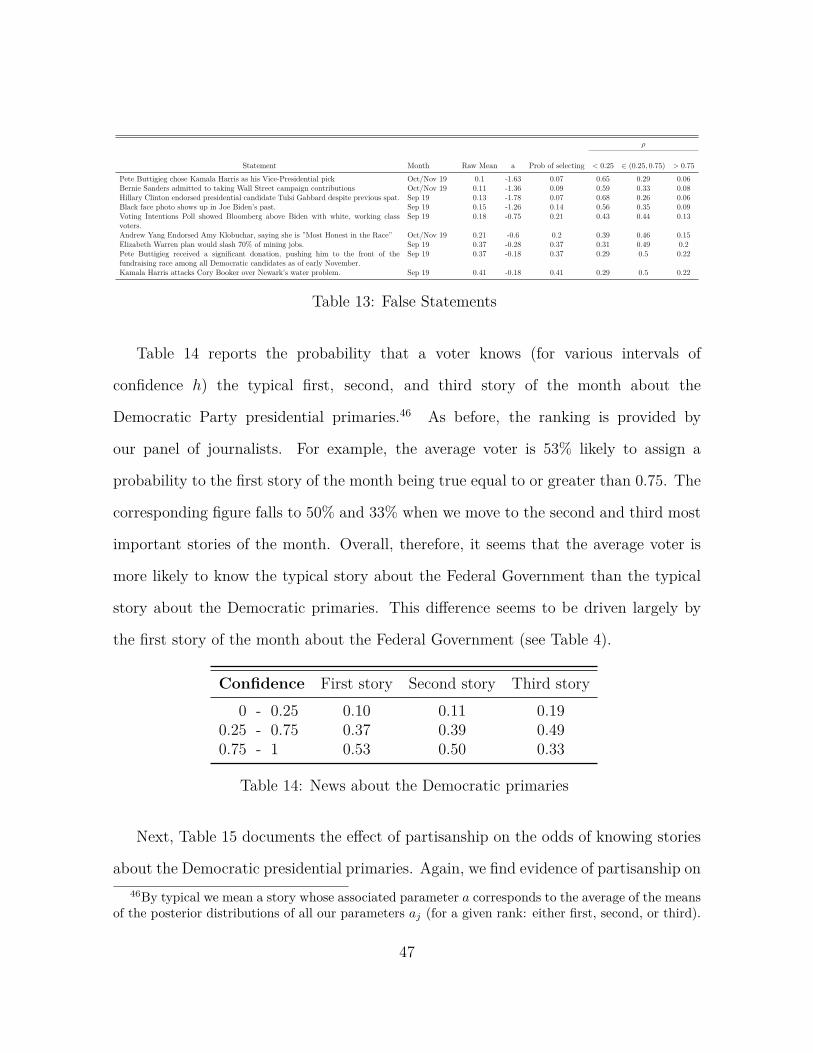
ρ
Statement Month Raw Mean a Prob of selecting < 0.25 ∈ (0.25, 0.75) > 0.75Pete Buttigieg chose Kamala Harris as his Vice-Presidential pick Oct/Nov 19 0.1 -1.63 0.07 0.65 0.29 0.06Bernie Sanders admitted to taking Wall Street campaign contributions Oct/Nov 19 0.11 -1.36 0.09 0.59 0.33 0.08Hillary Clinton endorsed presidential candidate Tulsi Gabbard despite previous spat. Sep 19 0.13 -1.78 0.07 0.68 0.26 0.06Black face photo shows up in Joe Biden’s past. Sep 19 0.15 -1.26 0.14 0.56 0.35 0.09Voting Intentions Poll showed Bloomberg above Biden with white, working classvoters.
Sep 19 0.18 -0.75 0.21 0.43 0.44 0.13
Andrew Yang Endorsed Amy Klobuchar, saying she is ”Most Honest in the Race” Oct/Nov 19 0.21 -0.6 0.2 0.39 0.46 0.15Elizabeth Warren plan would slash 70% of mining jobs. Sep 19 0.37 -0.28 0.37 0.31 0.49 0.2Pete Buttigieg received a significant donation, pushing him to the front of thefundraising race among all Democratic candidates as of early November.
Sep 19 0.37 -0.18 0.37 0.29 0.5 0.22
Kamala Harris attacks Cory Booker over Newark’s water problem. Sep 19 0.41 -0.18 0.41 0.29 0.5 0.22
Table 13: False Statements
Table 14 reports the probability that a voter knows (for various intervals of
confidence h) the typical first, second, and third story of the month about the
Democratic Party presidential primaries.46 As before, the ranking is provided by
our panel of journalists. For example, the average voter is 53% likely to assign a
probability to the first story of the month being true equal to or greater than 0.75. The
corresponding figure falls to 50% and 33% when we move to the second and third most
important stories of the month. Overall, therefore, it seems that the average voter is
more likely to know the typical story about the Federal Government than the typical
story about the Democratic primaries. This difference seems to be driven largely by
the first story of the month about the Federal Government (see Table 4).
Confidence First story Second story Third story0 - 0.25 0.10 0.11 0.19
0.25 - 0.75 0.37 0.39 0.490.75 - 1 0.53 0.50 0.33
Table 14: News about the Democratic primaries
Next, Table 15 documents the effect of partisanship on the odds of knowing stories
about the Democratic presidential primaries. Again, we find evidence of partisanship on46By typical we mean a story whose associated parameter a corresponds to the average of the means
of the posterior distributions of all our parameters aj (for a given rank: either first, second, or third).
47
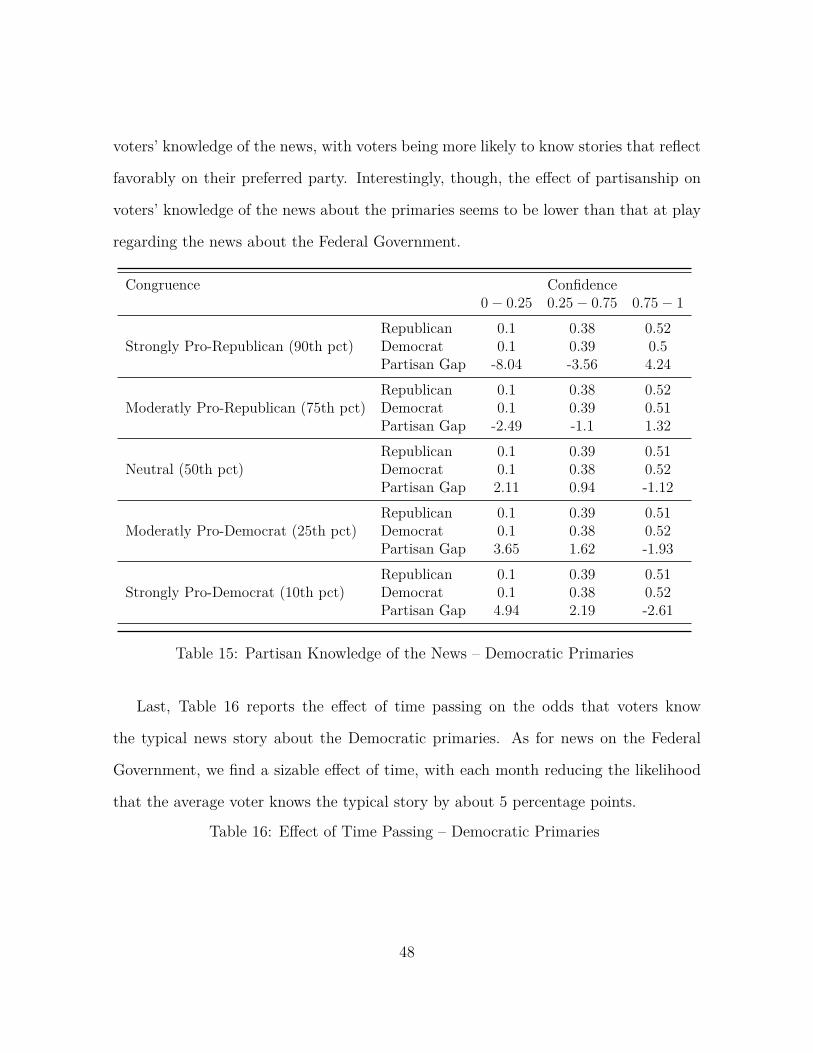
voters’ knowledge of the news, with voters being more likely to know stories that reflect
favorably on their preferred party. Interestingly, though, the effect of partisanship on
voters’ knowledge of the news about the primaries seems to be lower than that at play
regarding the news about the Federal Government.
Congruence Confidence0− 0.25 0.25− 0.75 0.75− 1
Strongly Pro-Republican (90th pct)Republican 0.1 0.38 0.52Democrat 0.1 0.39 0.5Partisan Gap -8.04 -3.56 4.24
Moderatly Pro-Republican (75th pct)Republican 0.1 0.38 0.52Democrat 0.1 0.39 0.51Partisan Gap -2.49 -1.1 1.32
Neutral (50th pct)Republican 0.1 0.39 0.51Democrat 0.1 0.38 0.52Partisan Gap 2.11 0.94 -1.12
Moderatly Pro-Democrat (25th pct)Republican 0.1 0.39 0.51Democrat 0.1 0.38 0.52Partisan Gap 3.65 1.62 -1.93
Strongly Pro-Democrat (10th pct)Republican 0.1 0.39 0.51Democrat 0.1 0.38 0.52Partisan Gap 4.94 2.19 -2.61
Table 15: Partisan Knowledge of the News – Democratic Primaries
Last, Table 16 reports the effect of time passing on the odds that voters know
the typical news story about the Democratic primaries. As for news on the Federal
Government, we find a sizable effect of time, with each month reducing the likelihood
that the average voter knows the typical story by about 5 percentage points.
Table 16: Effect of Time Passing – Democratic Primaries
48
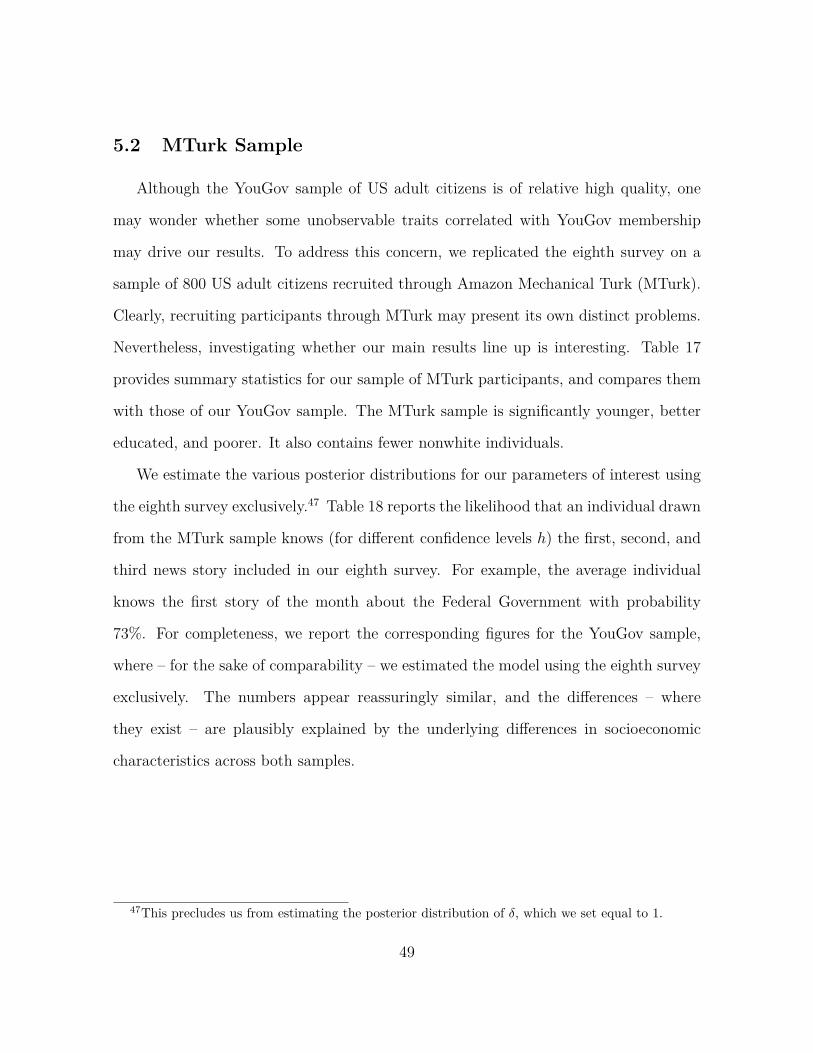
5.2 MTurk Sample
Although the YouGov sample of US adult citizens is of relative high quality, one
may wonder whether some unobservable traits correlated with YouGov membership
may drive our results. To address this concern, we replicated the eighth survey on a
sample of 800 US adult citizens recruited through Amazon Mechanical Turk (MTurk).
Clearly, recruiting participants through MTurk may present its own distinct problems.
Nevertheless, investigating whether our main results line up is interesting. Table 17
provides summary statistics for our sample of MTurk participants, and compares them
with those of our YouGov sample. The MTurk sample is significantly younger, better
educated, and poorer. It also contains fewer nonwhite individuals.
We estimate the various posterior distributions for our parameters of interest using
the eighth survey exclusively.47 Table 18 reports the likelihood that an individual drawn
from the MTurk sample knows (for different confidence levels h) the first, second, and
third news story included in our eighth survey. For example, the average individual
knows the first story of the month about the Federal Government with probability
73%. For completeness, we report the corresponding figures for the YouGov sample,
where – for the sake of comparability – we estimated the model using the eighth survey
exclusively. The numbers appear reassuringly similar, and the differences – where
they exist – are plausibly explained by the underlying differences in socioeconomic
characteristics across both samples.
47This precludes us from estimating the posterior distribution of δ, which we set equal to 1.
49
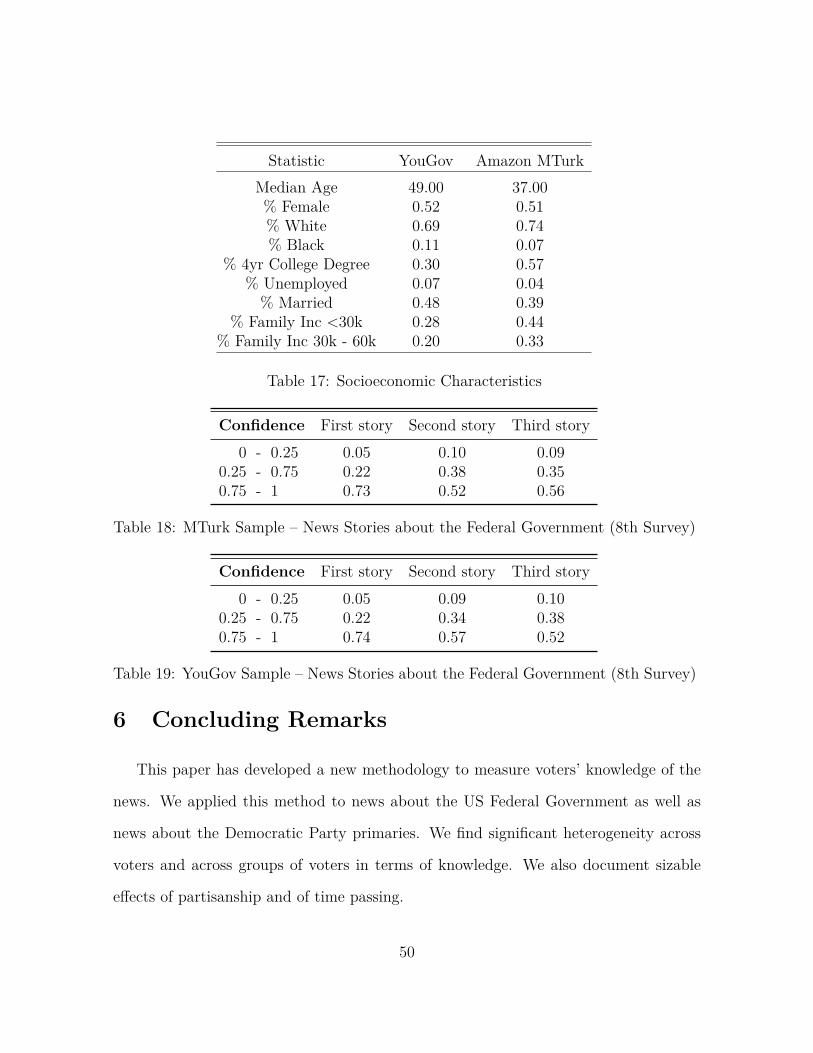
Statistic YouGov Amazon MTurkMedian Age 49.00 37.00% Female 0.52 0.51% White 0.69 0.74% Black 0.11 0.07
% 4yr College Degree 0.30 0.57% Unemployed 0.07 0.04
% Married 0.48 0.39% Family Inc <30k 0.28 0.44
% Family Inc 30k - 60k 0.20 0.33
Table 17: Socioeconomic Characteristics
Confidence First story Second story Third story0 - 0.25 0.05 0.10 0.09
0.25 - 0.75 0.22 0.38 0.350.75 - 1 0.73 0.52 0.56
Table 18: MTurk Sample – News Stories about the Federal Government (8th Survey)
Confidence First story Second story Third story0 - 0.25 0.05 0.09 0.10
0.25 - 0.75 0.22 0.34 0.380.75 - 1 0.74 0.57 0.52
Table 19: YouGov Sample – News Stories about the Federal Government (8th Survey)
6 Concluding Remarks
This paper has developed a new methodology to measure voters’ knowledge of the
news. We applied this method to news about the US Federal Government as well as
news about the Democratic Party primaries. We find significant heterogeneity across
voters and across groups of voters in terms of knowledge. We also document sizable
effects of partisanship and of time passing.
50
It would be interesting to replicate our analysis in a variety of contexts. In particular,
replicating our analysis across a number of countries would allow for an international
index of news knowledge. Replicating our analysis in the US but at the local level
would also be relevant, as many commentators worry about the existence of local news
deserts.
51
ReferencesHunt Alcott and Matthew Gentzkow. Social Media and Fake News in the 2016 Election.
Journal of Economic Perspectives, 31(2):211–236, 2017.
Hunt Allcott, Luca Braghieri, Sarah Eichmeyer, and Matthew Gentzkow. The WelfareEffects of Social Media. Working Paper, 2019.
Eric Arias, Horacio Larreguy, John Marshall, and Pablo Querubin. Does the Contentand Mode of Delivery of Information Matter for Political Accountability? Evidencefrom a Field Experiment in Mexico. Working Paper, 2018.
Eric Arias, Horacio Larreguy, John Marshall, and Pablo Querubin. Priors Rule: WhenDo Malfeasance Revelations Help or Hurt Incumbent Parties. Working Paper, 2019.
Abhijit Banerjee, Selvan Kumar, Rohini Pande, and Felix Su. Do Informed VotersMake Better Choices? Experimental Evidence from Urban India. Working Paper,2012.
Oscar Barrera Rodriguez, Sergei M. Guriev, Emeric Henry, and Ekaterina Zhuravskaya.Facts, Alternative Facts, and Fact Checking in Times of Post-Truth Politics. CEPRWorking Paper, 2018.
Roland Benabou and Jean Tirole. Self-Confidence and Personal Motivation. QuarterlyJournal of Economics, 117, 2002.
Darrell R. Bock. Estimating Item Parameters and Latent Ability When Responses AreScored in Two or More Nominal Categories. Psychometrika, 37:29–51, 1972.
John G. Bullock, Alan S. Gerber, Seth J. Hill, and Gregory A. Huber. Partisan Biasin Factual Beliefs about Politics. Quarterly Journal of Political Science, 10, 2015.
Bob Carpenter, Andrew Gelman, Matthew D Hoffman, Daniel Lee, Ben Goodrich,Michael Betancourt, Marcus Brubaker, Jiqiang Guo, Peter Li, and Allen Riddell.Stan: A probabilistic programming language. Journal of statistical software, 76(1),2017.
Yuyu Chen and David Y. Yang. The Impact of Media Censorship: 1984 or Brave NewWorld? American Economic Review, 109(6):2294–2332, 2019.
Stefano DellaVigna and Ethan Kaplan. The Fox News Effect: Media Bias and Voting.The Quarterly Journal of Economics, 122(3):1187–1234, 2007.
Michael X. Delli Carpini and Scott Keeter. What Americans Know about Politics andWhy It Matters. Yale University Press, 1996.
52
Thomas Eisensee and David Stromberg. News Droughts, News Floods, and U. S.Disaster Relief. The Quarterly Journal of Economics, 122(2):693–728, 2007.
Ruben Enikolopov, Maria Petrova, and Ekaterina Zhuravskaya. Media and PoliticalPersuasion: Evidence from Russia. American Economic Review, 101(7):3253–85,2011.
Eurobarometer. Standard Eurobarometer 87. European Commision, 2017.
Claudio Ferraz and Frederico Finan. Exposing Corrupt Politicians: The Effects ofBrazil’s Publicly Released Audits on Electoral Outcomes. The Quarterly Journal ofEconomics, 123(2):703–745, 2008.
Alessandro Gavazza, Mattia Nardotto, and Tommaso Valletti. Internet and Politics:Evidence from U.K. Local Elections and Local Government Policies. The Review ofEconomic Studies, 86(5):2092–2135, 2018.
Matthew Gentzkow, Jesse M. Shapiro, and Daniel F. Stone. Media bias in themarketplace: theory. In Simon Anderson, Joel Waldfogel, and David Stromberg,editors, Handbook of Media Economics, chapter 2. North Holland, 2015.
Alan S. Gerber, Dean Karlan, and Daniel Bergan. Does the Media Matter? A FieldExperiment Measuring the Effect of Newspapers on Voting Behavior and PoliticalOpinions. American Economic Journal: Applied Economics, 1(2):35–52, 2009.
Andrew M. Guess. Measure for Measure: An Experimental Test of Online PoliticalMedia Exposure. Political Analysis, 23(1):59–75, 2015.
Matthew D Hoffman and Andrew Gelman. The no-u-turn sampler: adaptively settingpath lengths in hamiltonian monte carlo. Journal of Machine Learning Research, 15(1):1593–1623, 2014.
Chad Kendall, Tommaso Nannicini, and Francesco Trebbi. How Do Voters Respond toInformation? Evidence from a Randomized Campaign. American Economic Review,105(1):322–53, January 2015.
Julien Labonne, Cesi Cruz, and Philip Keefer. Buying Informed Voters: New Effectsof Information on Voters and Candidates. Working Paper, 2019.
David M. J. Lazer, Matthew A. Baum, Yochai Benkler, Adam J. Berinsky, Kelly M.Greenhill, Filippo Menczer, Miriam J. Metzger, Brendan Nyhan, Gordon Pennycook,David Rothschild, Michael Schudson, Steven A. Sloman, Cass R. Sunstein, Emily A.Thorson, Duncan J. Watts, and Jonathan L. Zittrain. The science of fake news.Science, 359(6380):1094–1096, 2018. ISSN 0036-8075. doi: 10.1126/science.aao2998.
53
Caroline Le Pennec and Vincent Pons. Vote Choice Formation and Minimal Effectsof TV Debates: Evidence from 61 Elections in 9 OECD Countries. NBER WorkingPaper 26572, 2019.
Daniel J. Levitin. A Field Guide to Lies: Critical Thinking in the Information Age.New York, New York: Dutton, 2016.
Gregory J. Martin, Maria Petrova, and Ali Yurukoglu. Bias in Cable News: Persuasionand Polarization. American Economic Review, 107(9):2565–2599, 2017.
Filip Matejka and Guido Tabellini. Electoral Competition with Rationally InattentiveVoters. Working Paper, 2017.
Pew. From Brexit to Zika: What Do Americans Know? Pew Research Center, 2017.
Pew. Wide Gender Gap, Growing Educational Divide in Voters’ Party Identification.Pew Research Center, 2018.
Andrea Prat. Media Power. Journal of Political Economy, 126(4):1747–83, 2018.
Andrea Prat and David Stromberg. The Political Economy of Mass Media, volume 2 ofEconometric Society Monographs, page 135–187. Cambridge University Press, 2013.
Vincent Price and John Zaller. Who Gets the News? Alternative Measures of NewsReception and Their Implications for Research. The Public Opinion Quarterly, 57(2):133–164, 1993.
Markus Prior. Visual Political Knowledge: A Different Road to Competence? TheJournal of Politics, 76(1):41–57, 2014.
Markus Prior and Arthur Lupia. Money, Time, and Political Knowledge: DistinguishingQuick Recall and Political Learning Skills. American Journal of Political Science, 52(1):169–183, 2008.
Markus Prior, Gaurav Sood, and Kabir Khanna. You Cannot be Serious: The Impact ofAccuracy Incentives on Partisan Bias in Reports of Economic Perceptions. QuarterlyJournal of Political Science, 10, 2015.
Georg Rasch. Probabilistic Models for Some Intelligence and Attainment Tests. DanishInstitute for Educational Research, 1960.
Ritva Reinikka and Jakob Svensson. Fighting Corruption to Improve Schooling:Evidence from a Newspaper Campaign in Uganda. Journal of the European EconomicAssociation, 3(2-3):259–267, 2005. doi: 10.1162/jeea.2005.3.2-3.259.
54
James M. Snyder and David Stromberg. Press Coverage and Political Accountability.Journal of Political Economy, 118(2):355–408, 2010.
Richard Stengel. Information Wars. How We Lost the Global Battle AgainstDisinformation and What We Can Do about It. Grove Press, 2019.
David Stromberg. Mass Media and Public Policy. European Economic Review, 45,2001.
David Stromberg. Radio’s Impact on Public Spending. The Quarterly Journal ofEconomics, 119(1):189–221, 2004.
David Stromberg. Media and Politics. Annual Review of Economics, 7(1):173–205,2015.
Wim J. Van der Linden and Ronald K. (eds) Hambleton. Handbook of Modern ItemResponse Theory. H. New York, NY: Springer, 1997.
Florian Zimmermann. The Dynamics of Motivated Beliefs. American Economic Review,110(2):337–61, 2020.
55
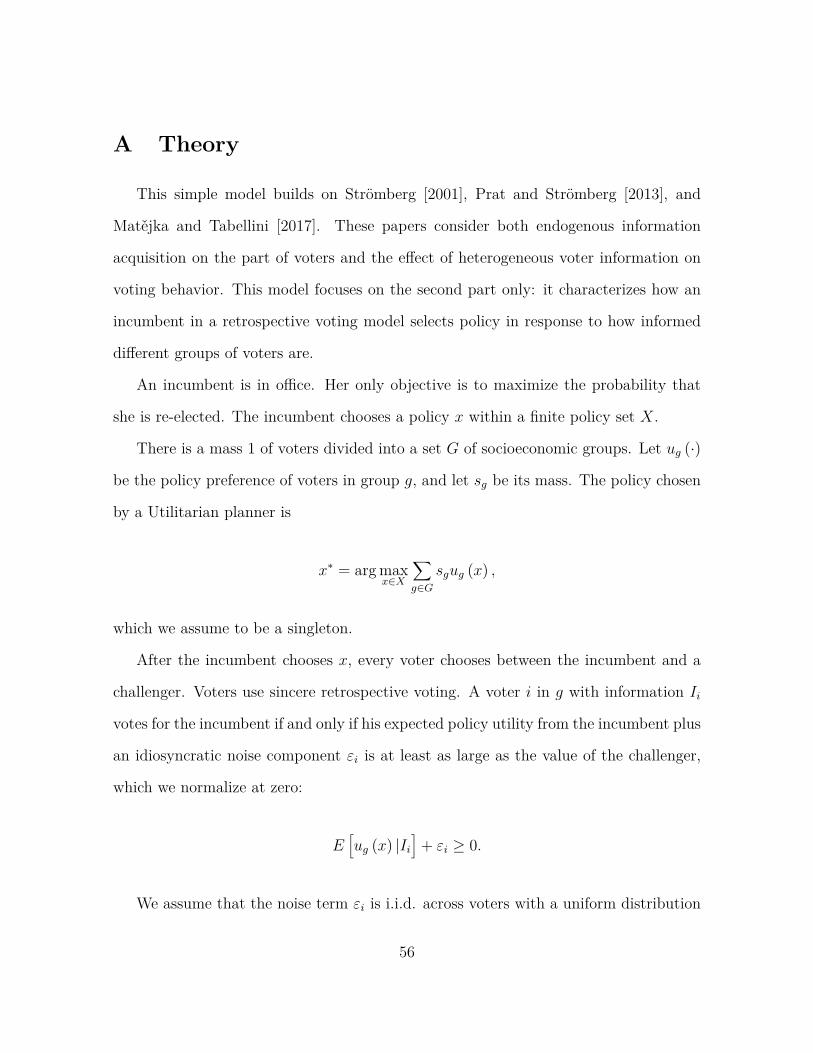
A Theory
This simple model builds on Stromberg [2001], Prat and Stromberg [2013], and
Matejka and Tabellini [2017]. These papers consider both endogenous information
acquisition on the part of voters and the effect of heterogeneous voter information on
voting behavior. This model focuses on the second part only: it characterizes how an
incumbent in a retrospective voting model selects policy in response to how informed
different groups of voters are.
An incumbent is in office. Her only objective is to maximize the probability that
she is re-elected. The incumbent chooses a policy x within a finite policy set X.
There is a mass 1 of voters divided into a set G of socioeconomic groups. Let ug (·)
be the policy preference of voters in group g, and let sg be its mass. The policy chosen
by a Utilitarian planner is
x∗ = arg maxx∈X
∑g∈G
sgug (x) ,
which we assume to be a singleton.
After the incumbent chooses x, every voter chooses between the incumbent and a
challenger. Voters use sincere retrospective voting. A voter i in g with information Ii
votes for the incumbent if and only if his expected policy utility from the incumbent plus
an idiosyncratic noise component εi is at least as large as the value of the challenger,
which we normalize at zero:
E[ug (x) |Ii
]+ εi ≥ 0.
We assume that the noise term εi is i.i.d. across voters with a uniform distribution
56
on [−a, a] where a is sufficiently large so that ug (x) ∈ [−a, a] for all g and all x.
Voters may be informed or uninformed. An informed voter observes x. An
uninformed one does not see x (but is otherwise fully rational and Bayesian). Let
ρi be the probability that voter i is informed. Let ρg be the average information share
in group g. The average informed share in the population is given by:
ρ =∑g∈G
sgρg.
Proposition 2 The incumbent selects policy
x = arg maxx∈X
∑g∈G
ρgsgug (x) ,
which is equivalent to the policy that would be chosen by a Utilitarian planner who
gives group g weight ρgρsg rather than sg.
The equilibrium payoff of group g is non-decreasing in its information share ρg: If
ρ′′g > ρ′g (and all other ρg’s remain constant), then
ug(x′′)≥ ug
(x′).
Proof. Suppose x is the policy chosen by the incumbent in equilibrium. Consider a
deviation: the incumbent chooses x rather than x. Uninformed voters do not observe
the deviation and continue to predict that the incumbent chooses x. The probability
that an uninformed voter in group g votes for the incumbent is therefore
Pr(ug (x) + εi ≥ 0
)= a+ ug (x)
2a
57
Informed voters instead observe the chosen policy x. The probability that an informed
voter in group g votes for the incumbent is therefore
Pr(ug (x) + εi ≥ 0
)= a+ ug (x)
2a
The incumbent’s vote share if she chooses x instead of x is
∑g∈G
pgsga+ ug (x)
2a +∑g∈G
(1− pg
)sga+ ug (x)
2a .
As x is not under the control of the incumbent and a is a constant, we have the first
part of the proposition.
The second part is proven by contradiction. Consider two information share vectors
ρ′ and ρ′′. The vectors are identical except for group g, where ρ′′g > ρ′g. Assume for
contradiction that ug (x′′) < ug (x′). As x′′ and x′ are maximizers, it must be that:
∑g∈G
pρ′′gsgug(x′′)≥
∑g∈G
ρ′′gsgug(x′)
∑g∈G
ρ′gsgug(x′)≥
∑g∈G
ρ′gsgug(x′′).
Add the two inequalities:
∑g∈G
ρ′′gsgug(x′′)
+∑g∈G
ρ′gsgug(x′)≥∑g∈G
ρ′′gsgug(x′)
+∑g∈G
ρ′gsgug(x′′).
Note that all terms with g 6= g cancel out:
ρ′′gsgug(x′′)
+ ρ′gsgug(x′)≥ ρ′′gsgug
(x′)
+ ρ′gsgug(x′′),
58
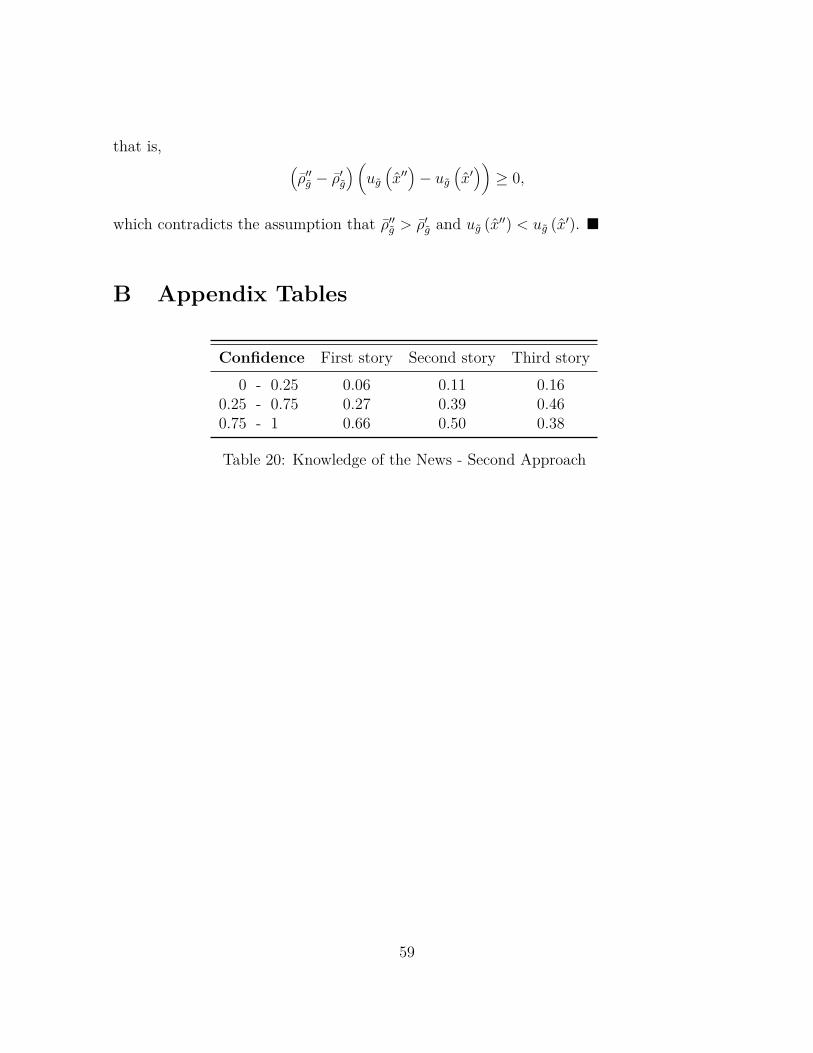
that is, (ρ′′g − ρ′g
)(ug(x′′)− ug
(x′))≥ 0,
which contradicts the assumption that ρ′′g > ρ′g and ug (x′′) < ug (x′). �
B Appendix Tables
Confidence First story Second story Third story0 - 0.25 0.06 0.11 0.16
0.25 - 0.75 0.27 0.39 0.460.75 - 1 0.66 0.50 0.38
Table 20: Knowledge of the News - Second Approach
59
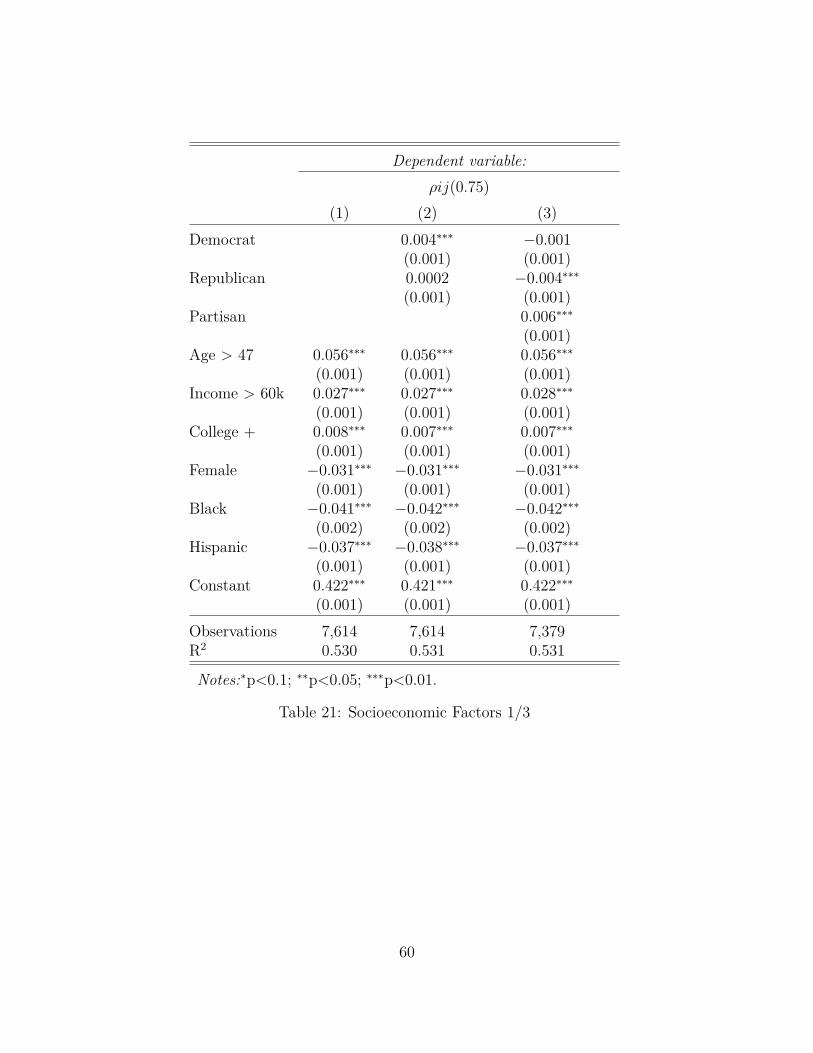
Dependent variable:ρij(0.75)
(1) (2) (3)Democrat 0.004∗∗∗ −0.001
(0.001) (0.001)Republican 0.0002 −0.004∗∗∗
(0.001) (0.001)Partisan 0.006∗∗∗
(0.001)Age > 47 0.056∗∗∗ 0.056∗∗∗ 0.056∗∗∗
(0.001) (0.001) (0.001)Income > 60k 0.027∗∗∗ 0.027∗∗∗ 0.028∗∗∗
(0.001) (0.001) (0.001)College + 0.008∗∗∗ 0.007∗∗∗ 0.007∗∗∗
(0.001) (0.001) (0.001)Female −0.031∗∗∗ −0.031∗∗∗ −0.031∗∗∗
(0.001) (0.001) (0.001)Black −0.041∗∗∗ −0.042∗∗∗ −0.042∗∗∗
(0.002) (0.002) (0.002)Hispanic −0.037∗∗∗ −0.038∗∗∗ −0.037∗∗∗
(0.001) (0.001) (0.001)Constant 0.422∗∗∗ 0.421∗∗∗ 0.422∗∗∗
(0.001) (0.001) (0.001)Observations 7,614 7,614 7,379R2 0.530 0.531 0.531
Notes:∗p<0.1; ∗∗p<0.05; ∗∗∗p<0.01.
Table 21: Socioeconomic Factors 1/3
60
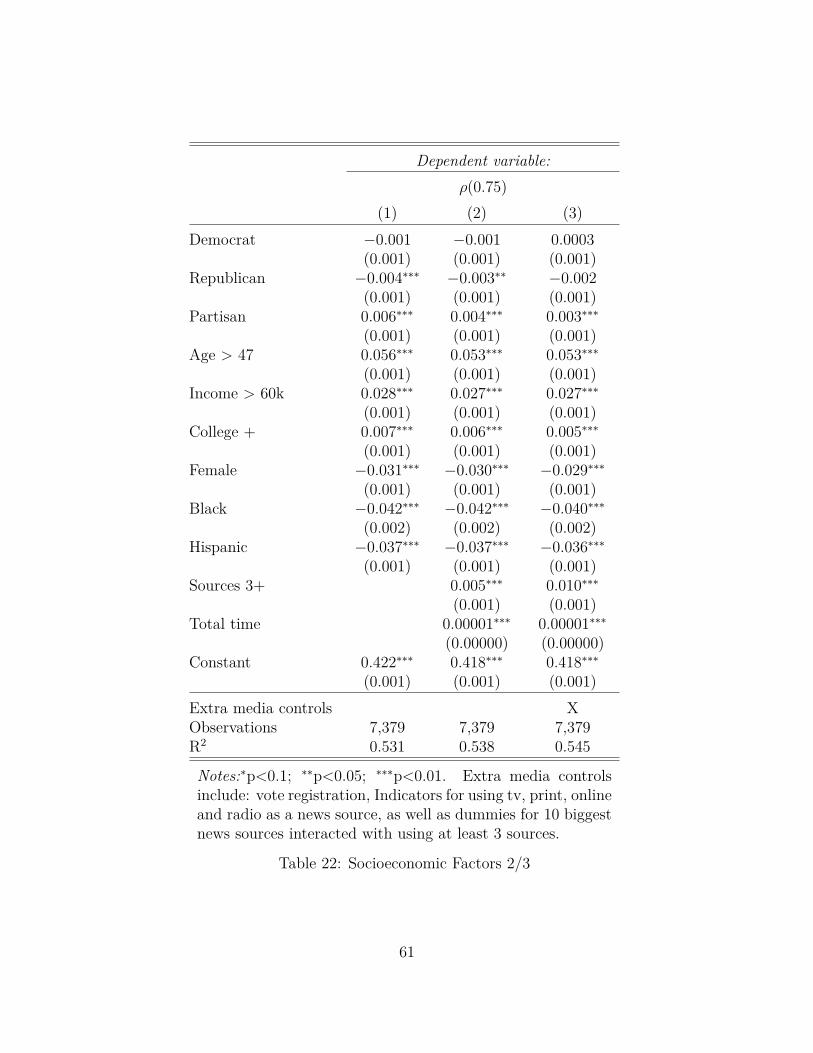
Dependent variable:ρ(0.75)
(1) (2) (3)Democrat −0.001 −0.001 0.0003
(0.001) (0.001) (0.001)Republican −0.004∗∗∗ −0.003∗∗ −0.002
(0.001) (0.001) (0.001)Partisan 0.006∗∗∗ 0.004∗∗∗ 0.003∗∗∗
(0.001) (0.001) (0.001)Age > 47 0.056∗∗∗ 0.053∗∗∗ 0.053∗∗∗
(0.001) (0.001) (0.001)Income > 60k 0.028∗∗∗ 0.027∗∗∗ 0.027∗∗∗
(0.001) (0.001) (0.001)College + 0.007∗∗∗ 0.006∗∗∗ 0.005∗∗∗
(0.001) (0.001) (0.001)Female −0.031∗∗∗ −0.030∗∗∗ −0.029∗∗∗
(0.001) (0.001) (0.001)Black −0.042∗∗∗ −0.042∗∗∗ −0.040∗∗∗
(0.002) (0.002) (0.002)Hispanic −0.037∗∗∗ −0.037∗∗∗ −0.036∗∗∗
(0.001) (0.001) (0.001)Sources 3+ 0.005∗∗∗ 0.010∗∗∗
(0.001) (0.001)Total time 0.00001∗∗∗ 0.00001∗∗∗
(0.00000) (0.00000)Constant 0.422∗∗∗ 0.418∗∗∗ 0.418∗∗∗
(0.001) (0.001) (0.001)Extra media controls XObservations 7,379 7,379 7,379R2 0.531 0.538 0.545
Notes:∗p<0.1; ∗∗p<0.05; ∗∗∗p<0.01. Extra media controlsinclude: vote registration, Indicators for using tv, print, onlineand radio as a news source, as well as dummies for 10 biggestnews sources interacted with using at least 3 sources.
Table 22: Socioeconomic Factors 2/3
61
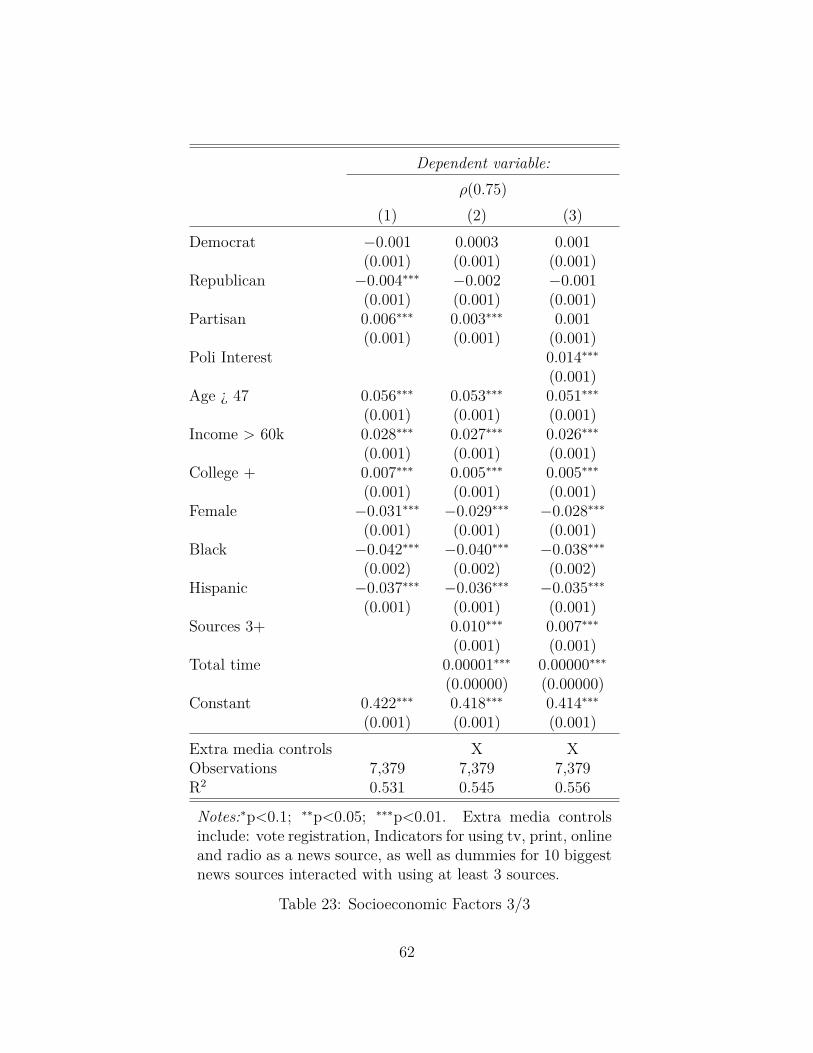
Dependent variable:ρ(0.75)
(1) (2) (3)Democrat −0.001 0.0003 0.001
(0.001) (0.001) (0.001)Republican −0.004∗∗∗ −0.002 −0.001
(0.001) (0.001) (0.001)Partisan 0.006∗∗∗ 0.003∗∗∗ 0.001
(0.001) (0.001) (0.001)Poli Interest 0.014∗∗∗
(0.001)Age ¿ 47 0.056∗∗∗ 0.053∗∗∗ 0.051∗∗∗
(0.001) (0.001) (0.001)Income > 60k 0.028∗∗∗ 0.027∗∗∗ 0.026∗∗∗
(0.001) (0.001) (0.001)College + 0.007∗∗∗ 0.005∗∗∗ 0.005∗∗∗
(0.001) (0.001) (0.001)Female −0.031∗∗∗ −0.029∗∗∗ −0.028∗∗∗
(0.001) (0.001) (0.001)Black −0.042∗∗∗ −0.040∗∗∗ −0.038∗∗∗
(0.002) (0.002) (0.002)Hispanic −0.037∗∗∗ −0.036∗∗∗ −0.035∗∗∗
(0.001) (0.001) (0.001)Sources 3+ 0.010∗∗∗ 0.007∗∗∗
(0.001) (0.001)Total time 0.00001∗∗∗ 0.00000∗∗∗
(0.00000) (0.00000)Constant 0.422∗∗∗ 0.418∗∗∗ 0.414∗∗∗
(0.001) (0.001) (0.001)Extra media controls X XObservations 7,379 7,379 7,379R2 0.531 0.545 0.556
Notes:∗p<0.1; ∗∗p<0.05; ∗∗∗p<0.01. Extra media controlsinclude: vote registration, Indicators for using tv, print, onlineand radio as a news source, as well as dummies for 10 biggestnews sources interacted with using at least 3 sources.
Table 23: Socioeconomic Factors 3/3
62
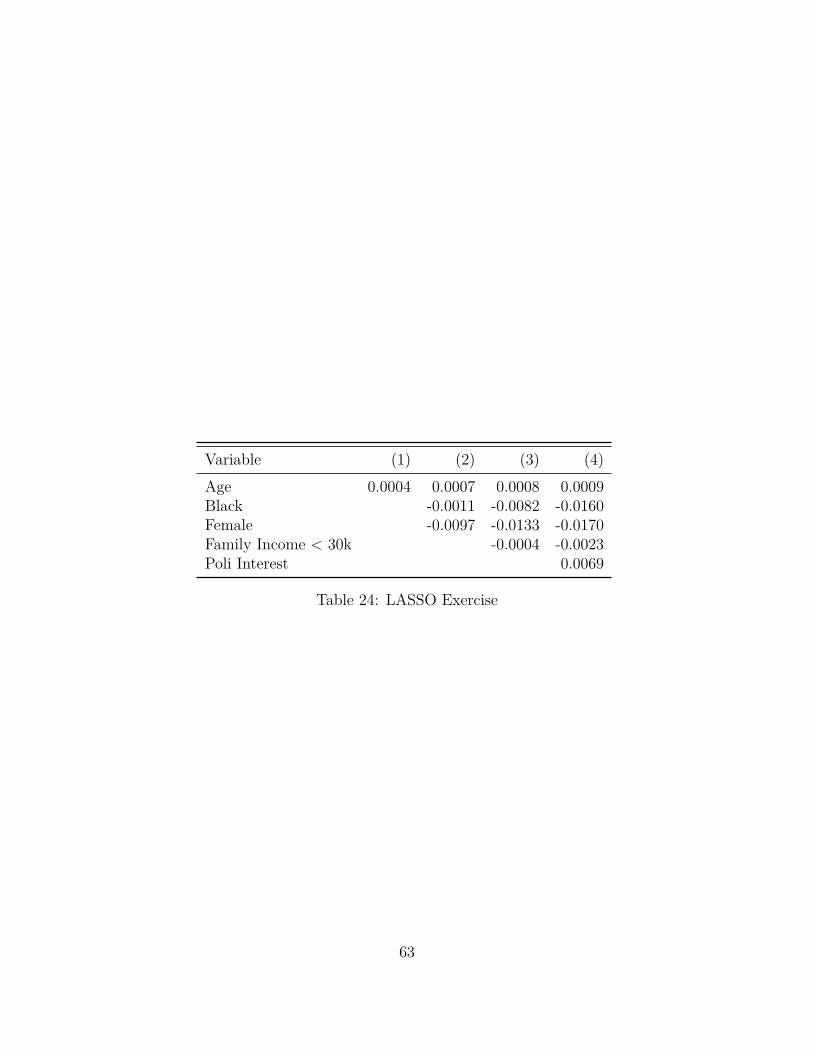
Variable (1) (2) (3) (4)Age 0.0004 0.0007 0.0008 0.0009Black -0.0011 -0.0082 -0.0160Female -0.0097 -0.0133 -0.0170Family Income < 30k -0.0004 -0.0023Poli Interest 0.0069
Table 24: LASSO Exercise
63
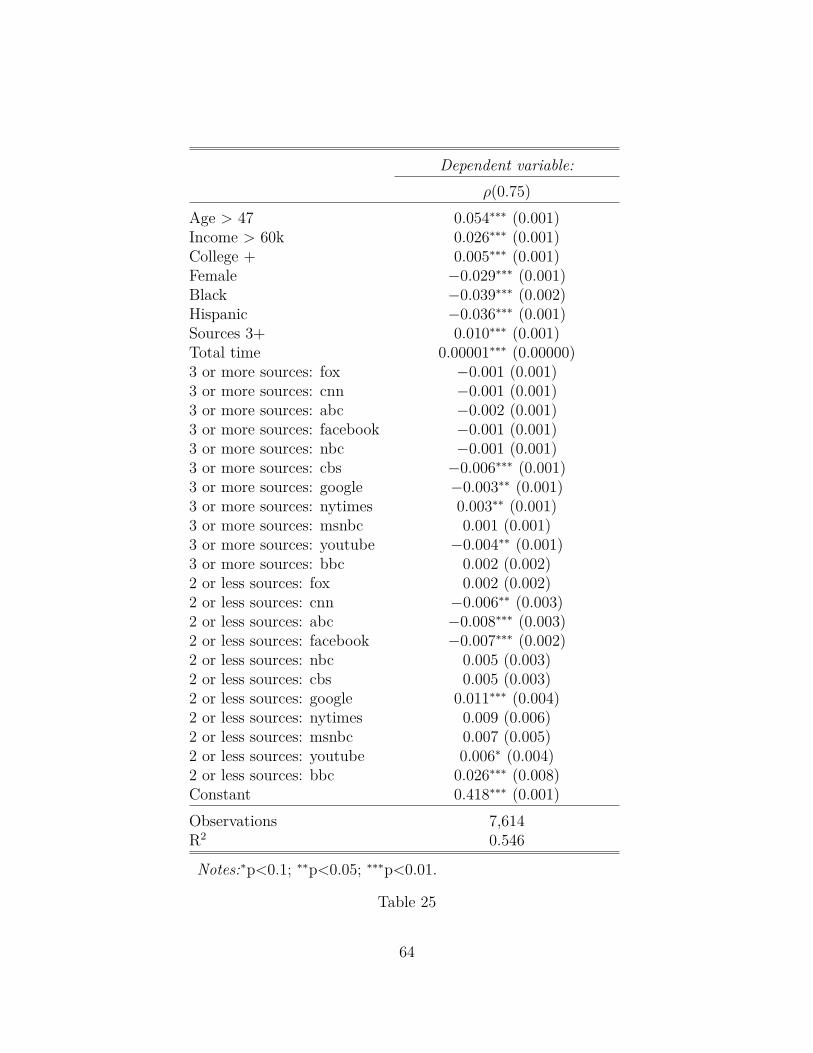
Dependent variable:ρ(0.75)
Age > 47 0.054∗∗∗ (0.001)Income > 60k 0.026∗∗∗ (0.001)College + 0.005∗∗∗ (0.001)Female −0.029∗∗∗ (0.001)Black −0.039∗∗∗ (0.002)Hispanic −0.036∗∗∗ (0.001)Sources 3+ 0.010∗∗∗ (0.001)Total time 0.00001∗∗∗ (0.00000)3 or more sources: fox −0.001 (0.001)3 or more sources: cnn −0.001 (0.001)3 or more sources: abc −0.002 (0.001)3 or more sources: facebook −0.001 (0.001)3 or more sources: nbc −0.001 (0.001)3 or more sources: cbs −0.006∗∗∗ (0.001)3 or more sources: google −0.003∗∗ (0.001)3 or more sources: nytimes 0.003∗∗ (0.001)3 or more sources: msnbc 0.001 (0.001)3 or more sources: youtube −0.004∗∗ (0.001)3 or more sources: bbc 0.002 (0.002)2 or less sources: fox 0.002 (0.002)2 or less sources: cnn −0.006∗∗ (0.003)2 or less sources: abc −0.008∗∗∗ (0.003)2 or less sources: facebook −0.007∗∗∗ (0.002)2 or less sources: nbc 0.005 (0.003)2 or less sources: cbs 0.005 (0.003)2 or less sources: google 0.011∗∗∗ (0.004)2 or less sources: nytimes 0.009 (0.006)2 or less sources: msnbc 0.007 (0.005)2 or less sources: youtube 0.006∗ (0.004)2 or less sources: bbc 0.026∗∗∗ (0.008)Constant 0.418∗∗∗ (0.001)Observations 7,614R2 0.546
Notes:∗p<0.1; ∗∗p<0.05; ∗∗∗p<0.01.
Table 25
64
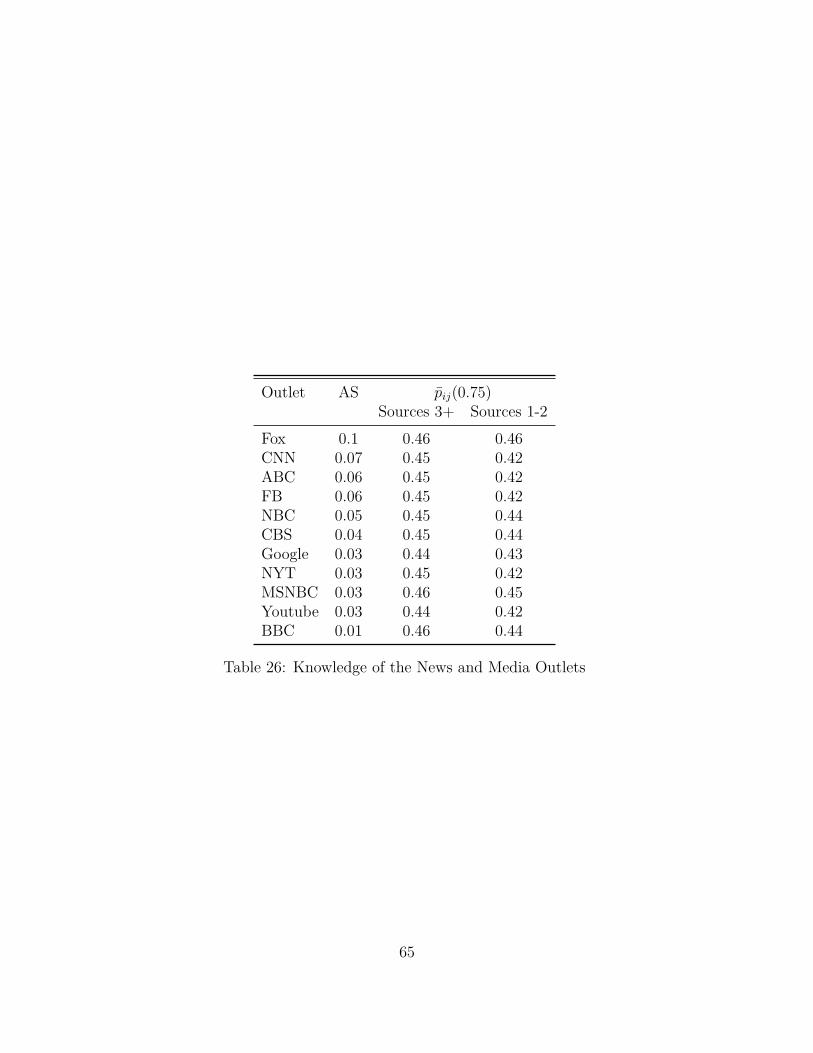
Outlet AS pij(0.75)Sources 3+ Sources 1-2
Fox 0.1 0.46 0.46CNN 0.07 0.45 0.42ABC 0.06 0.45 0.42FB 0.06 0.45 0.42NBC 0.05 0.45 0.44CBS 0.04 0.45 0.44Google 0.03 0.44 0.43NYT 0.03 0.45 0.42MSNBC 0.03 0.46 0.45Youtube 0.03 0.44 0.42BBC 0.01 0.46 0.44
Table 26: Knowledge of the News and Media Outlets
65
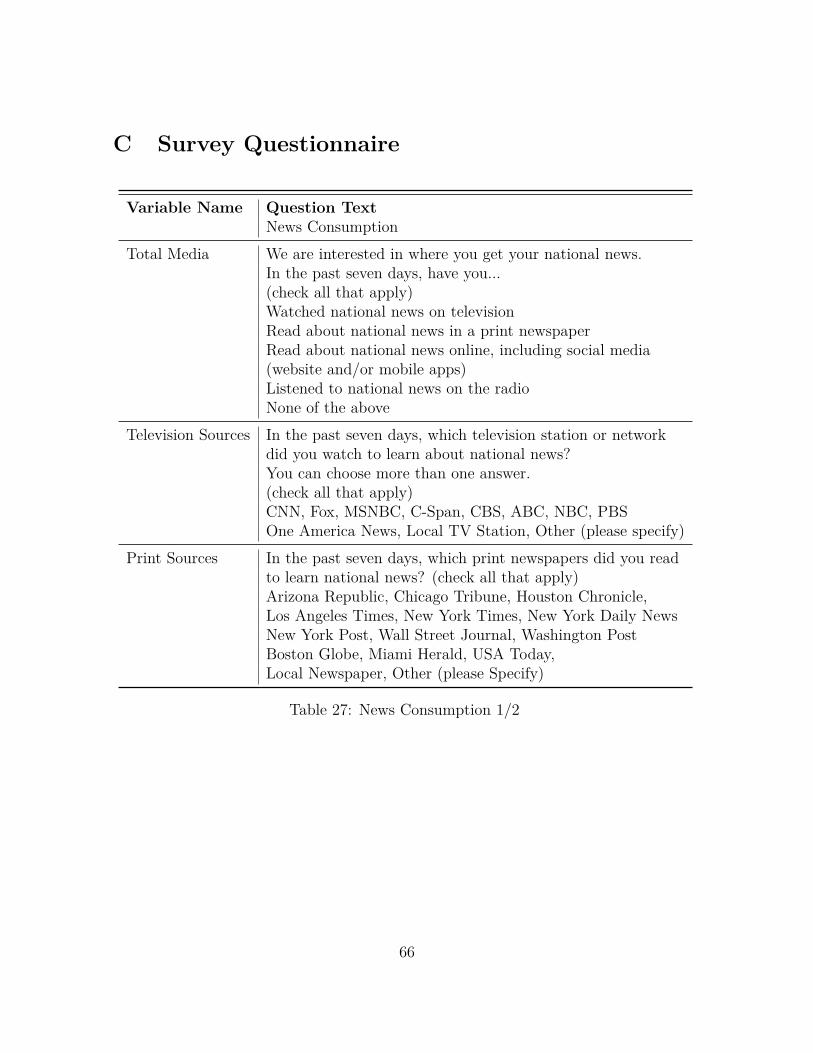
C Survey Questionnaire
Variable Name Question TextNews Consumption
Total Media We are interested in where you get your national news.In the past seven days, have you...(check all that apply)Watched national news on televisionRead about national news in a print newspaperRead about national news online, including social media(website and/or mobile apps)Listened to national news on the radioNone of the above
Television Sources In the past seven days, which television station or networkdid you watch to learn about national news?You can choose more than one answer.(check all that apply)CNN, Fox, MSNBC, C-Span, CBS, ABC, NBC, PBSOne America News, Local TV Station, Other (please specify)
Print Sources In the past seven days, which print newspapers did you readto learn national news? (check all that apply)Arizona Republic, Chicago Tribune, Houston Chronicle,Los Angeles Times, New York Times, New York Daily NewsNew York Post, Wall Street Journal, Washington PostBoston Globe, Miami Herald, USA Today,Local Newspaper, Other (please Specify)
Table 27: News Consumption 1/2
66
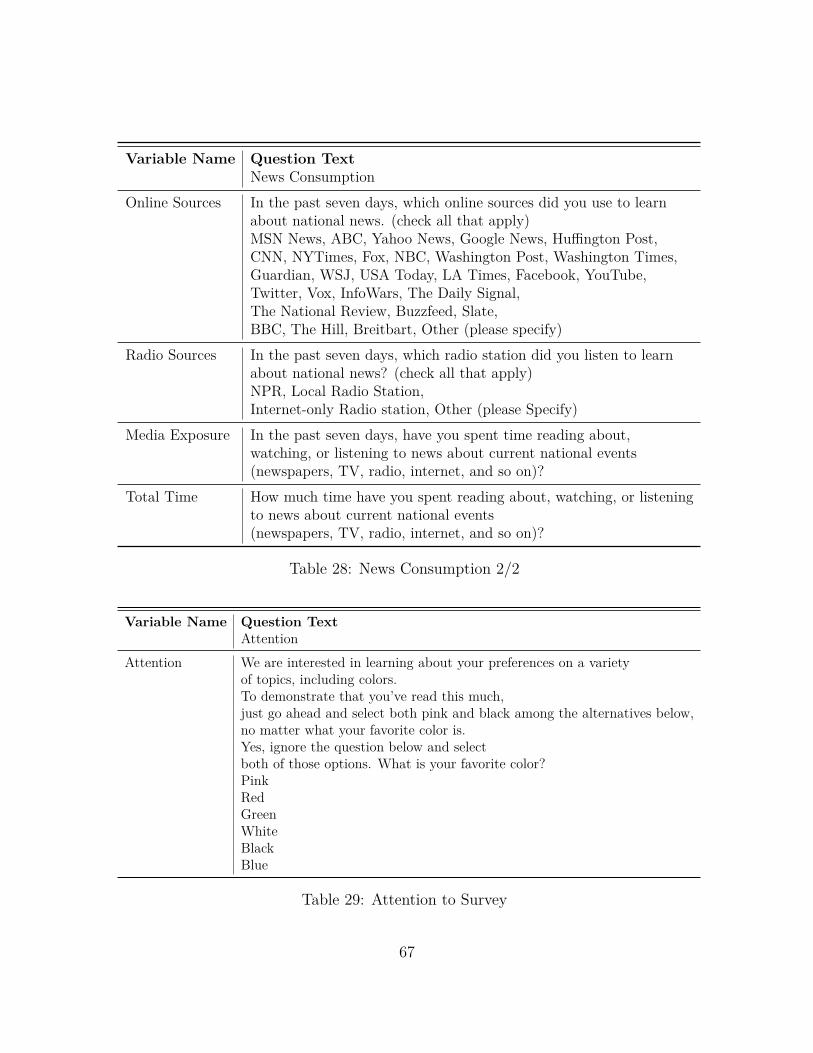
Variable Name Question TextNews Consumption
Online Sources In the past seven days, which online sources did you use to learnabout national news. (check all that apply)MSN News, ABC, Yahoo News, Google News, Huffington Post,CNN, NYTimes, Fox, NBC, Washington Post, Washington Times,Guardian, WSJ, USA Today, LA Times, Facebook, YouTube,Twitter, Vox, InfoWars, The Daily Signal,The National Review, Buzzfeed, Slate,BBC, The Hill, Breitbart, Other (please specify)
Radio Sources In the past seven days, which radio station did you listen to learnabout national news? (check all that apply)NPR, Local Radio Station,Internet-only Radio station, Other (please Specify)
Media Exposure In the past seven days, have you spent time reading about,watching, or listening to news about current national events(newspapers, TV, radio, internet, and so on)?
Total Time How much time have you spent reading about, watching, or listeningto news about current national events(newspapers, TV, radio, internet, and so on)?
Table 28: News Consumption 2/2
Variable Name Question TextAttention
Attention We are interested in learning about your preferences on a varietyof topics, including colors.To demonstrate that you’ve read this much,just go ahead and select both pink and black among the alternatives below,no matter what your favorite color is.Yes, ignore the question below and selectboth of those options. What is your favorite color?PinkRedGreenWhiteBlackBlue
Table 29: Attention to Survey
67
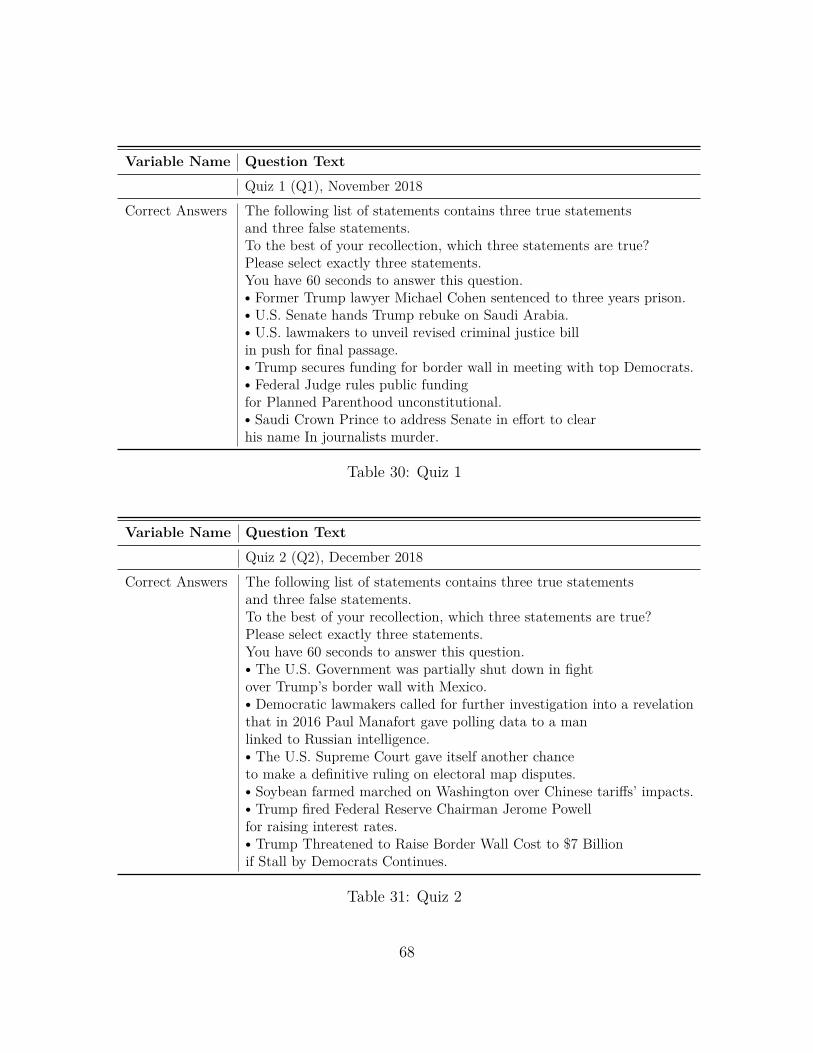
Variable Name Question Text
Quiz 1 (Q1), November 2018Correct Answers The following list of statements contains three true statements
and three false statements.To the best of your recollection, which three statements are true?Please select exactly three statements.You have 60 seconds to answer this question.• Former Trump lawyer Michael Cohen sentenced to three years prison.• U.S. Senate hands Trump rebuke on Saudi Arabia.• U.S. lawmakers to unveil revised criminal justice billin push for final passage.• Trump secures funding for border wall in meeting with top Democrats.• Federal Judge rules public fundingfor Planned Parenthood unconstitutional.• Saudi Crown Prince to address Senate in effort to clearhis name In journalists murder.
Table 30: Quiz 1
Variable Name Question Text
Quiz 2 (Q2), December 2018Correct Answers The following list of statements contains three true statements
and three false statements.To the best of your recollection, which three statements are true?Please select exactly three statements.You have 60 seconds to answer this question.• The U.S. Government was partially shut down in fightover Trump’s border wall with Mexico.• Democratic lawmakers called for further investigation into a revelationthat in 2016 Paul Manafort gave polling data to a manlinked to Russian intelligence.• The U.S. Supreme Court gave itself another chanceto make a definitive ruling on electoral map disputes.• Soybean farmed marched on Washington over Chinese tariffs’ impacts.• Trump fired Federal Reserve Chairman Jerome Powellfor raising interest rates.• Trump Threatened to Raise Border Wall Cost to $7 Billionif Stall by Democrats Continues.
Table 31: Quiz 2
68
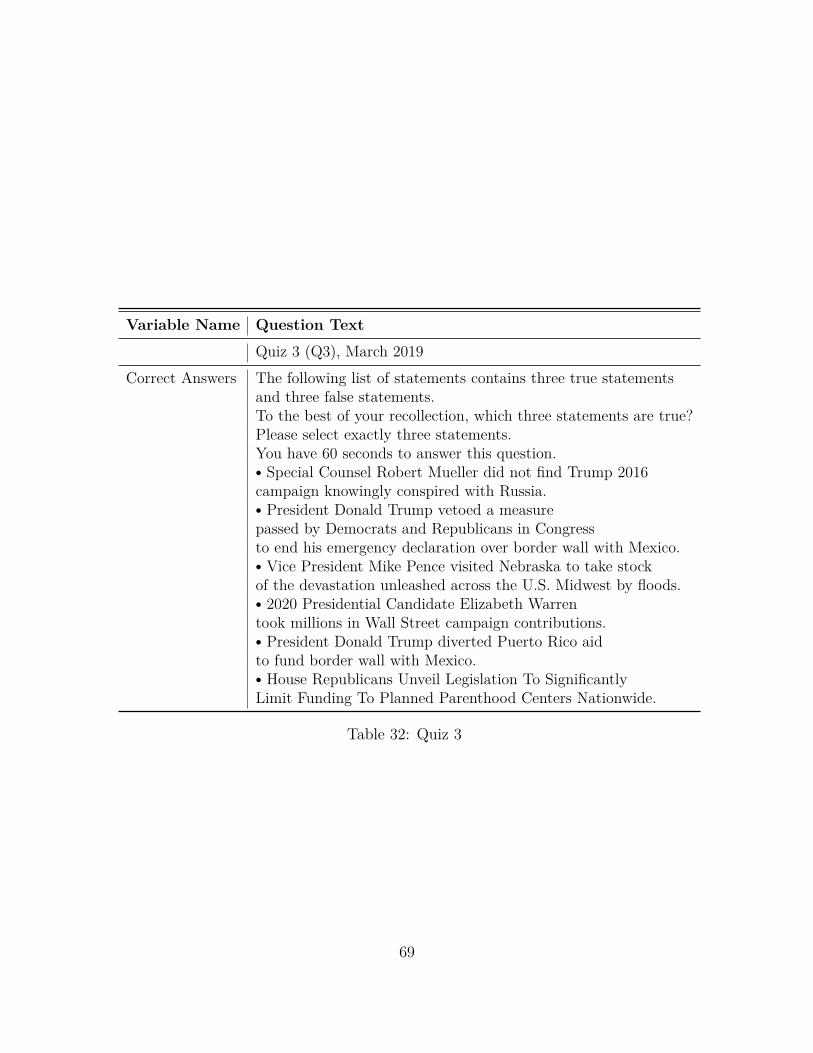
Variable Name Question Text
Quiz 3 (Q3), March 2019Correct Answers The following list of statements contains three true statements
and three false statements.To the best of your recollection, which three statements are true?Please select exactly three statements.You have 60 seconds to answer this question.• Special Counsel Robert Mueller did not find Trump 2016campaign knowingly conspired with Russia.• President Donald Trump vetoed a measurepassed by Democrats and Republicans in Congressto end his emergency declaration over border wall with Mexico.• Vice President Mike Pence visited Nebraska to take stockof the devastation unleashed across the U.S. Midwest by floods.• 2020 Presidential Candidate Elizabeth Warrentook millions in Wall Street campaign contributions.• President Donald Trump diverted Puerto Rico aidto fund border wall with Mexico.• House Republicans Unveil Legislation To SignificantlyLimit Funding To Planned Parenthood Centers Nationwide.
Table 32: Quiz 3
69
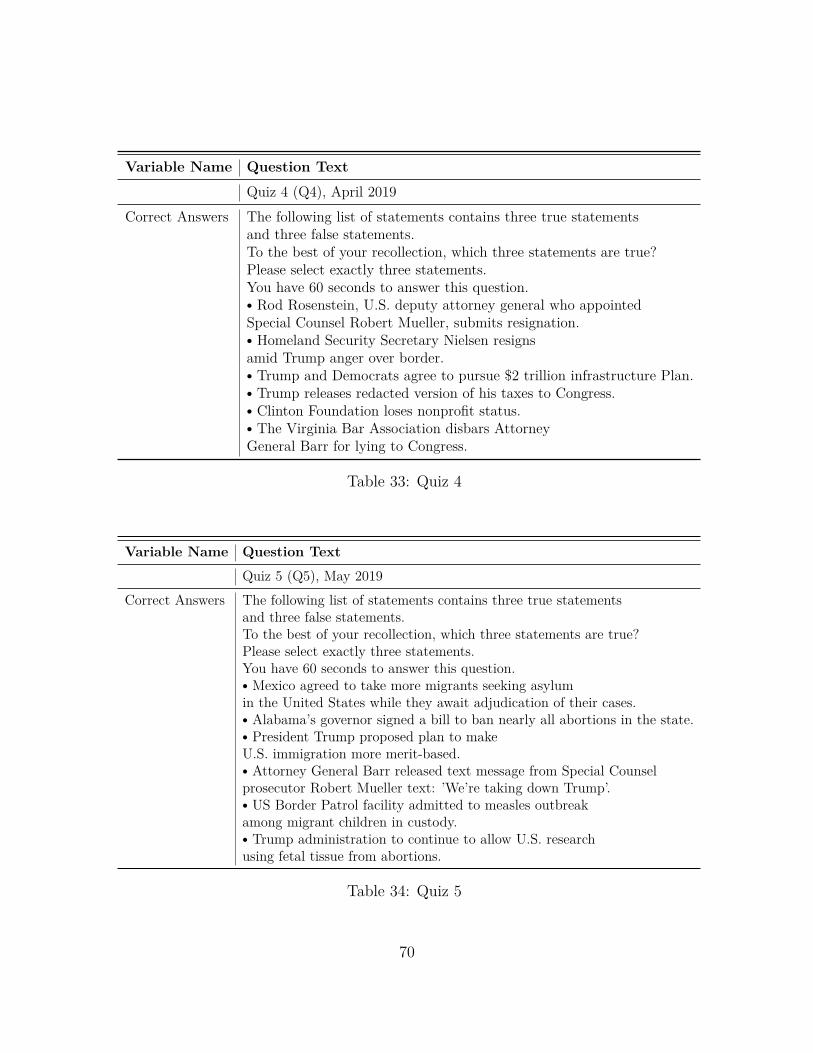
Variable Name Question Text
Quiz 4 (Q4), April 2019Correct Answers The following list of statements contains three true statements
and three false statements.To the best of your recollection, which three statements are true?Please select exactly three statements.You have 60 seconds to answer this question.• Rod Rosenstein, U.S. deputy attorney general who appointedSpecial Counsel Robert Mueller, submits resignation.• Homeland Security Secretary Nielsen resignsamid Trump anger over border.• Trump and Democrats agree to pursue $2 trillion infrastructure Plan.• Trump releases redacted version of his taxes to Congress.• Clinton Foundation loses nonprofit status.• The Virginia Bar Association disbars AttorneyGeneral Barr for lying to Congress.
Table 33: Quiz 4
Variable Name Question Text
Quiz 5 (Q5), May 2019Correct Answers The following list of statements contains three true statements
and three false statements.To the best of your recollection, which three statements are true?Please select exactly three statements.You have 60 seconds to answer this question.• Mexico agreed to take more migrants seeking asylumin the United States while they await adjudication of their cases.• Alabama’s governor signed a bill to ban nearly all abortions in the state.• President Trump proposed plan to makeU.S. immigration more merit-based.• Attorney General Barr released text message from Special Counselprosecutor Robert Mueller text: ’We’re taking down Trump’.• US Border Patrol facility admitted to measles outbreakamong migrant children in custody.• Trump administration to continue to allow U.S. researchusing fetal tissue from abortions.
Table 34: Quiz 5
70
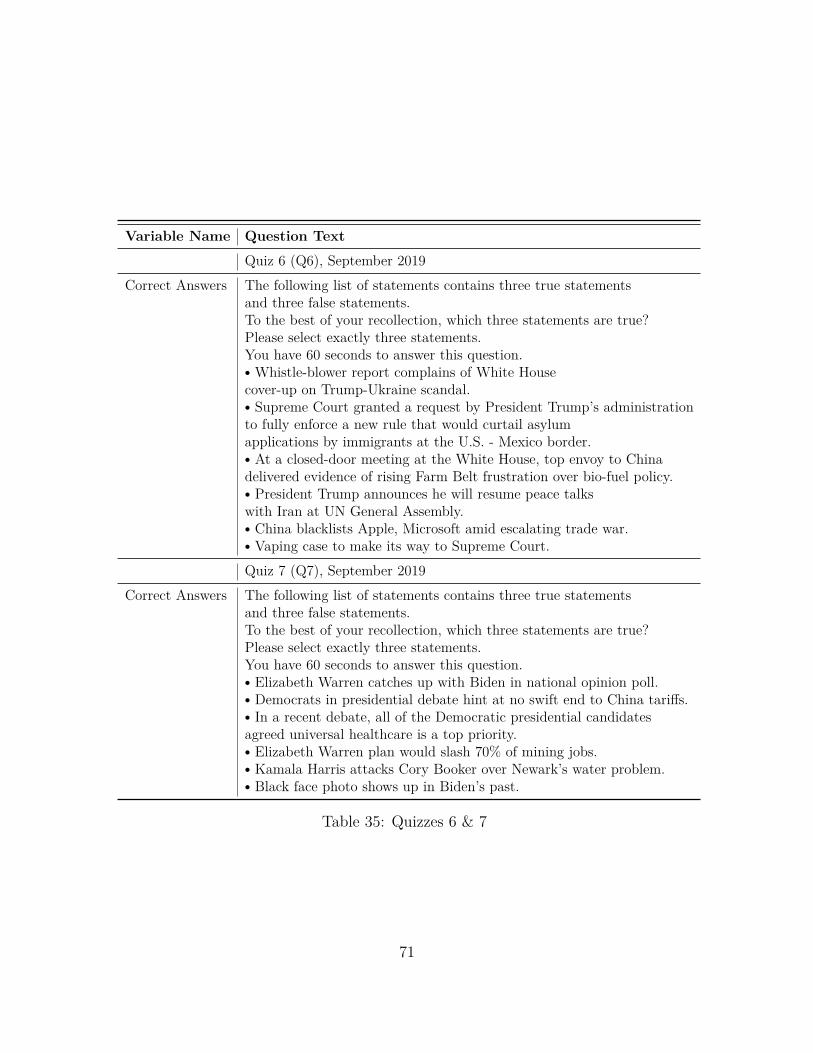
Variable Name Question Text
Quiz 6 (Q6), September 2019Correct Answers The following list of statements contains three true statements
and three false statements.To the best of your recollection, which three statements are true?Please select exactly three statements.You have 60 seconds to answer this question.• Whistle-blower report complains of White Housecover-up on Trump-Ukraine scandal.• Supreme Court granted a request by President Trump’s administrationto fully enforce a new rule that would curtail asylumapplications by immigrants at the U.S. - Mexico border.• At a closed-door meeting at the White House, top envoy to Chinadelivered evidence of rising Farm Belt frustration over bio-fuel policy.• President Trump announces he will resume peace talkswith Iran at UN General Assembly.• China blacklists Apple, Microsoft amid escalating trade war.• Vaping case to make its way to Supreme Court.Quiz 7 (Q7), September 2019
Correct Answers The following list of statements contains three true statementsand three false statements.To the best of your recollection, which three statements are true?Please select exactly three statements.You have 60 seconds to answer this question.• Elizabeth Warren catches up with Biden in national opinion poll.• Democrats in presidential debate hint at no swift end to China tariffs.• In a recent debate, all of the Democratic presidential candidatesagreed universal healthcare is a top priority.• Elizabeth Warren plan would slash 70% of mining jobs.• Kamala Harris attacks Cory Booker over Newark’s water problem.• Black face photo shows up in Biden’s past.
Table 35: Quizzes 6 & 7
71
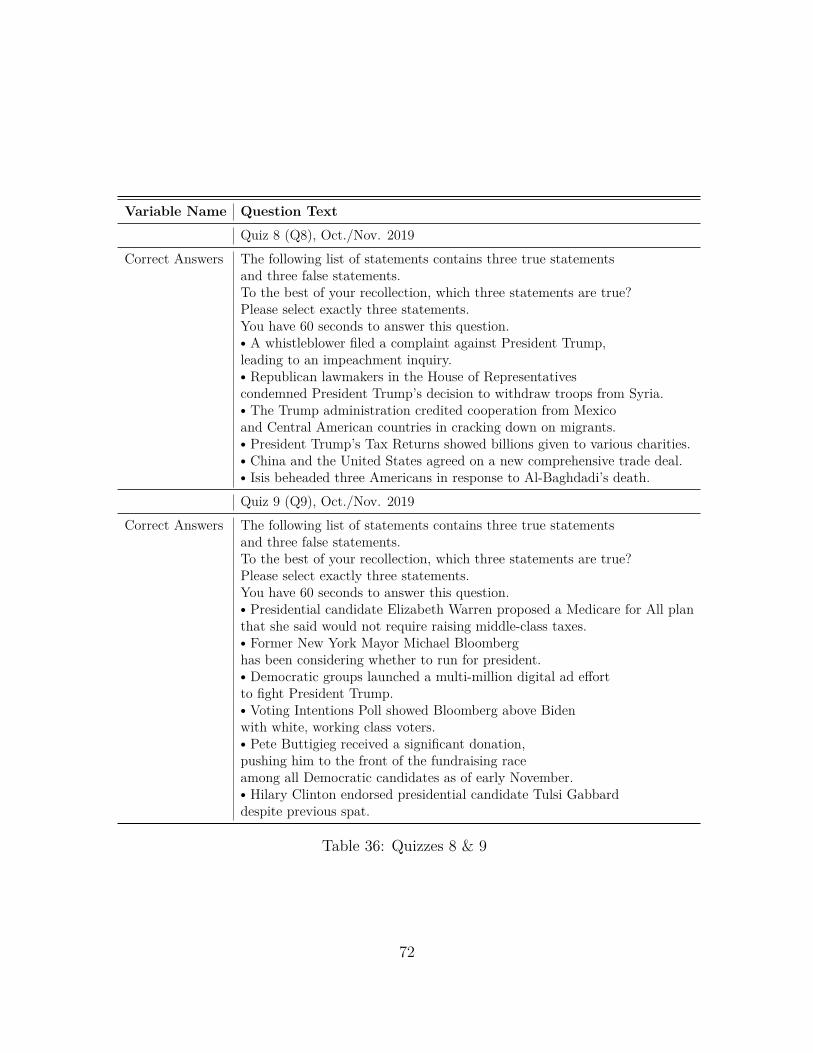
Variable Name Question Text
Quiz 8 (Q8), Oct./Nov. 2019Correct Answers The following list of statements contains three true statements
and three false statements.To the best of your recollection, which three statements are true?Please select exactly three statements.You have 60 seconds to answer this question.• A whistleblower filed a complaint against President Trump,leading to an impeachment inquiry.• Republican lawmakers in the House of Representativescondemned President Trump’s decision to withdraw troops from Syria.• The Trump administration credited cooperation from Mexicoand Central American countries in cracking down on migrants.• President Trump’s Tax Returns showed billions given to various charities.• China and the United States agreed on a new comprehensive trade deal.• Isis beheaded three Americans in response to Al-Baghdadi’s death.Quiz 9 (Q9), Oct./Nov. 2019
Correct Answers The following list of statements contains three true statementsand three false statements.To the best of your recollection, which three statements are true?Please select exactly three statements.You have 60 seconds to answer this question.• Presidential candidate Elizabeth Warren proposed a Medicare for All planthat she said would not require raising middle-class taxes.• Former New York Mayor Michael Bloomberghas been considering whether to run for president.• Democratic groups launched a multi-million digital ad effortto fight President Trump.• Voting Intentions Poll showed Bloomberg above Bidenwith white, working class voters.• Pete Buttigieg received a significant donation,pushing him to the front of the fundraising raceamong all Democratic candidates as of early November.• Hilary Clinton endorsed presidential candidate Tulsi Gabbarddespite previous spat.
Table 36: Quizzes 8 & 9
72
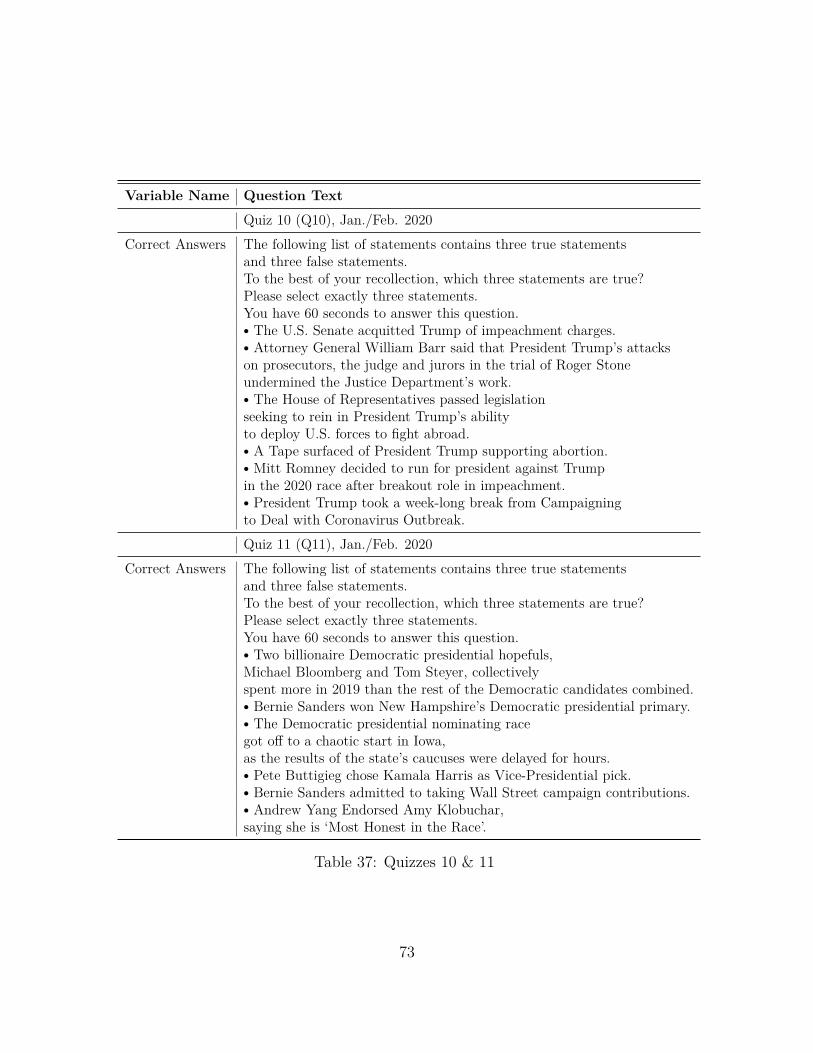
Variable Name Question Text
Quiz 10 (Q10), Jan./Feb. 2020Correct Answers The following list of statements contains three true statements
and three false statements.To the best of your recollection, which three statements are true?Please select exactly three statements.You have 60 seconds to answer this question.• The U.S. Senate acquitted Trump of impeachment charges.• Attorney General William Barr said that President Trump’s attackson prosecutors, the judge and jurors in the trial of Roger Stoneundermined the Justice Department’s work.• The House of Representatives passed legislationseeking to rein in President Trump’s abilityto deploy U.S. forces to fight abroad.• A Tape surfaced of President Trump supporting abortion.• Mitt Romney decided to run for president against Trumpin the 2020 race after breakout role in impeachment.• President Trump took a week-long break from Campaigningto Deal with Coronavirus Outbreak.Quiz 11 (Q11), Jan./Feb. 2020
Correct Answers The following list of statements contains three true statementsand three false statements.To the best of your recollection, which three statements are true?Please select exactly three statements.You have 60 seconds to answer this question.• Two billionaire Democratic presidential hopefuls,Michael Bloomberg and Tom Steyer, collectivelyspent more in 2019 than the rest of the Democratic candidates combined.• Bernie Sanders won New Hampshire’s Democratic presidential primary.• The Democratic presidential nominating racegot off to a chaotic start in Iowa,as the results of the state’s caucuses were delayed for hours.• Pete Buttigieg chose Kamala Harris as Vice-Presidential pick.• Bernie Sanders admitted to taking Wall Street campaign contributions.• Andrew Yang Endorsed Amy Klobuchar,saying she is ‘Most Honest in the Race’.
Table 37: Quizzes 10 & 11
73
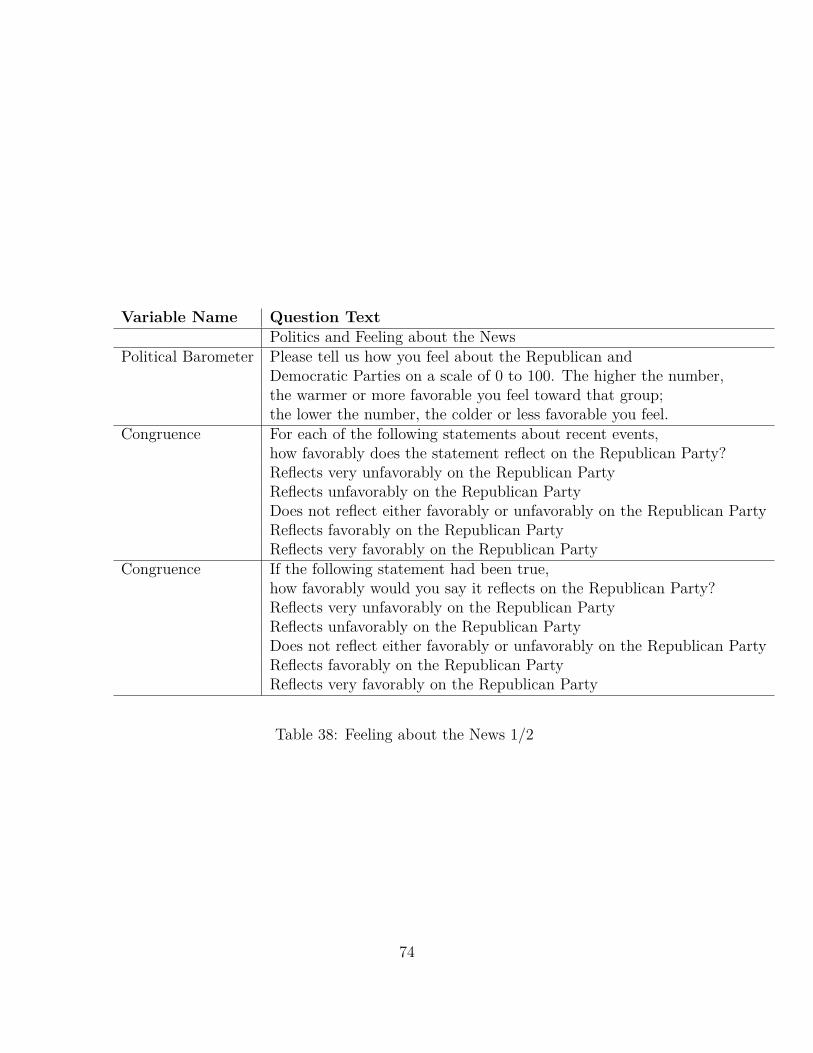
Variable Name Question TextPolitics and Feeling about the News
Political Barometer Please tell us how you feel about the Republican andDemocratic Parties on a scale of 0 to 100. The higher the number,the warmer or more favorable you feel toward that group;the lower the number, the colder or less favorable you feel.
Congruence For each of the following statements about recent events,how favorably does the statement reflect on the Republican Party?Reflects very unfavorably on the Republican PartyReflects unfavorably on the Republican PartyDoes not reflect either favorably or unfavorably on the Republican PartyReflects favorably on the Republican PartyReflects very favorably on the Republican Party
Congruence If the following statement had been true,how favorably would you say it reflects on the Republican Party?Reflects very unfavorably on the Republican PartyReflects unfavorably on the Republican PartyDoes not reflect either favorably or unfavorably on the Republican PartyReflects favorably on the Republican PartyReflects very favorably on the Republican Party
Table 38: Feeling about the News 1/2
74
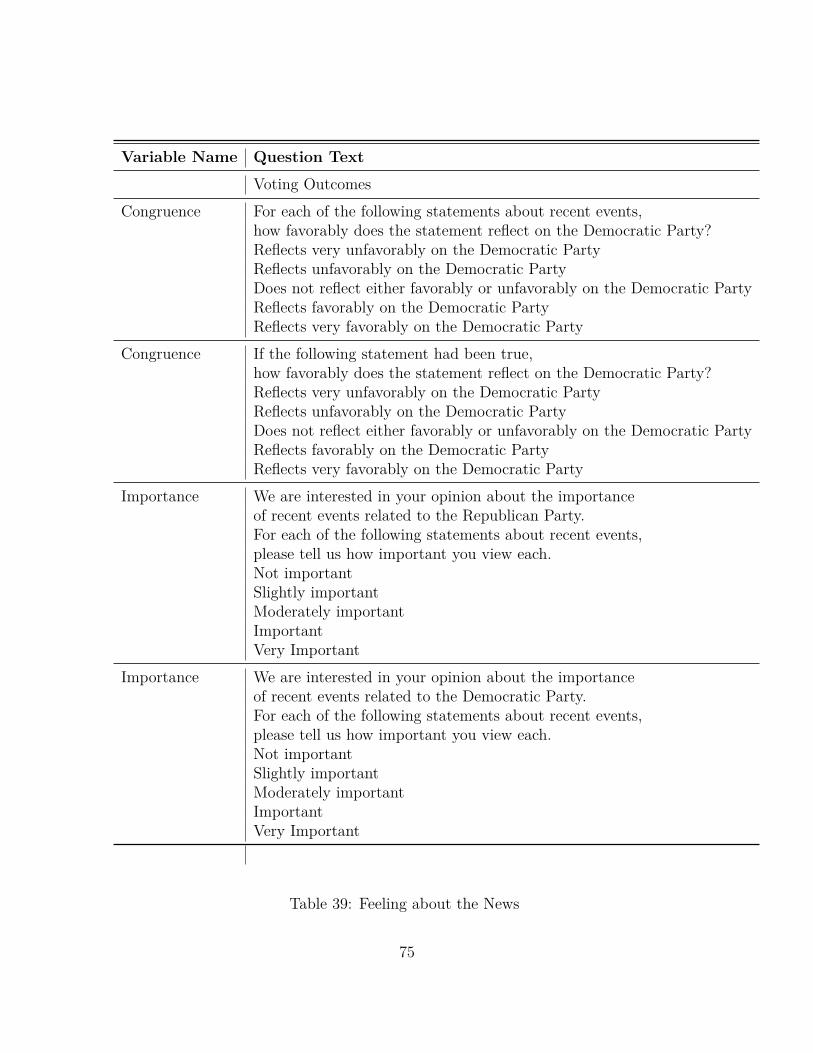
Variable Name Question Text
Voting OutcomesCongruence For each of the following statements about recent events,
how favorably does the statement reflect on the Democratic Party?Reflects very unfavorably on the Democratic PartyReflects unfavorably on the Democratic PartyDoes not reflect either favorably or unfavorably on the Democratic PartyReflects favorably on the Democratic PartyReflects very favorably on the Democratic Party
Congruence If the following statement had been true,how favorably does the statement reflect on the Democratic Party?Reflects very unfavorably on the Democratic PartyReflects unfavorably on the Democratic PartyDoes not reflect either favorably or unfavorably on the Democratic PartyReflects favorably on the Democratic PartyReflects very favorably on the Democratic Party
Importance We are interested in your opinion about the importanceof recent events related to the Republican Party.For each of the following statements about recent events,please tell us how important you view each.Not importantSlightly importantModerately importantImportantVery Important
Importance We are interested in your opinion about the importanceof recent events related to the Democratic Party.For each of the following statements about recent events,please tell us how important you view each.Not importantSlightly importantModerately importantImportantVery Important
Table 39: Feeling about the News
75
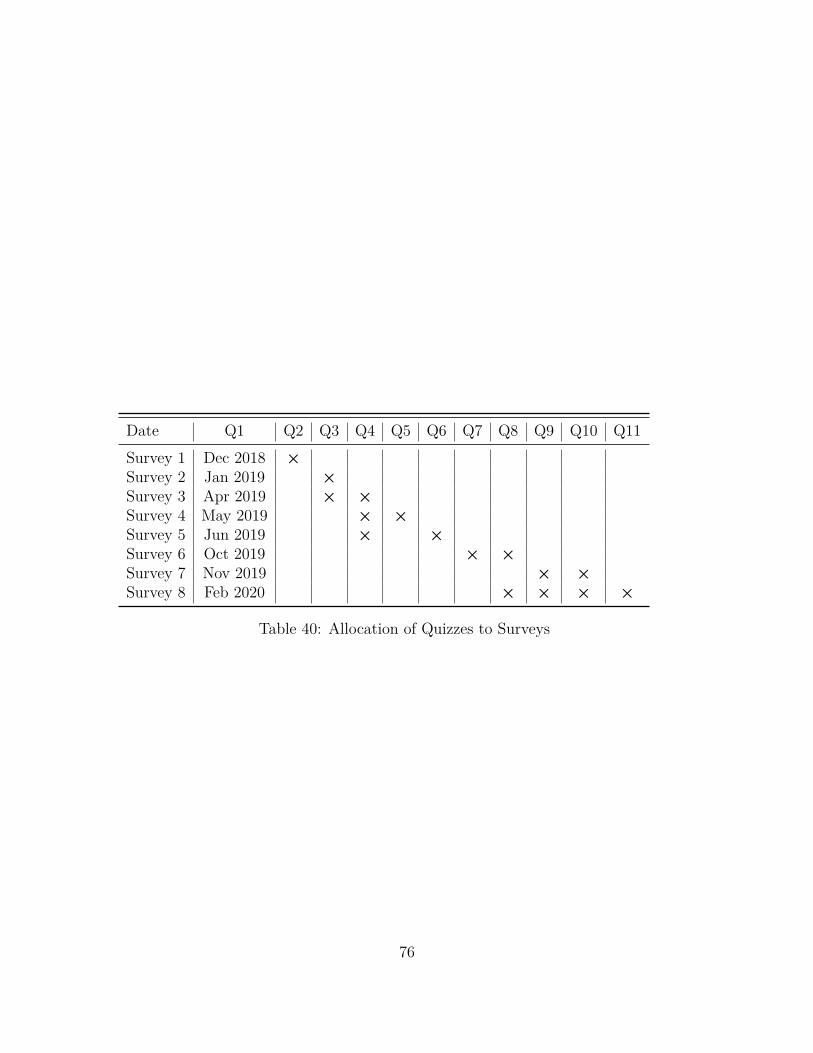
Date Q1 Q2 Q3 Q4 Q5 Q6 Q7 Q8 Q9 Q10 Q11Survey 1 Dec 2018 ×Survey 2 Jan 2019 ×Survey 3 Apr 2019 × ×Survey 4 May 2019 × ×Survey 5 Jun 2019 × ×Survey 6 Oct 2019 × ×Survey 7 Nov 2019 × ×Survey 8 Feb 2020 × × × ×
Table 40: Allocation of Quizzes to Surveys
76