Embed Size (px)
Citation preview
Meat Packing and Processing Facilities in the Non-Metropolitan Midwest: Blessing or Curse?
Georgeanne M. Artza, Peter F. Orazemab and Daniel M. Ottoa aIowa State University
bKoch Visiting Professor of Business Economics, University of Kansas School of Business
Selected Paper prepared for presentation at the American Agricultural Economics Association Annual Meeting, Providence, Rhode Island, July 24-27, 2005
Abstract
Growth in the meat packing and processing industry in the Midwestern United States has generated a significant amount of debate regarding the costs and benefits of this type of economic development. This research employs 1990-2000 proprietary data from the Bureau of Labor Statistics’ Longitudinal Database (LDB) to investigate the effects of this industry on social and economic outcomes in non-metropolitan counties of twelve Midwestern states. The empirical specification uses a difference-in-differences specification to measure the effect of industry growth on local economic growth, government expenditures, and crime. Propensity score matching is used as a check on possible non-random placement of meat packing and processing plants. Results suggest that as the meat packing industry’s share of a county’s total employment and wage bill rises, total employment growth increases. However, employment growth in other sectors slows, as does local wage growth. There is some evidence that slower wage growth swamps the employment growth so that aggregate income grows more slowly. We find no evidence that growth in the industry changes the growth rates for crime or government spending.
Copyright 2005 by Artz, Orazem and Otto. All rights reserved. Readers may make verbatim copies of this document for non-commercial purposes by any means, provided that this copyright notice appears on all such copies. This research was conducted with restricted access to Bureau of Labor Statistics (BLS) data on-site at BLS. The views expressed here are those of the authors and do not necessarily reflect the views of the BLS.
2
Meat packing and processing facilities have a prominent, yet controversial presence in
the Midwestern United States. On the one hand, attracting agricultural processing facilities is an
increasingly popular strategy for rural communities since it is viewed as a good fit for
agriculturally dependent regions. The industry is an important provider of entry-level
opportunities for low-skilled labor and new immigrants to the country and the region. New
facilities may provide expanded job opportunities, supplemental income for farm families,
increased public revenues, and stimulus for further development in other sectors such as retail
trade and service industries (Leistritz and Sell, 2001; Drabenstott, et al, 1999). On the other hand,
the expansion of large-scale meat processing facilities generates concerns about the potential
impacts on the host communities. Opponents fear environmental damage to air and water
quality, the inconvenience of bilingual commerce, higher levels of crime, increased welfare
loads, and heavier burdens on public services such as schools or low-income housing.
An example of the controversy surrounding the siting of a new plant is the 1999 attempt
by Excel Corporation and the Iowa Cattlemen’s Association to locate a beef packing plant in
Iowa. The proposed plant was expected to be a state-of-the-art facility, employing 1,000
workers and processing 500,000 head of cattle per year. As potential locations for the plant were
named, local residents were quick to voice their opposition to the plant. In Pleasant Hill, Iowa,
residents organized anti-packing plant meetings even before the company announced proposed
locations (Des Moines Register, April 4, 2000). In Cambridge, Iowa, citizens posted roadside
signs opposing the plant and turned out in force to voice their concerns about the plant in a town
meeting later described in the Des Moines Register as “ugly” (August 6, 2000). Shortly
thereafter, the county supervisors refused to support the proposal. At the same time, supervisors
in Hardin County, another named prospective location, voted unanimously to oppose hosting the
3
plant, citing concerns about the existing infrastructure’s ability to support the large facility.
Given this opposition to the plant, Excel Corporation and the Iowa Cattlemen’s Association put
the project on hold. It was later abandoned in 2003 when the Cattlemen’s Association decided
instead to renovate a closed plant in Tama, Iowa.
The debate over the impact (good or bad) of livestock packing and processing plants on
their host communities is largely informed by journalistic accounts. For example, in the 2001
bestseller Fast Food Nation, Eric Schlosser paints a grim description of the effects of a new
meatpacking plant on Lexington, Nebraska:
In 1990, IBP opened a slaughterhouse in Lexington. A year later, the town, with a population of roughly seven thousand, had the highest crime rate in the state of Nebraska. Within a decade, the number of serious crimes doubled; the number of Medicaid cases nearly doubled; Lexington became a major distribution center for illegal drugs; gang members appeared in town and committed drive-by shootings; the majority of Lexington’s white inhabitants moved elsewhere; and the proportion of Latino inhabitants increased more than tenfold, climbing to over 50 percent. (p. 165)
The academic research on this topic consists primarily of case study analyses. These
studies document a variety of social and economic consequences following the opening of large
meat packing plants that may be described as a mixed blessing for host towns. The opening of a
new establishment may increase local demand for animals and feed in the region (Broadway,
1999). The evidence from these studies suggests that host communities experience growth in
employment and payroll, not only in manufacturing, but also in retail and services, yet the job
growth tends to be concentrated in low-paying jobs. In Garden City, Kansas, the per capita
income level and average wage in the area rose in the decade following the opening of a large
packing plant, but not as much as in the rest of the state (Stull and Broadway, 2004). A number
of social problems have been documented in meat packing towns, including increased crime
rates and child abuse cases, increased housing and rental prices due to shortages, and increased
4
strain on social services and the health care system. (Broadway, 1990; Broadway, et al., 1994;
Grey, 1997b). Schools in host communities feel the impacts of the plant through greater
numbers of limited-English proficient students and unstable school enrollments that reflect high
turnover rates at the plant (Grey, 1997a). In addition, there are environmental concerns
regarding odor and ground and water pollution (Hackenberg, 1995).
These studies examine changes in a particular community or set of communities before
and after the opening of plants, but do not provide a frame of reference by comparing the meat
packing towns with similar communities that do not have meat packing or processing facilities.
In addition, they all focus on very large plants, despite the fact that, except for poultry
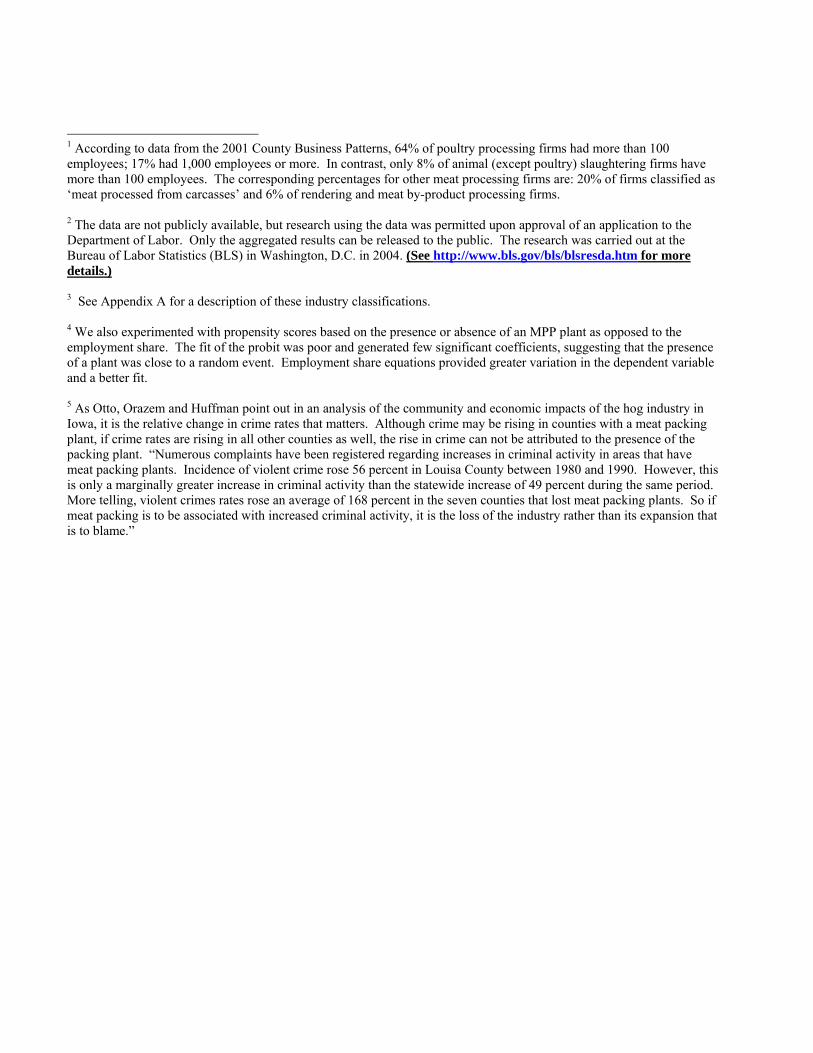
processing, the majority of meat packing and processing firms have fewer than 100 employees
(County Business Patterns, 2001).1
Recent research on whether large plant sitings generate positive and significant net
economic benefits for their host communities is mixed. In a study of new firm locations
employing at least 1,000 workers over the period 1980 to 1989, Fox and Murphy (2004) find
little evidence to suggest that the presence of these large firms affects future employment or
income growth in the local region. Edmiston (2004) examines large plant locations and
expansions in Georgia counties from 1984-1998. His results show that while firm expansions
yield approximately two hundred workers on net for every one hundred new firm employees,
new locations yield a net gain of only 29 workers in the county for every one hundred new firm
employees. In contrast, a study by Greenstone and Moretti (2003) of “million dollar plants”
finds that the opening of a large plant significantly increases the trend in the host county’s total
wage bill. Five years after the plant’s opening, they estimate that the average county wage bill
5
for host counties is nine percent higher due to the new plant. In addition, they find no evidence
that the plant reduces property values or local government spending.
Our focus on meatpacking plants is particularly useful in light of these more general
studies of plant siting effects. Because the acrimony surrounding the siting of meatpacking
plants arguably exceeds that in other sectors, this sector could be viewed as a worst case scenario
for new plant sitings. Secondly, meatpacking represents one of the few sectors that have
expanded manufacturing jobs in rural areas that have otherwise faced slow economic expansion.
Finally, because meatpacking plants are more homogeneous than the variety of manufacturers
analyzed in these previous studies, we have many similar cases to evaluate, and our results are
less likely to be driven by the unique circumstances surrounding the siting of one-of-a-kind
plants. Our concentration on Midwestern nonmetropolitan counties assures that the counties are
of similar size and face similar economic opportunities and challenges.
This research employs longitudinal cross-sectional data on meat packing and processing
facilities from the Bureau of Labor Statistics’ Longitudinal Database (LDB) from 1990 to 2000.2
We compare changes in social and economic indicators in non-metropolitan counties with and
without meat packing and processing jobs. The social and economic outcomes include changes
in county employment, wages and income, as well as changes in county crime rates and local
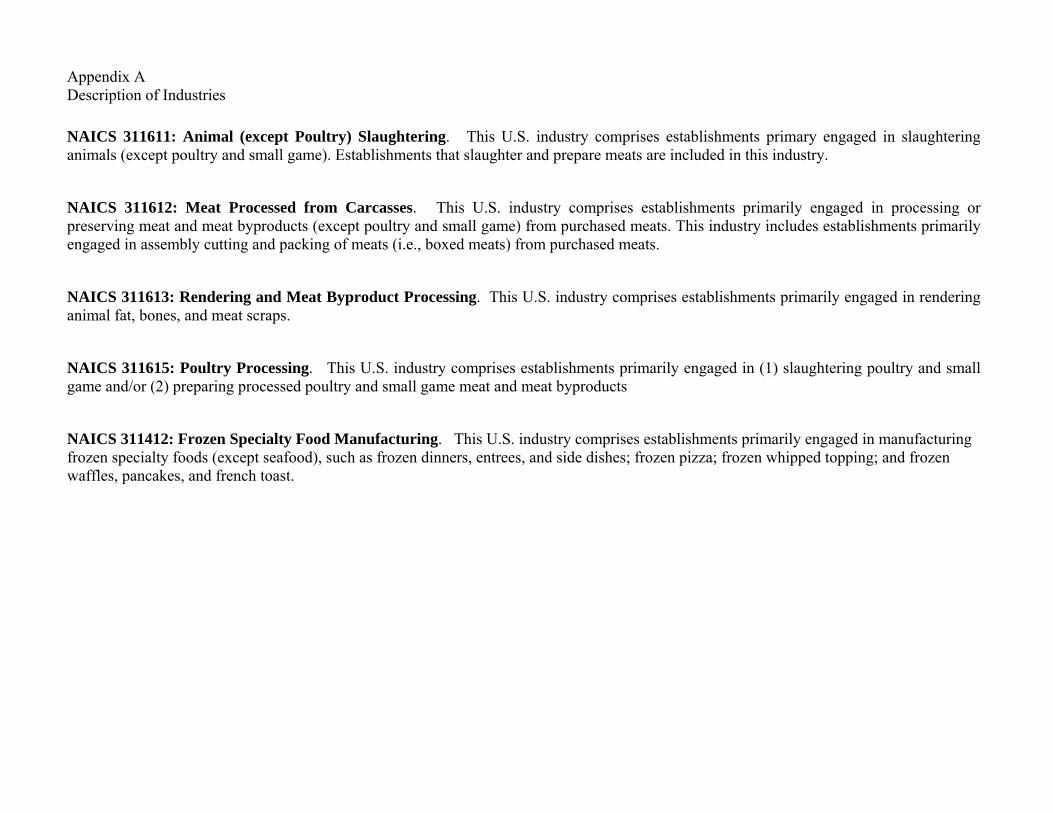
government expenditures for education, police protection and health. The industries we consider
are Animal (except poultry) Slaughtering (NAICS 311611), Meat Processed from Carcasses
(NAICS 311612), Rendering and Meat Byproduct Processing (NAICS 311613), Poultry
Processing (NAICS 311615) and Frozen Specialty Food Manufacturing (NAICS 311412).3
Using the LDB, counties in twelve Midwestern states are classified into one of five categories
based on whether a facility in any of these industries (a) was present continuously, (b) entered,
6
(c) closed, (d) both entered and exited, or (e) was not present, during the period 1990-2000.
Establishment-level employment and wage data are aggregated to the county level and used to
construct relative measures of earnings and employment in order to analyze the importance of
overall size of the industry in the county. In addition, the possibility that higher-value processing
facilities generate social and economic impacts that are different from those of packing facilities
is investigated.
We find that as the meat packing and processing industry’s share of a county’s total
employment and wage bill rises, total employment growth increases, while wage growth slows
relative to counties without the industry. Income growth, the product of employment and wage
growth, is relatively slower as well, indicating that the negative wage effect swamps the positive
employment effect. Employment net of the meatpacking sector grows more slowly, suggesting
that meatpacking employment grows at the expense of employment growth in other sectors of
the economy. However, contrary to the findings of previous research on this topic, there is no
significant difference in the growth of violent or property crime in counties with and without
meatpacking, and the point estimates, although imprecise, suggest slower crime growth in
counties with these plants. In addition, there is little evidence that growth in the industry affects
local government expenditures in total, or on education, police protection, or health. Our results
are robust to differences in assumptions regarding the exogeneity or endogeneity of the presence
of a packing or a processing plant. Our findings are also basically unchanged when we examine
meat packing separately from meat processing or poultry processing.
Conceptual Framework
Previous research suggests that the presence of the meat packing industry may have
positive or negative effects on a county’s economic growth. On the one hand, the industry adds
7
jobs and income to the local economy, and potentially spawns additional business growth up and
down the supply chain. On the other hand, the presence of the industry may deter additional
growth if it generates negative social impacts such as increased crime or pollution or if it
imposes costs on the local government (education, transportation, sewage or other infrastructure
investments) that dissuade other businesses from entering.
Local officials seek to maximize the utility of their residents which depends on the
economic environment and on quality of life factors like public safety and government services.
We follow a simplified version of models presented in Glaeser, et al. (1992) and Glaeser et al.
(1995) that leads to an estimating equation of the same form as Glaeser, et al (1992). Let Qit
represent goods and services that are produced by local industries in county i at time t and Zit
represent a “quality of life” good. Consumers’ utility depends positively on production of both
goods.
),( ititit ZQUU = (1)
Local officials maximize this utility function subject to a budget constraint: ititZitQ WZPQP =+ (2) where W is an endowment of wealth, QP is the price of Q, and ZP is the price of Z. We assume
a Cobb-Douglas functional form for utility:
αα −= 1),( itititit ZQZQU (3) where 0<α<1. This can be transformed to: itititit ZQZQU ln)1(ln),( αα −+= (3a) The following derived demand equations are obtained from the utility-maximization problem: ititZQitQ WWPPQP α=⋅ ),,( (4a)
8
ititZQitZ WWPPZP )1(),,( α−=⋅ (4b) Rewriting these demand equations in terms of growth rates we obtain:
ttttQttQ WWQPQP ln)(lnlnln 1,11, −⋅=− +++ (5a)
ttttZttZ WWZPZP ln)(lnlnln 1,11, −⋅=− +++ (5b) Growth in the value of output, Q, and in the value of the amenity good, Z, is a function of
changes in endowments, W.
Empirical Specification
Equations (5a) and (5b) provide the basis for our empirical specification, a difference-in-
differences model. The difference-in-differences estimation method is commonly used to
measure the effects of a treatment, such as a training program, on the behavior of those who have
received the treatment. A comparison of behavioral outcomes is made both before and after
treatment and with a control group of similar people not receiving the treatment. In this study,
the treatment group is composed of counties that have meat packing or processing jobs at some
time during the study period. The control group is composed of otherwise similar counties that
do not have jobs in the industry during the study period.
Our measures of growth in QP Q are income growth, wage growth and employment
growth, since labor productivity growth is proportional to growth in output. The measures of
ZP Z include growth in local government expenditures on health, education, police protection,
and in total, and changes in crime rates. Endowments, W, include environmental amenities and
other local attributes, as well as the presence and relative size of the livestock processing
industry.
9
Let the meat packing/processing industry be represented by the variable Mit, a continuous
measure between 0 and 1, indicating the share of the livestock processing industry in the county.
This provides variation both across types of counties and within the “treatment” group, counties
having the meat packing/processing industry (MPP).
The effect of having the industry continuously, or losing or gaining the industry relative
to never having the industry, can be recovered using the difference-in-differences approach.
Time is measured in years; the change from period 0 to period 1 represents a change from one
year to the next. Modifying equation (5a) gives us:
)()ln(ln)ln(lnlnln 1111 itititititititit XXMMQQ εεβδ −+−+−=− ++++ (6)
where Wit is composed of Mit, the measure of livestock processing in county i at time t and Xit, a
vector of variables measuring other endowments in county i at time t. The effect of growth in
the relative size of the MPP industry in the county on the growth rate of Q is measured by δ.
There may be differential impacts for counties that lost or gained meat packing or
processing plants relative to counties that always or never had plants. Let Ci, Gi, Li and Bi be
dummy variables equal to one if the county had the industry continuously during the period,
gained the industry during the period, lost the industry during the period, or both gained and lost
the industry, respectively. Equation (5a) can be modified as follows:
)()ln(ln)ln(ln)ln(ln
)ln(ln)ln(lnlnln
1
111
111
itit
itititititBitititC
itititLitititGitit
XXMMBMMCMMLMMGQQ
εεβδδ
δδ
−+−+−+−+
−+−=−
+
+++
+++
(7)
This specification allows growth in the MPP industry to have different effects according to
whether the county gained, lost, both gained and lost, or hosted the industry continuously
10
throughout the period. In each case the reference group is the counties that never had livestock
packing or processing facilities, and δG, δL, δC and δB measure the relative effect on Q growth of
gaining, losing, continuously having, or both gaining and losing MPP jobs.
Table 1 describes the variables used in the estimation. Measures of economic change
include growth in county income, employment and average wage rates. These data were
obtained from the Bureau of Economic Analysis. In addition, we measure the growth in net
employment, measured as total county employment growth minus employment growth in the
meat packing and processing industry. While growth in the industry is expected to spur total
employment growth, it is unclear whether the industry will induce positive employment growth
in other sectors due to agglomeration effects or if MPP industry growth will deter employment
growth in other sectors due to negative spillovers, such as increased factor costs or congestion.
One of the biggest concerns of communities gaining meat packing facilities is the
potential impact on crime rates. We have included two measures of crime, the change in
property crime rates and the change in violent crime rates, obtained from FBI Uniform Crime
reports. The measures of fiscal changes included in the analysis are total direct general
expenditures by local governments as well as direct general expenditures on police protection,
education, and health and hospitals. A separate regression is estimated for each of these outcome
variables.
Two measures of the livestock processing industry are used. The first measure is the
industry’s share of total county employment; the second is the industry’s share of county
earnings. Few time-varying control variables were available on an annual basis to measure the
change in endowments. Annual population estimates from the U.S. Census were included as
11
were the average annual changes in the proportion of high school and college graduates in the
county. These latter variables were constructed from 1990 and 2000 census data. In addition, a
number of control variables representing initial conditions are included in the estimation.
Since plant locations are not randomly assigned, this is not a true experimental design.
There is some evidence that local officials do use tax abatements and other economic incentives
to attract livestock processing firms and this may be one source of unobserved heterogeneity
across counties. A major advantage of the first differenced approach is that any unobserved time
invariant county fixed effects are removed from the estimation. However, there may still be time
varying unobserved variables that are correlated with the presence of the livestock industry.
One method to control for potential nonrandom assignment of counties into the treatment
group is to use instrumental variables that exogenously shift the probability of having a
meatpacking plant but that do not directly affect the growth rate of the county. The best
candidates for instruments are factors that uniquely affect the productivity of a meatpacking
plant, such as access to feed and animals, but that have no obvious effect on the county growth
rate. Since the industry generally serves national markets, variation in local demand is unlikely
to provide identification. An alternative method involves a matching strategy in which a
treatment group is paired with a control group based on similar values of explanatory variables
(Angrist and Krueger, 1999). Observations are matched using a propensity score, based on the
predicted share of MPP jobs in the county in 1990. By creating a weighted sample of the control
counties based on the distribution of propensity scores in the treated counties, we are able to
generate a distribution of control counties that exactly matches the distribution of propensity
scores in the treated counties. In contrast with closest neighbor matches, this method has the
12
advantage of preserving all observations in the sample. As it turns out, our results are not
sensitive to the type of estimation strategy used.
The Sample
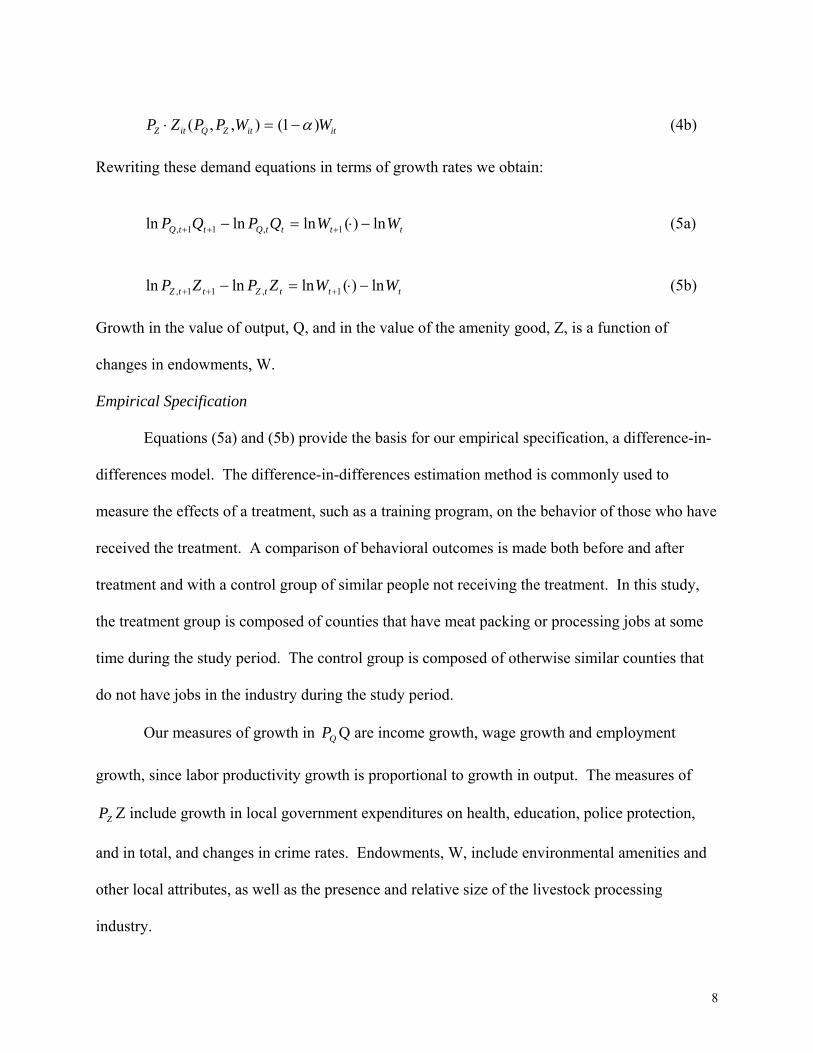
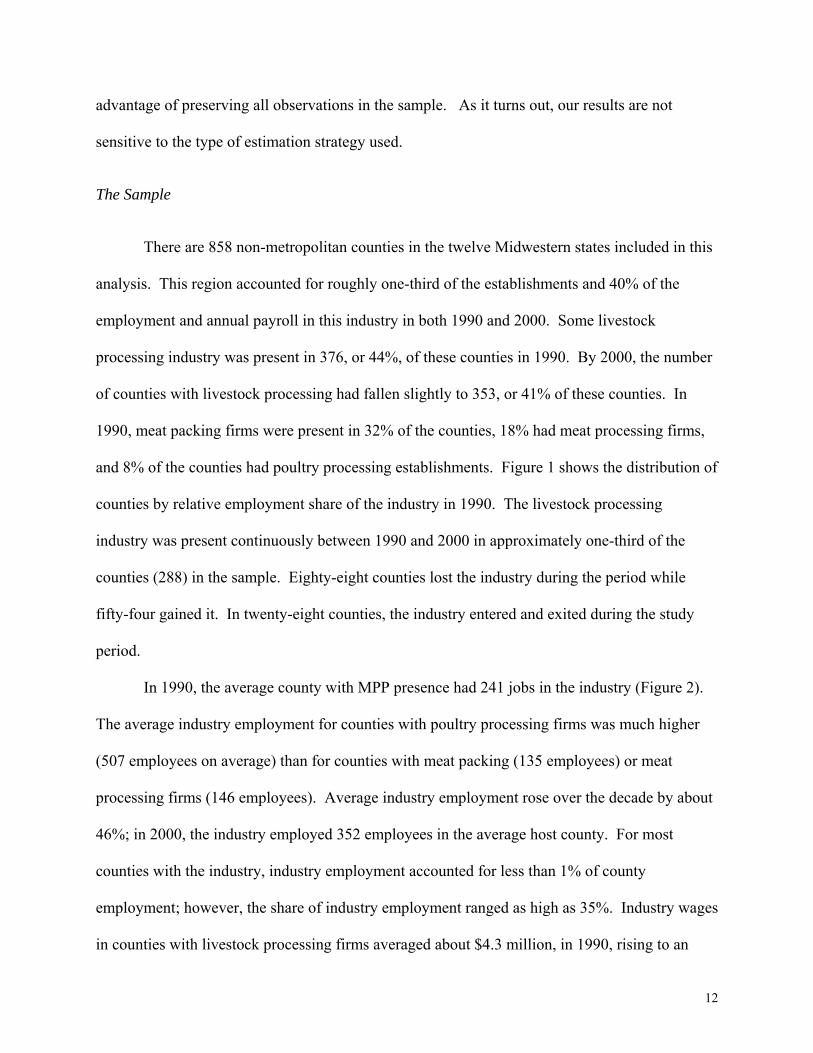
There are 858 non-metropolitan counties in the twelve Midwestern states included in this
analysis. This region accounted for roughly one-third of the establishments and 40% of the
employment and annual payroll in this industry in both 1990 and 2000. Some livestock
processing industry was present in 376, or 44%, of these counties in 1990. By 2000, the number
of counties with livestock processing had fallen slightly to 353, or 41% of these counties. In
1990, meat packing firms were present in 32% of the counties, 18% had meat processing firms,
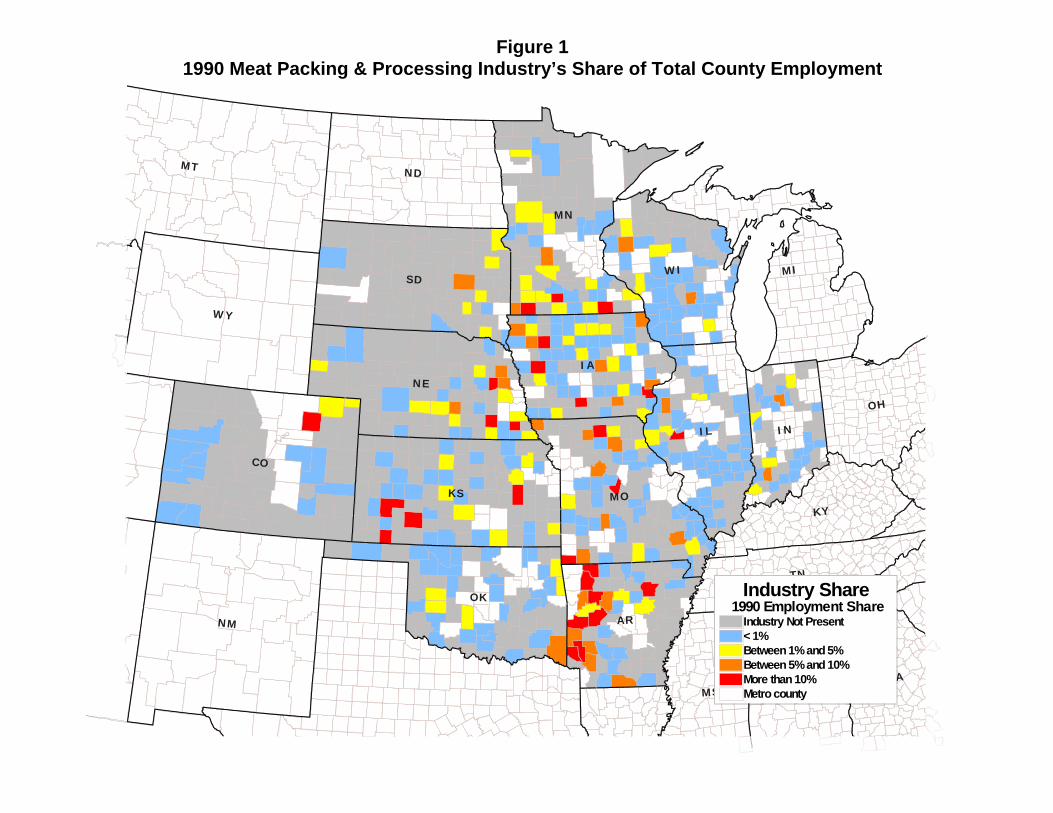
and 8% of the counties had poultry processing establishments. Figure 1 shows the distribution of
counties by relative employment share of the industry in 1990. The livestock processing
industry was present continuously between 1990 and 2000 in approximately one-third of the
counties (288) in the sample. Eighty-eight counties lost the industry during the period while
fifty-four gained it. In twenty-eight counties, the industry entered and exited during the study
period.
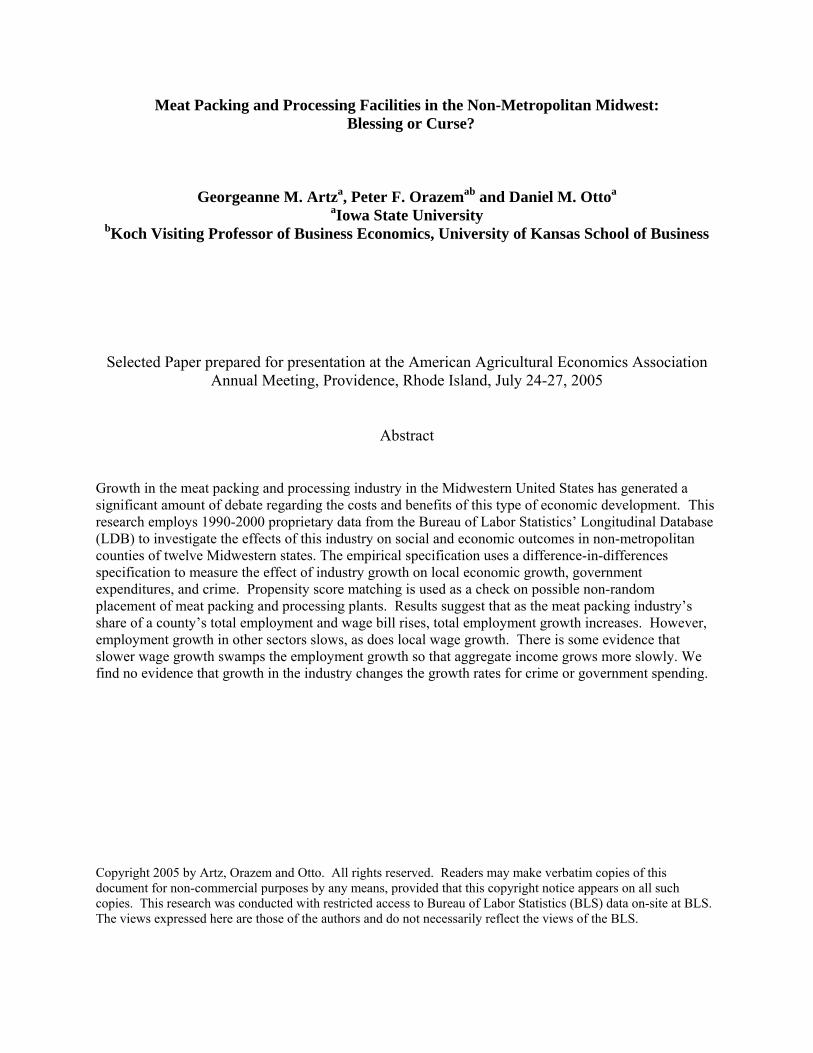
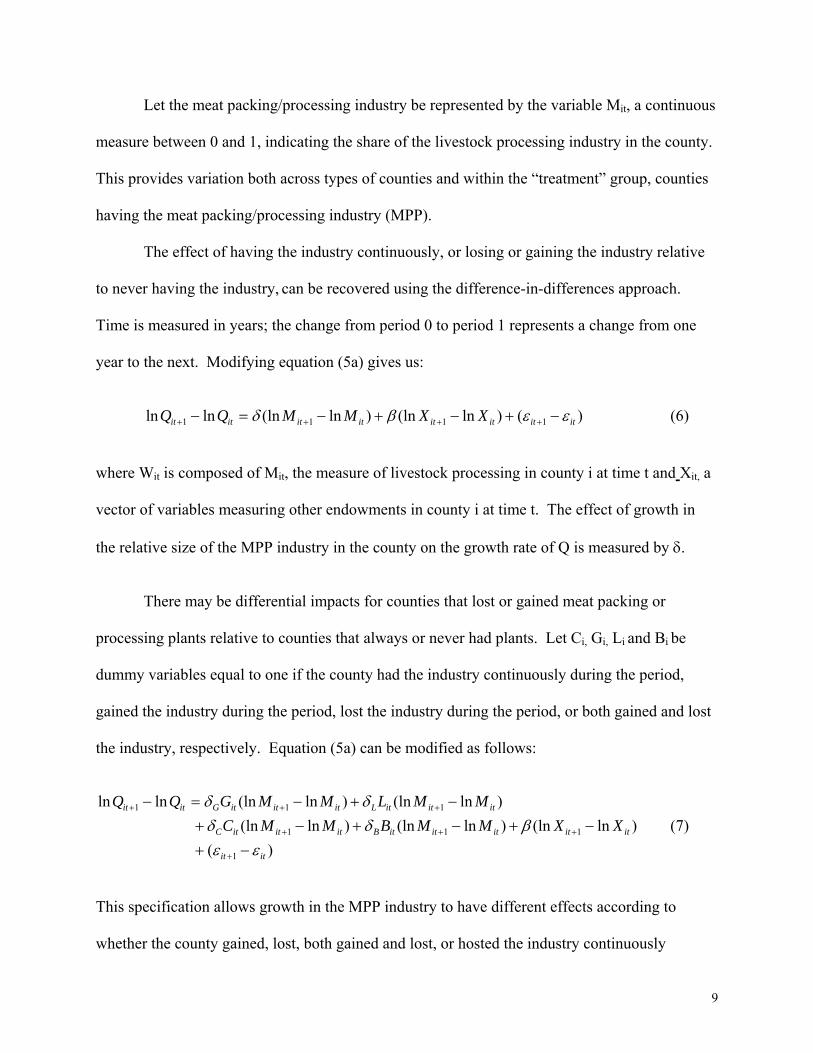
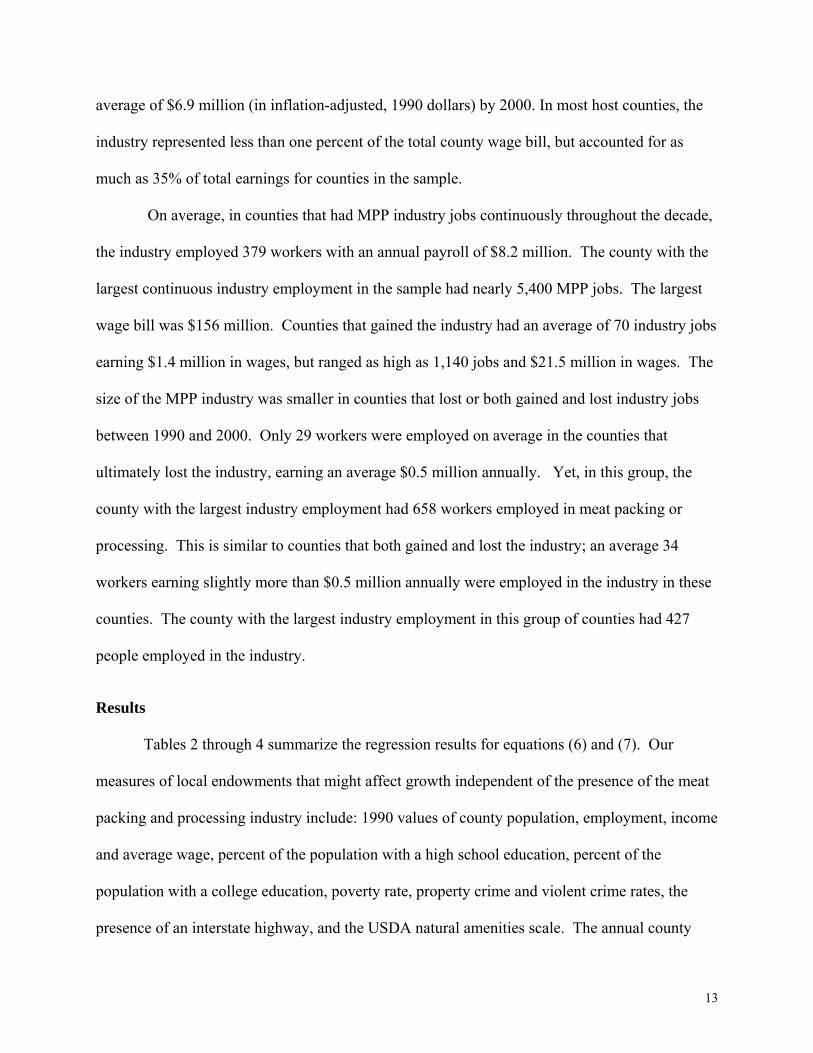
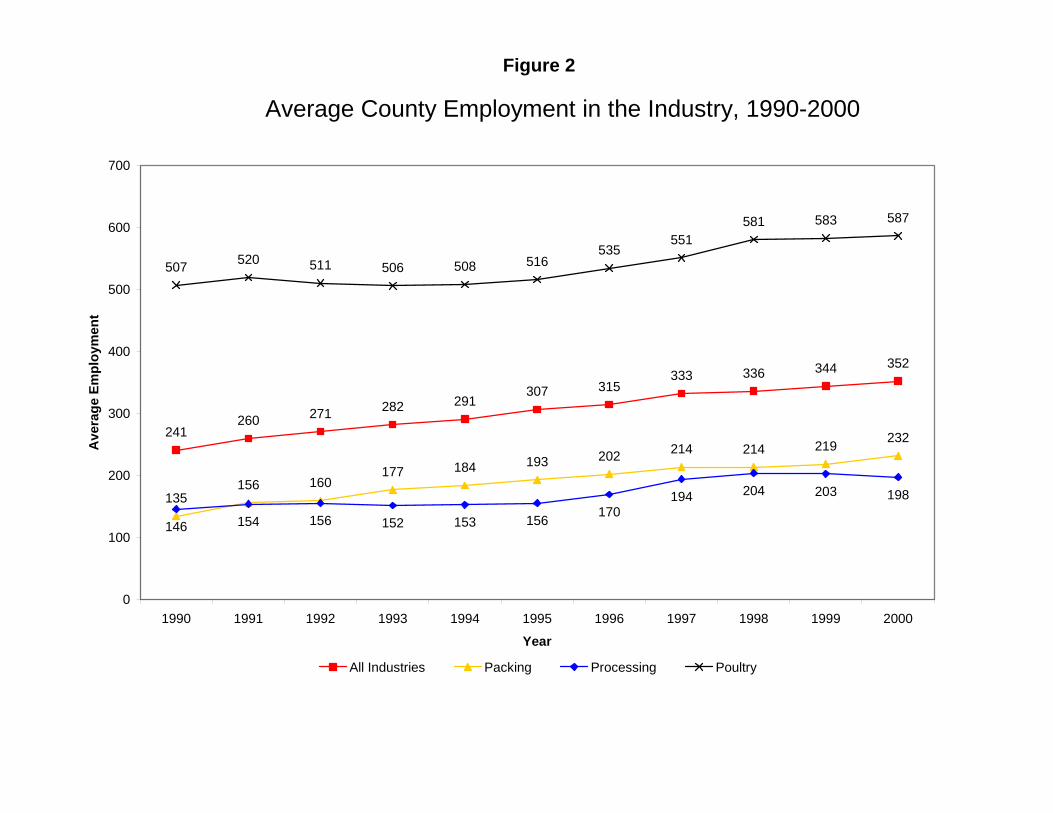
In 1990, the average county with MPP presence had 241 jobs in the industry (Figure 2).
The average industry employment for counties with poultry processing firms was much higher
(507 employees on average) than for counties with meat packing (135 employees) or meat
processing firms (146 employees). Average industry employment rose over the decade by about
46%; in 2000, the industry employed 352 employees in the average host county. For most
counties with the industry, industry employment accounted for less than 1% of county
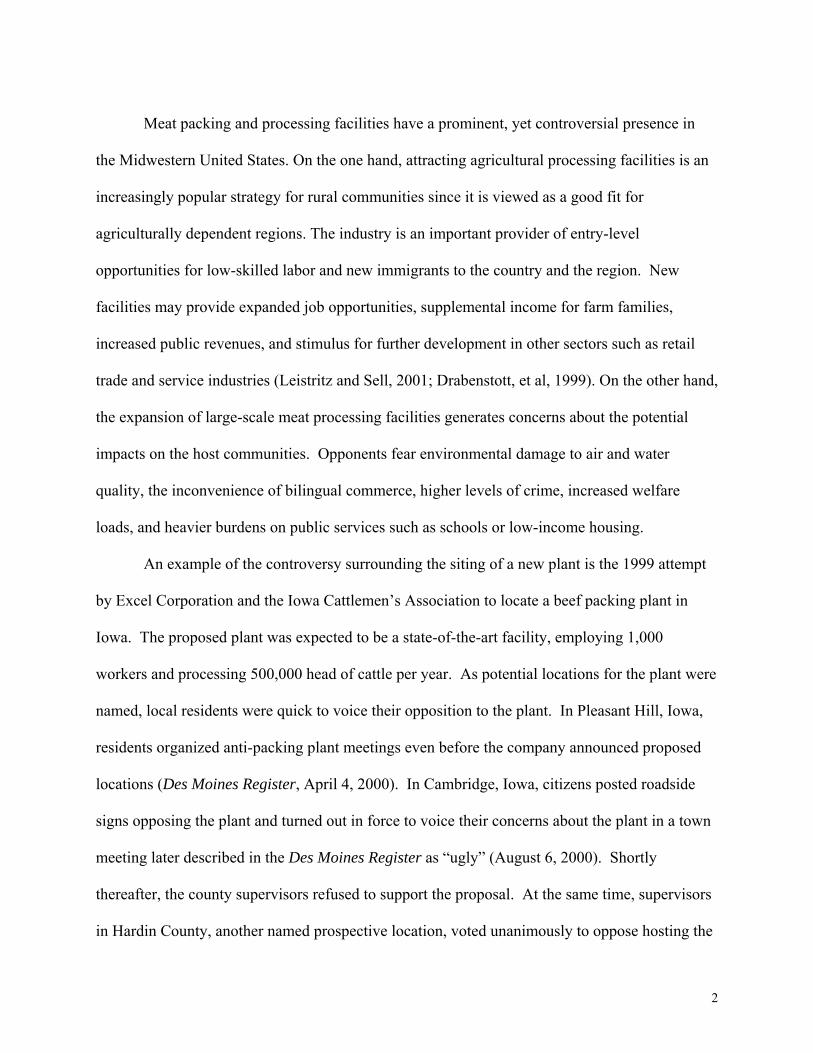
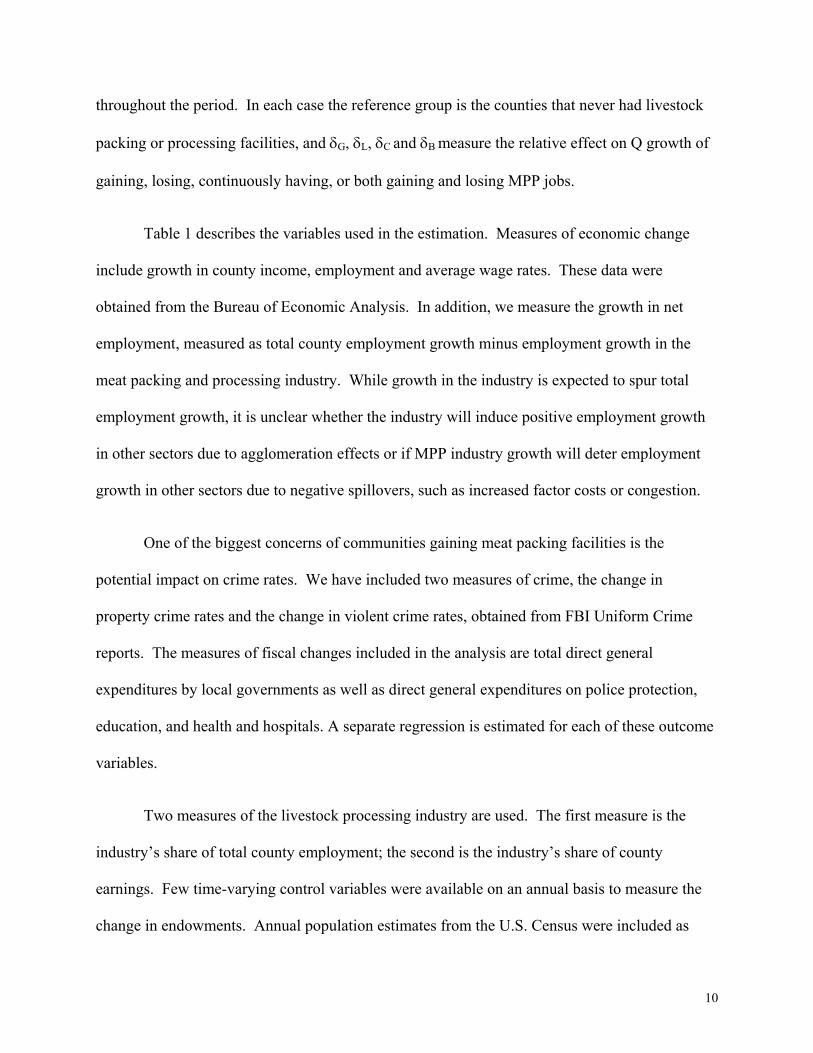
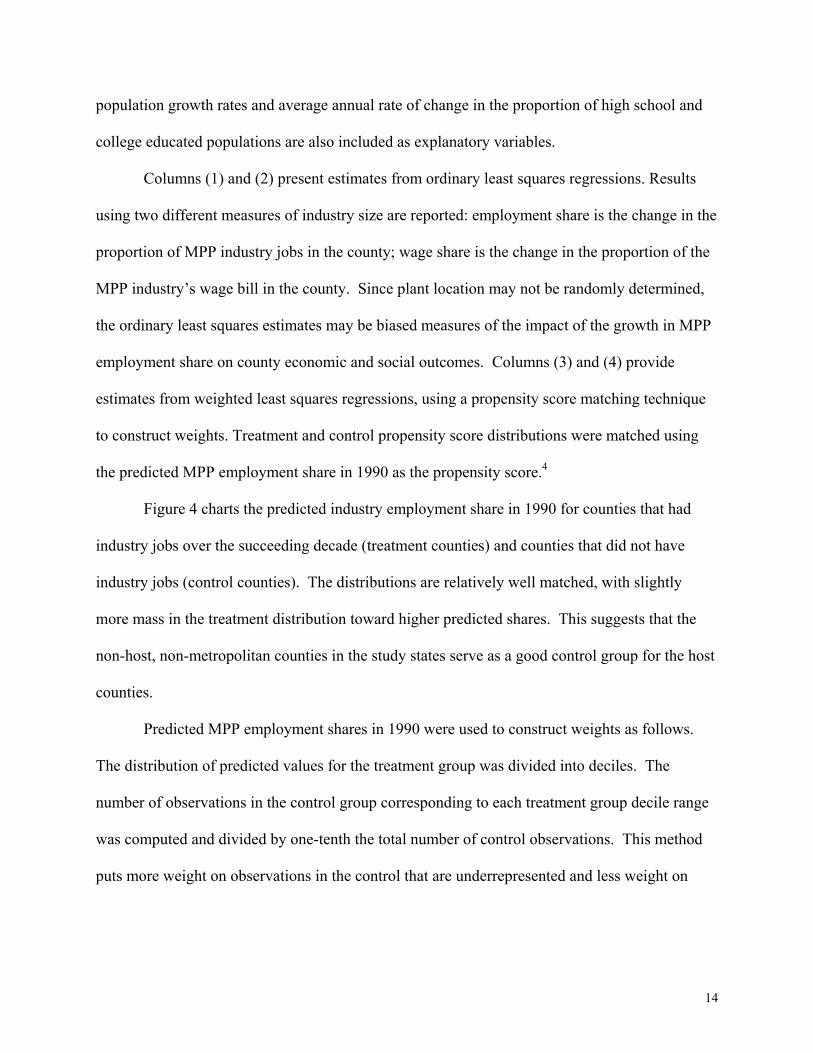
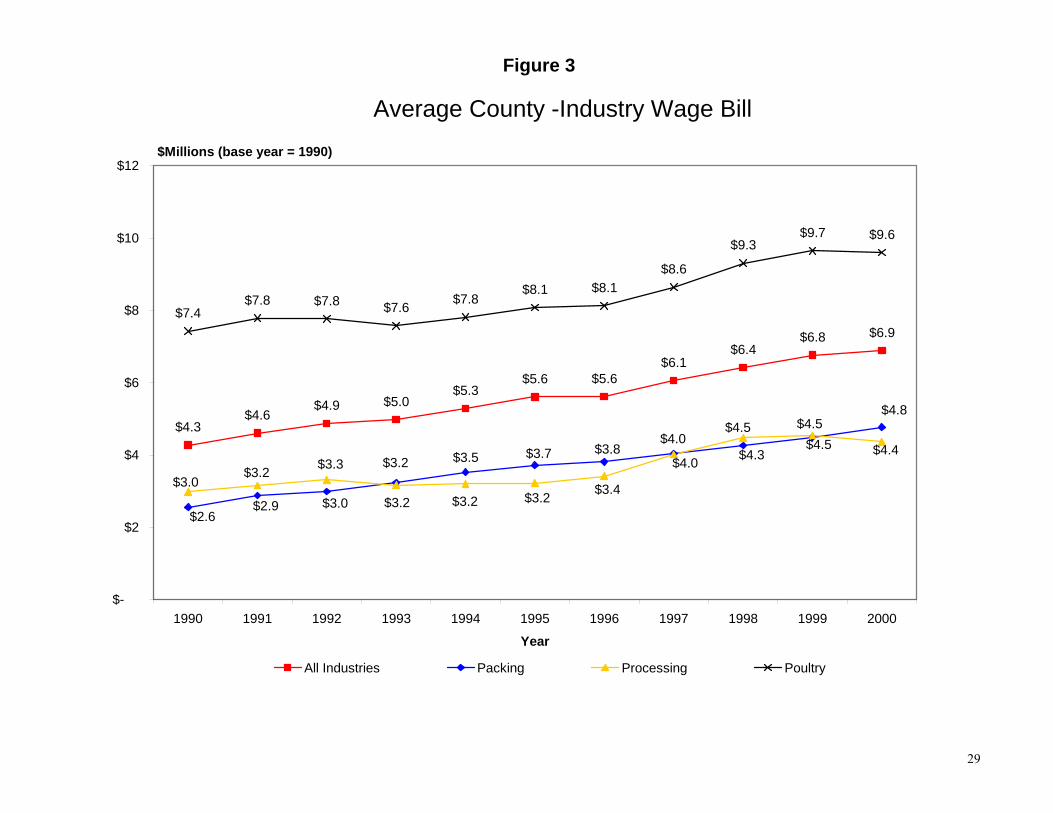
employment; however, the share of industry employment ranged as high as 35%. Industry wages
in counties with livestock processing firms averaged about $4.3 million, in 1990, rising to an
13
average of $6.9 million (in inflation-adjusted, 1990 dollars) by 2000. In most host counties, the
industry represented less than one percent of the total county wage bill, but accounted for as
much as 35% of total earnings for counties in the sample.
On average, in counties that had MPP industry jobs continuously throughout the decade,
the industry employed 379 workers with an annual payroll of $8.2 million. The county with the
largest continuous industry employment in the sample had nearly 5,400 MPP jobs. The largest
wage bill was $156 million. Counties that gained the industry had an average of 70 industry jobs
earning $1.4 million in wages, but ranged as high as 1,140 jobs and $21.5 million in wages. The
size of the MPP industry was smaller in counties that lost or both gained and lost industry jobs
between 1990 and 2000. Only 29 workers were employed on average in the counties that
ultimately lost the industry, earning an average $0.5 million annually. Yet, in this group, the
county with the largest industry employment had 658 workers employed in meat packing or
processing. This is similar to counties that both gained and lost the industry; an average 34
workers earning slightly more than $0.5 million annually were employed in the industry in these
counties. The county with the largest industry employment in this group of counties had 427
people employed in the industry.
Results
Tables 2 through 4 summarize the regression results for equations (6) and (7). Our
measures of local endowments that might affect growth independent of the presence of the meat
packing and processing industry include: 1990 values of county population, employment, income
and average wage, percent of the population with a high school education, percent of the
population with a college education, poverty rate, property crime and violent crime rates, the
presence of an interstate highway, and the USDA natural amenities scale. The annual county
14
population growth rates and average annual rate of change in the proportion of high school and
college educated populations are also included as explanatory variables.
Columns (1) and (2) present estimates from ordinary least squares regressions. Results
using two different measures of industry size are reported: employment share is the change in the
proportion of MPP industry jobs in the county; wage share is the change in the proportion of the
MPP industry’s wage bill in the county. Since plant location may not be randomly determined,
the ordinary least squares estimates may be biased measures of the impact of the growth in MPP
employment share on county economic and social outcomes. Columns (3) and (4) provide
estimates from weighted least squares regressions, using a propensity score matching technique
to construct weights. Treatment and control propensity score distributions were matched using
the predicted MPP employment share in 1990 as the propensity score.4
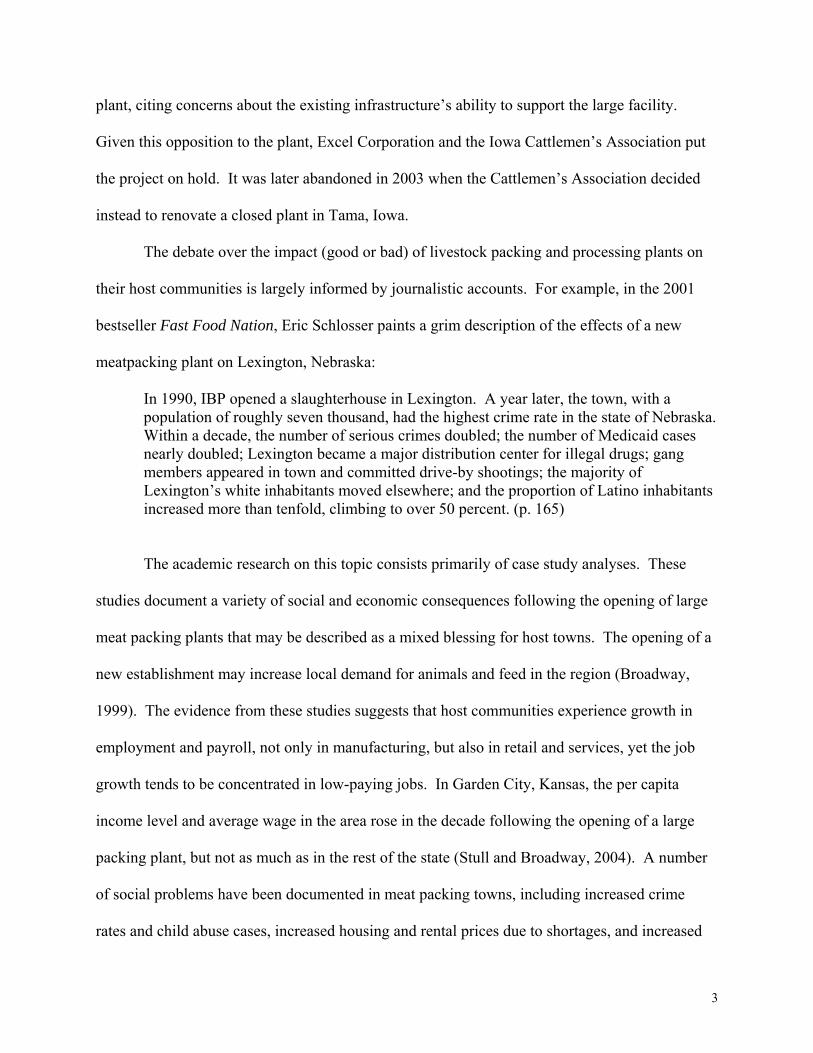
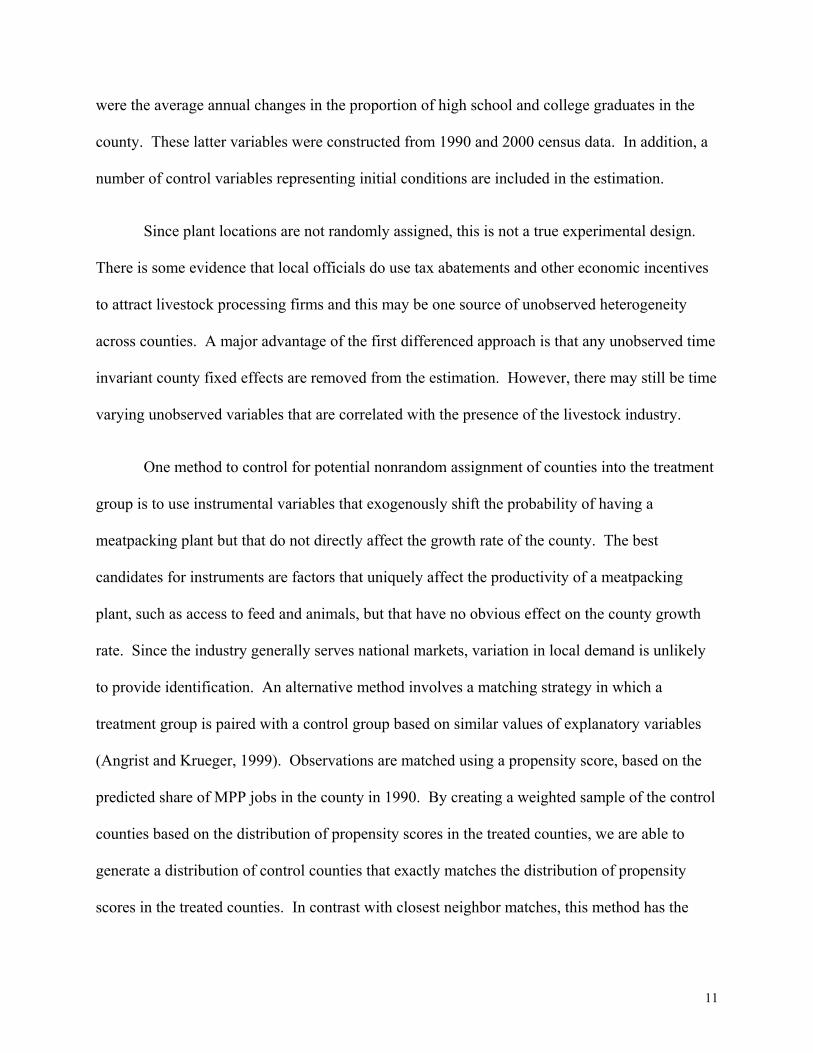
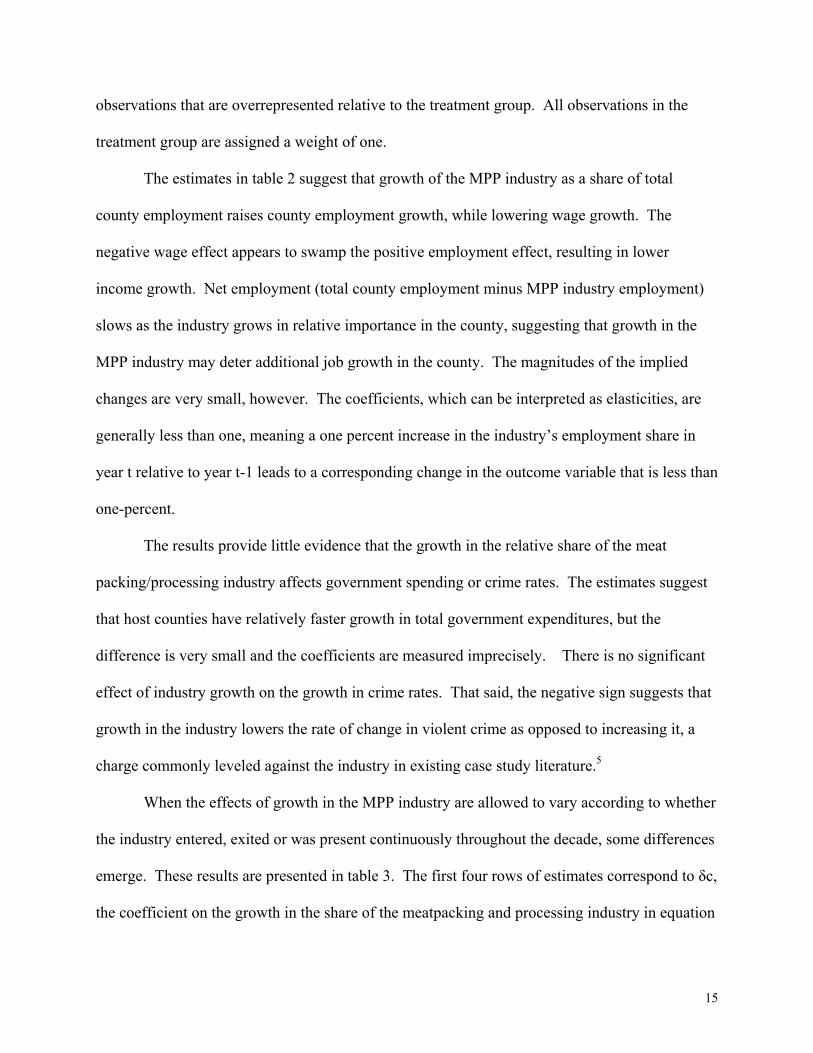
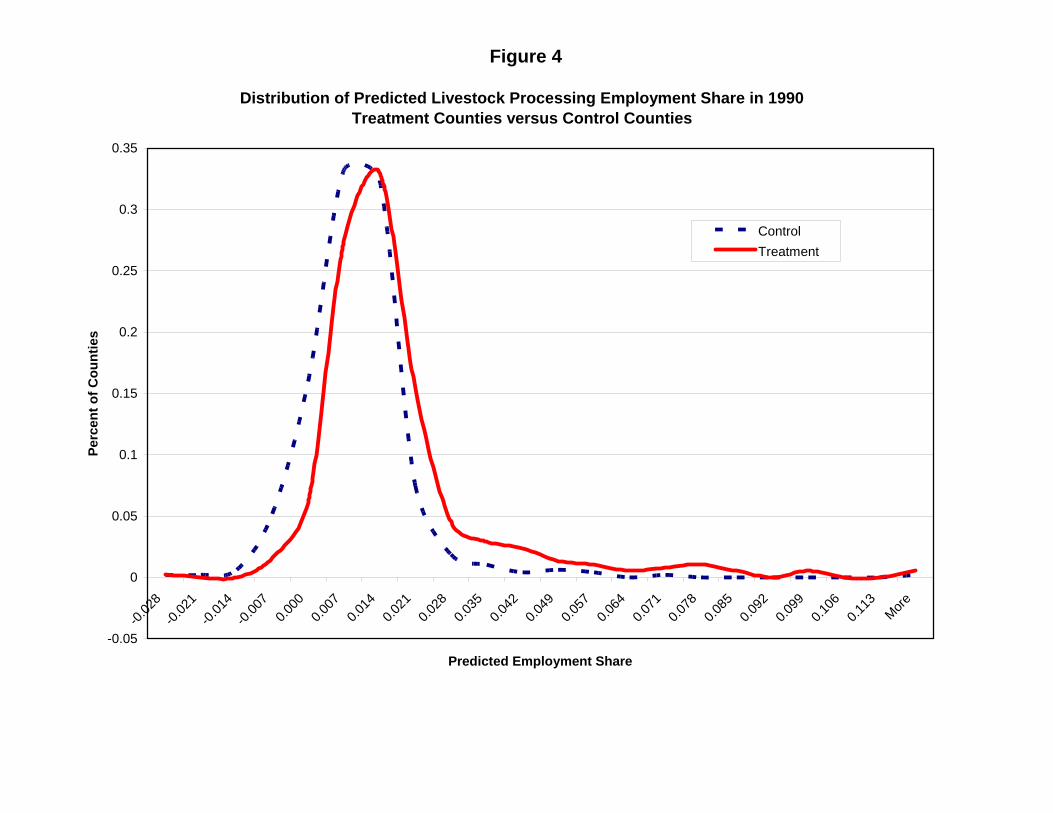
Figure 4 charts the predicted industry employment share in 1990 for counties that had
industry jobs over the succeeding decade (treatment counties) and counties that did not have
industry jobs (control counties). The distributions are relatively well matched, with slightly
more mass in the treatment distribution toward higher predicted shares. This suggests that the
non-host, non-metropolitan counties in the study states serve as a good control group for the host
counties.
Predicted MPP employment shares in 1990 were used to construct weights as follows.
The distribution of predicted values for the treatment group was divided into deciles. The
number of observations in the control group corresponding to each treatment group decile range
was computed and divided by one-tenth the total number of control observations. This method
puts more weight on observations in the control that are underrepresented and less weight on
15
observations that are overrepresented relative to the treatment group. All observations in the
treatment group are assigned a weight of one.
The estimates in table 2 suggest that growth of the MPP industry as a share of total
county employment raises county employment growth, while lowering wage growth. The
negative wage effect appears to swamp the positive employment effect, resulting in lower
income growth. Net employment (total county employment minus MPP industry employment)
slows as the industry grows in relative importance in the county, suggesting that growth in the
MPP industry may deter additional job growth in the county. The magnitudes of the implied
changes are very small, however. The coefficients, which can be interpreted as elasticities, are
generally less than one, meaning a one percent increase in the industry’s employment share in
year t relative to year t-1 leads to a corresponding change in the outcome variable that is less than
one-percent.
The results provide little evidence that the growth in the relative share of the meat
packing/processing industry affects government spending or crime rates. The estimates suggest
that host counties have relatively faster growth in total government expenditures, but the
difference is very small and the coefficients are measured imprecisely. There is no significant
effect of industry growth on the growth in crime rates. That said, the negative sign suggests that
growth in the industry lowers the rate of change in violent crime as opposed to increasing it, a
charge commonly leveled against the industry in existing case study literature.5
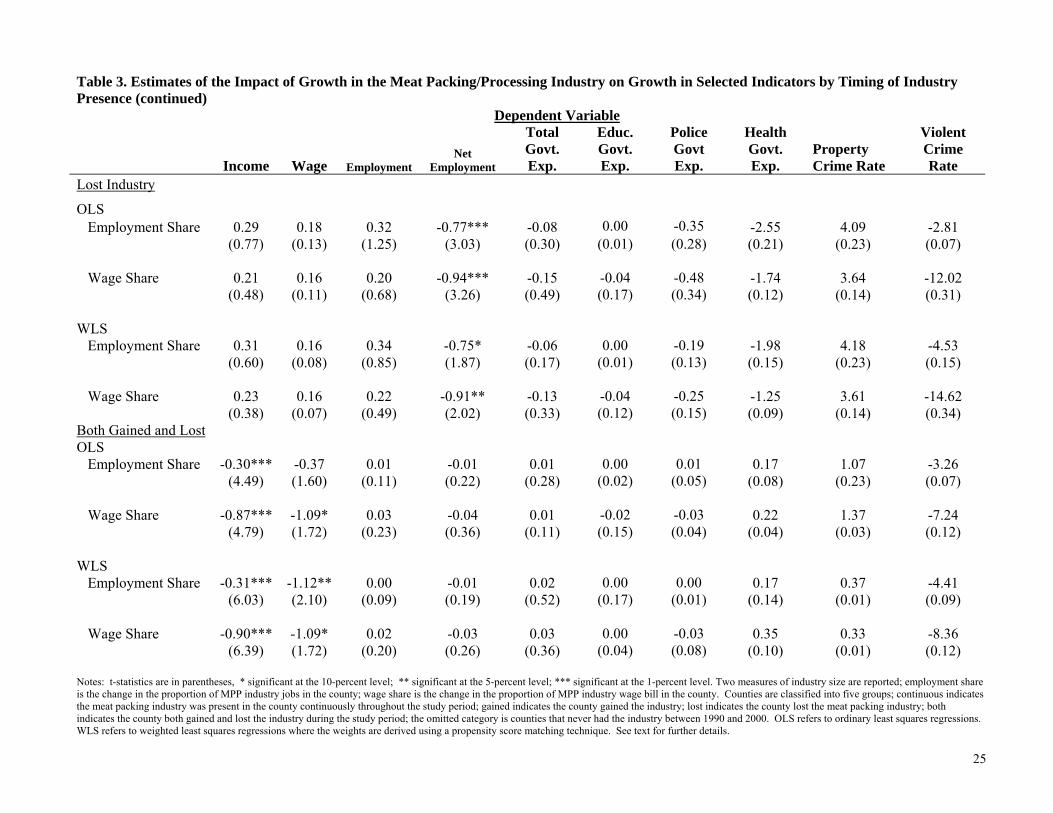
When the effects of growth in the MPP industry are allowed to vary according to whether
the industry entered, exited or was present continuously throughout the decade, some differences
emerge. These results are presented in table 3. The first four rows of estimates correspond to δc,
the coefficient on the growth in the share of the meatpacking and processing industry in equation
16
(7) for counties that had the industry continuously throughout the decade (relative to counties
that never had the industry during the same time period). The first two rows provide estimates
from the ordinary least squares regressions, one set using employment share to measure the MPP
industry and the second set using wage share. The second two rows present similar estimates
from weighted least squares regressions. The second set of estimates correspond to δG, the
effect of industry growth in counties that gained the industry; the third set are estimates of δL, the
coefficients on industry growth for counties that lost the industry, and the final set are δB, for the
set of counties that both gained and lost the industry during the decade.
The negative effect of an increasing share of MPP industry on income growth appears to
be driven mainly by counties that both gained and lost the industry over the decade. When
industry size is measured by its share of the total county wage bill, the results suggest that the
industry also slowed income growth in counties that had MPP jobs continuously throughout the
decade. In counties that lost the industry, income growth was higher before the loss of the MPP
jobs, although not significantly higher.
Counties that gained the MPP industry experienced faster employment growth, as did
counties that had the industry continuously during the study period. Counties that lost the
industry had higher employment growth before losing the plant, but the estimates are imprecise.
Net employment growth was relatively slower in counties that had the industry continuously and
in counties that lost the industry. While the coefficients on net employment growth are likewise
negative for counties that gained MPP jobs, the estimates are not significant. There is no
evidence that growth in the relative share of the industry affects growth in crime rates or local
government expenditures whether the industry was present continuously, entered, exited or both
entered and exited over the sample period.
17
Table 4 presents the weighted least squares estimates of δ for more detailed
classifications of the industry. Columns (1) and (2) provide estimates for all MPP industries
combined; columns (3) and (4) give estimates for the packing industry only (NAICS 311611),
columns (5) and (6) provide estimates for the poultry processing industry only (NAICS 311615)
and estimates for the processing industry (NAICS 311612, 311613 and 311412) are presented in
the remaining columns. In each case, results are shown for the two measures of the MPP
industry; growth in the proportion of industry employment share and growth in the proportion of
industry wage share in the county.
The results do not differ markedly when these more detailed industry classifications are
used to define treatment county status. In general the signs of the coefficients for income,
wages, employment and net employment are consistent across industry type although the
significance levels vary. In the meat processing and poultry processing equations, growth in the
relative employment share does not lower income growth as it does in the meat packing
equations. However, when relative size is measured by the industry’s share of the total county
wage bill, the effect on income growth is negative for all industry types. While growth in the
share of poultry processing tends to slow government expenditures relative to counties without
the industry, these estimates do not provide support for the notion that growth in the meat
packing and processing industry significantly impacts government spending or crime rates.
Summary and Conclusions
Growth in the meat packing and processing industry in the Midwestern United States has
generated a significant amount of debate regarding the costs and benefits of this type of
economic development. Previous studies, employing a case study approach, have documented
18
both positive and negative consequences following the opening of large meat packing plants, but
generally have failed to provide a frame of reference for evaluating these changes. Our goal was
to provide this frame of reference by assessing the changes in economic and social outcomes
resulting from growth (or decline) in the meat packing and processing industry relative to
changes in similar settings without meat industry jobs. Using a broad array of social and
economic growth indicators, we find neither the large systematic gains envisioned by proponents
of MPP expansion, nor the significant losses feared by the industries opponents.
Local officials seek to attract the meat packing and processing industry because they
believe it will generate employment and spur wage growth in their communities. This research
does find evidence that the industry affects total county employment growth, but does not
support the case for positive spillovers employment in other sectors or on wage growth. Instead,
we find that expansion in meat packing and processing has a negative effect on overall wage
growth and slows employment growth in other sectors of the host county economy. There is
some evidence that the slower wage growth swamps the faster employment growth so that
aggregate income grows more slowly. In contrast to previous studies, there is no systematic
effect of growth in the industry on either local crime rates or local government spending.
Counties that lost the MPP industry did not have appreciable changes in employment
growth. Apparently, firms in other sectors were able to absorb labor shed by the shuttered MPP
firms. Counties that gained the industry had significantly faster employment growth, but no
appreciable advantage in any of the other growth measures. On the other hand, there is no
evidence of more rapid growth of crime in counties gaining MPP firms.
This research helps provide a context for evaluating the impact of the livestock
processing industry on rural communities in the Midwestern U.S. As the industry continues to

19
expand in rural America, further research will be needed to address questions regarding its effect
on environmental quality and other quality of life aspects not addressed in this study.
20
References
Angrist, Joshua D. and Alan B. Krueger. 1999. “Empirical Strategies in Labor Economics.” Chapter 23 in O. Ashenfelter and D. Card (Eds.), The Handbook of Labor Economics, Vol III. North Holland.
Barkema, Alan, Mark Drabenstott and Nancy Novack. 2001. “The New U.S. Meat Industry.” Economic
Review, Second Quarter, Kansas City Federal Reserve Bank: 33-56. Benson, Janet E. “Staying Alive: Economic Strategies Among Immigrant Packing Plant Workers in Three
Southwest Kansas Communities.” Kansas Quarterly: 107-120. Broadway, Michael. 1990. “Meatpacking and Its Social and Economic Consequences for Garden City,
Kansas in the 1980s.” Urban Anthropology Vol 19(4):321-344. Broadway, Michael. 1994. “Beef Stew: Cattle, Immigrants and Established Residents in a Kansas
Beefpacking Town.” Chapter 2 in L. Lamphere, A. Stepick and G. Grenier (Eds.), Newcomers In the Workplace: Immigrants and the Restructuring of the U.S. Economy. Philadelphia, PA: Temple University Press, p. 25-43.
Broadway, Michael. 2000. “Planning for change in small towns or trying to avoid the slaughterhouse
blues.” Journal of Rural Studies 16: 37-46. Broadway, Michael, Donald D. Stull and Bill Podraza. 1994. “What Happens When the Meat Packers
Come to Town?” Small Town (January-February):24-27. Drabenstott, Mark, Mark Henry and Kristin Mitchell. 1999. “Where Have All the Packing Plants Gone?
The New Meat Geography in Rural America.” Economic Review, Third Quarter, Kansas City Federal Reserve Bank: 65-82.
Edmiston, Kelly. 2004. “The Net Effects of Large Plant Locations and Expansions on County
Employmnent.” Journal of Regional Science 44(2):289-319. Flora, Cornelia Butler, Jan L. Flora and Ruben J. Tapp. “Meat, Meth, and Mexicans: Community
Responses to Increasing Ethnic Diversity.” Journal of Community Development Society 31:2(2000): 277-299.
Fox, William F. and Matthew N. Murray. 2004. “Do Economic Effects Justify the Use of Fiscal
Incentives?” Southern Economic Journal 71(1):78-92. Glaeser, Edward L., Hedi D. Kallal, Jose A. Scheinkman, and Andrei Shleifer. 1992. “Growth in Cities.”
Journal of Political Economy 100(61):1126-1152. Glaeser, Edward L., Jose A. Scheinkman, and Andrei Shleifer. 1995. “Economic Growth in a Cross-
Section of Cities.” Journal of Monetary Economics 36:117-143. Grey, Mark A. 1997a. “Secondary Labor in the Meatpacking Industry: Demographic Change and
Student Mobility in Rural Iowa Schools.” Journal of Research in Rural Education 13 (Winter): 153-164.
21
Grey, Mark A. 1997b. “Storm Lake, Iowa, and the Meatpacking Revolution: Historical and Ethnographic Perspectives on a Community in Transition.” In S. Stromquist and M. Bergman (Eds.), Unionizing the Jungles: Labor and Community in the Twentieth-Century Meatpacking Industry. Iowa City, IA: University of Iowa Press, p. 242-261.
Grey, Mark A. 1999. “Immigrants, Migration, and Worker Turnover at the Hog Pride Pork Packing
Plant.” Human Organization 58(1):16-27. Greenstone, Michael and Enrico Moretti. 2003. “Bidding for Industrial Plants: Does Winning a ‘Million
Dollar Plant’ Increase Welfare?” NBER Working Paper 9844, July. Hackenberg, Robert A. 1995. “Conclusion: Joe Hill Died For Your Sins: Empowering Minority Workers
in the New Industrial Labor Force.” Chapter 11 in D. Stull, M. Broadway and D. Griffith (Eds.), Any Way You Cut It: Meat Processing and Small-Town America. Lawrence, KS: University of Kansas Press.
Hotchkiss, Julie L., Robert E. Moore and Stephanie M. Zobay. 2003. “Impact of the 1996 Summer
Olympic Games on Employment and Wages in Georgia.” Southern Economic Journal 69(3): 691-704.
Huffman, Wallace E. and John A. Miranowski. 1996. “Immigration, Meat Packing, and Trade:
Implications for Iowa.” Staff Paper #285, December. Leistritz, F. Larry and Randall S. Sell. 2001. “Socioeconomic Impacts of Agricultural Processing Plants.”
Journal of the Community Development Society 32(1):130-159. Otto, Daniel, Peter Orazem and Wallace Huffman. 1998. “Community and Economic Impacts of the
Iowa Hog Industry.” Chapter 6 in Iowa’s Pork Industry – Dollars and Scents. Ames, IA: Agriculture and Home Economics Experiment Station, PM-1746, p.25-28.
Schlosser, Eric. 2002. Fast Food Nation. New York, NY: Perennial.
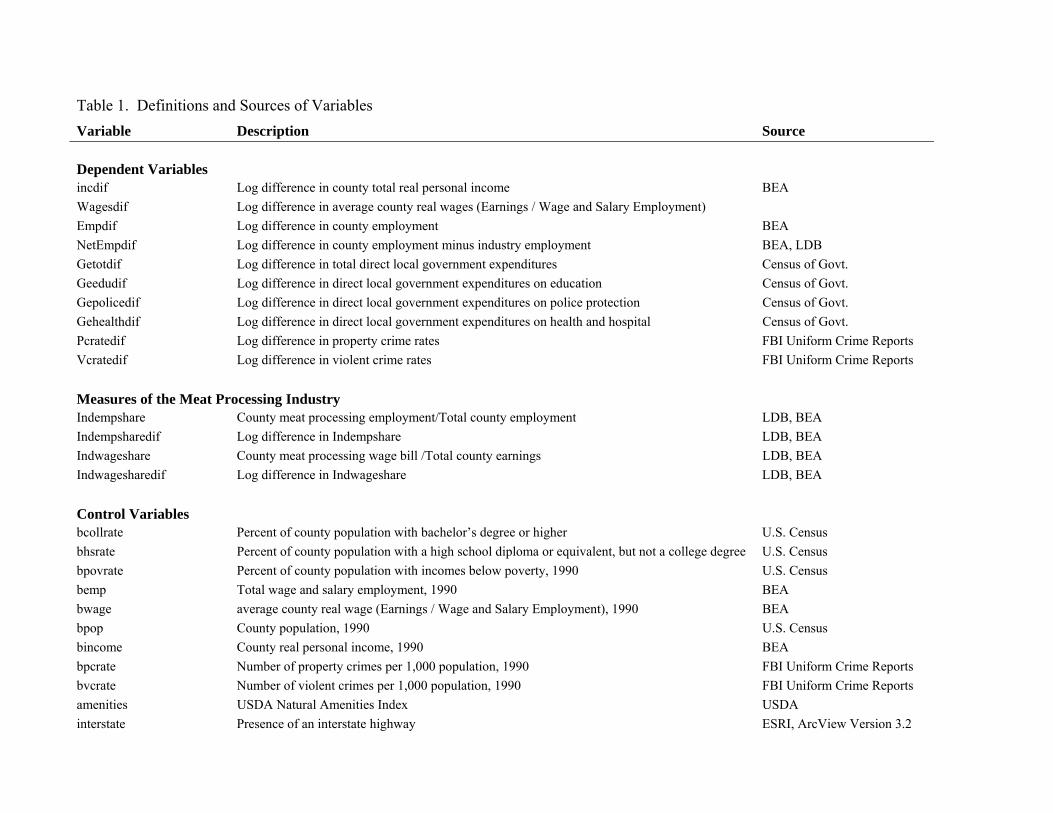
Table 1. Definitions and Sources of Variables Variable Description Source Dependent Variables incdif Log difference in county total real personal income BEA Wagesdif Log difference in average county real wages (Earnings / Wage and Salary Employment) Empdif Log difference in county employment BEA NetEmpdif Log difference in county employment minus industry employment BEA, LDB Getotdif Log difference in total direct local government expenditures Census of Govt. Geedudif Log difference in direct local government expenditures on education Census of Govt. Gepolicedif Log difference in direct local government expenditures on police protection Census of Govt. Gehealthdif Log difference in direct local government expenditures on health and hospital Census of Govt. Pcratedif Log difference in property crime rates FBI Uniform Crime Reports Vcratedif Log difference in violent crime rates FBI Uniform Crime Reports Measures of the Meat Processing Industry Indempshare County meat processing employment/Total county employment LDB, BEA Indempsharedif Log difference in Indempshare LDB, BEA Indwageshare County meat processing wage bill /Total county earnings LDB, BEA Indwagesharedif Log difference in Indwageshare LDB, BEA Control Variables bcollrate Percent of county population with bachelor’s degree or higher U.S. Census bhsrate Percent of county population with a high school diploma or equivalent, but not a college degree U.S. Census bpovrate Percent of county population with incomes below poverty, 1990 U.S. Census bemp Total wage and salary employment, 1990 BEA bwage average county real wage (Earnings / Wage and Salary Employment), 1990 BEA bpop County population, 1990 U.S. Census bincome County real personal income, 1990 BEA bpcrate Number of property crimes per 1,000 population, 1990 FBI Uniform Crime Reports bvcrate Number of violent crimes per 1,000 population, 1990 FBI Uniform Crime Reports amenities USDA Natural Amenities Index USDA interstate Presence of an interstate highway ESRI, ArcView Version 3.2
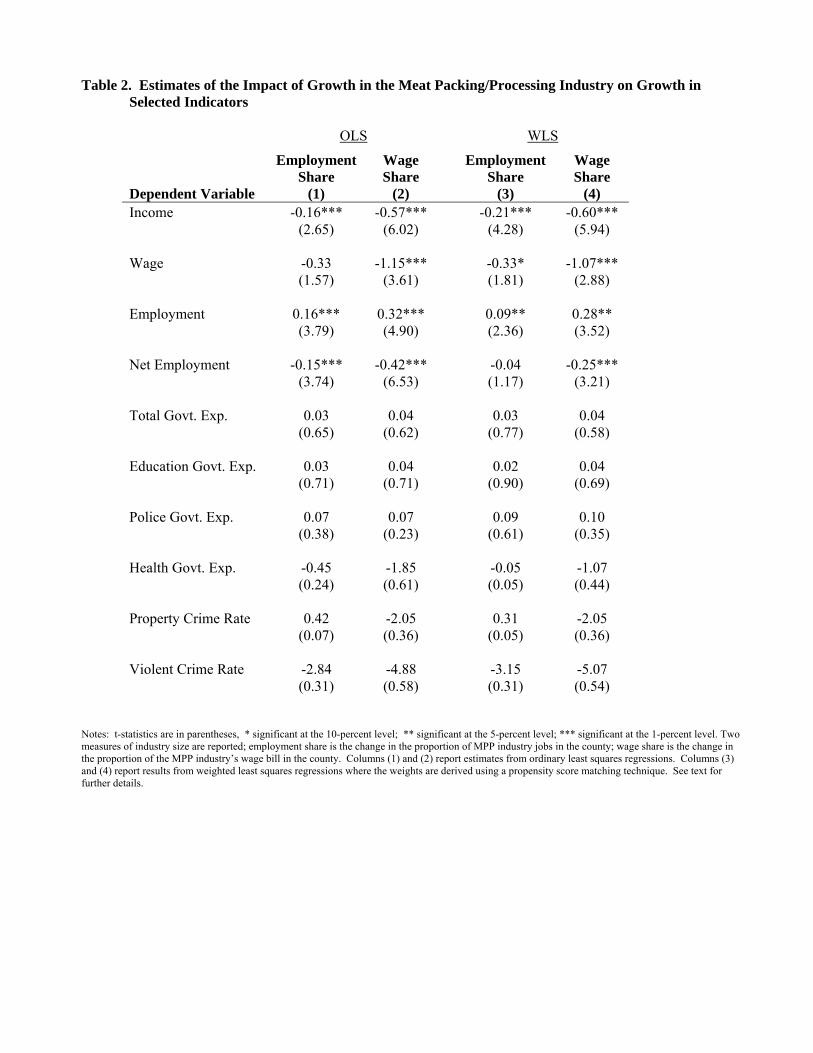
Table 2. Estimates of the Impact of Growth in the Meat Packing/Processing Industry on Growth in Selected Indicators
OLS WLS
Dependent Variable
Employment Share
(1)
Wage Share
(2)
Employment Share
(3)
Wage Share
(4) Income -0.16*** -0.57*** -0.21*** -0.60*** (2.65) (6.02) (4.28) (5.94) Wage -0.33 -1.15*** -0.33* -1.07*** (1.57) (3.61) (1.81) (2.88) Employment 0.16*** 0.32*** 0.09** 0.28** (3.79) (4.90) (2.36) (3.52) Net Employment -0.15*** -0.42*** -0.04 -0.25*** (3.74) (6.53) (1.17) (3.21) Total Govt. Exp. 0.03 0.04 0.03 0.04 (0.65) (0.62) (0.77) (0.58) Education Govt. Exp. 0.03 0.04 0.02 0.04 (0.71) (0.71) (0.90) (0.69) Police Govt. Exp. 0.07 0.07 0.09 0.10 (0.38) (0.23) (0.61) (0.35) Health Govt. Exp. -0.45 -1.85 -0.05 -1.07 (0.24) (0.61) (0.05) (0.44) Property Crime Rate 0.42 -2.05 0.31 -2.05 (0.07) (0.36) (0.05) (0.36) Violent Crime Rate -2.84 -4.88 -3.15 -5.07 (0.31) (0.58) (0.31) (0.54)
Notes: t-statistics are in parentheses, * significant at the 10-percent level; ** significant at the 5-percent level; *** significant at the 1-percent level. Two measures of industry size are reported; employment share is the change in the proportion of MPP industry jobs in the county; wage share is the change in the proportion of the MPP industry’s wage bill in the county. Columns (1) and (2) report estimates from ordinary least squares regressions. Columns (3) and (4) report results from weighted least squares regressions where the weights are derived using a propensity score matching technique. See text for further details.
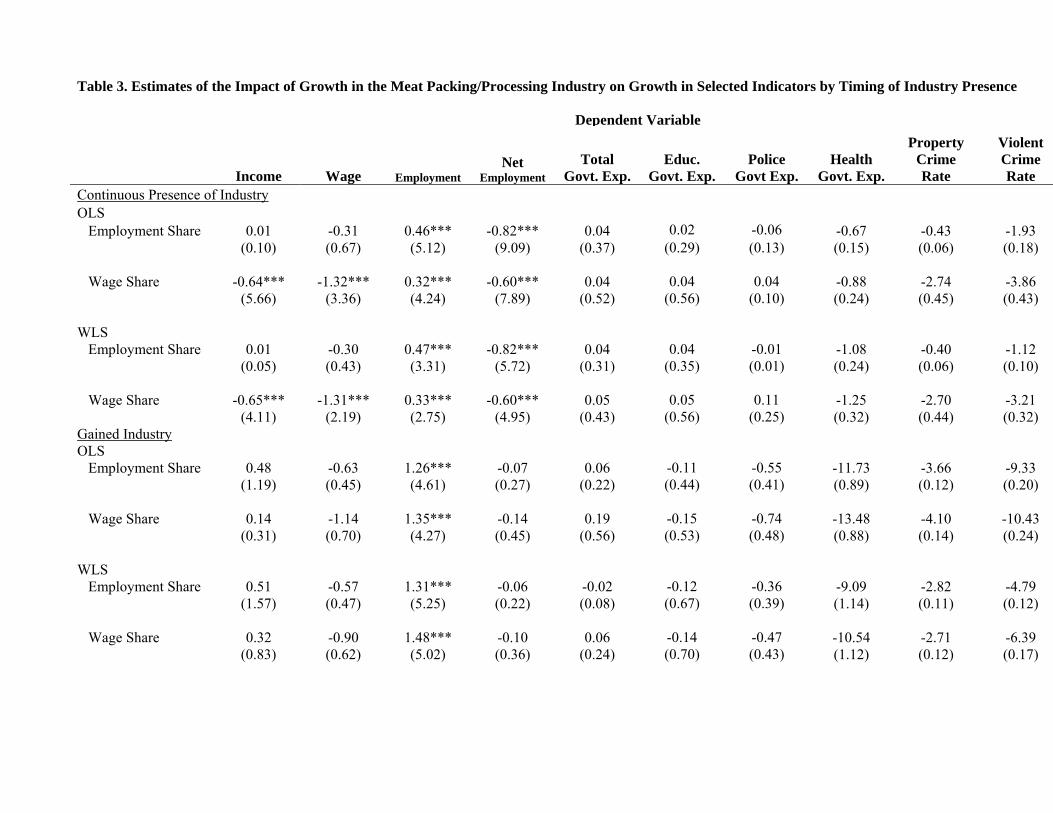
Table 3. Estimates of the Impact of Growth in the Meat Packing/Processing Industry on Growth in Selected Indicators by Timing of Industry Presence Dependent Variable
Income Wage Employment Net
Employment Total
Govt. Exp. Educ.
Govt. Exp. Police
Govt Exp. Health
Govt. Exp.
Property Crime Rate
Violent Crime Rate
Continuous Presence of Industry OLS Employment Share 0.01 -0.31 0.46*** -0.82*** 0.04 0.02 -0.06 -0.67 -0.43 -1.93 (0.10) (0.67) (5.12) (9.09) (0.37) (0.29) (0.13) (0.15) (0.06) (0.18) Wage Share -0.64*** -1.32*** 0.32*** -0.60*** 0.04 0.04 0.04 -0.88 -2.74 -3.86 (5.66) (3.36) (4.24) (7.89) (0.52) (0.56) (0.10) (0.24) (0.45) (0.43) WLS Employment Share 0.01 -0.30 0.47*** -0.82*** 0.04 0.04 -0.01 -1.08 -0.40 -1.12 (0.05) (0.43) (3.31) (5.72) (0.31) (0.35) (0.01) (0.24) (0.06) (0.10) Wage Share -0.65*** -1.31*** 0.33*** -0.60*** 0.05 0.05 0.11 -1.25 -2.70 -3.21 (4.11) (2.19) (2.75) (4.95) (0.43) (0.56) (0.25) (0.32) (0.44) (0.32) Gained Industry OLS Employment Share 0.48 -0.63 1.26*** -0.07 0.06 -0.11 -0.55 -11.73 -3.66 -9.33 (1.19) (0.45) (4.61) (0.27) (0.22) (0.44) (0.41) (0.89) (0.12) (0.20) Wage Share 0.14 -1.14 1.35*** -0.14 0.19 -0.15 -0.74 -13.48 -4.10 -10.43 (0.31) (0.70) (4.27) (0.45) (0.56) (0.53) (0.48) (0.88) (0.14) (0.24) WLS Employment Share 0.51 -0.57 1.31*** -0.06 -0.02 -0.12 -0.36 -9.09 -2.82 -4.79 (1.57) (0.47) (5.25) (0.22) (0.08) (0.67) (0.39) (1.14) (0.11) (0.12) Wage Share 0.32 -0.90 1.48*** -0.10 0.06 -0.14 -0.47 -10.54 -2.71 -6.39 (0.83) (0.62) (5.02) (0.36) (0.24) (0.70) (0.43) (1.12) (0.12) (0.17)
25
Table 3. Estimates of the Impact of Growth in the Meat Packing/Processing Industry on Growth in Selected Indicators by Timing of Industry Presence (continued) Dependent Variable
Income Wage Employment Net
Employment
Total Govt. Exp.
Educ. Govt. Exp.
Police Govt Exp.
Health Govt. Exp.
Property Crime Rate
Violent Crime Rate
Lost Industry
OLS Employment Share 0.29 0.18 0.32 -0.77*** -0.08 0.00 -0.35 -2.55 4.09 -2.81 (0.77) (0.13) (1.25) (3.03) (0.30) (0.01) (0.28) (0.21) (0.23) (0.07) Wage Share 0.21 0.16 0.20 -0.94*** -0.15 -0.04 -0.48 -1.74 3.64 -12.02 (0.48) (0.11) (0.68) (3.26) (0.49) (0.17) (0.34) (0.12) (0.14) (0.31) WLS Employment Share 0.31 0.16 0.34 -0.75* -0.06 0.00 -0.19 -1.98 4.18 -4.53 (0.60) (0.08) (0.85) (1.87) (0.17) (0.01) (0.13) (0.15) (0.23) (0.15) Wage Share 0.23 0.16 0.22 -0.91** -0.13 -0.04 -0.25 -1.25 3.61 -14.62 (0.38) (0.07) (0.49) (2.02) (0.33) (0.12) (0.15) (0.09) (0.14) (0.34) Both Gained and Lost OLS Employment Share -0.30*** -0.37 0.01 -0.01 0.01 0.00 0.01 0.17 1.07 -3.26 (4.49) (1.60) (0.11) (0.22) (0.28) (0.02) (0.05) (0.08) (0.23) (0.07) Wage Share -0.87*** -1.09* 0.03 -0.04 0.01 -0.02 -0.03 0.22 1.37 -7.24 (4.79) (1.72) (0.23) (0.36) (0.11) (0.15) (0.04) (0.04) (0.03) (0.12) WLS Employment Share -0.31*** -1.12** 0.00 -0.01 0.02 0.00 0.00 0.17 0.37 -4.41 (6.03) (2.10) (0.09) (0.19) (0.52) (0.17) (0.01) (0.14) (0.01) (0.09) Wage Share -0.90*** -1.09* 0.02 -0.03 0.03 0.00 -0.03 0.35 0.33 -8.36 (6.39) (1.72) (0.20) (0.26) (0.36) (0.04) (0.08) (0.10) (0.01) (0.12) Notes: t-statistics are in parentheses, * significant at the 10-percent level; ** significant at the 5-percent level; *** significant at the 1-percent level. Two measures of industry size are reported; employment share is the change in the proportion of MPP industry jobs in the county; wage share is the change in the proportion of MPP industry wage bill in the county. Counties are classified into five groups; continuous indicates the meat packing industry was present in the county continuously throughout the study period; gained indicates the county gained the industry; lost indicates the county lost the meat packing industry; both indicates the county both gained and lost the industry during the study period; the omitted category is counties that never had the industry between 1990 and 2000. OLS refers to ordinary least squares regressions. WLS refers to weighted least squares regressions where the weights are derived using a propensity score matching technique. See text for further details.
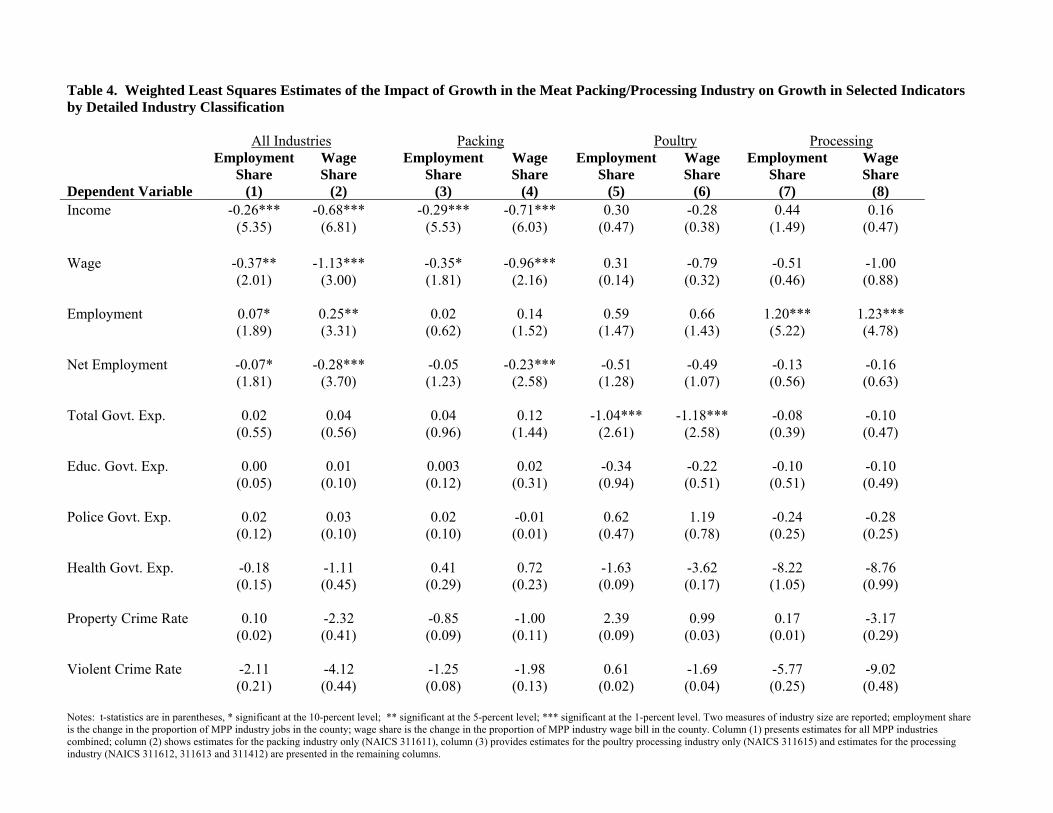
Table 4. Weighted Least Squares Estimates of the Impact of Growth in the Meat Packing/Processing Industry on Growth in Selected Indicators by Detailed Industry Classification All Industries Packing Poultry Processing
Dependent Variable
Employment Share
(1)
Wage Share
(2)
Employment Share
(3)
Wage Share
(4)
Employment Share
(5)
Wage Share
(6)
Employment Share
(7)
Wage Share
(8) Income -0.26*** -0.68*** -0.29*** -0.71*** 0.30 -0.28 0.44 0.16 (5.35) (6.81) (5.53) (6.03) (0.47) (0.38) (1.49) (0.47) Wage -0.37** -1.13*** -0.35* -0.96*** 0.31 -0.79 -0.51 -1.00 (2.01) (3.00) (1.81) (2.16) (0.14) (0.32) (0.46) (0.88) Employment 0.07* 0.25** 0.02 0.14 0.59 0.66 1.20*** 1.23*** (1.89) (3.31) (0.62) (1.52) (1.47) (1.43) (5.22) (4.78) Net Employment -0.07* -0.28*** -0.05 -0.23*** -0.51 -0.49 -0.13 -0.16 (1.81) (3.70) (1.23) (2.58) (1.28) (1.07) (0.56) (0.63) Total Govt. Exp. 0.02 0.04 0.04 0.12 -1.04*** -1.18*** -0.08 -0.10 (0.55) (0.56) (0.96) (1.44) (2.61) (2.58) (0.39) (0.47) Educ. Govt. Exp. 0.00 0.01 0.003 0.02 -0.34 -0.22 -0.10 -0.10 (0.05) (0.10) (0.12) (0.31) (0.94) (0.51) (0.51) (0.49) Police Govt. Exp. 0.02 0.03 0.02 -0.01 0.62 1.19 -0.24 -0.28 (0.12) (0.10) (0.10) (0.01) (0.47) (0.78) (0.25) (0.25) Health Govt. Exp. -0.18 -1.11 0.41 0.72 -1.63 -3.62 -8.22 -8.76 (0.15) (0.45) (0.29) (0.23) (0.09) (0.17) (1.05) (0.99) Property Crime Rate 0.10 -2.32 -0.85 -1.00 2.39 0.99 0.17 -3.17 (0.02) (0.41) (0.09) (0.11) (0.09) (0.03) (0.01) (0.29) Violent Crime Rate -2.11 -4.12 -1.25 -1.98 0.61 -1.69 -5.77 -9.02 (0.21) (0.44) (0.08) (0.13) (0.02) (0.04) (0.25) (0.48) Notes: t-statistics are in parentheses, * significant at the 10-percent level; ** significant at the 5-percent level; *** significant at the 1-percent level. Two measures of industry size are reported; employment share is the change in the proportion of MPP industry jobs in the county; wage share is the change in the proportion of MPP industry wage bill in the county. Column (1) presents estimates for all MPP industries combined; column (2) shows estimates for the packing industry only (NAICS 311611), column (3) provides estimates for the poultry processing industry only (NAICS 311615) and estimates for the processing industry (NAICS 311612, 311613 and 311412) are presented in the remaining columns.
IL
OH
MI
GA
IN
TN
MO
WI
MN
AL
CO
KY
OK
IA
MS
KS
ARNM
NE
MT
SD
ND
WY
Industry Share1990 Employment Share
Industry Not Present< 1%Between 1% and 5%Between 5% and 10%More than 10%Metro county
Figure 1 1990 Meat Packing & Processing Industry’s Share of Total County Employment
Average County Employment in the Industry, 1990-2000
241260 271 282 291
307 315333 336 344 352
135156 160
177 184 193 202 214 214 219 232
146 154 156 152 153 156 170194 204 203 198
507 520 511 506 508 516535
551581 583 587
0
100
200
300
400
500
600
700
1990 1991 1992 1993 1994 1995 1996 1997 1998 1999 2000
Year
Ave
rage
Em
ploy
men
t
All Industries Packing Processing Poultry
Figure 2
29
Average County -Industry Wage Bill
$4.3$4.6
$4.9 $5.0$5.3
$5.6 $5.6$6.1
$6.4$6.8 $6.9
$7.4$7.8 $7.8 $7.6 $7.8
$8.1 $8.1$8.6
$9.3$9.7 $9.6
$4.5$4.3$4.0
$3.8$3.7$3.5$3.2
$3.0$2.9$2.6
$4.8
$4.4
$4.5$4.0
$3.4$3.2$3.2$3.2
$3.3$3.2$3.0
$4.5
$-
$2
$4
$6
$8
$10
$12
1990 1991 1992 1993 1994 1995 1996 1997 1998 1999 2000
$Millions (base year = 1990)
Year
All Industries Packing Processing Poultry
Figure 3
Distribution of Predicted Livestock Processing Employment Share in 1990Treatment Counties versus Control Counties
-0.05
0
0.05
0.1
0.15
0.2
0.25
0.3
0.35
-0.02
8-0.
021
-0.01
4-0.
007
0.000
0.007
0.014
0.021
0.028
0.035
0.042
0.049
0.057
0.064
0.071
0.078
0.085
0.092
0.099
0.106
0.113
More
Predicted Employment Share
Perc
ent o
f Cou
ntie
s
ControlTreatment
Figure 4
Appendix A Description of Industries NAICS 311611: Animal (except Poultry) Slaughtering. This U.S. industry comprises establishments primary engaged in slaughtering animals (except poultry and small game). Establishments that slaughter and prepare meats are included in this industry.
NAICS 311612: Meat Processed from Carcasses. This U.S. industry comprises establishments primarily engaged in processing or preserving meat and meat byproducts (except poultry and small game) from purchased meats. This industry includes establishments primarily engaged in assembly cutting and packing of meats (i.e., boxed meats) from purchased meats.
NAICS 311613: Rendering and Meat Byproduct Processing. This U.S. industry comprises establishments primarily engaged in rendering animal fat, bones, and meat scraps.
NAICS 311615: Poultry Processing. This U.S. industry comprises establishments primarily engaged in (1) slaughtering poultry and small game and/or (2) preparing processed poultry and small game meat and meat byproducts
NAICS 311412: Frozen Specialty Food Manufacturing. This U.S. industry comprises establishments primarily engaged in manufacturing frozen specialty foods (except seafood), such as frozen dinners, entrees, and side dishes; frozen pizza; frozen whipped topping; and frozen waffles, pancakes, and french toast.
1 According to data from the 2001 County Business Patterns, 64% of poultry processing firms had more than 100 employees; 17% had 1,000 employees or more. In contrast, only 8% of animal (except poultry) slaughtering firms have more than 100 employees. The corresponding percentages for other meat processing firms are: 20% of firms classified as ‘meat processed from carcasses’ and 6% of rendering and meat by-product processing firms. 2 The data are not publicly available, but research using the data was permitted upon approval of an application to the Department of Labor. Only the aggregated results can be released to the public. The research was carried out at the Bureau of Labor Statistics (BLS) in Washington, D.C. in 2004. (See http://www.bls.gov/bls/blsresda.htm for more details.) 3 See Appendix A for a description of these industry classifications. 4 We also experimented with propensity scores based on the presence or absence of an MPP plant as opposed to the employment share. The fit of the probit was poor and generated few significant coefficients, suggesting that the presence of a plant was close to a random event. Employment share equations provided greater variation in the dependent variable and a better fit. 5 As Otto, Orazem and Huffman point out in an analysis of the community and economic impacts of the hog industry in Iowa, it is the relative change in crime rates that matters. Although crime may be rising in counties with a meat packing plant, if crime rates are rising in all other counties as well, the rise in crime can not be attributed to the presence of the packing plant. “Numerous complaints have been registered regarding increases in criminal activity in areas that have meat packing plants. Incidence of violent crime rose 56 percent in Louisa County between 1980 and 1990. However, this is only a marginally greater increase in criminal activity than the statewide increase of 49 percent during the same period. More telling, violent crimes rates rose an average of 168 percent in the seven counties that lost meat packing plants. So if meat packing is to be associated with increased criminal activity, it is the loss of the industry rather than its expansion that is to blame.”