Embed Size (px)
Citation preview

1 / 31
Mechanical characterization of dry-stack masonry made
of CEBs stabilised with alkaline activation
Rui A. Silvaa,†, Edgar Soaresa, Daniel V. Oliveiraa, Tiago Mirandaa, Nuno M. Cristelob, Dinis
Leitãoc
a ISISE, University of Minho, Department of Civil Engineering, Guimarães, Portugal
b C-MADE, University of Trás-os-Montes e Alto Douro, School of Sciences and Technology,
Vila Real, Portugal
c C-TAC, University of Minho, Department of Civil Engineering, Guimarães, Portugal
Abstract: The increasing interest on earth construction as a sustainable building solution led to the development
of modern earth construction techniques, in particular of masonry made of compressed earth blocks (CEBs). The
traditional chemical stabilisation of the soil is a frequently used improvement process. However, such process
increases significantly the embodied energy of the CEBs. This paper presents an alternative technique for the
stabilisation of CEBs, based on alkali activation of fly ash. The mechanical behaviour of the CEBs and of the
respective dry stack masonry is comprehensively investigated through an experimental program, during which
this technique proved to be highly effective.
Highlights:
- Manufacturing of CEBs with granitic residual soil requires chemical stabilisation.
- The alkali activation of fly ash was tested as a stabilisation technique.
- The alkali activation improves substantially the strength of the CEBs.
- The stabilisation of CEBs by alkaline activation can be further optimised.
Keywords: CEB, granitic residual soil, mechanical characterization, sustainability, alkaline activation, fly ash
† Corresponding author: Department of Civil Engineering, University of Minho, Azurém, 4800-058 Guimarães,
Portugal. Tel.: +351 253 510 200; fax: +351 253 510 217.
E-mail address: [email protected]

2 / 31
1. INTRODUCTION
Raw earth has been used to build sheltering since ancient times [1]. Nowadays, building with
earth continues to be a popular solution in many developing countries, such as Peru, Angola,
Mozambique, Yemen, Iran, India and China. In fact, this building material constitutes the
only feasible alternative in many situations. On the other hand, the use of earth construction
fell into disuse during the past century in many developed countries, such as Portugal, Spain,
France and Germany. Earth construction has been continuously replaced by modern
constructions integrating stronger materials, as reinforced concrete and fired brick, but whose
CO2 emissions are also much higher. Despite that, the current importance of earth
construction in the World is still very high, as about one fourth of the World’s population is
estimated to live in earthen dwellings [2]. Furthermore, earth constructions are usually
associated to vernacular architecture, since local soils are typically used by local populations.
This means that a large diversity of traditional building techniques exist and reflect several
features, such as differences between soils, and social, cultural and economic backgrounds of
the populations. Among the traditional building techniques, adobe and rammed earth are the
most popular ones [1].
Earth construction is a sounding topic nowadays, with growing interest due to the high
sustainability (low CO2 emissions and capacity to return the earthen materials back to nature
after their life-cycle), thermal and acoustic performance, fire resistance and cost of the raw
material (soil) [3]. In fact, earth construction can constitute a feasible solution for a more
sustainable construction industry in developed countries. However, the major drawback is that
traditional earthen materials are typically considered as non-standard. The great variability
and heterogeneity of the properties of the available soils, the lack of quality control in the
manufacturing of the earthen materials and in the construction process can be pointed out as
the main reasons behind this situation. Furthermore, only few countries issued standards and

3 / 31
recommendations supporting earth construction (eg.: NZS 4297 [4], NZS 4298 [5], NZS 4299
[6], UNE 41410 [7], HB 195 [8], E.080 [9]), discouraging the design of earth construction by
the technical community in countries where these documents are absent. As a consequence,
earthen materials are usually associated with poor mechanical properties, low seismic
performance and poor durability against water. These materials are also associated to poverty
and to the subsistence construction usually found in developing countries. These aspects lead
to little acceptance of earth construction by potential owners in developed countries.
Traditional earth construction has been successively subjected to improvement of the earthen
materials and building techniques in order to overcome the aforementioned limitations.
Masonry built with compressed earth blocks (CEBs) is probably the most relevant case of
improvement introduced in the earth construction technology, as these blocks can be seen as
an upgrade of the adobes. CEBs are manufactured resorting to specific presses, where the
moistened earth is statically compacted in a mould to form the block, which is immediately
demoulded and put to dry. This technique was introduced in the nineteen fifties with the
development of a specific manual press, which became worldwide known as CINVA-RAM
[10]. This procedure allows the strict control of the geometrical features of the CEBs and a
significant improvement of the mechanical properties. Nowadays, hydraulic presses can be
used instead [11], allowing higher compaction pressure and thus increased mechanical
properties [12].
The chemical stabilisation of the soil by addition of cement and lime is often used in the
manufacturing of CEBs to increase the mechanical properties of the CEBs and their resistance
to water. This procedure is particularly interesting in the cases where the available soil does
not meet adequate properties. Nevertheless, the chemical stabilisation is systematically used,
even in soils with adequate properties [1]. On the other hand, the addition of cement and lime
increases substantially the cost and the embodied energy of the CEBs, making this solution

4 / 31
less competitive [13-14]. The use of geopolymeric binders obtained from alkaline activation
has shown lower CO2 emissions than cement based binders, without compromising properties
such as strength and durability [15]. A similar result is expected when applying this technique
in the stabilisation of soils. Roughly speaking, the stabilisation process consists in the mixing
of the soil with a geopolymer binder, which hardens and forms a matrix that involves and
binds the particles in a soil-binder interface that usually delivers strength levels higher than
the soil alone. In general terms, the alkaline activation process consists in a reaction between
alumina-silicate materials and alkali or alkali earth substances (constituting the alkaline
activator), namely: ROH, R(OH)2, R2CO3, R2S, Na2SO4, CaSO4.2H2O, R2(n)SiO2, in which R
represents an alkaline metal like sodium (Na+) or potassium (K+), or an alkaline earth metal
like calcium (Ca2+). This reaction is followed by a polycondensation process, in which the
silica (SiO2) and alumina (AlO4) tetrahedra interconnect and share the oxygen ions. The
resulting polymer structure of Al–O–Si bonds constitutes the main structure of the hardened
geopolymer matrix, which is very similar at a molecular level to natural rocks, sharing their
stiffness, durability and strength. Fly ash is probably the most popular alumina-silicate raw
source used in alkaline activation, but others can be mentioned such as high-furnace slag and
metakaolin [16]. The first two are industrial by-products, meaning that they produce zero CO2
emissions and their use is a way to valorise them in the building industry. Therefore, most of
the environmental impact of the alkaline activation technique resides in the production of the
alkaline activator compounds, namely sodium hydroxide and sodium silicate [17].
The chemical stabilisation of soils with alkaline activation of fly ash is a topic being studied
recently in geotechnical applications [18-19] and in rammed earth construction [20]. The
mentioned studies have been able to demonstrate that the stabilisation of soils with this
technique can deliver similar or higher mechanical performance than that obtained from the
addition of lime or cement [19]. Therefore, the integration of the alkaline activation of fly ash

5 / 31
in the production of CEBs contributes for the mitigation of the environmental impact
associated with more traditional chemical stabilisation (usually achieved with cement), while
maintaining the mechanical performance standards. In practical terms, this means that the use
of this industrial by-product associated to a control of the incorporated alkaline activator
compounds is expected to result in CEBs with lower embodied energy. For instance, Cristelo
et al. [21] show that the use of alkaline activation of fly ash in grouts for jet mix columns
produces only 77% of CO2 of the equivalent solution with a cement-based grout.
This paper presents an experimental program where the mechanical behaviour of dry-stack
masonry made of CEBs stabilised with alkaline activation of fly ash is assessed in detail. The
CEBs were manufactured with granitic residual soil (GRS), typical from northern Portugal,
and using two different percentages of fly ash (10% and 15%). The individual CEBs were
tested under compression and three-point bending (in dry and saturated conditions). The
respective masonry was additionally tested for compression and shear behaviour.
2. EXPERIMENTAL PROGRAM
2.1 Geometry of the CEBs and masonry system
The geometry of the CEBs and the respective building system was based on an output from a
previous partnership between the University of Minho and the company Mota-Engil SA. The
aim of the project was the development of a simple and innovative solution for the
construction of sustainable buildings in seismic countries, which took Malawi as a case study
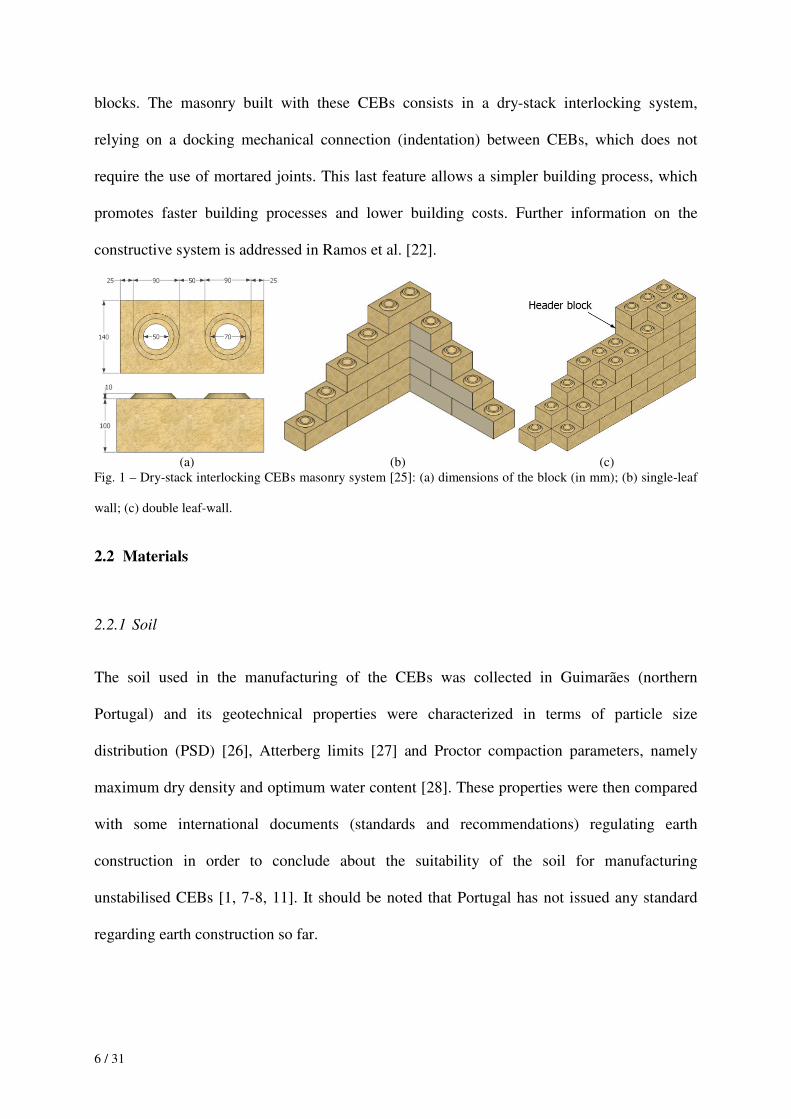
[22]. The geometry of the CEBs consists in a hollow block, see Fig. 1, which allows to build
single- and double-leaf walls. According to Minke [23] and the Auroville Earth Institute [24],
this type of CEB is recommended for regions with non-negligible seismic hazard, because the
holes allow the introduction of vertical reinforcement and to decrease the self-weight of the
6 / 31
blocks. The masonry built with these CEBs consists in a dry-stack interlocking system,
relying on a docking mechanical connection (indentation) between CEBs, which does not
require the use of mortared joints. This last feature allows a simpler building process, which
promotes faster building processes and lower building costs. Further information on the
constructive system is addressed in Ramos et al. [22].
(a) (b) (c)
Fig. 1 – Dry-stack interlocking CEBs masonry system [25]: (a) dimensions of the block (in mm); (b) single-leaf
wall; (c) double leaf-wall.
2.2 Materials
2.2.1 Soil
The soil used in the manufacturing of the CEBs was collected in Guimarães (northern
Portugal) and its geotechnical properties were characterized in terms of particle size
distribution (PSD) [26], Atterberg limits [27] and Proctor compaction parameters, namely
maximum dry density and optimum water content [28]. These properties were then compared
with some international documents (standards and recommendations) regulating earth
construction in order to conclude about the suitability of the soil for manufacturing
unstabilised CEBs [1, 7-8, 11]. It should be noted that Portugal has not issued any standard
regarding earth construction so far.

7 / 31
Fig. 2 presents the PSD curve of the soil and compares it with the envelope provided by Viana
da Fonseca [29], regarding GRS from Porto, also located in northern Portugal. In general, the
PSD curve of the soil fits within the envelope, meaning that both soils are similar.
Fig. 2 – PSD curve of the soil and comparison with the envelope presented by Viana da Fonseca [29] for GRS
from Porto (northern Portugal).
In Fig. 3, the obtained PSD curve is plotted against envelopes relative to the manufacturing of
CEBs, recommended by Houben and Guillaud [1] and by the standard UNE 41410 [7]. In
both cases the low fines’ content is highlighted, particularly its clay fraction of 4% (≤
0.002 mm). The clay content of the soil is clearly inferior to the minimum values
recommended by most of the documents regulating CEB construction. For instance, the HB
195 [8] recommends a soil with a minimum clay percentage of about 10% in order to
manufacture unstabilised CEBs. The UNE 41410 [7] requires the same minimum percentage,
but a more restrictive criterion is given by discarding the use of any soil with inferior clay
percentage. Even in the case of stabilised CEBs, the less restrictive HB 195 [8] recommends a
clay percentage higher than 5%. In practical terms, the low clay percentage of the soil means
that the CEBs may experience insufficient strength and resistance against water. Furthermore,
problems in the manufacturing of the CEBs are also expected in terms of productivity. The
initial cohesion provided by the clay fraction might be insufficient to allow the immediate
handling of the blocks. Regarding the maximum particle size of the available soil, it was

8 / 31
concluded that it is inferior to the 25 mm and 20 mm limits, as recommended by HB 195 [8]
and UNE 41410 [7], respectively, thus not requiring sieving.
As for the Atterberg limits, the liquid limit (LL) of the soil is approximately 28% and the
plastic limit (PL) could not be determined, meaning that the soil is classified, in terms of
plasticity, as non-plastic. This lack of plasticity of the soil indicates insufficient clay content,
confirming its unsuitability.
The maximum dry density (γd) and optimum water content (OWC) are 1.71 g/cm3 and 12%,
respectively. According to Doat et al. [11], the dry density found corresponds to a low value,
which is expected to result in an earthen material with fairly poor performance
(1.65 g/cm3<γd<1.76 g/cm3). In fact, the unconfined compressive strength of the soil was
tested in a previous work [20], where the average value obtained (0.43N/mm2) was very low.
Therefore, the soil is unsuitable for manufacturing unstabilised CEBs and its use would
require forcibly chemical stabilisation. As stated before, the chemical stabilisation of the
CEBs tested in this experimental program was carried out by means of a geopolymer binder
resulting from the alkaline activation of fly ash, whose constituting materials are described in
the following sections. The soil incorporated in the manufacturing of the CEBs was air dried
in advance, and no sieving was performed.
(a) (b)
Fig. 3 – Comparison between the PSD curve of the soil and the envelopes for CEB construction recommended
by: (a) Houben and Guillaud [1]; (b) UNE 41410 [7].

9 / 31
2.2.2 Fly ash
The fly ash used in the stabilisation of the CEBs was obtained from a Portuguese thermo-
electric power plant (PEGOP). The chemical composition of the fly ash was determined by
means of EDS analysis and is presented in Table 1. Three different samples were used to
perform the EDS analysis, and 10 acquisition points were considered per sample. The values
presented are the average of those 30 acquisition points. The fly ash is characterized by a
mass of silica and alumina of about 71% and a calcium content low enough to classify it as
type F (<5%). A scanning electron microscopy (SEM) image of the fly ash is presented in Fig.
4, showing the spherical shape of the particles, with an average diameter estimated at about
11.64 µm.
Table 1 – Chemical composition of the fly ash (from EDS analysis).
Element Si Al Na Mg P S K Ca Ti Fe
(%) 48.8 21.8 1.3 1.6 0.6 1.2 4.4 3.9 1.8 14.7
Fig. 4 – SEM image of the fly ash [30].
2.2.3 Alkaline activator
The alkaline activator was fabricated by mixing a solution of sodium hydroxide with a
solution of sodium silicate, in a 2:1 proportion, respectively. The sodium hydroxide was

10 / 31
originally acquired in flake form, with a density of 2.13 g/cm3 at 20ºC, and 95-99% purity,
and was dissolved in water to achieve a concentration of 12.5 molal. The sodium silicate was
acquired in solution form, with a density of 1.45 g/cm3, a sodium oxide (Na2O) content of
13% and a SiO2:Na2O ratio of about 2.
2.3 Manufacturing of CEBs
The two compositions of the mixtures used in the manufacturing of the CEBs are summarized
in Table 2. These mixtures were selected from a set of trial-and-error mixtures tested in a
previous research work [31], where SFA10 and SFA15 seemed to present adequate
workability and mechanical strength for manufacturing CEBs. It should be noted that the
incorporated percentage of fly ash is the main variable distinguishing both mixtures, where
SFA10 and SFA15 incorporate 10% and 15%, respectively. Furthermore, the activator/fly ash
ratio was defined to be slightly higher than the OWC of the soil in order to take into account
the effect of the addition of the fine particles of fly ash in the workability of the mixtures.
Table 2 – Composition of the mixtures used in the manufacturing of the CEBs.
Mixture Soil (wt.%) Fly ash (wt.%) Activator/solids (wt.%) Na2O/fly ash (-)
SFA10 90.0 10.0 13.4 0.250 SFA15 85.0 15.0 13.7 0.170
The CEBs were manufactured using a Terstaram manual press (Fig. 5a), which allows
applying a pressure higher than 2 N/mm2. The mixtures were prepared in a vertical shaft
mixer with free spinning trident paddles. The soil and the fly ash were first dry-mixed until
total homogenisation was reached (~5min). Then, all the activator was added and the mixing
continued until homogenisation occurred again (~5min). Each mixture was then used to
prepare a batch of ten CEBs. Production control was made in terms of weight of mixture
required to perform each CEB, instead of using the respective volume, aiming the
minimisation of the CEBs properties’ variability.

11 / 31
After compaction, the CEBs were left to cure on the floor for about 3 days and then were
packed until testing. The curing of the CEBs occurred under laboratory conditions at a
temperature of 20±2ºC and exposed to air. This resulted in the occurrence of some
efflorescence at the exposed surfaces of the CEBs, as a consequence of the sodium
carbonation. Such behaviour seemed to have only a slight visual impact on the colour,
changing from dark grey to light grey. A total of 80 CEBs per mixture were produced.
After compaction, it was possible to handle immediately the CEBs of both mixtures (Fig. 5b),
despite their slightly dry appearance not allowing the execution of a successful trial of the
drop ball [5]. This means that this typical test, used to calibrate the consistency at the start of
the compaction, is not adequate for these mixtures. Furthermore, the adopted percentages of
fly ash allowed to achieve adequate fraction of fines required for the production of CEBs. It
should be noted that mixtures with less than 10% of fly ash would not allow the manufacture
of the CEBs. This conclusion is supported by the fact that some CEBs made with mixture
SFA10 crumbled when handled.
(a) (b)
Fig. 5 – Manufacturing of the CEBs: (a) Terstaram press; (b) CEB after compaction.

12 / 31
2.4 Testing procedure
2.4.1 Methodology
The experimental program included the testing of individual CEBs and of single-leaf dry-
stack prisms, after a curing period of 180 days. The CEBs were tested individually for
compression and flexural strength (three-point bending test), while the prisms were tested
under compression and shear loading. The testing of single CEBs occurred in two different
conditions, since some specimens were submerged in water for 24h prior to the test (up until
30 min before the test), while the remaining blocks were tested in curing conditions.
2.4.2 Compression tests (CEBs)
The compression tests of single CEBs were carried out according to EN 772-1 [32], but the
load was applied under displacement control at a rate of about 4 µm/s. Four specimens were
tested for each mixture and moisture condition (air dry and saturated), in a total of sixteen.
The top and bottom platens from the press mould were used as testing platens in order to
ovoid cutting and capping the specimens, see also Fig. 1. These platens have the same shape
of the CEBs, meaning that they are able to distribute uniformly the load on the top and bottom
surfaces of the specimens (Fig. 6a).
(a) (b)
Fig. 6 – Testing of the individual CEBs under: (a) compression; (b) three-point bending.

13 / 31
2.4.3 Three-point bending tests (CEBs)
The three-point bending tests were carried out according to EN 772-6 [33], but adjustments to
the setup were carried out by taking into account the HB 195 [8]. A small notch was made on
the CEBs surface before testing, resorting to a circular saw operated in dry conditions. The
notch depth and width were of about 10 mm and 3.5 mm, respectively. This procedure aimed
to force the failure surface to occur at middle span, therefore avoiding the hollow sections.
The specimens were supported by cylindrical metallic rollers, featuring a 220 mm span. The
load was applied at middle span, under displacement control at a rate of about 2 µm/s. The
deflection at middle span and the crack opening at the notch were measured by means of
Linear Variable Differential Transducers (LVDTs), see Fig. 6b. Four CEBs were tested for
each composition and moisture condition (air dry and saturated), in a total of sixteen
specimens.
2.4.4 Compression tests (prisms)
The compression behaviour of the CEB masonry of both mixtures was assessed by means of
compression tests on dry-stack prisms of five blocks, with average dimensions of about
280 x 500 x 100 mm3 (width x height x thickness). The slenderness of the prisms was of
5:1.4, meaning that the confinement effect introduced by the testing platens is practically
insignificant. The testing of this type of arrangement, when compared with that of a full wall,
has the advantage of being both simpler to install and to demand a lower loading capacity. On
the other hand, it should be noted that the prism specimens are not totally representative of the
masonry pattern. The tests were carried out according to ASTM C1314-03b [34], but the load
was applied under displacement control at a rate of about 5 µm/s. The platens from the mould
of the press were also used in this test. Four prisms were tested for each mixture, in a total of
eight. Only the air dry condition was taken into account for this case. The vertical

14 / 31
displacements were measured between the second and the fourth block by means of two
LVDTs placed on each face of the prism (see Fig. 7a).
(a) (b)
Fig. 7 – Testing of the CEBs masonry prisms under: (a) compression; (b) shear.
2.4.5 Shear tests (prisms)
The shear behaviour of the CEB masonry of both mixtures was assessed by means of shear
tests on dry-stack prisms of three CEBs, with average dimensions of about
280 x 300 x 100 mm3 (width x height x thickness) (see Fig. 7b). The tests were carried out
according to EN 1052-3 [35], using three levels of pre-compression stress, namely
0.20 N/mm2, 0.60 N/mm2 and 0.85 N/mm2. The first two levels are specified in the
aforementioned standard for masonry units with compressive strength higher than 10 N/mm2,
while the third level was reduced relatively to the standard due to load limitations of the axial
actuator (pre-compression stress). The shear load was applied by means of an actuator parallel
to the joints under displacement control at a rate of about 10 µm/s. The relative shear
displacement of the middle block was measured by means of two LVDTs, while the axial
displacements between the top and bottom blocks were measured by means of two LVDTs
attached on each face of the prism. Four prisms were tested for each mixture and level of pre-
compression stress, in a total of twenty four specimens.

15 / 31
3. RESULTS AND DISCUSSION
3.1 Compression tests (CEBs)
Table 3 presents the results of the compression tests carried out on the single CEBs, where γb
is the air dry density of the blocks, f dc,u is the average compressive strength of the specimens
tested under air dry condition and f sc,u is the average compressive strength of the specimens
tested under saturated condition. It should be noted that all stress values presented in the paper
were computed by taking into account the net area of the CEBs. The typical failure mode of
the specimens was characterized by the formation of a pyramidal-trunk, which is explained by
the confinement introduced by the loading platens (Fig. 8).
Table 3 – Results of the compression tests on single CEBs (the average values (4 specimens) are given and
coefficient of variation is presented in brackets).
Mixture γb (kg/m3) f dc,u (N/mm2) f sc,u (N/mm2) f sc,u / f dc,u
SFA10 1810 (1%) 8.8 (11%) 5.6 (10%) 0.64 SFA15 1854 (1%) 12.0 (8%) 8.0 (21%) 0.67
The CEBs manufactured with mixture SFA15 obtained higher compressive strength values
than those obtained by mixture SFA10, namely 1.36 and 1.42 times higher for f dc,u and f s
c,u,
respectively. The higher performance of mixture SFA15 is mainly explained by its higher
percentage of incorporated geolpolymer binder and, in addition, by the higher density of the
respective blocks. The low values of the coefficient of variation are also worth to be
mentioned, since this means that the stabilisation process was capable of mitigating the
intrinsic variability of soil-based products.
With respect to the CEBs tested under saturated condition, the water intake was, on average,
of about 5.5% and 6.5% for the mixtures SFA10 and SFA15, respectively. This means that
the open porosity of the CEBs of both mixtures is similar and not very high. The reduction of
the compressive strength in saturated conditions was also similar in both mixtures, namely

16 / 31
0.64 and 0.67 times for mixtures SFA10 and SFA15, respectively. Both cases correspond to
an important decrease in strength. Nevertheless, the minimum value obtained for f sc,u was of
about 4.9 N/mm2 (SFA10).
Fig. 8 – Typical failure mode of the single CEBs tested under compression.
In general, common sense indicates that the minimum value of the compressive strength of
earthen materials (dry) should not be less than 2 N/mm2 [1], which is a requirement respected
by the CEBs tested. In fact, international documents regulating CEBs masonry construction
can be less demanding. For instance, the New Zealand standard NZS 4298 [5] requires a
minimum compressive strength of about 1.52 N/mm2 (it takes into account the aspect ratio of
the CEB) for CEBs used in standard grade earth constructions. The Spanish standard UNE
41410 [7] follows a similar trend, since it requires that the lowest class provided (BTC 1)
delivers a normalized compressive strength (5% fractile) higher than 1.3 N/mm2. Still,
according to this standard, the highest class provided (BTC 5) requires a normalised
compressive strength (5% fractile) higher than 5 N/mm2. It should be noted that the
normalized compressive strength of each specimen is obtained by multiplying the
compressive strength by a shape factor (0.92). Unfortunately, the few tests carried out do not
allow performing a reliable statistical analysis to compute the 5% fractile, as depicted in UNE
41410 [7]. Nevertheless, the lowest value obtained for the normalized strength was of about
7.3 N/mm2 (mixture SFA10), meaning that CEBs of both mixtures can be classified as BTC 5.

17 / 31
The results obtained show that the compressive strength of the blocks tested is substantially
higher than that of typical CEBs. For example, for CEBs stabilised with 5-10% cement,
Walker and Stace [36] reported compressive strength values varying between 0.30 N/mm2 and
7.11 N/mm2. Moreover, there is still a large margin to optimise the composition of the
alkaline activator, in order to reduce the cost and the environmental impact of the stabilisation
solution, and still meet the mechanical demands. On the other hand, the levels of compressive
strength of the CEBs tested may compete with those of standard masonry units in terms of
mechanical performance. For instance, Mohamad [37] reported that the concrete block units
found in the USA and Brazilian markets present compressive strength values higher than
4.5 N/mm2. Thus, the performance obtained for the CEBs unravels the potential of the use of
the alkaline activation in the industry for production of masonry units.
3.2 Three-point bending tests (CEBs)
Table 4 presents the results of the three-point bending tests carried out on single CEBs, where
f db,u is the average flexural strength of the specimens tested under air dry condition and f sb,u is
the average flexural strength of the specimens tested under saturated condition. Both
parameters were computed using the expression presented in EN 772-6 [33], taking into
account the height reduction introduced by the notch. The failure of all specimens occurred at
the middle span cross-section and the failure crack followed a vertical plane, meaning that the
notch operated served its purpose (see Fig. 9). In the case of the CEBs tested under air dry
condition, failure was brittle, since the specimens failed instantly after a very short plastic
phase. On the other hand, the saturation of the CEBs resulted in a softer failure, which was
more evidenced in the CEBs with lower strength. This modification of behaviour is shown in
Fig. 10, where are presented curves load –deflection and load-crack opening of a selected
specimen representing each situation.

18 / 31
Table 4 – Results of the three-point bending tests on single CEBs (the average values (4 specimens) are given
and coefficient of variation is presented in brackets).
Mixture γb (kg/m3) f db,u (N/mm2) f sb,u (N/mm2) f sb,u / f db,u
SFA10 1810 (1%) 1.8 (14%) 0.7 (36%) 0.40 SFA15 1854 (1%) 2.3 (11%) 1.1 (9%) 0.49
Fig. 9 – Typical failure mode of the single CEBs tested under three-point bending.
Both flexural strength values obtained for CEBs manufactured with mixture SFA15 are higher
than those obtained for the CEBs manufactured with mixture SFA10. The same reasons
pointed out before for the compressive test results can also be listed for this case, namely the
higher percentage of geopolymer binder and the slightly higher density of the CEBs
manufactured with mixture SFA15. It should be noted that the low values obtained for the
coefficient of variation continue to show the capacity of the stabilisation process in mitigating
the effect of the intrinsic variability of the GRS.
(a) (b)
Fig. 10 – Representative curves of the three-point bending tests (selected specimens): (a) load-deflection; (b)
load-crack opening.

19 / 31
Unlike the compressive strength, the flexural strength parameter of the CEBs deserves little
attention in the most relevant international documents regulating earth construction.
Nevertheless, according to the NZS 4298 [5], the flexural strength can also be used to verify
the minimum strength standards of the CEBs. With this respect, the minimum value required
for the flexural strength is of 0.25 N/mm2, which is a criteria largely exceeded by the CEBs of
both mixtures. According to NZS 4297 [4], the compressive strength can be estimated as 3.5
times the flexural strength. This relation corresponds to a safe estimation (underestimation) of
the compression strength in this work, since the respective values for mixture SFA10 and
SFA15 were 4.9 N/mm2 and 5.2 N/mm2.
3.3 Compression tests (masonry prisms)
The results of the compression tests carried out on the masonry prisms are summarized in
Table 5, in terms of average compressive strength (fc,p) and average Young’s modulus (E0,p).
The last parameter was computed between 5% and 30% of the compressive strength by linear
fitting of the respective compression stress-axial strain curves, which are presented in Fig. 11.
These curves are characterized by an initial adjustment phase, which is related with the
accommodation between CEBs at the dry joints. It should be noted that some curves are
incomplete due to early detachment of the LVDTs from the blocks caused by damage of the
specimens.
Table 5 – Results of the compression tests on the masonry prisms (the average values (4 specimens) are given
and coefficient of variation is presented in brackets).
Mixture fc,p (N/mm2) E0,p (N/mm2) E0,p / fc,p
SFA10 3.3 (15%) 551 (16%) 167 SFA15 4.6 (9%) 463 (8%) 100
As expected, fc,p assumes the highest value for the case of the prisms built with CEBs from
mixture SFA15. Furthermore, fc,p is found to be 0.38 and 0.39 times f dc,u, respectively for the
mixtures SFA10 and SFA15. This relation is very similar in both mixtures, which might

20 / 31
indicate that the compressive strength of the individual CEBs may provide a good estimation
of the compressive strength of the dry-stack prisms built with these CEBs. On the other hand
and according to NZS 4297 [4], the compressive strength of the masonry is estimated to be
0.5 times the compressive strength of the CEBs. Therefore, this standard would lead to an
overestimation of the compressive strength in this case, with implication on safety if used for
design purposes. The lower ratio value obtained from the tests is possibly related with the
type of masonry and respective failure mode. The inexistence of mortared joints may
introduce localized tensile stress concentrations in the CEBs, which are responsible for
weakening the masonry during loading. With respect to E0, both mixtures promoted similar
values for the respective masonry. However, E0 was unexpectedly higher for mixture SFA10,
which is probably explained by the fact that the deformation of the prisms is mostly
controlled by the dry-stack joints, namely with respect to the adjustment of possible
imperfections of the contact surfaces between CEBs (such as loose particles and
protuberances). It should also be noted that the standard NZS 4297 [4] provides an
overestimation of the Young’s modulus as a function of the compressive strength of the
CEBs, where the first is assumed to be 300 times the second. This relation is of about 167 and
100 times in the case of mixture SFA10 and SFA15, respectively.
Fig. 11 – Compression stress – axial strain curves of the masonry prisms tested under compression.

21 / 31
Fig. 12 illustrates the typical failure mode of the masonry prism tested under compression.
The failure mode is characterized by distributed cracking in the three middle blocks. The
cracks seemed to develop continuously from a block towards the adjacent one, not showing
relative displacements at the dry-stack joints. The CEBs in contact with the testing platens
presented little cracking, probably due to the confinement effect. Nevertheless, spalling was a
common damage in these CEBs. Furthermore, some localised damage was also observed,
namely in the form of spalling of the corners of some CEBs and crushing at the horizontal
joints. These types of damage were probably a consequence of stress concentrations caused
by imperfections of the CEBs at the contact surfaces.
Fig. 12 – Typical failure mode of the masonry prisms tested under compression.
3.4 Shear tests (masonry prisms)
The shear stress – shear displacement curves resulting from shear tests are presented in Fig.
13 for selected prisms representing each pre-compression level and mixture. In general, the
prisms with lower pre-compression stress exhibit a softer behaviour being capable of
sustaining a shear stress value close to the maximum in the post-peak phase. On the other
hand, the prisms with higher pre-compression stress exhibit a more fragile behaviour, with
significantly stress drops in the post-peak phase. This fragile behaviour is probably a
consequence of the occurrence of a higher level damage in the CEBs.

22 / 31
The relationship between shear strength with the pre-compression level is depicted in Fig. 14.
The prisms built with CEBs from mixture SFA15 exhibit an almost linear relationship, but a
less linear relationship was found for the case of mixture SFA10. This unexpected behaviour
is thought to be related with the occurrence of excessive crushing and wearing at the contact
surfaces between the CEBs of the prisms tested with pre-compression stress of 0.85 N/mm2.
This probably means that this level of pre-compression was excessively high, given the
compression strength of the respective CEBs, and that this situation led to a reduction of the
shear strength relative to the previous pre-compression level. Despite that, the linear
regression applied to the points of the graph show initial shear strength values of about
0.20 N/mm2 and 0.17 N/mm2 in the case of mixture SFA10 and SF15, respectively. These
non-zero strength values for null compression represent the contribution of the interlocking
system for the shear strength of the masonry. Regarding the friction coefficient (tanφ), the
values obtained were of about 1.20 and 1.07 for peak resistance in the case of mixture SFA10
and SFA15, respectively. These values are significantly higher than 0.4, proposed in
Eurocode 6 [38], which is probably a consequence of the very rough and apparently hard
contact surfaces of the blocks and of the progressive failure of the interlocking system.
Fig. 13 – Curves shear stress – shear displacement (selected prisms).

23 / 31
Fig. 14 – Relationship between shear strength and pre-compression stress.
Fig. 15 presents the axial displacement – shear displacement curves of selected prisms
representing each pre-compression level and mixture, as well as the respective point of
maximum shear stress. The curves resulting from the pre-compression level 0.20 N/mm2
exhibit a positive although very low dilatancy coefficient (average value of 0.03 at peak shear
stress). Within the other two pre-compression levels, dilatancy becomes negative at peak
shear stress due to crushing and wearing of the contact surfaces between blocks. Furthermore,
the prisms built with CEBs from mixture SFA10 exhibit higher axial displacements than those
from mixture SFA15, due to a more severe damage. Fig. 15 also shows that with increasing
shear displacement the dilatancy coefficient decreases, for all pre-compression levels.
Fig. 15 – Curves axial displacement – shear displacement (selected prisms).

24 / 31
The values of the dilatancy coefficient were computed for the maximum shear stress and their
relationship with the pre-compression stress is depicted in Fig. 16. The dilatancy assumes
positive values for the lowest pre-compression stress and negative values for the other two
pre-compression levels. The relationship between the dilatancy and the pre-compression stress
seems to be almost linear, see also Fig. 16.
The typical failure mode of the prisms is illustrated in Fig. 17, where the intermediate block
slides relatively to the top and bottom ones. After testing, the prisms were dismounted to
allow the observation of the interlocking system. In general, one or both of the indentations
failed during the test at each contact surface. Furthermore, it was possible to observe that the
contact between CEBs was not complete and that depended on the pre-compression stress; the
higher the pre-compression stress the higher the worn level of the surface. In general, the
contact occurred mainly at the borders of the CEBs, explaining the crushing occurring in these
regions for the prisms with higher pre-compression levels. Probably, this situation indicates
that the CEBs are excessively stiff for being used in dry-stack masonry and that the use of bed
joint mortar would improve the shear behaviour under the higher pre-compression stress
levels.
Fig. 16 – Relationship between dilatancy and pre-compression stress.

25 / 31
Fig. 17 – Typical failure mode of the masonry prisms tested under shear loading.
4. CONCLUSIONS
This paper presents an experimental program where the mechanical behaviour of a solution
consisting of dry-stack masonry made from CEBs is assessed. The CEBs were manufactured
with a typical GRS from northern Portugal, stabilised by means of alkaline activation of fly
ash. Two compositions incorporating different percentages of fly ash were studied (SFA10
and SFA15).
The mechanical tests carried out on single CEBs showed that the higher the percentage of
geopolimer binder, the higher the values of the strength parameters. Furthermore, the values
obtained for these parameters were shown to be much superior to those required by some
international documents regulating earth construction. The mitigation of the intrinsic
variability of the GRS on the variability of the mechanical properties of the CEBs was another
feature promoted by the stabilisation process which was used. The presence of water was also
shown to reduce substantially the values of the strength parameters of the CEBs.
Nevertheless, the mechanical performance of the CEBs in saturated conditions was still
suitable for earth construction.
The compression tests carried out on the dry-stack masonry prisms showed an important
reduction of the compressive strength of the masonry relative to the compressive strength of

26 / 31
the CEBs. Furthermore, international documents regulating earth construction lead to an
overestimation of the compressive strength of the masonry when computed with basis on the
strength of the CEBs. This situation can rise design issues, meaning that a reduction factor
lower than 0.39 should be adopted for the masonry system here presented.
The shear tests presented some problems related with excessive pre-compression stress on the
prisms built with CEBs from mixture SFA10, which led to excessive crushing and wearing of
the contact surfaces between CEBs. Nevertheless, the shear parameters obtained (initial shear
strength and friction coefficient) were substantially high. Despite that, the contact between
CEBs was incomplete, meaning that the use mortared joints is expected to improve the shear
behaviour of the masonry. As for the dilatancy behaviour, it was observed an inverse linear
relationship between the pre-compression stress level and the dilatancy coefficient, where
negative values of this coefficient were found for two of the pre-compression levels.
In general, the alkaline activation of fly ash was shown to promote excellent results regarding
the improvement of the mechanical performance of CEBs manufactured with GRS. This
means that a large margin for optimization of the mixtures exists, namely with respect to the
environmental impact and cost of the solution. Furthermore, other aspects need to be assessed
in further investigation, namely with respect to non-mechanical features of the masonry
system. These include features such as acoustic and thermal performance of the masonry
walls, development and study of compatible renderings, as well as durability assessment.
Acknowledgements
The authors wish to express their gratitude to Mr. Pedro Esteves for his support in the
experimental work and to Eng. Jorge Henriques, on behalf of the company PEGOP – Energia
Eléctrica SA, for providing the fly ash. The financial support provided by the Portuguese

27 / 31
Science and Technology Foundation through the project FCOMP-01-0124-FEDER-028864
(FCT-PTDC/ECM-EST/2396/2012) is also gratefully acknowledged.
References
[1] Houben H, Guillaud H. (2008) Earth Construction: A Comprehensive Guide. Intermediate Technology
Development Group.
[2] Jaquin, P.A. (2014) One third of world’s population live in earth buildings?
http://historicrammedearth.com/one-third-of-worlds-population-live-in-earth-buildings (accessed on
02/06/2014).
[3] Pacheco-Torgal F, Jalali S. (2012) Earth construction: lessons from the past for future eco-efficient
construction. Constr Build Mater; 29:512-519.
[4] Standards New Zealand (1998a). Engineering design of earth buildings (NZS 4297:1998). Standards New
Zealand, Wellington.
[5] Standards New Zealand (1998b). Materials and workmanship for earth buildings (NZS 4298:1998).
Standards New Zealand, Wellington.
[6] Standards New Zealand (1998c). Earth buildings not requiring specific design (NZS 4299:1998).
Standards New Zealand, Wellington.
[7] AENOR (2008). Compressed earth blocks for walls – Definitions, specifications and testing methods
(UNE 41410). Asociación Española de Normalización y Certificación, Spain. (in Spanish)
[8] Standards Australia (2002). The Australian earth building handbook (HB 195). Standards Australia,
Sydney.
[9] SENCICO (2006). E.080: Adobe. Reglamento Nacional de Construcciones. Lima. (in Spanish)
[10] Barbosa N., Mattone R. (2002) Building with raw earth, I Seminário Ibero-Americano de Construção com
terra, Salvador, Brasil, p. 41-50. (in Portuguese)
[11] Doat P, Hays A, Houben H, Matuk S, Vitoux F. (1991) Building with earth. The Mud Village Society,
New Delhi.
[12] Gomes I. (2008). Earthquake-Resistant Construction with Raw Earth. Msc. Thesis, Instituto Superior
Técnico, Lisbon, Portugal. (in Portuguese)
[13] Reddy B.V.V., Kumar P.P. (2010). Embodied energy in cement stabilised rammed earth walls. Energy
and Buildings, 42, p. 380-385.

28 / 31
[14] Lax C. (2010) Life cycle assessment of rammed earth. Msc. thesis, University of Bath, United Kingdom.
[15] Torgal F.P., Jalali S. (2010) Portland cement versus geopolymeric binders: durability and environmental
performance, Teoria e Prática na Engenharia Civil, 15, p. 1–9. (in Portuguese)
[16] Roy D.M. (1999) Alkali-activated cements opportunities and challenges, Cement and Concrete Research,
9 (2), p. 249-254.
[17] Weil M., Dombrowski K., Buchawald A. (2009) Life-cycle analysis of geopolymers. In Geopolymers,
Structure, Processing, Properties and Applications, Provis J., Van Deventer J. Ed(s), Woodhead
Publishing Limited Abington Hall, Cambridge, UK, p. 194-210.
[18] Cristelo N., Glendinning S., Fernandes L., Teixeira Pinto A. (2012a) Effect of calcium content on soil
stabilisation with alkaline activation, Construction and Building Materials, 29, p. 167-174.
[19] Cristelo N., Glendinning S., Miranda T.F., Oliveira D.V., Silva R.A. (2012b) Soil Stabilisation using
Alkaline Activation of Fly Ash for Self Compacting Rammed Earth Construction, Construction and
Building Materials, 36, p. 727-735.
[20] Silva R.A., Oliveira D.V., Miranda T., Cristelo N., Escobar M.C., Soares, E. (2013). Rammed earth
construction with granitic residual soils: The case study of northern Portugal, Construction and Building
Materials, 47, p. 181-191.
[21] Cristelo N., Miranda T., Oliveira D.V., Rosa I., Soares E., Coelho P., Fernandes L. (2014). Sustainable
Production of Jet Mix Columns using Alkali Activated Industrial Waste Binders. Personal
communication submitted to the Journal of Cleaner Production.
[22] Ramos L.F., Mendonça P., Camões A., Sturm T., Eires R., Reis P., Sousa J., Vasconcelos G. (2011) The
partition walls of an integrated system of structural masonry made of CEBs, Seminário sobre Paredes
Divisórias, Porto, Portugal. (in Portuguese)
[23] Minke G. (2006) Building with earth: Design and technology of a sustainable architecture. Birkhäuse-
Publishers for Architecture, Basel-Berlin-Boston.
[24] AEI (2005). Earthquake resistant buildings with hollow interlocking blocks, Auroville Earth Institute,
UNESCO Chair - Earthern Architecture.
[25] Sturm T., Ramos L.F., Lourenço P.B. (2014). Characterization of dry-stack interlocking compressed earth
blocks. Materials and Structures, DOI 10.1617/s11527-014-0379-3.
[26] LNEC (1966). LNEC E196: Soils: particle size distribution analysis, Especificação do Laboratório
Nacional de Engenharia Civil, Lisbon, Portugal. (in portuguese)
29 / 31
[27] LNEC (1969). NP 143: Soils: determination of the consistency limits, Laboratório Nacional de
Engenharia Civil, Lisbon, Portugal. (in Portuguese)
[28] LNEC (1967). LNEC E197: Soils: compaction test, Especificação do Laboratório Nacional de Engenharia
Civil, Lisbon, Portugal. (in Portuguese)
[29] Viana da Fonseca A. (1996) Geomechanics of the granitic residual soils from Porto. Criteria for the
design of direct foundations. PhD Thesis, Dept. of Civil Engineering, University of Porto, Portugal; 1996.
(in Portuguese)
[30] Cristelo N., Soares E., Rosa I., , Miranda T.F., Oliveira D.V., Silva R.A., Chaves A. (2013) Rheological
properties of alkaline activated fly ash used in jet grouting applications, , Construction and Building
Materials, 48, p. 925-933.
[31] Soares E. (2013) Improvement of granitic residual soil resorting to the alkali activation of fly ash. Msc.
Thesis, University of Trás-os-Montes e Alto Douro, Vila Real, Portugal. (in Portuguese)
[32] CEN (2011) EN 772-1:2011: Methods of test for masonry units. Part 1: Determination of compressive
strength, European Committee for Standardization, Brussels.
[33] CEN (2002) EN 772-6:2002: Methods of test for masonry units. Part 6: Determination of bending tensile
strength of aggregate concrete masonry units, European Committee for Standardization, Brussels.
[34] ASTM (2003) ASTM C1314-03b: Standard test method for compressive strength of masonry prisms,
American Society for Testing and Materials, West Conshohocken, PA.
[35] CEN (2002) EN 1052-3:2002: Methods of test for masonry. Part 3: Determination of initial shear
strength, European Committee for Standardization, Brussels.
[36] Walker P.J., Stace T. (1997) Properties of some cement stabilised compressed earth blocks and mortars.
Materials and Structures, 30, p. 545–551.
[37] Mohamad G. (2007) Mechanism failure of concrete block masonry under compression. PhD Thesis,
University of Minho, Guimarães, Portugal. (in Portuguese)
[38] CEN (2005) EN 1996-1-1:2005: Eurocode 6: design of masonry structures - part 1-1: common rules for
reinforced and unreinforced masonry structures, European Committee for Standardization, Brussels.

30 / 31
LIST OF TABLE CAPTIONS
Table 1 – Chemical composition of the fly ash (from EDS analysis). ....................................... 9
Table 2 – Composition of the mixtures used in the manufacturing of the CEBs. .................... 10
Table 3 – Results of the compression tests on single CEBs (the average values (4 specimens)
are given and coefficient of variation is presented in brackets). .............................................. 15
Table 4 – Results of the three-point bending tests on single CEBs (the average values
(4 specimens) are given and coefficient of variation is presented in brackets). ....................... 18
Table 5 – Results of the compression tests on the masonry prisms (the average values
(4 specimens) are given and coefficient of variation is presented in brackets). ....................... 19

31 / 31
LIST OF FIGURE CAPTIONS
Fig. 1 – Dry-stack interlocking CEBs masonry system [25]: (a) dimensions of the block (in
mm); (b) single-leaf wall; (c) double leaf-wall. ......................................................................... 6
Fig. 2 – PSD curve of the soil and comparison with the envelope presented by Viana da
Fonseca [29] for GRS from Porto (northern Portugal). ............................................................. 7
Fig. 3 – Comparison between the PSD curve of the soil and the envelopes for CEB
construction recommended by: (a) Houben and Guillaud [1]; (b) UNE 41410 [7]. .................. 8
Fig. 4 – SEM image of the fly ash [30]. ..................................................................................... 9
Fig. 5 – Manufacturing of the CEBs: (a) Terstaram press; (b) CEB after compaction. ........... 11
Fig. 6 – Testing of the individual CEBs under: (a) compression; (b) three-point bending. ..... 12
Fig. 7 – Testing of the CEBs masonry prisms under: (a) compression; (b) shear. .................. 14
Fig. 8 – Typical failure mode of the single CEBs tested under compression. ......................... 16
Fig. 9 – Typical failure mode of the single CEBs tested under three-point bending. .............. 18
Fig. 10 – Representative curves of the three-point bending tests (selected specimens): (a)
load-deflection; (b) load-crack opening. .................................................................................. 18
Fig. 11 – Compression stress – axial strain curves of the masonry prisms tested under
compression. ............................................................................................................................. 20
Fig. 12 – Typical failure mode of the masonry prisms tested under compression. .................. 21
Fig. 13 – Curves shear stress – shear displacement (selected prisms). .................................... 22
Fig. 14 – Relationship between shear strength and pre-compression stress. ........................... 23
Fig. 15 – Curves axial displacement – shear displacement (selected prisms). ......................... 23
Fig. 16 – Relationship between dilatancy and pre-compression stress. ................................... 24
Fig. 17 – Typical failure mode of the masonry prisms tested under shear loading. ................ 25