Embed Size (px)
Citation preview
Laboratory Manual
Mechanical Engineering Lab - I
Department of Mechanical
Engineering
ME329

2
INDEX
Ex.
No Name of the Experiment
Page
No.
No of
Hours
1 Linear Measurement Using Vernier Height Gauge
& Micrometer 3
2
2 Linear Measurement Using Dial Gauge, Slip and
Calibration of Dial Gauge 7
2
3
To perform the alignment test on the lathe
machine 10
2
4
To understand the theory and principle of Tool
maker‟s microscope for measurement of
dimensional parameters of a work piece.
11
2
5 To find out pitch, pitch circle diameter and thread
angle of the given threaded job 13
2
6 To measure gear parameter by gear tooth Vernier 16 2
7 To use the Dial Indicator as Mechanical
Comparator 18
2
8.a. Measurement of taper angle using sine bar and slip
gauge 20
2
b. Measurement of angle using vernier bevel
protractor
9 To calculate Tonnage capacity of the Air
Conditioning system. 22
2
10 To calculate actual and theoretical coefficient of
performance 24
2
11 To plot the vapor compression refrigeration cycle
on P-H chart 28
2
12 Plot the Psychometric process on Psychometric
chart 30
2

3
Experiment-1
Aim: -
Linear Measurement Using Vernier Height Gauge & Micrometer
Apparatus :-
Vernier Caliper, Vernier Height Gauge, Micrometer, And Measuring Parts
Vernier Height Gauge
This is just as vernier caliper, equipped with special base block and other attachment
which make the instrument suitable for height measurements. Along with the sliding jaw
assembly, arrangement is provided to carry a removable clamp. The upper and lower
surfaces of the measuring jaws are parallel to the base, so that it can be used for
measurements over or under surface. The vernier height gauge is mainly used in the
inspection of parts and work. With a scribing attachment in place of measuring jow, this
can be used to scribe lines at certain distance above the surface. However dial indicator
Can also be attached in the clamp and many useful measurements made as it exactly
gives indication when dial tip just touching surface. For all these measurement, use of
surface plate as datum surface is very essential.
PROCEDURE-
1. Take the material (sample) for which the value must be measured.
2. Check the vernier and main scale must coincide at 0
3. After checking the 0 mark put the sample piece and slowly leaves the measuring jaw
over the piece
4. Tight the screw and measure the main scale also vernier scale reading
5. The line coincide with the main scale that the VSR
6. By adding MSR with VSR*L
DIAGRAM OF VERNIER HEIGHT GAUGE
4
OBSERVATION TABLE FOR VERNIER HEIGHT GAUGE
Sr No MSR VSR LC TSR
1
2
3
4
5
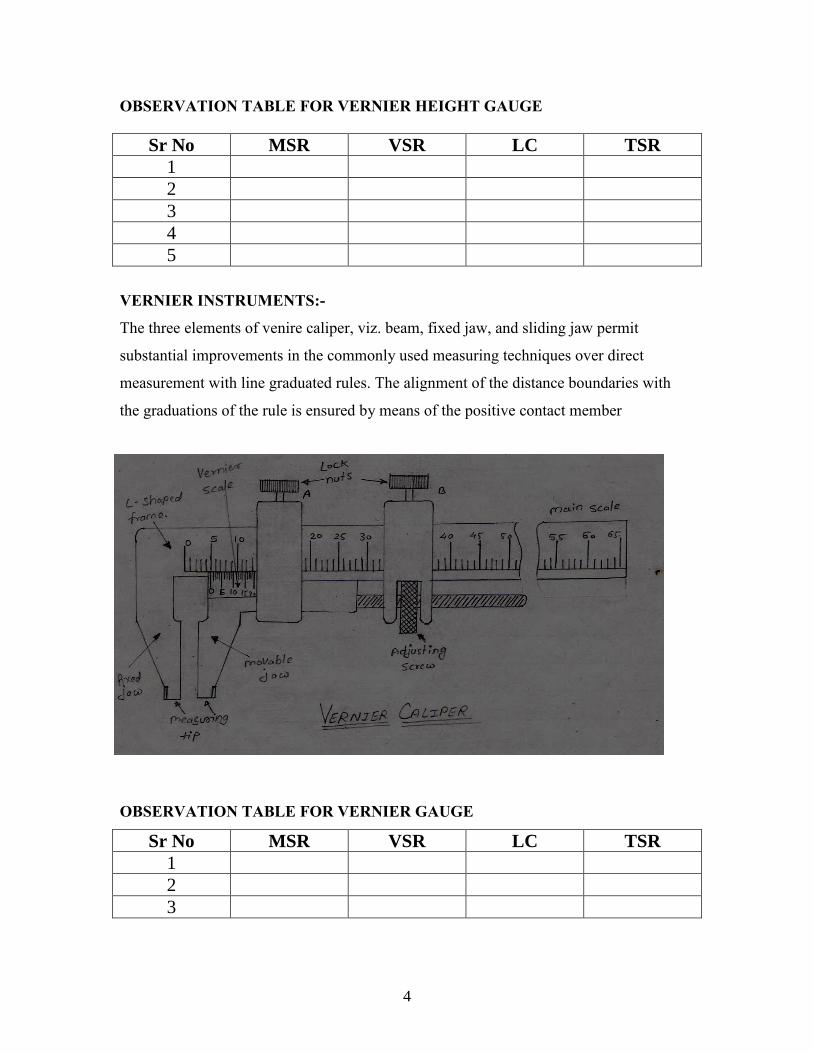
VERNIER INSTRUMENTS:-
The three elements of venire caliper, viz. beam, fixed jaw, and sliding jaw permit
substantial improvements in the commonly used measuring techniques over direct
measurement with line graduated rules. The alignment of the distance boundaries with
the graduations of the rule is ensured by means of the positive contact member
DIAGRAM OF VERNIER CALIPER
OBSERVATION TABLE FOR VERNIER GAUGE
Sr No MSR VSR LC TSR
1
2
3

5
MICROMETER
The end of the screw forms one measuring tip and the other measuring tip is constituted
by a stationary anvil in the base of the frame. The screw is threaded for certain length and
is plan afterwards. The plain portion is called sleeve and its end is the measuring surface.
The spindle is advanced by turning thimble connected to the spindle. The spindle is aside
fit over the barre land barrel is the fixed part attached with frame. The barrel is graduated
in unit of 0.05cm.i.e.20division per cm, which is the lead of the screw for one complete
revolution. The thimble has got 25 divisions around its periphery on circular portion.
Thus it sub-divides each revolution of the screw in 25 equal parts; i.e.each division
corresponds to 0.002cm.
PROCEDURE
1. The whole movable jaw assembly is adjusted so that the two measuring tip just
touch two parts to be measured.
2. Then lock nut is tightened.
3. Final adjustment depending upon the sense of correct feel is made by the
adjusting screw.
4. Measurement the main scale readings i.e. the line coincide with o mark of vernier
scale and noted down the reading.
5. The measuring tip is so designed as to measure inside as well as outside
dimension.
6. Calculate MSR, VSR and TSR
DIAGRAM OF MICROMETER:
6
OBSERVATION TABLE FOR VERNIER GAUGE
Sr No MSR VSR LC TSR
1
2
3
RESULT
Linear measurement using vernier caliper, vernier height gauge and micrometer are
successfully completed.

7
Experiment-2
Aim :-
Linear Measurement Using Dial Gauge, Slip and Calibration of Dial Gauge.
Apparatus :-
Dial Gauge, Slip Gauge, Dial Gauge Indicator
Theory :-
The different component of dial gauge indicator is shown in fig. It consist of plunger,
removable contact pt, stem a transparent glass cover, calibrated dial pointer, bezel camp
or bezel locking nut. Revolution counter in order to counter in order to count the no of
revolution of a pointer, dust proof cap etc. It consists of a plunger which slides in
bearing and carries a rack with it. The rack is meshed with pinion (P1) again pinion (P2)
and gear (G2) are on same spindle [because of which magnification is taking place]. The
gear (G1) is meshed with (P1) again pinion (P2) and gear (G2) are on spindle basically
gear (G2) is meshed with pinion (P3) on whose spindle pointer is attached. The pinion
(P3) is meshed with gear (G3) on which a light is here spring is attached in order to guide
the movement of plunger a rack guide is provided and to bring the plunger to its initial
position a light coil spring is attached to plunger. Any linear displacement given causes
rack to move upward during this upward movement as rack is meshed with pinion (P1)
and gear (G1) rotate by some amount but as the no of teeth on gear (G1) is more
compared to that of pinion (P2) which is meshed with it rotate more time. Let us say if
there is 100 teeth on gear G1 and 10 teeth on pinion P2 the 1st stage of magnification is
100/10=10 times again. Therefore overall magnification can be calculated, (G1XG2)/
(P2XP3) EG : (100x100/10x10) = 100 In this way dial indicator works you can take
diff readings by keeping standard and object. Then comparison can be made. The
magnification is about 250-1000.
Dial gauge -
Dial gauges divided in two categories, type1 &type2for general engineering purpose
depending upon the movement of the plunger. These are manufactured in two grades
,grade a and grade b, with total plunger movement or lift of 3,5 and 10mm. Type1 dial
gauge has the plunger movement parallel tip the plane of dial and type 2 has the plunger

8
movement perpendicular to the plane of dial
Indicator gauge-
Dial indicator has been used with several auxiliary devices for a wide variety of length
measurement. Obviously dial indicator can be used for carrying the needed
complimentary function, resulting in a single tool, it is known as indicator gauge. It must
be remembered that indicator gauge are always comparator type measuring instrument
and require the use of a setting gauges for establishing the basic measuring position
Slip gauge-
Slip gauges with three basic forms are commonly found. These are rectangular square
with center hole, and square without center hole. Rectangular forms is the more widely
used because rectangular block are less expensive to manufacture, and adopt themselves
better to application where space is restricted or excess weight is to be provided. For
certain application squarely gauges, through expensive, are preferred. Due to their large
surface area, they wear longer and adhere better to each other when touch to high stack.
PROCEDURE :-
For calibration checking.
1. The slip gauge is used for the purpose of checking the calibration.
2. A known slip gauge is taken and placed on the surface, the indicator gauge which has
3.The least count of instrument is calculated

9
4. The deflection of the pointer is noted and the final reading is obtained
5. For measuring the dimension of a given sample , a known slip gauge is matched with
the given sample ;the comparator is put on the surface without disturbing the reference
setting
6. If the sample is greater than reference one, the pointer shows deflection which is
measured and reading is calculated.
OBSERVATION :
Slip gauge For linear measurement least count = (0.2/200)=0.001 mm/div
For standard dimension For specimen
Main scale reading =MSR = -------
Circular scale reading =CSR= ---------
Total reading (TR) = MSR + ( CSR * LC )
Total Height of specimen = -----------
Calculation of Dial Gauge :-
Slip Gauge Reading Dial Gauge Reading
= 50+ …… = 0.2 + …….
= 51.001 mm = 0.2 + ……
= 51.003 mm = 0.2 + …….
Difference for the both should be equal
Result:-
Thus we have completed the linear measurement using dial gauge and calibration of dial
gauge.
10
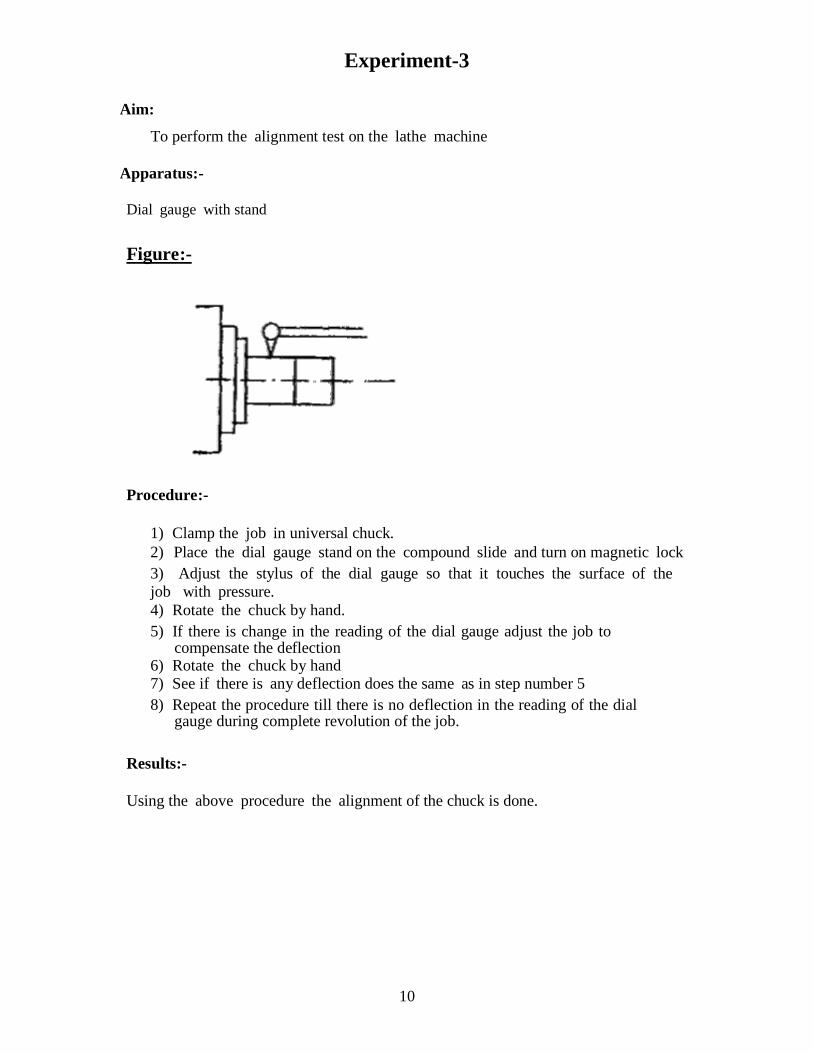
Experiment-3
Aim:
To perform the alignment test on the lathe machine
Apparatus:-
Dial gauge with stand
Figure:-
Procedure:-
1) Clamp the job in universal chuck.
2) Place the dial gauge stand on the compound slide and turn on magnetic lock
3) Adjust the stylus of the dial gauge so that it touches the surface of the
job with pressure.
4) Rotate the chuck by hand.
5) If there is change in the reading of the dial gauge adjust the job to compensate the deflection
6) Rotate the chuck by hand 7) See if there is any deflection does the same as in step number 5
8) Repeat the procedure till there is no deflection in the reading of the dial gauge during complete revolution of the job.
Results:-
Using the above procedure the alignment of the chuck is done.

11
Experiment-4
Aim:
To understand the theory and principle of Tool maker‟s microscope for
measurement of dimensional parameters of a work piece.
Apparatus used:
Tool maker‟s microscope
Theory:
The Tool Maker‟s Microscope (TMM) essentially consists of the cast base, the main
lighting unit, the upright with carrying arm and the sighting microscope.
Tool Maker‟s Microscope
The rigid cast base is resting on three foot screws by means of which the equipment can
be leveled with reference to the built-in spirit level. The base carries the co-ordinate

12
measuring table, consists of two measuring slides: one each for directions X and Y, and a
rotary circular table provided with the glass plate. The slides run on precision balls in
hardened guide ways warranting reliable travel. Two micrometer screws each of them
having measuring range of 0 to 25 mm permit the measuring table to be displaced in the
directions X and Y. The range of movements of the carriage can be widened up to 75 mm
in the X direction and up to 50mm in the Y direction with the use of gauge blocks. The
rotary table has been provided with 360 degrees graduation and with a 60 minute vernier.
The rotary motion is initiated by activation of knurled knob. Slots in the rotary table serve
for fastening different accessories and completing elements. The sighting microscope has
been fastened to column with a carrier arm. The carrier arm can be adjusted in height by
means of a rack. The main lighting unit has been arranged in the rear of the cast base and
equipped with projection lamp where rays are directed via stationary mounted mirror
through table glass plate into the sighting microscope.
Measuring principle:
Tool Maker‟s Microscope is a precision Optical Microscope that consists of single or
multiple objective lenses, which magnifies the object under observation and by the help
of eyepiece lens the object is focused and viewed. A high precision micrometric X-Y
stage and the Z axis travel are used to measure the three dimensions [Length (X), Width
(Y), Depth (Z)]. The angle is measured with the help of a rotating stage and eyepiece
graduation.
Applications:
The tool maker‟s microscope is an essential part of engineering inspection, measurement
and calibration in metrology labs. Hence is used to the following,
Examination of form tools, plate and template gauges, punches and dies, annular
grooved and threaded hobs etc.
Measurement of glass graticules and other surface marked parts.
Elements of external thread forms of screw plug gauges, taps, worms and similar
components.
Shallow bores and recesses.

13
Experiment-5
Aim:
To find out pitch, pitch circle diameter and thread angle of the given threaded job.
Apparatus:
Tool Maker`s Microscope, threading Job
Working Diagram:
Tool maker's microscope:
Tool maker's microscope is versatile instrument that measures by optical means with no
pressure being involved it is thus a very useful instrument for making measurements on
small and delicate parts. The tool maker's microscope is designed for the following
measurements; measurements on parts of complex form for example, the profile of
external thread as well as for the tools, templates and gauges, measuring centre to centre
distance of holes in any plane and other wide variety of linear measurements and accurate
angular measurements.
A tool maker's microscope is as shown in fig. The optical head can be moved up or down
the vertical column and can e clamped at any height by means of clamping screws. The
table which is mounted n the base of the instrument can be moved in two mutually
perpendicular horizontal directions (longitudinal and lateral) by means of accurate
micromeres screws having thimble scale and venires.
A ray of light from light source is reflected by mirror through 90. It is then passes
through a transparent glass plate (on which flat parts may be placed). A shadow image of
the outline or contour of the work piece passes through the objective of the optical head
and is projected by a system of three prisms to ground glass screen. Observations are
made through an eyepiece. Measurements are made by means of cross lines engraved on

14
the ground glass screen. The screen can be rotated trough 360 the angle of rotation is read
through an auxiliary eyepiece.
Procedure:
The use of - tool maker's microscope for the taking the various measurements is
explained below-
1) To measure the pitch: Rotate micrometer head for X direction to touch the intersection
point of the crosswire to the crest of the thread as seen from the eye piece. Note down
the reading of the micrometer. Again rotate the micrometer head to move the specimen
so that the next successive crest will come in contact with the crosswire intersection
point. Note down the reading. The difference in reading will give the pitch.
2) To measure the depth of the thread: Similarly rotate micrometer head for Y
direction to touch the intersection point of the crosswire (along with the horizontal
dotted line) to the root of the thread, as seen from the eye piece. Note down the reading of
the micrometer. Again rotate the micrometer head to move the specimen so that the
horizontal dotted line touches all the crests. Note down the reading. The difference in
reading will give the depth of the thread.
3) To measure the thread angle: Rotate the crosswire by the silver color knob located
behind the eye piece to match the flank of the thread with the cross wire. Make use of
both the micrometer heads for X and Y direction to move the flank, and note down the
angle by viewing through the lens below the eye piece. Now rotate only the crosswire to
match the opposite flank and note down the angle. The difference will give the thread
angle.
4) Represent all the measured readings of the given specimen (thread gauge) with a neat
diagram.
Different types of gradated and engraved screens and corresponding eye piece are used
for measuring different elements.

15
Results:-
1) Average depth of thread = -------------- mm.
2) Pitch of threads = --------------- mm.
3) Threads angle = --------------- mm.
Precaution:-
1) Obtain clean picture of cross line and the cross thread seen through the eyepiece.
2) For angular measurements lines must remain parallel to flank edge to the tooth.

16
Experiment-6
Aim:
To measure gear parameter by gear tooth Vernier.
Apparatus required:
Gear tooth Vernier, Gear specimen.
Specification:
Gear tooth Vernier: Range = Horizontal =0-40 mm
Vertical = 0-20 mm
L.C = 0.02 mm
Formula:
1. W = NM sin (90/N)
2. d = NM
--------- )/90cos(/21 NN
2
3. m = D
-------------
(N+2)
Where W = Chordal width of tooth in mm
D = Chordal addendum of gear in mm
M = Module of gear in mm
N = NO. Of teeth
D = out side Dia in gear in mm
Procedure:
1. The N, D of the given gear block are measured.
2. The module m‟ it then calculated.
3. Theoretical values of „W‟ and‟d‟ are computed.
4. Theoretical values of „W‟ is set in horizontal Vernier scale of gear tooth
Vernier and corresponding actual „d‟ value scale.
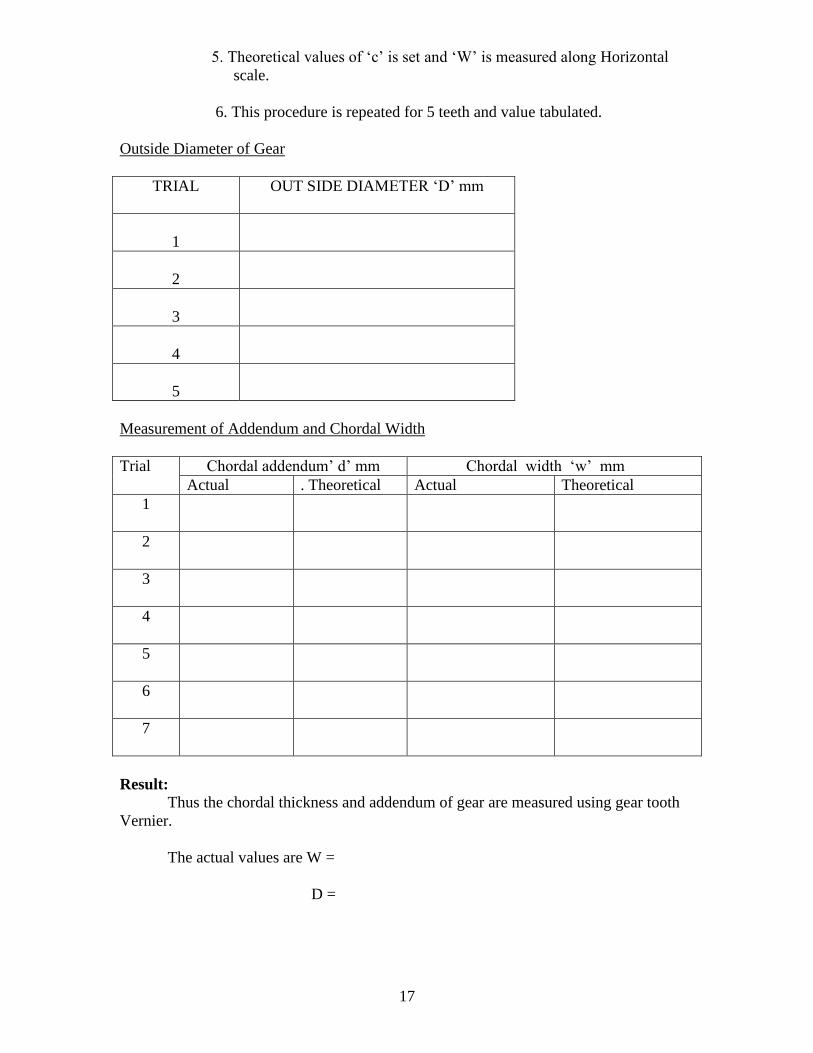
17
5. Theoretical values of „c‟ is set and „W‟ is measured along Horizontal
scale.
6. This procedure is repeated for 5 teeth and value tabulated.
Outside Diameter of Gear
TRIAL
OUT SIDE DIAMETER „D‟ mm
1
2
3
4
5
Measurement of Addendum and Chordal Width
Trial Chordal addendum‟ d‟ mm Chordal width „w‟ mm
Actual . Theoretical Actual Theoretical
1
2
3
4
5
6
7
Result:
Thus the chordal thickness and addendum of gear are measured using gear tooth
Vernier.
The actual values are W =
D =

18
Experiment-7
Aim: To use the Dial Indicator as Mechanical Comparator
Apparatus Required:
Dial indicator, stand, combination of slip gauges and the component to be compared.
Diagram:-
Procedure:-
1) Read the drawing of given component correctly
2) Mount the Dial Indicator on the comparator stand
3) Prepare the correct combination of the slip gauges
19
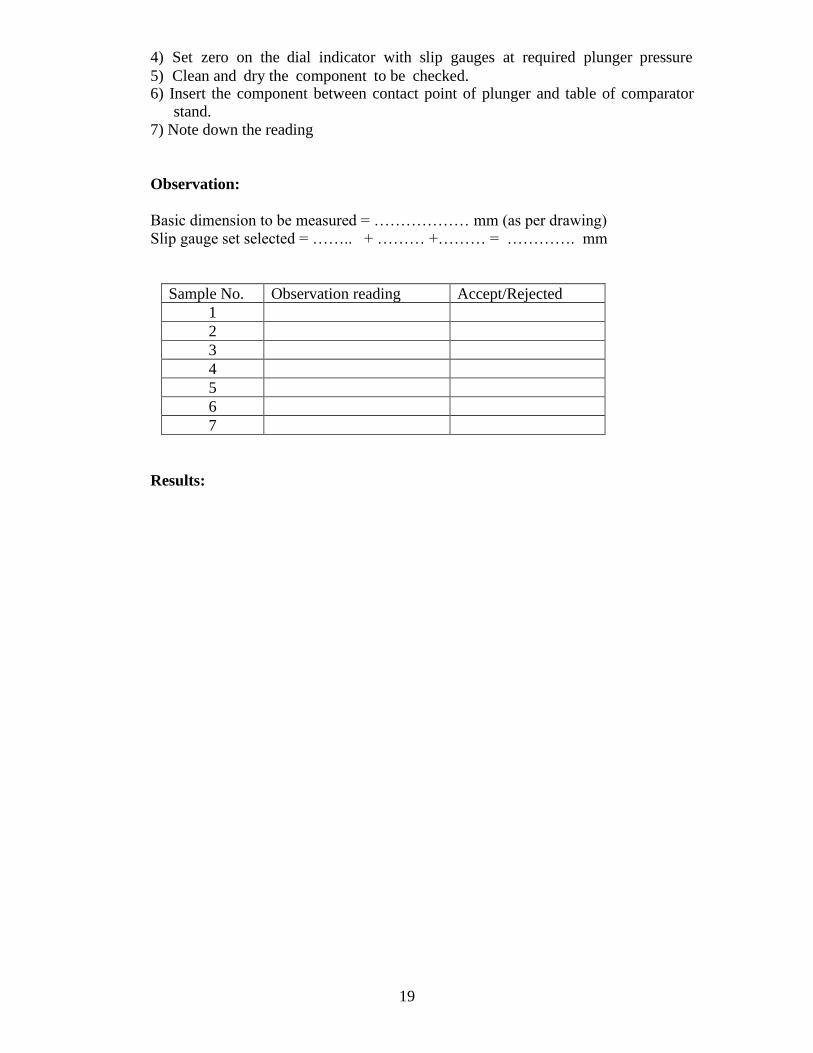
4) Set zero on the dial indicator with slip gauges at required plunger pressure
5) Clean and dry the component to be checked. 6) Insert the component between contact point of plunger and table of comparator
stand.
7) Note down the reading
Observation:
Basic dimension to be measured = ……………… mm (as per drawing)
Slip gauge set selected = …….. + ……… +……… = …………. mm
Sample No. Observation reading Accept/Rejected
1
2
3
4
5
6
7
Results:

20
Experiment-8
Aim: (a) To measure the taper angle of the given specimen using sine bar
Apparatus Required:
Surface plate, Dial gauge with stand, Sine bar, Slip gauge, Bevel protractor &
specimen.
Specification:
Sine bar : Range:
Formula:
Taper angle „θ‟ = Sin-1 (h/l) in degrees
Where, h = the total height (thickness) of the slip gauges in mm
l = the standard length of the sine bar in mm = 200mm
Procedure:
1. The taper angle of the specimen is first found out approximately with the help of a
bevel protractor.
2. The sine bar is set at this angle on the surface plate with the help of the slip
gauges as shown in the figure.
3. The specimen is placed on the sine bar so that its top taper surface is parallel to
the surface plate.
4. The parallelism is checked and adjusted by increasing or decreasing the height
level of the slip gauges, so that there should be no deflection in the long hand of
the digital gauge when the spindle of the dial gauge is moved over the specimen
surface.
5. The total height (thickness) of the slip gauges is noted down.
6. Trial readings are taken by placing the specimen at different points of the sine bar
surface.
For Small Specimen:
Trial Total height of the slip
gauge Reading (mm)
1
For Large Specimen:
Trial h 1 (mm) h 2 (mm) h 2- h 1
(mm)
1
2
3

21
Result:
The taper angle of the given specimen is
a. Using bevel protractor =_________________________ degrees
b. Using sine bar =_________________________ degrees
………………………………………………………………………………………………
Aim:
(b) To measure the angles of given specimen using bevel protractor.
Apparatus Required:
Surface Plate, Dial Gauge, Slip Gauge, Bevel protractor, specimen
Procedure:
1. Initially bevel protractor is adjusted as per requirements.
2. Specimen is placed between the blades.
3. Reading noted directly from main scale and Vernier scale
4. For measuring, taper angle of sine bar, protractor is fixed to height
gauge.
5. The protractor is corresponding adjusted.
6. Noted reading is tabulated.
Result:
Thus ………… angle of given specimens was determined.

22
Experiment-9
Aim:
The equipment is a Comprehensive test rig and it can be used for a variety of
experiments. Following trials/ experiments can be conducted on this test rig.
1. To calculate Tonnage capacity of the Air Conditioning system.
Procedure:
1) Connect the supply cable to regulated / stabilized power supply.
2) Switch ON the main switch.
3) Put ON the AHU fan.
4) Record the DBT & WBT at the inlet and at the outlet of the duct. (Ensure that the
well of WBT is filled with water.) Use psychrometer.
5) Switch ON the compressor.
6) Allow the system to reach steady state.(RUN FOR 20 MIN.)
7) Record the air temperatures at inlet and outlet (DBT & WBT) Use digital
indicator.
8) Record the Energy-meter reading.
9) Record suction and discharge pressures.
10) Record Rotameter reading, refrigerant temperatures at various locations viz:
before &after compression and before & after expansion.
11) Measure velocity head with the help of manometer at inlet of the ducting.
12) Take the reading 15-20 minutes after starting cooling.
STANDARD VALUES AND FORMULAE
Standard Barometric Pressure = 1.013 bar = 1.013 x 10⁵ N /m2
Density of Water = 1000 kg / m3
Gas Constant for Air = 287 kg / kJ K
Specific Gravity of R-134a at 400 C = 1.2
1 Ton of Refrigeration effect = 3500 Watts = 3.5 kJ / s
Density of Air at 250 C = 1.1 kg/m3
Density of manometric liquid = 810 kg/ m3
CALCULATIONS:
TO DETERMINE
1. TONNAGE CAPACITY OF THE AC PLANT
INLET CONDITIONS :
OUTLET CONDITIONS :
INLET AIR ENTHALPY H1 = (Ref. Phyc. Chart.)
23
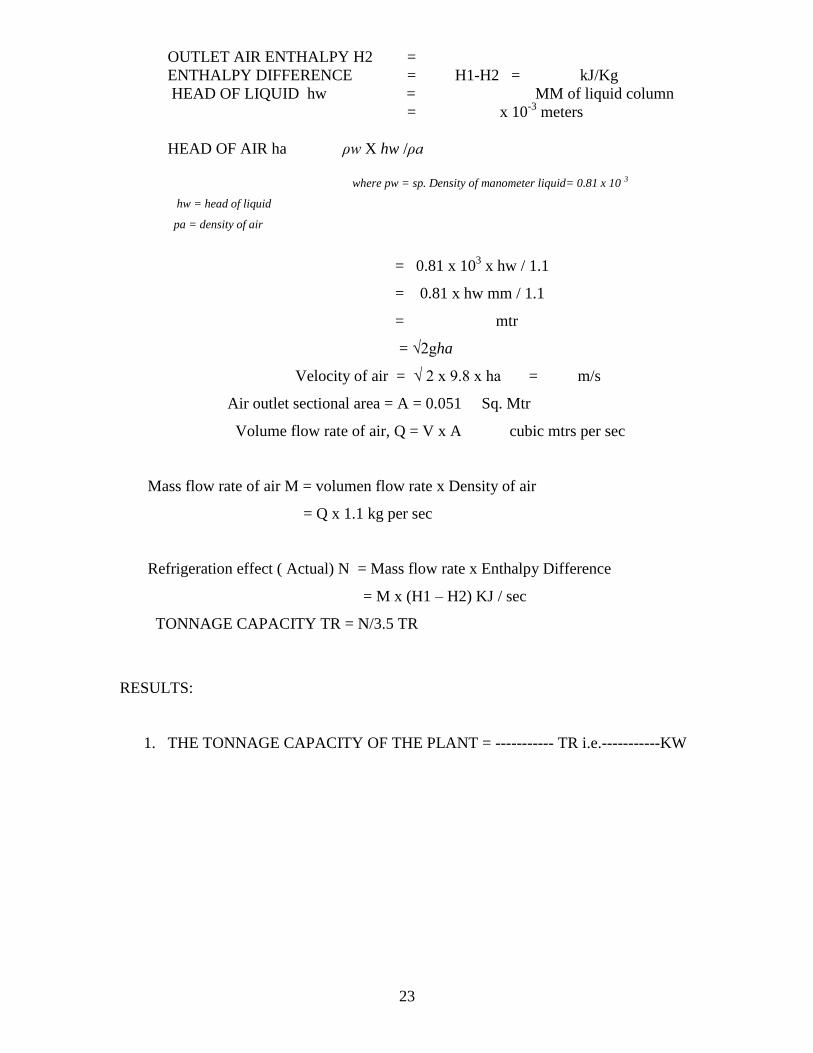
OUTLET AIR ENTHALPY H2 =
ENTHALPY DIFFERENCE = H1-H2 = kJ/Kg
HEAD OF LIQUID hw = MM of liquid column
= x 10-3
meters
HEAD OF AIR ha ρw X hw /ρa
where pw = sp. Density of manometer liquid= 0.81 x 10 3
hw = head of liquid
pa = density of air
= 0.81 x 10³ x hw / 1.1
= 0.81 x hw mm / 1.1
= mtr
= √2gha
Velocity of air = √ 2 x 9.8 x ha = m/s
Air outlet sectional area = A = 0.051 Sq. Mtr
Volume flow rate of air, Q = V x A cubic mtrs per sec
Mass flow rate of air M = volumen flow rate x Density of air
= Q x 1.1 kg per sec
Refrigeration effect ( Actual) N = Mass flow rate x Enthalpy Difference
= M x (H1 – H2) KJ / sec
TONNAGE CAPACITY TR = N/3.5 TR
RESULTS:
1. THE TONNAGE CAPACITY OF THE PLANT = ----------- TR i.e.-----------KW

24
Experiment-10
Aim:
1. To calculate. a) Actual C. O. P b) Theoretical C. O. P of the cycle.
INTRODUCTION:
The Air Conditioning Trainer works on Vapour compression Refrigeration cycle using
R 134a as a refrigerant.
The Trainer is having a hermetically sealed compressor, which sucks cold refrigerant
vapour from the evaporator. The vapour is compressed to higher pressure and
consequently to higher temperature in the compressor. The high pressure and high
temperature refrigerant then enters the condenser, where its latent heat is removed by
rejecting the heat to the air passing over the forced convection condenser. The liquefied
refrigerant passes through drier (where any residual moisture is absorbed) and through
rotameter (where flow is measured) and enters the expansion device. In the expansion
device, the refrigerant is throttled to a lower pressure and as a result, the temperature of
the refrigerant also reduced. This low temperature wet vapour flows through the
evaporator, which is a forced convection air-cooled evaporator. Here, the refrigerant
picks up heat from air passing over it and gains heat; it evaporates and enters the
compressor. This cycle repeats.
In addition to basic system components, many controls such as overload protector, HP/LP
cut-out are provided to safeguard the system against any malfunctioning. To accomplish
psychometric processes, heating elements and humidification arrangement is provided.
To vary the airflow, air dampers are provided.
For measurement of pressures dial type pressure gauges are fitted and to record
temperatures digital temperature scanner is incorporated.
STANDARD VALUES AND FORMULAE
Standard Barometric Pressure = 1.013 bar = 1.013 x 10⁵
N /m2
Density of Water = 1000 kg / m3
Gas Constant for Air = 287 kg / kJ K
Specific Gravity of R-134a at 400
C = 1.2
1 Ton of Refrigeration effect = 3500 Watts = 3.5 kJ / s
Density of Air at 250
C = 1.1 kg/m3
Density of manometric liquid = 810kg/ m3
25
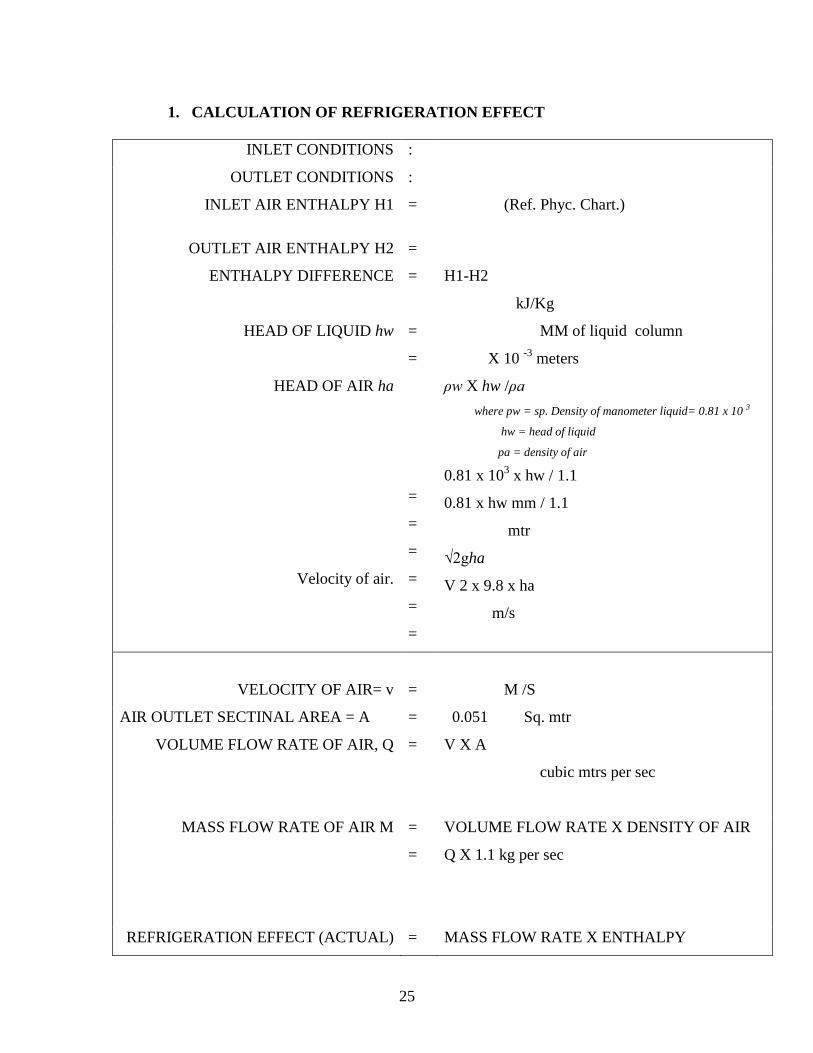
1. CALCULATION OF REFRIGERATION EFFECT
INLET CONDITIONS :
OUTLET CONDITIONS :
INLET AIR ENTHALPY H1 = (Ref. Phyc. Chart.)
OUTLET AIR ENTHALPY H2 =
ENTHALPY DIFFERENCE = H1-H2
kJ/Kg
HEAD OF LIQUID hw
HEAD OF AIR ha
Velocity of air.
=
=
=
=
=
=
=
=
MM of liquid column
X 10 -3
meters
ρw X hw /ρa
where pw = sp. Density of manometer liquid= 0.81 x 10 3
hw = head of liquid
pa = density of air
0.81 x 10³ x hw / 1.1
0.81 x hw mm / 1.1
mtr
√2gha
V 2 x 9.8 x ha
m/s
VELOCITY OF AIR= v = M /S
AIR OUTLET SECTINAL AREA = A = 0.051 Sq. mtr
VOLUME FLOW RATE OF AIR, Q = V X A
cubic mtrs per sec
MASS FLOW RATE OF AIR M = VOLUME FLOW RATE X DENSITY OF AIR
= Q X 1.1 kg per sec
REFRIGERATION EFFECT (ACTUAL) = MASS FLOW RATE X ENTHALPY

26
N DIFFERENCE
= M X (H1-H2) KJ / sec
2. ACTUAL C.O.P. OF THE SYSTEM
COMPRESSOR WORK, W = 10x3600
3200xt (where t=time for 10 pulses in
sec.)
=
KW or kJ / s
ACTUAL C.O.P. = N / W
=
3. THEORETICAL C.O.P. OF THE SYSTEM
To evaluate theoretical C.O.P. of the system, carry out following procedure.
1. For any set of readings at a particular time, note suction and discharge
pressures in psig.
2. Divide these pressures by 14.5 to convert them into bar.
3. Add barometric pressure of the present location to obtain absolute pressures in bar.
4. Locate these pressures on “Y” axis of P-H chart. Draw two horizontal lines, one for
low pressure and one for high pressure.
5. Locate particular temperatures on these lines and mark 1,2,3,4.
6. Find out enthalpies at salient points by referring to “X‟‟ axis of P-H chart.
H1=
H2=
H3=

27
H4=
7. N= REFRIGERATION EFFECT= H1-H4= KJ/kg
8. W= COMPRESSOR WORK = H2-H1= KJ/Kg
9. THEORETICAL C.O.P. = N / W
= (H1-H4) / (H2-H1)
RESULTS:
1. THE ACTUAL C.O.P. OF THE SYSTEM IS --------------------------
2. THE THEORETICAL C.O.P. OF THE SYSTEM IS -------------------

28
Experiment-11
Aim:
PLOTTING REFRIERATION CYCLE ON P-H CHART
TECHNICAL SPECIFICATIONS OF THE SYSTEM & FUNCTIONS OF COMPONENTS.
NO.
COMPONENT SPECIFICATIONS
1. Compressor Hermetically sealed.
2. Condenser Forced Convection Air cooled
3. Drier / filter Provided
4. Refrigerant flow
measurement
Glass Tube Rotameter
5 Expansion Device Capillary tube.
6. Evaporator Forced convection air cooled
7. Energy meter Provide
8. Condenser Fan Axial flow type
9. Evaporator Fan Axial flow type
11. Heater 1000 Watt Finned type
13. Temperature
Indicator
6 Channel Facility with digital display
14. HP/LP Cut out Provided
15. Pressure Gauges 2 nos
2 ½ “ Dial type
PROCEDURE:
1) Connect the supply cable to regulated / stabilized power supply.
2) Switch ON the main switch.
3) Put ON the AHU fan.
4) Record the DBT & WBT at the inlet and at the outlet of the duct. (Ensure that the
well of WBT is filled with water.) Use psychrometer.
5) Switch ON the compressor.
6) Allow the system to reach steady state.(RUN FOR 20 MIN.)

29
7) Record suction and discharge pressures.
8) For any set of readings at a particular time, note suction and discharge
pressures in psig.
9) Divide these pressures by 14.5 to convert them into bar.
10) Add barometric pressure of the present location to obtain absolute pressures in bar.
11) Locate these pressures on “Y” axis of P-H chart. Draw two horizontal lines, one for
low pressure and one for high pressure.
12) Locate particular temperatures on these lines and mark 1,2,3,4.

30
Experiment-12
Aim:
1) Draw the Psychometric process on Psychometric chart
2) Recording of data from test rig apparatus
PROCEDURE:
TRACE THE DEHUMIDIFICATION PROCESS
Put the AHU on now start dehumidifier/heater on for 5 mins. Record fallowing reading.
Sr. Inlet Outlet
DBT
WBT
LOCATE INLET AND OUTLET CONDITIONS ON PSYCHROMETRIC CHART
AND STUDY THE PROCESS.
TRACE THE HUMIDIFICATION PROCESS
Put the AHU on now start humidifier for 10 mins, don‟t start compressor. Record
fallowing reading
Sr. Inlet Outlet
DBT
WBT
LOCATE INLET AND OUTLET CONDITIONS ON PSYCHROMETRIC CHART
AND STUDY THE PROCESS.

31
AIR CONDITIONING TEST RIG
OBSERVATION TABLE
1. Put on machine & take reading after 10 mins. Date:
SL TIME
HRS
INLET AIR
TEMP. 0
C
OUTLET
AIR TEMP. 0
C
SU
CT
ION
PR
ES
SU
RE
(
LP
)
PS
IG
DIS
CH
AR
GE
PR
ES
SU
RE
(H
P)
PS
IG
R-134a
REFRIGERANT
TEMPERATURES 0 C
EN
ER
GY
ME
TE
R
TIM
E F
OR
10 P
UL
SE
S.
RE
FR
IGE
RA
NT
FL
OW
LP
H
MA
NO
ME
TE
R
RE
AD
ING
mm
of
WG
SE
CT
ION
AL
AR
EA
OF
TH
E D
UC
T
DBT WBT DBT WBT
AF
TE
R
CO
MP
RE
SS
ION
AF
TE
R
CO
ND
EN
SA
TIO
N
AF
TE
R
EX
PA
NS
ION
AF
TE
R
EV
AP
OR
AT
ION
0.051
sq m