Embed Size (px)
Citation preview

Mechanical Properties of Graded Thermodynamic Nickel Titanium Archwires in Bending and Torsion
by
Ouliana Oguienko
A thesis submitted in conformity with the requirements for the degree of Master of Science
Faculty of Dentistry University of Toronto
© Copyright by Ouliana Oguienko, 2017

ii
The Mechanical Properties of Graded Thermodynamic Nickel
Titanium Archwires in Bending and Torsion
Ouliana Oguienko
Master of Science
Faculty of Dentistry University of Toronto
2017
Abstract
Background: Graded thermodynamic nickel titanium (GT-NiTi) wires purportedly deliver
differential force levels in different archwire regions. No studies evaluating the force delivery
characteristics of such wires currently exist. Objective: To evaluate the mechanical properties of
GT-NiTi wires in bending and torsion. Methods: Six samples of 0.016 x 0.022” and 0.017 x
0.025” of GT-NiTi wires were divided into incisor, premolar, and molar sections and each
segment was tested in bending and torsion. The characteristics of the unloading superelastic
plateau were evaluated and compared with similar segments of non-graded, control NiTi wires.
Results: Statistically significant differences in mean force and moment levels were found
between the three sections of GT-NiTi wires, but not in control wires. Small but statistically
significant differences in length and slope were also found. Conclusion: GT-NiTi wires deliver
different forces and moments in different archwire sections. Clinicians can use this knowledge to
optimize force delivery for treatment.

iii
Acknowledgments
I would like to thank my supervisor, Dr. Sunjay Suri, for undertaking this project with me and
his unwavering support and encouragement throughout. I would also like to thank my research
committee members, Dr. Craig A. Simmons and Dr. Cari Whyne, for their input and
involvement.
Additionally, I would like to acknowledge Jian Wang for his extensive efforts in methods design
and testing, Dr. Wendy Lou and Bingqing Shen for statistical analysis they provided, Edwin
Wong for his help with error analysis, Alexander Josephson for editing, and Dr. John
Daskalogiannakis for being a great sounding board.
Special thanks to Dental Research Institute, Faculty of Dentistry, Alpha Omega Research Grant,
the Woodside fund and the John Fasken fund for their financial contributions.

iv
Table of Contents Acknowledgments .......................................................................................................................... iii
Table of Contents ........................................................................................................................... iv
List of Tables ................................................................................................................................ vii
List of Figures ................................................................................................................................ ix
List of Abbreviations .................................................................................................................... xii
Chapter 1 Review of Literature ........................................................................................................1
1.1 Introduction ..........................................................................................................................1
1.2 Properties of Nickel Titanium ..............................................................................................1
1.2.1 Austenite, Martensite, Shape Memory and Superelasticity .....................................2
1.2.2 Temperature Transition Range, Heat- and Stress- Induced Martensite ...................3
1.2.3 The Physics of Heat- and Stress- Induced Superelasticity and Shape Memory ......4
1.2.4 TTR and SIM ...........................................................................................................5
1.3 Types of NiTi Archwires .....................................................................................................6
1.3.1 Stabilized Martensitic (work-hardened) Nitinol ......................................................6
1.3.2 Superelastic-Active Austenitic NiTi ........................................................................7
1.3.3 Thermodynamic-Active Martensitic NiTi ...............................................................8
1.3.4 Graded Thermodynamic NiTi ................................................................................10
1.4 Comparing the Properties of Commercial NiTi Archwires ...............................................11
1.4.1 Lab Bench Tests .....................................................................................................12
1.5 Summary ............................................................................................................................17
1.6 Purpose of the Current Investigation .................................................................................17
1.7 Hypothesis..........................................................................................................................17
Chapter 2 Materials and Methods ..................................................................................................18
2.1 Wire Selection ....................................................................................................................18

v
2.2 Preparation of Specimens ..................................................................................................19
2.3 Experimental Design ..........................................................................................................19
2.3.1 Three-point bending test: .......................................................................................19
2.3.2 Torsion Test ...........................................................................................................21
2.4 Equipment ..........................................................................................................................23
2.5 Data Analysis .....................................................................................................................23
Chapter 3 Results ...........................................................................................................................25
3.1 Wires Dimensions ..............................................................................................................25
3.2 Bending and Torsion Curves .............................................................................................25
3.3 Repeatability of Superelastic Plateau Identification ..........................................................27
3.4 Error Analysis ....................................................................................................................28
3.5 Bending ..............................................................................................................................31
3.5.1 Mean Force of the Unloading Superelastic Plateau ...............................................31
3.5.2 Mean Length of the Unloading Superelastic Plateau .............................................34
3.5.3 Mean Slope of the Unloading Superelastic Plateau ...............................................37
3.6 Torsion ...............................................................................................................................40
3.6.1 Mean Torsional Moment of the Unloading Superelastic Plateau ..........................40
3.6.2 Mean Length of the Unloading Superelastic Plateau .............................................43
3.6.3 Mean Slope of the Unloading Superelastic Plateau ...............................................46
Chapter 4 Discussion .....................................................................................................................50
4.1 Cross-Sectional Dimensions ..............................................................................................50
4.2 Lab-Bench Tests ................................................................................................................51
4.2.1 Three-Point Bending Test ......................................................................................51
4.2.2 Torsion Test ...........................................................................................................52
4.3 Mean Force and Torsional Moment of the Unloading Superelastic Plateau .....................53
4.4 Mean Length of the Unloading Superelastic Plateau in Bending and Torsion ..................56

vi
4.5 Mean Slope of the Unloading Superelastic Plateau in Bending and Torsion ....................57
4.6 Limitations of the study .....................................................................................................59
4.7 Clinical Application ...........................................................................................................60
4.8 Suggestions for Future Research .......................................................................................61
Chapter 5 Conclusions ...................................................................................................................62
References ......................................................................................................................................63

vii
List of Tables Table 1. Retail prices (CAD) for various NiTi carried by GAC (as of June 2017)……...…….. 11
Table 2. Orthodontic archwires tested. Conventional thermodynamic archwires NS were used as
controls…………………………………………………………………………………………...18
Table 3. The height and width of the archwires tested. The results were the same for both BF and
NS …………………………………………………………………...……………………....…..25
Table 4. Intraclass correlation coefficient (ICC) for identifying the starting and ending point of
the unloading superelastic plateau for both bending and torsion tests. …………………….……28
Table 5. Mean force (SD) of the unloading superelastic plateau in bending. …………………..31
Table 6. Mean increase (+) in force of the unloading superelastic plateau in bending expressed as
percentage and grams of force difference from incisor to premolar (I à Pm), premolar to molar
(Pm à M) and incisor to molar (I à M)………………………………………………………..33
Table 7. Mean length (SD) of the unloading superelastic plateau in bending. ………………....34
Table 8. Mean percent change (+ increase) in length of the unloading superelastic plateau in
bending expressed as percentage and millimeter difference from incisor to premolar (I à Pm),
premolar to molar (Pm à M) and incisor to molar (I à M). ……………………………….…..36
Table 9. Mean slope (SD) of the unloading superelastic plateau in bending. ………………..…37
Table 10. Mean increase (+) in the slope of the unloading superelastic plateau in bending
expressed as percentage and grams per millimeter difference between incisor and premolar (I à
Pm), premolar and molar (Pm à M), and incisor and molar (I à M)… …………………….....39
Table 11. Mean moment (SD) of the unloading superelastic plateau in torsion. …………….…41
Table 12. Mean change (+ increase or – decrease) in the torsional moment of the unloading
superelastic plateau in bending expressed as percentage and grams�millimeter difference
between incisor to premolar (I à Pm), premolar to molar (Pm à M) and incisor to molar (I à
M). ……………………………………………………………………………………...…….….42
viii
Table 13. Mean length (SD) of the unloading superelastic plateau in torsion. ……………...….44
Table 14. Mean change (+ increase or – decrease) in length of the unloading superelastic plateau
in torsion expressed as percentage and degree difference between incisor to premolar (I à Pm),
premolar to molar (Pm à M) and incisor to molar (I à M). …………………………………...45
Table 15. Mean slope (SD) of the unloading superelastic plateau in torsion. …………………..47
Table 16. Mean change (+ increase or - decrease) in the slope of the unloading superelastic
plateau in bending expressed as percentage and grams�millimeter per degree change from incisor
to premolar (I à Pm), premolar to molar (Pm à M) and incisor to molar (I à M).
……………………………………………………………………………………………..….….48

ix
List of Figures Figure 1. Stress-strain curve showing superelastic behavior characteristic of some NiTi wires.
This occurs at certain stress levels due to crystalline re-organization such that both martensitic
and austenitic phases co-exist (modified from Ferreira et al.1)
………………………………………………………………………………...……….…………. 3
Figure 2. Austenitic-Martensitic phase transformation vs. temperature graph. M – martensite; A
– austenite, i – initial, f – final, d-deformation (temperature). As the temperature increases, the
phase of the alloy is converted from completely martensite phase (<Mf) to completely austenite
(>Af). After Md, SIM cannot be induced (modified from Ferreira et al.1) …………….............….4
Figure 3. Stress-strain curve for different types of archwires, see text for description (adapted
from Miura et al.2).. …………………………………………………………………………..…...8
Figure 4. Schematic diagram illustrating the division of an archwire into three segments –
incisor (I), premolar (Pm) and molar (M).……………………………………………………….19
Figure 5. Schematic diagram (left) and photographic (right) representation of the three-bending
test set-up…………………………………………………………………………….…………..20
Figure 6. Schematic diagram (left) and photographic (right) representation of the torsion test set-
up…………………………………………………………………………………………………22
Figure 7. Identification of the superelastic plateau on force-displacement curve acquired from
the three-point bending test.
…………………………………………………………………………………………………....24
Figure 8. Identification of the superelastic plateau on torsional moment-angle curve acquired
from the torsion test. …………………………………………………………………………….24
Figure 9. Typical load-deflection curves of the incisor, premolar, molar segments of each type
and dimension of wire tested (BF – BioForce, C – NeoSentalloy). …………….………………26
Figure 10. Typical angle-torsion moment curves of the incisor, premolar, molar segments of
each type and dimension of wire tested (BF – BioForce, C – NeoSentalloy). ...………………..27
x
Figure 11. Box plots representing the spread of the unloading superelastic plateau force values
in each section of the archwire for each archwire type and dimension tested in bending (BF =
BioForce, C = Control, NeoSentalloy)…………………………………………………………..32
Figure 12. Stacked columns representing the increase in the mean unloading superelastic plateau
force values in bending for 0.016 x 0.022” BF (left) and 0.018 x 0.025” BF (right). Darker blue
represents the additional force gain of its respective section relative to the adjacent, more anterior
section (light blue). Percentage increase is expressed at the top (I = incisor; Pm = premolar; M =
molar). …………………………………………………………………………………………...33
Figure 13. Box plots representing the spread of the unloading superelastic plateau length values
in each section of the archwire for each archwire type and dimension tested in bending (BF =
BioForce, C = Control, NeoSentalloy)… ……………………………………………………….35
Figure 14. Stacked columns representing the increase in the mean unloading superelastic plateau
length values in bending for 0.016 x 0.022” BF (left) and 0.018 x 0.025” BF (right). Darker
green represents the additional length gain of its respective section relative to the adjacent, more
anterior section (light green). Percentage increase is expressed at the top (I = incisor; Pm =
premolar; M = molar). …………………………………………………………………………..36
Figure 15. Box plots representing the spread of the unloading superelastic plateau slope values
in each section of the archwire for each archwire type and dimension tested in bending (BF =
BioForce, C = Control, NeoSentalloy)… ……………………………………………………….38
Figure 16. Stacked columns representing the increase in the mean unloading superelastic plateau
slope values in bending for 0.016 x 0.022” BF (left) and 0.018 x 0.025” BF (right). Darker
orange represents the additional length gain of its respective section relative to the adjacent,
more anterior section (light orange). Percentage increase is expressed at the top (I = incisor; Pm
= premolar; M = molar). ………………………………………………………………………...39
Figure 17. Stacked columns representing the increase in the mean unloading superelastic plateau
slope values in bending for 0.016 x 0.022” C (left) and 0.018 x 0.025” C (right). Darker orange
represents the additional length gain of its respective section relative to the adjacent, more
anterior section (light orange). Percentage increase is expressed at the top(I = incisor; Pm =
premolar; M = molar)…. ………………………………………………………………………..40

xi
Figure 18. Box plots representing the spread of the unloading superelastic plateau torsional
moment values in each section of the archwire for each archwire type and dimension tested in
torsion (BF = BioForce, C = Control, NeoSentalloy)…. ………………………………………..41
Figure 19. Stacked columns representing the increase in the mean unloading superelastic plateau
torsional moment values for 0.016 x 0.022” BF (left) and 0.018 x 0.025” BF (right). Darker blue
represents the additional moment gain of its respective section relative to the adjacent, more
anterior section (light blue). Percentage increase is expressed at the top (I = incisor; Pm =
premolar; M = molar)… ………………………………………………………..…………….…43
Figure 20. Box plots representing the spread of the unloading superelastic plateau length values
in each section of the archwire for each archwire type and dimension tested in torsion (BF =
BioForce, C = Control, NeoSentalloy) ……………………………………………………….…44
Figure 21. Stacked columns representing the decrease in the mean unloading superelastic
plateau length values as changes from anterior to posterior sections in torsion for 0.016 x 0.022”
BF (left) and 0.018 x 0.025” BF (right). Darker green represents the length decrease of its
respective section relative to the adjacent, more anterior section (light green). Relative percent
decrease is expressed at the bottom (I = incisor; Pm = premolar; M = molar) ………………….46
Figure 22. Box plots representing the spread of the unloading superelastic plateau slope values
in each section of the archwire for each archwire type and dimension tested in torsion (BF =
BioForce, C = Control, NeoSentalloy)… ……………………………………………………….47
Figure 23. Stacked columns representing the increase in the mean unloading superelastic plateau
slope values in torsion for 0.016 x 0.022” BF (left) and 0.018 x 0.025” BF (right). Darker orange
represents the additional length gain of its respective section relative to the adjacent, more
anterior section (light orange). Percentage increase is expressed at the top (I = incisor; Pm =
premolar; M = molar). ….……………………………………………………………………….49

xii
List of Abbreviations
ADA American Dental Association
BF GAC’s BioForce (Islandia, NY)
GT-NiTi Graded Thermodynamic Nickel Titanium
ISO International Organization for Standardization
NiTi Nickel Titanium
NGT-NiTi Non-Graded Thermodynamic Nickel Titanium
NS GAC’s NeoSentalloy (Islandia, NY)
SD Standard Deviation
SIM Stress-Induced Martensite
SS Stainless Steel
TTR Temperature Transition Range

1
Chapter 1 Review of Literature
1.1 Introduction Orthodontic archwires are an integral part of fixed orthodontic appliances. By engaging it into
the brackets, the archwire exerts a force that generates orthodontic tooth movement. The
magnitude of this force is important – a force too high may lead to root resorption or delayed
tooth movement, whereas a force too low may be insufficient to induce a biologic response.3 In
general, light continuous forces are thought to be more efficient in achieving the desired tooth
movements compared to heavy forces.4
In order to achieve light continuous forces, it is essential for the archwire to exhibit low stiffness
and high range. The length of the free wire between brackets, the cross-sectional dimension of
the wire, and the archwire alloy are three variables within the clinician’s control that influence
stiffness.4 In the early days of orthodontics, when stainless steel (SS) was the primary alloy used,
the only way to reduce stiffness for a particular application was to increase the wire length by
incorporating loops, or to change the size of the wire.4 With the advent of NiTi, the alloy type
has become an important factor in archwire selection.5
A plethora of NiTi archwires is available on the market today. The mechanical characteristics of
any given NiTi wire are strongly influenced by manufacturer’s processing and specifications.6–8
Thus the force delivery capabilities of these archwires are much less intuitive. The clinician must
rely on the information provided by the manufacturer, which often does not adequately describe
the force values that can be expected from the archwire.9 While a number of independent
studies6–8,10–14 have attempted to address this issue by comparing mechanical properties of
various NiTi alloys in vitro under the same conditions, the selection of tested commercial NiTi
wires is not comprehensive. The aim of the following literature review is to give the reader a
deeper understanding of NiTi wires in the context of orthodontic practice.
1.2 Properties of Nickel Titanium
The discovery of NiTi alloy can be traced back to the laboratory of W.J. Buehler, a metallurgist
working for the U.S. Naval Ordnance Laboratory in the early 1960s as part of the space

2
program.15 Using nickel and titanium in almost equal atomic proportions (55%Ni:45%Ti), he
developed the first NiTi alloy which he named Nitinol, an acronym for Nickel Titanium Naval
Ordnance Laboratory. Buehler observed that when the alloy was fixed in a specific shape, heat-
treated and subsequently cooled, it acquired special thermodynamic properties. In low
temperatures, the alloy could be plastically deformed with ease but return to its original shape by
merely increasing the temperature, a phenomenon not observed in most other metals.15
Furthermore, NiTi was found to possess a number of other valuable characteristics. Compared to
SS, NiTi is exceptionally resistant to permanent deformation, exhibits superb springback16 and is
3.5-7 times less stiff.17 Good biocompatibility and corrosion resistance of this alloy make it an
excellent choice to be used intraorally.18 Before differences between the various types of NiTi
archwires can be appreciated, it is essential to discuss the alloy’s unique crystal structure and
behavior including shape memory and superelasticity.
1.2.1 Austenite, Martensite, Shape Memory and Superelasticity
NiTi exists in two main solid-state crystalline phases, austenite and martensite. Austenite is the
stiffer form of the alloy that exhibits higher yield strength and is stable at higher temperatures. It
has a body-centered (cubic or tetragonal) configuration. Martensite is the soft, pliable form of the
alloy with lower strength and stiffness that is more stable at lower temperatures. It has a face-
centered (hexagonal close packed) configuration.1 Intermediate phase, rhombohedral “R” phase
with simple hexagonal configuration also has been identified.19
While the stiffness of the alloy in austenite phase is higher than in martensite phase, it is the
lowest when these phases coexist or if the R phase is present.20 In fact, it is when the alloy is in
the solid-solid transitional phase that the so-called ‘superelastic plateau’ is observed on a stress-
deflection curve (Figure 1). Clinically, this means that the wire exerts the same amount of force
over a range of deflections and alloys capable of producing such behavior are deemed
superelastic.1
Shape memory is another unique property arising from the alloy’s ability to reversibly convert
between the two solid phases. Clinically, this means that the wire will be able to return to its
parent (austenitic) shape after an apparent permanent deformation while in the martensitic state.2

3
The conversion from the austenitic to martensitic phase can occur either by lowering the ambient
temperature or by applying stress. Thus, a distinction is often made when describing the
superelastic and shape memory properties of NiTi alloys. Temperature-related superelasticity is
referred to as thermoelastic behavior and stress-related superelasticity is called pseudoelastic
behavior.19 Similarly, shape memory can be either temperature- or stress-induced, respectively.
The type of behavior that can be expected from any given NiTi wire is related to its temperature
transition range (TTR) and is specified by the manufacturer.19
1.2.2 Temperature Transition Range, Heat- and Stress- Induced Martensite
Temperature transition range (TTR) describes the temperature range at which the martensitic
phase changes to the austenitic phase and vice-versa.21 For each NiTi archwire, four temperature
points can be defined: Ms, Mf, As, Af. Ms and Mf refer to martensite starting and finishing
temperatures and As, Af refer to austenite starting and finishing temperatures, respectively
(Figure 2). Below Mf, only martensite phase exists and above Af only austenite phase exists.
Between these points, the alloy exhibits both phases in various proportions.
Figure 1. Stress-strain curve showing superelastic behavior characteristic of some NiTi wires. This occurs at
certain stress levels due to crystalline re-organization such that both martensitic and austenitic phases co-exist
(modified from Ferreira et al.1)

4
Md
It can be said that between alloy’s specific Mf and Af the wire exhibits thermoelastic behavior. In
other words, as the temperature is lowered below Af, the alloy undergoes heat-induced
martensite transformation. At temperatures higher than Af, superelasticity can still be observed
but with bending of the alloy. This is called pseudoelastic behavior and occurs due to stress-
induced martensite (SIM) transformation. The temperature limit until which SIM can be
induced is called Md.19
For a typical NiTi alloy, TTR is broad and can range from -200 to +200°C. However, small
additions of other elements such as copper or specific thermal processing can significantly
narrow the range.18
1.2.3 The Physics of Heat- and Stress- Induced Superelasticity and Shape Memory
When the temperature is lowered below Af, the atoms in austenite crystalline structure undergo a
type of “shearing” to assume a new atomic arrangement.15 This so-called ‘twinned’ martensite
Figure 2. Austenitic-Martensitic phase transformation vs. temperature graph. M – martensite; A – austenite, i –
initial, f – final, d - deformation (temperature). As the temperature increases, the phase of the alloy is converted
from completely martensite phase (<Mf) to completely austenite (>Af). After Md, SIM cannot be induced
(modified from Ferreira et al.1)
………………

5
appears no different than the alloy in austenite phase on a macroscopic scale, however, its
mechanical properties are different. This difference is easily appreciated when a force is applied.
Compared to the alloy in the stiff austenitic state, the ‘twinned’ martensite can be plastically
deformed with relative ease, at which point it is referred to as ‘de-twinned’ martensite.18
Conversely, when the temperature increases, the atoms’ motion is also increased and the
arrangement changes to a structure able to accommodate the increased motion.15 At a
macroscopic scale, the previously made bends are unraveled and the alloy assumes the original
parent shape with its corresponding mechanical properties.18
SIM transformation occurs because the introduced strain also leads to atomic “shearing” and
hence ‘de-twinned’ martensite state.15 Up to 8% strain, the stress/strain rate reaches a plateau as
the proportion of martensite phase increases. Strain above 8%, however, is beyond martensite
shear and thus not recoverable. This is significant given that other metals such as SS are only
able to regain full recovery up to a maximum of 1% strain.18
1.2.4 TTR and SIM
The TTR for NiTi alloys can be set sufficiently narrow to take advantage of these phase
conversions in orthodontic treatments. For NiTi alloy with 1:1 nickel to titanium ratio, the TTR
is around +100°C to below -50°C.18 This range can be lowered by varying the ratio of nickel to
titanium or by an addition of small amounts of other elements such as cobalt and iron.15 For
instance, some NiTi wires have Af set close to the body temperature. This indicates that the wire
is in phase transition at room temperature and thus pliable and easy to engage into brackets.
However, once it reaches oral temperature, the alloy turns completely austenitic. This allows it to
regain its initial archform and apply the necessary orthodontic force to drive tooth movement.18
As already mentioned, the highest temperature at which SIM can be induced is referred to as
Md.19 Fortunately this temperature limit is usually above Af and oral temperatures,22 meaning
that the martensite can be induced in local areas of severe crowding while the rest of the wire
remains austenitic. This is beneficial as the force levels will be decreased rather than increased in
the areas of most crowding, provided that Af is not much below the oral temperature. If Af is
much too low, the wire will have a stronger tendency to remain austenitic and stiff even with
deflections.22

6
It is important to note the interdependent relationship between TTR and stress. Testing a few
commercial thermodynamic NiTi wires in vitro, Santoro et al.20 found that when the wire was
engaged into brackets simulating clinical scenarios, the Af increased as a function of stress. That
is, higher temperature was needed to turn a stressed wire to fully austenitic phase compared to a
relaxed one. Conversely, the amount of stress required to induce SIM is directly related to
temperature such that the higher the temperature, the more stress is needed to induce martensite.8
Unstandardized temperature and wire states (stressed vs. unstressed) are among the many factors
that complicate measuring force levels intraorally and are credible sources of variation in studies
that attempt to characterize force delivery of NiTi wires in vitro.22
1.3 Types of NiTi Archwires After Buehler’s discovery of the NiTi alloy, it was George F. Andreasen who brought NiTi
archwires into orthodontic use in 1976.23 Unitek Company first introduced NiTi wires
commercially under its original name, Nitinol. Since then, a large diversity of NiTi wires has
become available and the name NiTi serves as an umbrella term that describes the family of
these archwires today.18 Based on their mechanical properties and behavior, NiTi archwires can
be grouped into four categories. Evans and Durning21 proposed a chronological classification of
orthodontic archwires to include the following five groups:
• Phase I: non-NiTi alloys such as stainless and gold alloys (1990-1960’s)
• Phase II: stabilized martensitic alloys such as original Nitinol (the 1970’s);
• Phase III: superelastic-active austenitic alloys (eg. Chinese and Japanese, 1980’s)
• Phase IV: thermodynamic-active martensitic alloys (eg. CuNiTi 40°C, early 1990’s)
• Phase V: graded thermodynamic alloys (eg. GAC’s BioForce (BF), late 1990’s).
The following is a discussion of Phase II to Phase V NiTi archwires.
1.3.1 Stabilized Martensitic (work-hardened) Nitinol
The original Nitinol wire did not exhibit phase transition characteristics because cold working
inhibited this property and thus the wire was non-superelastic.22 Although it did not demonstrate
shape memory or superelasticity (hence the name, ‘stabilized martensitic’), compared to the
available archwires at the time, it still enjoyed great popularity due to its low stiffness (20% of

7
SS) and increased working range (2.5 times SS).24 Clinicians appreciated its ability to be
engaged into the most crowded cases without being permanently deformed.
1.3.2 Superelastic-Active Austenitic NiTi
In the early 1980s, work at the General Research Institute for Non-ferrous Metals in Beijing and
the Furukawa Electric Co Ltd in Japan lead to the development of the first superelastic wires.19
Similar in composition, these wires came to be known as Chinese and Japanese NiTi wires,
respectively. The TTR of these superelastic wires is set below oral temperature, therefore, they
are austenitic at the habitual oral temperature but exhibit SIM under stress.25 These wires have
excellent springback properties (4-5 times SS) and provide constant force levels at increasing
deflections (superelastic plateau).2,26
Using tensile and three-point bending tests, Miura et al.2 showed that compared to SS, cobalt-
chromium nickel (Co-Cr-Ni), and work-hardened NiTi (Nitinol), the superelastic NiTi archwires
were the least likely to show permanent deformation after activation. It was also the only wire
type to exhibit a superelastic plateau on a load-deflection curve (Figure 3). While the stress
increases linearly with strain in other archwires, in superelastic NiTi archwires this is true up to a
point (point a). After a certain level of strain is reached, the stress remains relatively constant
despite increasing strain, demonstrating the superelastic plateau (a-b, and d-c). This occurs due to
the phase transformation from austenite (point a) to martensite (point b) and reversely from
martensite (point c) to austenite (point d). The difference in stress values between the loading
and unloading curves is called hysteresis and can also be observed with the superelastic
archwires. Hysteresis represents the difference in force needed to engage the wire into the
brackets (loading) and the force exerted by the wire onto the dentition (unloading).4 The
unloading portion (c-d) is typically of interest to researchers and clinicians as it represents the
working force driving orthodontic tooth movement.9
In summary, due to SIM, superelastic NiTi wires are able to deliver low force levels in areas of
crowding over large wire deflections. They were also thought to cause more physiologically
sound tooth movement with minimal side effects. Needless to say, this archwire has become a
popular choice for the aligning stage of orthodontic treatment.21

8
1.3.3 Thermodynamic-Active Martensitic NiTi
As the manufacturing processes improved, it became possible to narrow the TTR and produce
alloys that would also exhibit heat-induced shape memory effect and thermoelasticity in contrast
to pseudoelasticity characteristic of the previous generation NiTi.21 While active-austenitic NiTi
wires are fully austenitic at and above room temperatures, the Af of thermodynamic active
martensitic NiTi wires is above room temperatures. This implies that they only turn ‘rigid’
(austenitic) when inside the mouth but are relatively pliable and are easily engaged into most
malpositioned brackets at room temperature.12 How ‘rigid’ the wire becomes intraorally depends
on the intraoral temperature and the Af temperature set by the manufacturer. If the predominant
average intraoral temperature is considered to be around 35.5°C,27 thermodynamic NiTi wires
with Af of 27°C would generally deliver higher forces than a wire with Af of 40°C which would
Figure 3. Stress-strain curve for different types of archwires, see text for description (adapted from Miura et al.2)

9
only achieve full austenitic phase and the highest force expression after occasional sips of hot
food/liquid.8
The ability to more precisely control TTR has allowed the manufacturers to develop wires of the
same dimension but different force levels. Sentalloy and NeoSentalloy (NS) archwires by GAC
are examples of thermodynamic archwires and are available in heavy, medium, and light force
variety as dictated by their individually set Af. Copper NiTi (CuNiTi) wires are also classified as
thermodynamic. They were developed after discovering that by incorporating small amounts of
copper into NiTi alloys, it increased their sensitivity to oral temperatures.21 They are similarly
available in three types, CuNiTi 27°C, CuNiTi 35°C, and CuNiTi 40°C, the names of which
reflect their Af temperatures and correspond to heavy, medium, and light force delivery,
respectively.28
The mechanical properties of thermodynamic NiTi have been considered to have several
advantages over previous generations. These archwires generally deliver 25-30% of the force of
active austenitic archwires at the same temperatures.21 Since the manufacturing of such wires
allows relatively large rectangular dimension wires to deliver very light forces, they can
potentially be used in the very beginning of treatment to gain three dimension control.21
Exceptionally low forces may be especially beneficial in treatment of patients with reduced
periodontium.22 Some evidence also suggests that dynamic loading may be more favorable for
bone remodeling than static loading.29 Since the force levels are likely to fluctuate throughout the
day with the intake of food/drinks with thermodynamic archwires, these archwires may be more
biologically favorable.21
On the downside, thermodynamic wires are more expensive and very sensitive to manufacturing
processes. They may provide no or very little force in the unloading curve if not made correctly
or used in small diameters, and may thus be inefficient.8 It is also not possible to “feel” how
much force the wire may be delivering intraorally as with conventional non-thermal wires.4 It is
important to note that the manufacturers of thermoelastic wires typically report force values
delivered at 35°C to 37°C, considered representative of oral temperature for an average
individual.27 However, in mouth-breathers, the intraoral temperature is lower, typically in the
ranges of 30-33°C, and thus thermodynamic wires with lower Af may need to be used to achieve
the desired force levels. Indeed, Sakima et al.8 showed that very ‘light’ rectangular thermal NiTi

10
wires such as Ormco’s CuNiTi40°C and NS F200g exerted no force in temperatures below 35°C
in a bending test and thus may not be appropriate for mouth breathers.
1.3.4 Graded Thermodynamic NiTi
It is generally accepted that to achieve uniform stress that optimizes the rate of tooth movement,
the force magnitude should correspond to the surface area of the tooth.4 More specifically, much
lower forces are needed to efficiently move anterior teeth than posterior teeth. Graded
thermodynamic NiTi (GT-NiTi) archwires were developed based around this concept and claim
to deliver progressively heavier forces from anterior to posterior sections of the archwire of
uniform dimension.21 The development of these archwires became possible when direct electric
resistance heat treatment (DERHT) was introduced. It uses electric pliers connected to a power
supply to isolate archwire segments and deliver electric current to generate heat thereby
modifying the TTR.5 DERHT allows the same archwire to have different TTRs and thus
different force levels within the same archwire rather than between individual archwires as in
non-graded thermodynamic (NGT-NiTi) described above.21 It is critical that annealing is well
controlled as excessive heat treatment is known to obliterate superelastic properties of NiTi
wires.2,24
Many brands offer their own version of GT-NiTi archwires today including BF (GAC), Titanol
Triple Force (Forestadent), Tri-Force Thermal (Ortho Organizers), and Tritanium Memory Wire
(American Ortho). BF archwires were the first phase V NiTi archwire to become available on the
market.21 They are currently available in square or rectangular cross sections. For 0.016 x 0.022”
archwire, the manufacturer claims to deliver approximately 80 grams of force at the incisor
section, 180g at premolar level, and 280g at the molars in a three-point bending test deflected to
2mm over a 14mm span at body temperature.30 The force level is claimed to gradually increase
from anterior to posterior sections in increments.
These archwires are labeled as body heat-activated, superelastic and exhibit shape memory
effect.30 One may also obtain BF archwires with IonGuard finish. Through ionization implanting
process, these archwires purportedly have less friction than non-coated wires with no effect on
its superelastic properties.30 Compared to other NiTi archwires carried by the same company, BF
archwires are at the top of the price range (Table 1).

11
Archwire type (GAC) Price per 1 pack (10 wires)
Lowland $22.57
Sentalloy $62.77
Copperloy $84.50
NeoSentalloy $90.67
BioForce $113.37
Table 1. Retail prices (CAD) for various NiTi carried by GAC (as of June 2017).
1.4 Comparing the Properties of Commercial NiTi Archwires Slight variations in composition and manufacturing processes strongly influence the mechanical
properties of NiTi archwires. The sensitivity of NiTi to these factors is so significant that
controlling the chemistry and processing have presented a continuous challenge for the makers
of NiTi archwires and is reflected in the evolution of their types.31 To illustrate, an increase in
nickel content from 50% to 51% will result in a TTR change of 100°C. In order to achieve a TTR
within ± 5°C accuracy, the NiTi composition must be controlled within ± 0.05%. Such
compositional control is significantly more stringent than SS and requires more precise
chemical-analysis methods than the standard to confirm the alloy formulation.31
For the above reason, large variation in mechanical properties of NiTi wires is observed between
different manufacturers. Even within the same batch of some NiTi brands, Tonner and Waters26
found 9-10% variation in the initial slopes and plateau force values of the load-deflection curves.
Although companies use terms such as “superelastic” and “thermally active” to label their
products, these terms can be quite misleading as the actual behavior of the archwires can be quite
varied.
Some brands provide more information about their product, such as TTR and force levels at
specific deflections, which can be helpful. However, the testing conditions used to derive these
values are not always appropriate or representative of the clinical situation and must be kept in
mind.22 To verify manufacturers’ promotional claims and meaningfully compare commercially
available NiTi archwires, a handful of researchers have surveyed their mechanical properties

12
using standardized testing. Even though the results obtained from these in vitro tests cannot be
directly applied to clinical scenarios, the test provides good reproducibility and a common
platform to evaluate mechanical properties of the existing archwires.10,26
1.4.1 Lab Bench Tests
Orthodontic archwires have been studied using tension,32 bending,6–8,10,12,33–35 torsion,13,14,36–38 or
cantilever tests.24,39 Traditionally, cantilever test has been the test of choice. However, for
archwires with good springback properties such as NiTi, this test can erroneously suggest the
existence of superelastic-like characteristics.2,24 Thus for NiTi archwires, bending and torsion are
thought to be the most clinically relevant tests and have been employed in more recent literature.
1.4.1.1 Three-Point Bending
Historically, three-point bending test draws from structural engineering via simple beam theory.
It assumes a passive straight wire segment, small deflections, and no friction between wire and
supports (brackets). The relationship between force (F) and deflection (𝛿) in simply supported
three-point bending test for linearly elastic material can be summarized as follows:40
𝐹 =48𝐸𝐼𝛿𝐿*
where 𝐿 is the distance between supports, I is the moment of inertia of the cross-section, and E is
the modulus of elasticity. This equation is useful when comparing archwires of different alloys
and cross-sectional configurations in the same three-point bending set up.34
Extensive work by Kusy and colleagues41,42 have utilized theoretical calculations to characterize
orthodontic archwire materials by stiffness, strength, and range in easy-to-use nomograms to aid
clinicians with archwire selection. Schaus and Nikolai,43 however, criticized the application of
the bending theory to orthodontic applications on the grounds that many theoretical assumptions
are violated while some important clinical influences are unaccounted for. Studying flexural
stiffness of conventional (non-elastic) preformed archwires, they found that the effect of elastic
moduli and inter-bracket distance is less significant than the theory suggests. What is more,
parameters such as preformed curvature of the wire at the activation site, malalignment direction
with respect to the curvature, bracket-wire friction, and pre-activation fit to the dentition also

13
modified the regional flexural stiffness of the archwire. Moreover, the theory is only valid for
deflections much smaller than what can be encountered clinically (2-3mm).12
Applying the simple beam theory to shape memory alloys, such as superelastic NiTi, is even
more problematic. This is because the alloy does not follow the linear stress-strain relationship
described by Hooke’s law that characterizes conventional alloys.16 Moreover, flexural rigidity
(EI) in superelastic NiTi wires decreases with increased deflection range, unlike their SS
counterparts where it remains constant.16,44 Thus, simple beam formulas to determine flexural
rigidity can only be applied to the performance of these archwires during their austenitic states.
They cannot be applied during SIM states which are most relevant to clinical applications. Thus,
these wires cannot be categorized by their mathematically derived elastic modulus.
Although stress-strain curves cannot be easily generated for NiTi wires, the three-point bending
test is, nonetheless, an important tool as it provides a common platform to compare the
performance of these wires in a clinically meaningful way.10 To standardize the results and
compare data across studies, the American Dental Association recommends employing the ISO
1584145 three-point bending protocol for testing archwires used in fixed and removable
orthodontic appliances. Many studies have followed this recommendation.6,10–12,17,46–49 Since
achieving low continuous forces is of utmost interest to a clinician, evaluating the parameters of
the unloading superelastic plateau, such as force levels, has been the focus.
To better emulate the clinical scenario, other studies have tested the wires in deflection secured
to brackets in various configurations ranging from three-brackets9 to phantom head jigs with a
full arch bracket set.48 Therefore, when comparing the values between studies, one must be
cognizant of the type of test used to derive the data as the values may vary considerably
depending on the method of testing. To illustrate, for a given archwire, Oltjen et al.17 found the
stiffness to be 1.5-4 times higher at 2 mm deflections and up to 40 times higher at 3 mm
deflections in a three-bracket bending test compared to a three-point bending test.
1.4.1.1.1 Superelasticity
When testing commercially available NiTi archwires, it has been shown that work-hardened
wires typically exhibit larger differences in loads between increments of deflection compared to
active austenitic and active martensitic wires. This implies that the wire shows a more constant

14
force exertion (superelastic plateau) over an increasing range of activations.11 However,
considerable variation in the superelastic properties between brands of different ‘superelastic’
NiTi wires as measured on a load-deflection curve has been reported. Segner and Ibe 9 and
Bartzela et al.10 found that a significant fraction of NiTi archwires that claimed superelastic
properties showed either no or only weak superelastic behavior.
Since one of the fundamental appeals of using NiTi is their ability to deliver constant forces over
a range of activation (ie. superelastic plateau), some studies examined the deflection needed to
induce superelasticity. Of truly superelastic archwires, Segner and Ibe 9 showed that a deflection
of at least 0.8 mm was needed for pseudoelastic property to be expressed in a three-bracket
bending test.9 Using a three-point bending test, Tonner and Waters 47 showed that a deflection of
2 mm was needed. Thus, in routine orthodontics, where deflections of 1 mm are most common,
the archwire may not reach the threshold for SIM transformation to take advantage of its
superelastic behavior.9 Therefore, in cases of minor crowding, the force levels would be
proportional to the extent of deflection as with a standard archwire and superelastic NiTi may not
render an advantage over conventional NiTi or multistranded SS.9
1.4.1.1.2 Force Levels
In general, the literature tends to support the statement that work-hardened NiTi wires deliver the
highest force levels followed by superelastic (austenitic-active) and thermal (martensitic-active)
archwires at oral temperatures. Using a three-point bending test at 37°C, Nakano et al.11
compared the mechanical properties of 0.016” and 0.016 x 0.022” wires of 42 brands from nine
different manufacturers. For 0.016” wires at 1.5 mm deflection, a difference of 136 g in load was
observed between the ‘heaviest’ work-hardened archwire (Aline) and the ‘lightest’ NiTi wire
(CuNiTi35°C). This difference was approximately double for 0.016 x 0.022” gauge wires.
Using a three-bracket bending test, Sakima et al.8 compared a number of rectangular 0.019 x
0.025” thermodynamic and active-austenitic NiTi archwires. At 37°C, the study found that the
force at the unloading plateau ranged from 178-302g for the selected thermal archwires and 435-
659g for the austenitic archwires. CuNiTi 40°C (Ormco) and NS F200 delivered the lowest
forces followed by CuNiTi 35°C (Ormco) and Thermal NiTi (Wonder Wire Corp.). Lombardo et
al.7 also corroborated these results and found that thermodynamic archwires delivered 24%
lighter forces over a 13% greater range of deflections compared to their austenitic counterparts.

15
They concluded that thermodynamic archwires deliver lighter, more continuous forces over a
greater deflection range.
While certain generalizations can be made, it is important to keep in mind the large variations in
force-deflection characteristics that exist between different manufacturers. This is so even for
wires that are labeled with the same descriptive key words such as “superelastic” and “thermally-
active”. In fact, Tonner and Waters26 found that “superelastic” NiTi wires of the same size but
different manufacturer varied by as much as 600% in force levels at oral temperature.26
Besides the type and brand of NiTi, archwire size and the extent of deflection also have an
influence on the force levels. Gatto et al.6 recently conducted a study that evaluates these factors.
Using a three-point bending test at 37°C, the authors compared the performance of 0.014” and
0.016” superelastic NiTi archwires with their thermal counterparts from four popular
manufacturers. As expected, archwires that were bigger in diameter, deflected to a smaller
extent, and those that were austenitic active were associated with higher force levels. Another
interesting finding was that the superelastic archwires from 3M and GAC tended to produce
lower force levels than the archwires from American Orthodontics and Rocky Mountain
Orthodontics.
The effect of deflection on force levels is important one to keep in mind in clinical practice. In
this study as well as in one by Tonner and Waters26 it has been shown that the higher the degree
of activation, the lower the force tends to be. This means that simply retying the wire back into
the brackets can increase its active force.16
To summarize, the NiTi archwires in order of decreasing force levels are work-hardened,
superelastic (austenitic active), and thermal (martensitic active). Thermal archwires also exhibit
superelasticity at smaller deflections and are active over a longer range of deflection compared to
the other archwires. Currently, only one study mentions testing phase V or graded
thermodynamic NiTi wires. Mullins et al.50 have looked at 0.018 x 0.025” BF wires and found
the force of the superelastic plateau in the anterior region to be comparable to NS F100. No
published studies that confirm region-specific force levels claimed by the manufacturer exist.

16
1.4.1.2 Torsion
While the superelastic effect in bending has been explored abundantly,2,7–12,14,26,33,47,48,50 fewer
studies evaluated it in torsion.13,14,36,38,51,52 The behaviors of an alloy under bending stress is
different when under torsional stress and must be distinguished.51 In orthodontics, third order
movements depend on the torsional load created by twisting of an edgewise wire within the
bracket slot. Unlike in bending, no ADA-recommended protocols for torsion exist and various
methods have been employed in the literature. Torsional moment values at various degrees of
twist are most commonly reported.
Current evidence suggests NiTi wires may not be an ideal choice for torque expression compared
to SS. A recent study13 compared torsional behavior of ten commercially available 0.017 x
0.025” NiTi and multistranded SS wires in 0.018-slot brackets. The group found that most NiTi
wires did not exhibit superelasticity in torsion as described in bending. Moreover, multistranded
D-Rect SS rectangular archwire showed a more favorable torsional stiffness than the majority of
NiTi archwires at 35°C.
Among the NiTi wires, the expression of the superelastic effect also appears to have a torque
angle threshold. Partowi et al.36 studied the mechanical properties of SS and superelastic NiTi in
torsion and found that the mean starting point of the load-deflection plateau for superelastic NiTi
wires was 20° at oral temperatures, on average. Moreover, the torquing moment produced at the
plateau of some, especially smaller, rectangular superelastic NiTi wires were found to be below
the moment threshold needed to induce torque movement in incisors. A large manufacturer-
dependent variation in torsional behavior and load has been reported14,36 such that predicting
torque delivery based on NiTi archwire size is not feasible.36
The effect of temperature on the mechanical properties of NiTi wires in torsion has also been
explored. Bolender et al.13 found that the expression of the superelastic plateau was temperature
dependent with greater number of the tested NiTi wires showing superelastic plateau at 20°C
compared to 35°C and no plateau at 50°C. Meling and Ødegaar53 found that exposure of the
thermodynamic superelastic rectangular NiTi wires to cold water (10°C), reduced the torsional
stiffness up to 85% compared to the torsional stiffness at body temperature, and remained up to
50% less stiff after two hours at oral temperatures. This is in contrast to exposure to hot water
(80°C), which increased the torsional stiffness of the wires. This effect disappeared quickly

17
thereafter, however. This study suggests the expression of torque when using some
thermodynamic NiTi wires may be reduced after ingestion of cold liquids or foods.
1.5 Summary NiTi wires have revolutionized the practice of orthodontics. Due to their unique properties of
shape memory and superelasticity, these wires are able to deliver low and continuous forces most
favorable for orthodontic tooth movement. Their manufacturing, however, is a highly
sophisticated process requiring extreme precision in chemical composition, processing, and heat-
treatment. Proprietary variations in manufacturing have led to the production of a large diversity
of NiTi wires each displaying unique behavior that may or may not optimize their
superelastic/shape memory potentials. Discrepancies in claimed and actual properties of NiTi
wires have been shown through standardized testing of different NiTi wires by independent
investigators. Such studies are helpful in guiding clinicians in archwire selection. The properties
of the latest generation NiTi wire, GT-NiTi, have not been explored in the literature.
1.6 Purpose of the Current Investigation To characterize the mechanical properties of GT-NiTi in different regions of the wire and
compare them to those of NGT-NiTi in bending and torsion.
1.7 Hypothesis There is no difference in the mean force, length, and slope of the superelastic plateau during
deactivation between anterior, middle, and posterior sections of BF archwire as determined by
the three-point bending test.
There is no difference in the mean moment, length, and slope of the superelastic plateau during
deactivation between anterior, middle, and posterior sections of BF archwire as determined by
the torsion test.

18
Chapter 2 Materials and Methods
2.1 Wire Selection Two cross sectional sizes of BF wires (0.016 x 0.022” and 0.018 x 0.025”) were selected for this
experiment. These archwire dimensions were chosen to represent the ends of the range of
archwires used most commonly. BF brand was selected to represent GT-NiTi wires as it was the
first of its kind to be developed and released on the market.30 Medium maxillary BF AccuForm
archwires were tested and medium maxillary AccuForm NS archwires of the same dimensions
(F240g 0.016 x 0.022” and F300g 0.018 x 0.025”) were used as controls (Table 2). The
dimensions of archwires were verified with a digital caliper with ±0.005 mm sensitivity (6”
Mastercraft Digital Caliper). The wires were obtained from the manufacturer and wires from the
same lot number were used.
Code Wire Description LOT # Size (inch) Type of NiTi
BF 16 x 22 BioForce, GAC K2Y4 0.016 x 0.022 Graded Thermodynamic
C 16 x 22 NeoSentalloy (F240), GAC K594 0.016 x 0.022 Thermodynamic
BF 18 x 25 BioForce, GAC K3Y4 0.018 x 0.025 Graded Thermodynamic
C 18 x 25 NeoSentalloy (F300), GAC K2X4 0.018 x 0.025 Thermodynamic
Table 2. Orthodontic archwires tested. Conventional thermodynamic archwires NS were used as controls.

19
2.2 Preparation of Specimens For the three-point bending test, each of the wire segments was prepared as follows: one side of
the archwire was divided into three consecutive 30 mm long segments representing incisor,
premolar, and molar sections (Figure 4). Fifteen millimeters on either side of the machined
midline of the archwire was marked with a permanent marker (0.5mm) to define the incisor
section and one of the remaining segments was divided into two segments of equal length (30
mm) corresponding to the premolar and molar regions. The mid-point of these latter segments
was also marked on the wire to guide the testing
position. One archwire yielded one sample of each
region and the rest of the wire was discarded as shown.
The length was measured by adapting a 30mm long
cord along the archwire and cuts were made using an
orthodontic ligature cutter. In compliance with ISO
15841 (2014)45 recommendation, six specimens of a
single product from one batch were used for each test.
Thus, each segment was loaded and unloaded once and
the test was repeated on six different samples of the
same region of wires to obtain an average.
The same specimens (n=6) reduced to 15 mm in length
were used for torsion testing. A total of 72 specimens
were tested. Specimen preparations and mounting were
done by one investigator.
2.3 Experimental Design
2.3.1 Three-point bending test:
The testing specifications closely follow ISO 1584145 standards for orthodontic wire testing for
type 2 wires (wires that display nonlinear elastic behavior), however, after developing the
methodology through a pilot investigation, some modifications were made in order to allow
testing of the curved sections of the archwire. The following protocol was employed (Figure 5):
M
Pm
I
Figure 4. Schematic diagram illustrating
the division of an archwire into three
segments – incisor (I), premolar (Pm)
and molar (M).
30 mm

20
• The crosshead rate was 1mm/min
• The wire was subjected to a three-point bend test
• A span of 10 mm between supports was utilized
• The wire was tested in the bucco-lingual direction of the wire with indenter loading on
the lingual side
• The wire was lightly held by custom-built slotted frames to minimize wire twisting
during deflection
• Deflections were carried out with centrally-placed indenter
• The wire was deflected to 3.1 mm
• Preloading was ~0.2 N
• The radius of indenter and supports was 0.2 mm
The test was performed at a temperature of 36±1°C to simulate oral temperature using a water
bath. The temperature was monitored continuously using a laboratory thermometer (±0.5°C) by
the same operator performing the testing.
Figure 5. Schematic diagram (left) and photographic (right) representation of the three-bending test set-up.

21
2.3.2 Torsion Test
The specimen was held at one end by a metal clamp and secured to a pulley using dental
composite (Dentsply, Spectrum TPH3, Konstanz, Germany) on the other. The pulley was
suspended on a SS wire via a cord (PowerPro Spectra microfilament braided fishing line, 50lb,
Springfield, MO) to allow free rotation. The translational movement of the pulley was restricted
by a custom-built metal frame to safeguard pure rotational movement. The distance between
attachments (the length of free wire) was 5 mm. Each sample was loaded in torsion by vertical
displacement of lever arm (SS wire) to a maximum of 4.6 mm, yielding ~45° of rotational
displacement of the pulley and unloaded to zero with a speed of 2.5 mm/min. A 50 N load cell
was used at 2.5 N scale with ~0.1 N preloading, and testing was done at 36±1°C temperature
using a water bath (Figure 6). The temperature was monitored continuously using a laboratory
thermometer (±0.5°C) by the same operator performing the testing. Rotational angle was
registered with standardized photographs of the pulley taken at every 1 mm displacement (Figure
6, right bottom) during activation and deactivation. In every photo, the angle of rotation was
measured using a protractor. The average linear displacement in millimeters was converted to
average rotation displacement in degrees using linear regression. The torsional moment was
calculated as force times the radius of the pulley and the converted data was used to generate
torsional moment-angle curves.

22
Figure 6. Schematic diagram (left) and photographic (right) representation of the torsion test set-up.
LoadCell
4.6mm
45°
5mm10mm
LoadCell
Metalframe
Pulley
Cord
Stainlesssteelwire
Specimen

23
2.4 Equipment Instron® 4301 mechanical testing machine (Instron Corporation, Norwood, Massachusetts) with
a 50 N load cell connected to a computer was used to record the displacement and load values for
both tests (±0.0005N and ±0.0005mm). The testing was done at the University of Toronto,
Faculty of Dentistry and the Instron machine was operated by a lab technician.
2.5 Data Analysis The force-deflection and moment-torsion curves were obtained for each segment of the wire.
Load values were converted from Newton (N) to grams of force (g). The superelastic plateau on
the unloading curves was identified as in the previous investigations9,13 and is illustrated in
Figures 7 and 8. The tangent lines were visually approximated to the unloading curve and end
points identified (as shown) by one investigator using Microsoft Excel V15.20. Mean values and
SD (n=6) for force (g) or torsional moment (g•mm), length (mm or °), and slope (g/mm or
g•mm/°) of the plateau were then calculated using the same software. The data was statistically
analyzed using mixed model approach considering wire type, size, and section of the wire as
factors within their respective tests using SAS9.4. Multiple pairwise comparisons with Tukey-
Kramer adjustments were subsequently undertaken as needed. Repeatability of the superelastic
plateau identification for each test was measured using intraclass correlation coefficient in SPSS
Version 20.0.

24
Figure 7. Identification of the superelastic plateau on force-displacement curve acquired from the three-point
bending test.
-100
0
100
200
300
400
500
600
700
800
-0.5 0 0.5 1 1.5 2 2.5 3 3.5
Force(g)
Displacement(mm)
TypicalForce-DisplacementCurve
slope average force
average length
Figure 8. Identification of the superelastic plateau on torsional moment-angle curve acquired from the torsion test.
-100
0
100
200
300
400
500
600
700
0 5 10 15 20 25 30 35 40 45 50
TorsionalM
oment(g*mm)
Angle(°)
TypicalTorsionalMoment-AngleCurve
averagetorsionalmomentslope
averageangle

25
Chapter 3 Results
3.1 Wires Dimensions The dimensions of wires tested showed to correspond to their respective nominal size with the
exception of the height of 0.018 x 0.025” wires which were smaller by 0.017 mm. The
dimensions were found to be consistent throughout the archwire in both BF and control wires
with no difference in height or width of the segments between the three sections of their
respective nominal sizes (Table 3).
Height Width
incisor premolar molar incisor premolar molar
16 x 22 Measured 0.41 mm or 0.016 inch 0.56 mm or 0.022 inch
Labelled 0.406 mm or 0.016 inch 0.559 mm or 0.022 inch
18 x 25 Measured 0.44 mm or 0.017 inch 0.63 mm or 0.025 inch
Labelled 0.457 mm or 0.018 inch 0.635 mm or 0.025 inch
Table 3. The height and width of the archwires tested. The results were the same for both BF and NS.
3.2 Bending and Torsion Curves A sample of the load-deflection and torsional moment-angle curves generated is represented in
Figures 9 and 10, respectively. In general, both tests yielded curves exhibiting superelastic
properties with a readily identifiable unloading superelastic plateau similar to other studies.36,44
Distinct superelastic behavior was observed with deflections of approximately 0.4 mm in
bending and 22° in torsion independent of the cross-section. However, the force and torquing
moment values were greater for wires of greater dimensions. Sizable hysteresis (the difference
between loading and unloading curves), typical of thermodynamic NiTi archwires,8 were also
observed for all wire segments for both tests. Permanent deformation was noted for anterior
sections, especially of 0.016 x 0.022” dimension in bending.

26
Figure 9. Typical load-deflection curves of the incisor, premolar, molar segments of each type and dimension of
wire tested (BF – BioForce, C – NeoSentalloy).

27
Figure 10. Typical angle-torsion moment curves of the incisor, premolar, molar segments of each type and
dimension of wire tested (BF – BioForce, C – NeoSentalloy).
3.3 Repeatability of Superelastic Plateau Identification Points marking the beginning and the end of the superelastic plateau were re-identified on 20
randomly selected load-deflection curves and on 20 randomly selected torsional moment-angle
curves. These were performed 30 days after the original data collection. The intra-examiner
agreement, indicated by the intraclass correlation coefficient (ICC), was very good to excellent
(ICC 0.8-1.00) for both for three-point bending and torsion tests (Table 4). In general, the
identification of the ending point was more repeatable than starting point and y-coordinates were
more repeatable than x-coordinates in both tests. This is due to the difficulty in adapting tangent
lines to more curvilinear transitions at the beginning of the unloading superelastic plateau
compared to the superelastic plateau itself which was relatively straight. Identifying the starting
point in bending test was more repeatable (0.931) than in the torsion test (0.881). Identification
of the ending point however was excellent for both tests, with values close to 0.99-1.00.

28
Starting point Ending point
X+Y
combined
X-coordinate Y-coordinate X+Y
combined
X-coordinate Y-coordinate
Bending 0.931 (0.834-
0.0972)
0.936 (0.846-
0.0974)
0.996 (0.991-
0.999)
1.0 (1.0-1.0) 0.996 (0.989-
0.998)
0.996 (0.990-
0.998)
Torsion 0.881 (0.724-
0.951)
0.831 (0.22-
0.930)
0.994 (0.984-
0.998)
0.994 (0.984-
0.998)
0.995 (0.986-
0.998)
0.994 (0.986-
0.998)
Table 4. Intraclass correlation coefficient (ICC) for identifying the starting and ending point of the unloading
superelastic plateau for both bending and torsion tests.
3.4 Error Analysis The variability observed between the load-deflection and moment-angle curves of individual
samples of the same type (n=6) signifies both the variability between individual specimens,
measurement error and random error. Compared to the uncertainties of the measuring
instruments, the SD of mean force or moment, length, and slope of the unloading superelastic
plateau values were much greater. As suggested by the excellent ICC, the error due to
inconsistencies in the identification of the unloading superelastic plateau should be minimal.
Therefore, other sources of error are more significant.
It is important to state that sources of error are challenging to characterize in this experiment due
to a number of limitations. Inconsistencies in chemical composition, processing, and heat-
treatment between different samples of archwires have the potential to influence the behavior of
the NiTi alloy22 and were unaccounted for in this study. Theoretical values of NiTi stiffness at
the superelastic plateau cannot be readily calculated as discussed previously and thus cannot be
compared with our values. Moreover, since each specimen may only be tested once without
affecting its ‘as-received’ mechanical properties, determining method-related sources of error is
difficult.10
A number of random factors within our experimental set up could have influenced our results.
The temperature of the water bath in both tests was within the range of 37.5-34.5°C. All

29
specimens were submerged in water for at least 60 seconds before testing to allow for crystalline
rearrangement to occur. The temperature tended to decrease by 1-2°C over the duration of the
three-point bending test but was more constant at 36°C for torsion test due to a much larger
water container used. In a three-point bending test, Sakima et al.8 found an increase from 35°C to
37°C to produce a mean increase of 29 cN in force, a mean decrease of 0.1 mm in length, and a
mean increase of 0.8 cN/mm in slope. The sensitivity of the archwires tested in this study to the
fluctuations in temperature was not assessed.
Custom-build slotted frames were necessary for the three-point bending test set up to uphold the
specimens. This introduced friction and/or binding between the frame and the specimens.
Depending on the curvature of a given specimen type (incisor, premolar, or molar), its impact on
the load-deflection curve was likely different. When inspecting the load-deflection curves of
control wires, its effect is most obvious at the greater range of deflections. While the effects of
friction and curvature were reflected in the variability between the loading curves of the control
wires, little discrepancy was seen in the unloading curves (Figure 9). Since our study assessed
the unloading curve, the effect of wire-slot friction on result variability is also likely minimal.
A major source of variability in torsion test was due to the inability to standardize the exact end
range of torsional angle across all specimens. The linear distance that the level arm travelled was
consistent at 4.6mm. However, after the conversion, the degree of rotation it produced varied
quite significantly, ranging from 35.8° to 50.3°. For simplicity, an average linear regression
coefficient of 9.9 was used to convert linear displacement to degrees for all samples, hence all
graphs extend to 45.5°. This was justified as omitting the outliers did not substantially change the
results.
A number of factors contributed to this variability. In order to use the Instron machine to load
and unload specimens in torsion, the system had to be relatively unrestricted. Although a metal
frame was used to limit the pulley to a purely rotational movement, some play within the
framework inadvertently caused some translational movements in vertical and horizontal
direction as well. Moreover, varying curvature of the specimens (depending on the section type)
and imprecision in specimen attachment to the pulley made it such that the rotation was not
exactly about its central axis. The cord suspending the pulley is another potential source of error.
Although a tensely strong material (microfilament braided fishing line) was selected, some

30
stretch of the string upon loading still occurred. This was observed during preloading. The value
of the preload tended to decrease with time due to passive stretching but best efforts were made
to keep this time consistent between tests. The contribution of these random variables could not
be assessed.
The uncertainty in the end rotational angle increases the variability in the lengths and slopes of
the unloading superelastic plateaus. This is reflected in the increased SD of these measurements.
Since the mean moment value of the unloading superelastic plateau is unlikely to be significantly
affected once the plateau is reached, the exact end range of twist is less influential for these result
values. Caution must be taken when interpreting the results of length and slope in torsion,
however.
Relative to previous studies, the SD of the mean force and slope in both tests appear comparable.
Within the same batch, a coefficient of variation of up to 10% or less has been documented in a
three-point bending test for various NiTi brands.47 This corresponds to less than 10g and 10g/mm
of absolute uncertainty (SD), respectively, which is similar to our study. Meling and Ødegaard37
noted a maximum SD of 0.68N•mm (69g•mm) in moment and 0.16N•mm/° (16g•mm/°) in
torsional stiffness at the unloading plateau of NS wires. In our study, the highest SD recorded
was 24.88 g•mm and 2.94 g•mm/° which can be considered relatively narrow. Except for the
differences in the slope in the torsion test, these values are also much smaller than the
statistically significant differences that were found between regions of wire entities, implicating
that method-related error may be relatively insignificant.
With respect to the length of the plateau in bending, SD of 0.1-0.2 mm is typical and comparable
to this study.8,10 However, these values are also the statistically significant differences that were
found between the BF segments. Given that these values were not much greater than the SD, the
significance of these results may be more susceptible to methodology biases. No studies have
reported the SD around the length of the plateau in torsion, thus comparison is not possible.
However, due to methodological limitations discussed above, caution must be exercised when
interpreting these results as well.
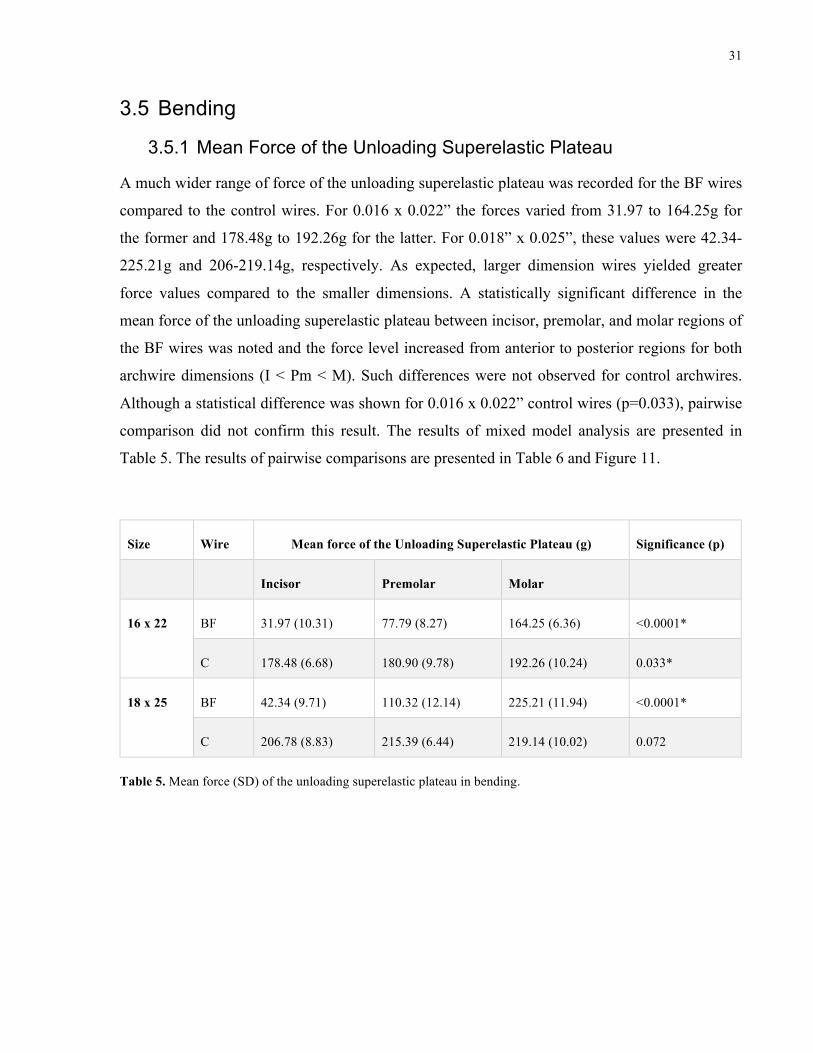
31
3.5 Bending
3.5.1 Mean Force of the Unloading Superelastic Plateau
A much wider range of force of the unloading superelastic plateau was recorded for the BF wires
compared to the control wires. For 0.016 x 0.022” the forces varied from 31.97 to 164.25g for
the former and 178.48g to 192.26g for the latter. For 0.018” x 0.025”, these values were 42.34-
225.21g and 206-219.14g, respectively. As expected, larger dimension wires yielded greater
force values compared to the smaller dimensions. A statistically significant difference in the
mean force of the unloading superelastic plateau between incisor, premolar, and molar regions of
the BF wires was noted and the force level increased from anterior to posterior regions for both
archwire dimensions (I < Pm < M). Such differences were not observed for control archwires.
Although a statistical difference was shown for 0.016 x 0.022” control wires (p=0.033), pairwise
comparison did not confirm this result. The results of mixed model analysis are presented in
Table 5. The results of pairwise comparisons are presented in Table 6 and Figure 11.
Size Wire Mean force of the Unloading Superelastic Plateau (g) Significance (p)
Incisor Premolar Molar
16 x 22 BF 31.97 (10.31) 77.79 (8.27) 164.25 (6.36) <0.0001*
C 178.48 (6.68) 180.90 (9.78) 192.26 (10.24) 0.033*
18 x 25 BF 42.34 (9.71) 110.32 (12.14) 225.21 (11.94) <0.0001*
C 206.78 (8.83) 215.39 (6.44) 219.14 (10.02) 0.072
Table 5. Mean force (SD) of the unloading superelastic plateau in bending.

32
Figure 11. Box plots representing the spread of the unloading superelastic plateau force values in each section of the
archwire for each archwire type and dimension tested in bending (BF = BioForce, C = Control, NeoSentalloy).
Table 6 shows the mean force increase between the three sections of BF and control wires.
Figure 12 illustrates these differences for BF which were statistically significant. The premolar
sections were 143% (45.8g) greater in force compared to incisor sections and molar sections
were 111% greater in force compared to premolar section in 0.016 x 0.022” BF. For 0.018 x
0.025” BF, the increase was 160% (68.0g) and 104% (114.9g), respectively.
*
*
*
*
**
*

33
Size Wire Mean Change in Force of the Unloading Superelastic Plateau
I à Pm PmàM IàM
16 x 22 BF +143.3%
(45.8g)
P<0.0001* +111.1%
(86.5g)
P<0.0001* +413.8
(132.3g)
P<0.0001*
C +1.3%
(2.4g)
P=1.00 +6.3
(11.4g)
P=0.5490 +7.7
(13.8g)
P=0.3560
18 x 25 BF +160%
(68.0g)
P<0.0001* +104.1
(114.9g)
P<0.0001* +431.9
(182.9g)
P<0.0001*
C +4.2%
(8.6g)
P=0.8526 +1.7 (3.7g) P=0.9998 +6.0
(12.4 g)
P=0.4937
Table 6. Mean increase (+) in force of the unloading superelastic plateau in bending expressed as percentage and
grams of force difference from incisor to premolar (I à Pm), premolar to molar (Pm à M) and incisor to molar (I
à M).
Figure 12. Stacked columns representing the increase in the mean unloading superelastic plateau force values in
bending for 0.016 x 0.022” BF (left) and 0.018 x 0.025” BF (right). Darker blue represents the additional force gain
of its respective section relative to the adjacent, more anterior section (light blue). Percentage increase is expressed
at the top (I = incisor; Pm = premolar; M = molar).
42.34 42.34
110.3267.98
114.89
160%
104%
0
30
60
90
120
150
180
210
240
I PM M
MeanForce(g)
18x25BF
31.97 31.97
77.7945.8
86.46
143%
111%
0
20
40
60
80
100
120
140
160
180
I PM M
MeanForce(g)
16x22BF

34
3.5.2 Mean Length of the Unloading Superelastic Plateau
A wider range of lengths of the unloading superelastic plateau during bending was recorded for
the BF wires compared to control. For 0.016 x 0.022”, the mean length varied from 1.92mm to
2.17mm for the former and hovered around 2.19mm for the latter. For 0.018” x 0.025”, these
values were similar at 1.93-2.17mm and 2.09-2.18mm, respectively. The mean length of the
unloading superelastic plateau increased from anterior to posterior sections (I < Pm < M) of the
BF wires and some statistically significant differences between the sections were found. The
unloading superelastic plateau of the molar region in the control wires appeared to be longer than
the incisor and premolar regions but there were no statistically significant differences between
the sections. Note that a statistically significant difference was recorded for 0.018 x 0.025” (p =
0.013) control wires, however, a pairwise comparison did not confirm this finding. The results of
mixed model analysis are presented in Table 7. The results of pairwise comparisons are
presented in Table 8 and Figure 13.
Size Wire Mean length of the Unloading Superelastic Plateau (mm) Significance (p)
Incisor Premolar Molar
16 x 22 BF 1.92 (0.06) 2.03 (0.04) 2.17 (0.04) <0.0001*
C 2.19 (0.09) 2.19 (0.08) 2.19 (0.04) 0.970
18 x 25 BF 1.93 (0.04) 2.08 (0.06) 2.17 (0.04) <0.0001*
C 2.09 (0.04) 2.09 (0.06) 2.18 (0.03) 0.013*
Table 7. Mean length (SD) of the unloading superelastic plateau in bending.

35
Figure 13. Box plots representing the spread of the unloading superelastic plateau length values in each section of
the archwire for each archwire type and dimension tested in bending (BF = BioForce, C = Control, NeoSentalloy).
Table 8 shows the mean increase in the length of the unloading superelastic plateau between the
three sections of BF and control wires. Figure 14 illustrates this difference for BF as the results
were statistically significant. The premolar section was 5.7% (0.11mm) longer compared to
incisor section and the molar section was 6.9% (0.14 mm) longer compared to premolar section
in 0.016 x 0.022” BF. For 0.018 x 0.025” BF, the increase was 7.8% (0.15 mm) and 4.3% (0.09
mm), respectively.
*
** *

36
Size Wire Mean Change in Length of the Unloading Superelastic Plateau
I à Pm PmàM IàM
16 x 22 BF +5.72%
(0.11mm)
P=0.1134 +6.90%
(0.14 mm)
P=0.0065 +13.02%
(0.25 mm)
P<0.000*
C 0 P=1.00 0 P=1.00 0 P=1.00
18 x 25 BF +7.77%
(0.15mm)
P=0.0061* +4.33%
(0.09 mm)
P=0.1826 +12.43%
(0.24 mm)
P<0.0001*
C 0 P=1.00 +4.31%
(0.09 mm)
P=0.292 +4.31%
(0.09 mm)
P=0.2664
Table 8. Mean percent change (+ increase) in length of the unloading superelastic plateau in bending expressed as
percentage and millimeter difference from incisor to premolar (I à Pm), premolar to molar (Pm à M) and incisor
to molar (I à M).
Figure 14. Stacked columns representing the increase in the mean unloading superelastic plateau length values in
bending for 0.016 x 0.022” BF (left) and 0.018 x 0.025” BF (right). Darker green represents the additional length
gain of its respective section relative to the adjacent, more anterior section (light green). Percentage increase is
expressed at the top (I = incisor; Pm = premolar; M = molar).
1.93 1.93
2.08
0.15
0.097.77%
4.33%
1.7
1.8
1.9
2
2.1
2.2
2.3
I PM M
MeanLength(m
m)
18x25BF
1.92 1.92
2.03
0.11
0.145.72%
6.90%
1.7
1.8
1.9
2
2.1
2.2
2.3
I PM M
MeanLength(m
m)
16x22BF

37
3.5.3 Mean Slope of the Unloading Superelastic Plateau
The mean slopes of the superelastic plateau showed a similar range of values across the arch for
both BF and control wires. For 0.016 x 0.022”, BF varied from 28.26g/mm to 46.76g/mm and
control wires showed a range from 30.45g/mm to 50.95g/mm. For 0.018 x 0.025”, the ranges
were 46.44-73.86g/mm and 43.46-71.62g/mm, respectively. Generally, the slope increased from
anterior to posterior sections of the arch (I < Pm < M) with larger difference being between
molar and premolar/incisor sections. Statistically significant differences were found between
almost all sections of the arch in both BF and control except between incisor and premolar
sections in BF wires which were similar. Values were higher for 0.018 x 0.025” compared to
0.016 x 0.022”. The results of mixed model analysis are shown in Table 9. The results of
pairwise comparisons are presented in Table 10 and Figure 15.
Size Wire Mean slope of the Unloading Superelastic Plateau (g/mm) Significance (p)
Incisor Premolar Molar
16 x 22 BF 28.26 (4.24) 31.80 (2.78) 46.76 (2.53) <0.0001*
C 30.45 (1.63) 36.20 (2.25) 50.95 (3.99) <0.0001*
18 x 25 BF 46.44 (4.99) 50.69 (3.92) 73.86 (4.16) <0.0001*
C 43.46 (2.93) 52.01 (2.76) 71.62 (2.77) <0.0001*
Table 9. Mean slope (SD) of the unloading superelastic plateau in bending.

38
Figure 15. Box plots representing the spread of the unloading superelastic plateau slope values in each section of the
archwire for each archwire type and dimension tested in bending (BF = BioForce, C = Control, NeoSentalloy).
Table 10 shows the mean slope difference between the three sections of BF and control wires.
Figures 16 and 17 help illustrate that difference. The premolar section was roughly 15% steeper
compared to incisor section and the molar section was about 45% steeper compared to premolar
section in both wire types and sizes.
**
* **
*
* *
*
*

39
Size Wire Mean Change in Slope of the Unloading Superelastic Plateau
I à Pm PmàM IàM
16 x
22
BF +12.53%
(3.54g/mm)
P=0.5093 +47.04%
(14.96 g/mm)
P<0.0001* +65.46%
(18.5 g/mm)
P<0.0001*
C +18.90%
(5.75 g/mm)
P=0.0279* +40.74%
(14.75 g/mm)
P<0.0001* +67.32%
(20.5 g/mm)
P<0.0001*
18 x
25
BF +9.15%
(4.25 g/mm)
P=0.2495 +45.71%
(23.17 g/mm)
P<0.0001* +59.04%
(27.42 g/mm)
P<0.0001*
C +16.63%
(7.23 g/mm)
P=0.0001* +41.29%
(20.93 g/mm)
P<0.0001* +64.79%
(28.16 g/mm)
P<0.0001*
Table 10. Mean increase (+) in the slope of the unloading superelastic plateau in bending expressed as percentage
and grams per millimeter difference between incisor and premolar (I à Pm), premolar and molar (Pm à M), and
incisor and molar (I à M).
Figure 16. Stacked columns representing the increase in the mean unloading superelastic plateau slope values in
bending for 0.016 x 0.022” BF (left) and 0.018 x 0.025” BF (right). Darker orange represents the additional length
gain of its respective section relative to the adjacent, more anterior section (light orange). Percentage increase is
expressed at the top (I = incisor; Pm = premolar; M = molar).
46.44 46.44 50.69
4.25
23.179.15%
45.71%
0
10
20
30
40
50
60
70
80
I PM M
MeanSlop
e(g\m
m)
BF18x25
28.26 28.26 31.8
3.54
14.9612.52%
47.04%
0
5
10
15
20
25
30
35
40
45
50
I PM M
MeanSlop
e(g/m
m)
BF16x22

40
Figure 17. Stacked columns representing the increase in the mean unloading superelastic plateau slope values in
bending for 0.016 x 0.022” C (left) and 0.018 x 0.025” C (right). Darker orange represents the additional length gain
of its respective section relative to the adjacent, more anterior section (light orange). Percentage increase is
expressed at the top (I = incisor; Pm = premolar; M = molar).
3.6 Torsion
3.6.1 Mean Torsional Moment of the Unloading Superelastic Plateau
Compared to control wires, BF wires exhibited a significantly larger range of torsional moment
of the unloading superelastic plateau. For 0.016 x 0.022”, the mean torsional moment varied
from 189.27 to 393.37g�mm for BF and 434.22 to 429.38g�mm for control. For 0.018” x 0.025”,
these values were 284.57–524.34g�mm and 564.55–540.87g�mm, respectively. As expected,
bigger size yielded larger moment values. There was a statistically significant difference in the
mean force of the unloading superelastic plateau between incisor, premolar, and molar regions of
the BF archwires and the force level increased from anterior to posterior regions for both
archwire dimensions (I < Pm < M). Such differences were not observed for control archwires.
The results of mixed model analysis are presented in Table 11. The results of pairwise
comparisons are presented in Table 12 and Figure 18.
43.46 43.4650.69
7.23
20.9316.63%
41.29%
0
10
20
30
40
50
60
70
80
I PM M
MeanSlop
e(g/m
m)
C18x25
30.45 30.4536.2
5.75
14.7518.88%
40.74%
0
10
20
30
40
50
60
M PM M
MeanSlop
e(g/m
m)
C16x22

41
Size Wire Mean moment of the Unloading Superelastic Plateau (g�mm)
Significance (p)
Incisor Premolar Molar
16 x 22 BF 189.27 (8.77) 268.44 (9.44) 393.37 (12.59) <0.0001*
C 434.22 (10.91) 428.92 (9.71) 429.38 (14.92) 0.595
18 x 25 BF 284.57 (22.80) 401.43 (20.37) 524.34 (13.83) <0.0001*
C 564.55 (14.35) 554.82 (24.88) 540.87 (18.13) 0.158
Table 11. Mean moment (SD) of the unloading superelastic plateau in torsion.
Figure 18. Box plots representing the spread of the unloading superelastic plateau torsional moment values in each
section of the archwire for each archwire type and dimension tested in torsion (BF = BioForce, C = Control,
NeoSentalloy).
*
*
**
*
*

42
Table 12 shows the mean torsional moment change between the three sections of BF and control
wires. Figure 19 illustrates the differences for BF as they were statistically significant. The
premolar section was 41.83% (79.17g�mm) greater in torsional moment compared to incisor
section and the molar section was 46.53% (124.93g�mm) greater compared to premolar section
in 0.016 x 0.022” BF. For 0.018 x 0.025” BF, the increase was similar with 41.06% (116.86
g�mm) and 35.10% (140g�mm) increase, respectively.
Size Wire Mean Change in Torsional Moment of the Unloading Superelastic Plateau
I à Pm PmàM IàM
16 x 22 BF +41.83%
(79.17 g�mm)
P=0.0003* +46.54%
(124.93
g�mm)
P<0.0001* +107.83%
(204.1
g�mm)
P<0.0001*
C -1.21%
(5.29 g�mm)
P=0.9997 +0.11%
(0.46 g�mm)
P=1.0 -1.11%
(4.83 g�mm)
P=0.9894
18 x 25 BF +41.06%
(116.86
g�mm)
P<0.0001* +35.10%
(140.91
g�mm)
P<0.0001* +90.58%
(257.77
g�mm)
P<0.0001
C -1.72%
(9.73 g�mm)
P=0.9999 -2.51%
(13.95
g�mm)
P=0.102 -4.19%
(23.68
g�mm)
P=0.3645
Table 12. Mean change (+ increase or – decrease) in the torsional moment of the unloading superelastic plateau in
bending expressed as percentage and grams�millimeter difference between incisor to premolar (I à Pm), premolar
to molar (Pm à M) and incisor to molar (I à M).

43
Figure 19. Stacked columns representing the increase in the mean unloading superelastic plateau torsional moment
values for 0.016 x 0.022” BF (left) and 0.018 x 0.025” BF (right). Darker blue represents the additional moment
gain of its respective section relative to the adjacent, more anterior section (light blue). Percentage increase is
expressed at the top (I = incisor; Pm = premolar; M = molar).
3.6.2 Mean Length of the Unloading Superelastic Plateau
The mean length of the unloading superelastic plateau in torsion covered a wider range of values
in BF wires compared to controls. For 0.016 x 0.022”, the range was 23.46–18.40° for BF and
19.10°–17.83° for control. For 0.018 x 0.025” these values were similar at 24.10-18.80° and
19.53-18.13°, respectively. Unlike in the bending test, the trend was the reverse with the length
decreasing from anterior to posterior sections of the arch in both types of wires (I > Pm > M) and
the values did not appear to be affected by size. The results of mixed model analysis are
presented in Table 13. The results of pairwise comparisons are presented in Table 14 and Figure
20.
284.57 284.57401.43
116.86
140.9141%
35%
0
100
200
300
400
500
600
I PM M
TorsionalM
omen
t(g�mm)
BF18x25
189.27 189.27268.44
79.17
124.9342%
47%
0
50
100
150
200
250
300
350
400
450
I PM M
TorsionalM
omen
t(g�
mm)
BF16x22

44
Size Wire Mean length of the Unloading Superelastic Plateau (°) Significance (p)
Incisor Premolar Molar
16 x 22 BF 23.46 (1.04) 21.66 (2.10) 18.40 (2.56) 0.008*
C 19.10 (1.52) 17.52 (1.37) 17.83 (0.80) 0.161
18 x 25 BF 24.10 (1.21) 21.03 (1.51) 18.80 (2.60) 0.002*
C 19.53 (1.70) 19.35 (1.35) 18.13 (2.20) 0.387
Table 13. Mean length (SD) of the unloading superelastic plateau in torsion.
Figure 20. Box plots representing the spread of the unloading superelastic plateau length values in each section of
the archwire for each archwire type and dimension tested in torsion (BF = BioForce, C = Control, NeoSentalloy).
*

45
Table 14 shows the mean length change between the three sections of BF and control wires.
Figure 21 illustrates this difference for BF wires. Although both sizes of BF wires showed
statistical significance, pairwise comparison yielded statistical significance only for 0.018 x
0.025”. The premolar section was 12.70% (3.06°) shorter compared to incisor section and the
molar section was 10.60 (2.23°) shorter compared to premolar section.
Table 14. Mean change (+ increase or – decrease) in length of the unloading superelastic plateau in torsion
expressed as percentage and degree difference between incisor to premolar (I à Pm), premolar to molar (Pm à M)
and incisor to molar (I à M).
Size Wire Mean Change in Length of the Unloading Superelastic Plateau
I à Pm PmàM IàM
16 x 22 BF -37.14%
(12.8°)
P=0.9134 -15.05%
(3.26°)
P=0.3279 -46.60%
(16.06°)
P=0.0585
C - 8.22%
(1.57°)
P=0.8616 +1.77%
(0.31°)
P=1.00 -6.60%
(1.26°)
P=0.6676
18 x 25 BF -12.70%
(3.06°)
P=0.4063 -10.60%
(2.23°)
P=0.228 -21.96%
(5.29°)
P=0.0114*
C -0.92%
(0.18°)
P=1.00 -6.30%
(-1.22°)
P=0.9856 -7.17%
(1.4°)
P=0.9366

46
Figure 21. Stacked columns representing the decrease in the mean unloading superelastic plateau length values as
changes from anterior to posterior sections in torsion for 0.016 x 0.022” BF (left) and 0.018 x 0.025” BF (right).
Darker green represents the length decrease of its respective section relative to the adjacent, more anterior section
(light green). Relative percent decrease is expressed at the bottom (I = incisor; Pm = premolar; M = molar).
3.6.3 Mean Slope of the Unloading Superelastic Plateau
Mean unloading superelastic plateau slope in torsion ranged from 5.63-9.40g�mm/° for BF and
9.00-9.75g�mm/° for control in 0.016 x 0.022”. The values were higher for 0.018 x 0.025” with
7.75-12.67g�mm/° and 10.82-12.61g�mm/°, respectively. Unlike in control wires where no
pattern was observed, the slope tended to increase from incisor to molar sections (I > Pm > M) in
BF wires. The results of mixed model analysis are presented in Table 15. The results of pairwise
comparisons are presented in Table 16 and Figure 22.
24.09 24.0921.03
-3.06 -2.23
-12.70% -10.60%-5
0
5
10
15
20
25
30
I PM M
MeanLength(°)
BF18x25
34.46 34.46
21.66
-12.8-3.26
-37.14%
-15.05%
-20
-10
0
10
20
30
40
I PM M
MeanLength(°)
BF16x22

47
Size Wire Mean slope of the Unloading Superelastic Plateau (g�mm/°) Significance (p)
Incisor Premolar Molar
16 x 22 BF 5.63 (0.64) 6.57 (1.07) 9.40 (1.31) <0.004*
C 9.00 (1.10) 7.87 (0.68) 9.75 (1.28) 0.131
18 x 25 BF 7.75 (0.47) 9.62 (1.46) 12.67 (2.35) 0.002*
C 10.82 (2.20) 11.16 (0.74) 12.61 (2.94) 0.146
Table 15. Mean slope (SD) of the unloading superelastic plateau in torsion.
Figure 22. Box plots representing the spread of the unloading superelastic plateau slope values in each section of the
archwire for each archwire type and dimension tested in torsion (BF = BioForce, C = Control, NeoSentalloy).
*
*

48
Table 16 shows the mean slope change between the three sections of BF and the control wires.
Figure 23 illustrates this difference for BF wires which was statistically significant. Both sizes of
BF wires showed that the molar section was significantly steeper than the incisor section. The
molar section was steeper than incisor section by 66.96% (3.77g�mm/°) in 0.016 x 0.022” and by
63.48% (4.92g�mm/°) in 0.018 x 0.025”.
Size Wire Mean Change in Slope of the Unloading Superelastic Plateau
I à Pm PmàM IàM
16 x 22 BF +16.70%
(0.94g�mm/°)
P=0.9731 +43.07%
(2.83 g�mm/°)
P=0.1169 +66.96%
(3.77 g�mm/°)
P=0.0386*
C -12.55%
(1.13g�mm/°)
P=0.9181 +23.89%
(1.88g�mm/°)
P=0.5671 +8.33%
(0.75g�mm/°)
P=0.9994
18 x 25 BF +24.26%
(1.88g*mm/°)
P=0.5405 +31.57%
(3.04g�mm/°)
P=0.1804 +63.48%
(4.92g�mm/°)
P=0.0175*
C +3.14%
(0.34g�mm/°)
P=1.00 +12.99%
(1.45g�mm/°)
P=0.7984 +17.54%
(1.79g�mm/°)
P=0.6493
Table 16. Mean change (+ increase or - decrease) in the slope of the unloading superelastic plateau in bending
expressed as percentage and grams�millimeter per degree change from incisor to premolar (I à Pm), premolar to
molar (Pm à M) and incisor to molar (I à M).
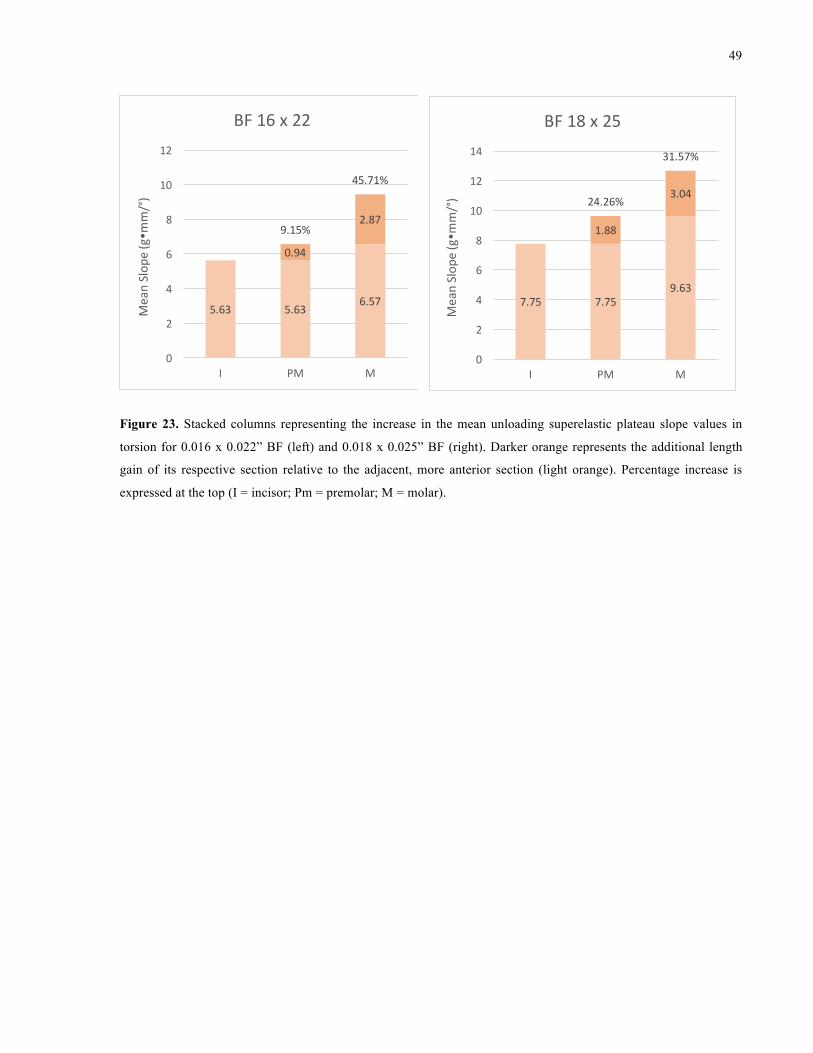
49
Figure 23. Stacked columns representing the increase in the mean unloading superelastic plateau slope values in
torsion for 0.016 x 0.022” BF (left) and 0.018 x 0.025” BF (right). Darker orange represents the additional length
gain of its respective section relative to the adjacent, more anterior section (light orange). Percentage increase is
expressed at the top (I = incisor; Pm = premolar; M = molar).
5.63 5.636.57
0.94
2.879.15%
45.71%
0
2
4
6
8
10
12
I PM M
MeanSlop
e(g�m
m/°)
BF16x22
7.75 7.759.63
1.88
3.0424.26%
31.57%
0
2
4
6
8
10
12
14
I PM M
MeanSlop
e(g�m
m/°)
BF18x25

50
Chapter 4 Discussion
The aim of this investigation was to determine if mechanical properties of GT-NiTi archwires
differ throughout the arch, and if so, how. In contrast to previous studies that have examined the
force-delivery characteristics of former generation NiTi wires, this study is the first to
characterize the fourth generation NiTi, GT-NiTi. Moreover, unlike existing studies that have
evaluated the same arch region of different archwires, this study is also unique in that it
compares different regions within the same archwire. Two dimensions were selected to represent
the range used clinically. The testing was performed in an aqueous environment at 36±1°C
temperature, representative of intraoral conditions.27 This is important as the properties of
thermodynamic NiTi wires are highly temperature dependent.53 The unloading curve is most
relevant to clinical practice as it represents the active orthodontic driving force9 and was assessed
in this study. Since the goal of orthodontic wires is to achieve low and continuous forces,
evaluating force or moment level, length, and slope at the unloading superelastic plateau
comprehensively characterizes the force delivery that may be expected intraorally. Specifically,
the bending and torquing forces of the unloading superelastic plateau quantify the magnitude of
the force or moment, the length indicates the deflection or torsional angle range over which this
force is maintained, and the slope measures the consistency of the force.
4.1 Cross-Sectional Dimensions Dimensional discrepancies between claimed and measured archwire dimensions is not an
uncommon finding in the existing literature.37,44 Garrec et al.44 found the dimension of two
square NS wires to be two SD below their nominal size. The measured cross-sectional size of the
wires tested in this study largely corresponded to their nominal size with the exception of 0.018 x
0.025” the height of which was very slightly smaller. More importantly, the dimension was
consistent throughout the archwire which confirms that the differences in the measured
parameters between the three sections were related to variables other than cross-sectional size.

51
4.2 Lab-Bench Tests Lab-bench tests are valuable tools when evaluating NiTi wires as they allow characterization of
force-delivering properties, offer reproducibility,8 and are relatively simple to execute. Since
bending and torsion tests are most pertinent to orthodontic tooth movement, they were employed
in this study.
The wire specimens were not engaged into fixed appliances in this experiment. The influence of
the experimental set up on the measured values is significant and has been shown previously.48
Thus, an argument could be made that this experimental design is not clinically relevant.
However, relative rather than absolute values, were of interest in our study because the primary
goal was to determine if there is variation in the force-delivering characteristics within GT-NiTi
wire entity. Standardization of the testing and maintenance of consistent temperature is
considered most important for this purpose and was achieved.
4.2.1 Three-Point Bending Test
In contrast to the protocol recommended by the ADA and majority of other studies,10–12,54 the
specimens in this experiment were tested in bucco-lingual rather than inciso-gingival direction.
This was necessary to minimize the effect of varying specimen curvature. This emulates first
order movements which are, in the least, just as necessary as second order movements in
orthodontic treatment and thus clinically relevant.
Even in bucco-lingual direction, however, the geometrical differences between specimens may
have influenced our results. Their potential effect on the load-deflection graphs is important to
discuss. According to curved beam theory, less force is needed to deflect a wire buccally than
lingually when testing a preformed archwire and this has been confirmed in a previous study
using round wires.43 Therefore, in our study, it may have been expected that the most curved,
anterior segments would produce the least force levels and posterior, relatively straight segments
would deliver the most force due to the differential geometry alone. NGT-NiTi wires were
included to control for this phenomenon. Since these wires are not differentially heat-treated, any
differences between their load-deflection curves may be attributed to other factors such as
geometry or testing methodology.

52
Load-deflection graphs for each of the three segments in the control wires can generally be
described as overlapping. However, an increasing discrepancy was seen towards the end of the
deflection range. This is in line with the theory described above, as the posterior segment indeed
delivered relatively higher force than anterior at large deflections. Friction or binding is another
variable that could have contributed to this observation. Since the specimens were not entirely
free to move on the supports due to the confinements of the custom-built frames, posterior
sections likely encountered more opportunities for binding compared to anterior segments. This
phenomenon was minimal at the unloading superelastic plateau measured in this study.
Moreover, observed differences between the segments of GT-NiTi were generally much greater
than between the segments of NGT-NiTi supporting the idea that factors other than geometry are
at play.
Sakima et al. found NS F200g to produce some of the lowest and most consistent force levels
among the thermodynamic archwires tested.8 The current study corroborates the findings of
numerous other studies6,8,34,50 and confirms that GAC’s thermodynamic NiTi archwires exhibit
superelasticity with a distinct superelastic plateau.
4.2.2 Torsion Test
As in the bending test, the effect of varying curvatures of the specimens may have had an
influence on the results. NGT-NiTi wires were similarly used to control for this factor. A small
free distance of wire, 5mm in length, was chosen to minimize this effect and represents the inter-
bracket distance.14 When examining the torsional moment-degree curves of the control wires, the
effect of differential specimen geometry is not easily perceived.
Compared to bending, a much larger variability in length and slope of the unloading superelastic
plateau in torsion was found. As already discussed, this is related to the inability to precisely
control the end range of torsional twist. This directly modifies the curves by stretching or
shrinking it horizontally, thus affecting the length and, to a lesser extent, the slope, of the
plateau. Although its effect appears to be random as the variability between BF and control data
was comparable, it may have obliterated statistically significant differences between archwire
regions if any existed.

53
The torsion method used in this study yielded torsional moment – degree curves with a distinct
superelastic plateau. It has been shown that superelastic NiTi wires have to be activated by at
least 20° before the superelastic plateau is expressed.36,37 Activating to 25° torsional twist,
Meling and Ødegaard38 showed NS F100 to have a well-defined superelastic deactivation plateau
in torsion corroborating the findings of our study. Other studies13,37 however, were unable to
show that NS has superelasticity in torsion activated to 25° or 50°. This may be explained by the
differences in methodology or chemical composition and processing of the product.49
4.3 Mean Force and Torsional Moment of the Unloading Superelastic Plateau
Substantial, statistically significant differences in the mean force and torsional moment of the
unloading superelastic plateau between the three regions of the BF wires, but not controls, were
observed. This rejects our null hypothesis and supports the manufacturer’s claim that these
archwires have differential stiffness throughout the arch.
Controlled heat-treatment has been shown to affect the stiffness of NiTi alloy previously. Miura
et al.49 demonstrated that the force level of the superelastic plateau was inversely related to the
length of heat-treatment of NiTi. By affecting its Af and thus crystalline (austenite-martensite)
structure at a given temperature, NiTi of the same cross-sectional dimension, but different force
levels can be produced. This has been previously shown for GAC’s 0.019 x 0.025” NS F100,
F200, and F300 in bending where the force increased incrementally as the name suggests.50
Homogeneous atomic composition throughout the BF archwires was not confirmed in this study.
Thus, variable heat-treatment to account for the resultant differences between the regions of GT-
NiTi can only be speculated. Differential scanning calorimetry to determine Af and X-ray
diffraction to study regional phase composition would help confirm these speculations.
For thermodynamic NiTi wires to express effective superelastic plateau, their Af temperatures
have to be slightly below the oral temperature.19 Using differential scanning calorimetry, Spini et
al.55 found that the Af of NS F200 was 29.37°C. This means it is fully austenitic at 37°C but
exhibits SIM and superelasticity when stress is applied. At room temperature, its austenitic
content is insufficient to provide effective springback and may be permanently deformed.

54
Our study tested NS F240 and F300 as controls for 0.016 x 0.022” and 0.018 x 0.025” BF wires,
respectively. The mean force and torsional moment values of these segments appear to be
somewhat similar to the posterior section of their respective BF wires. Therefore, it can be
extrapolated that these regions have been similarly processed and their Af temperatures are
within a similar range. In contrast, more anterior sections of BF wires delivered lower forces, and
thus likely have received a longer heat-treatment resulting in higher Af temperature. This is
evidenced by the fact that the incisal section of 0.16 x 0.022” BF showed signs of permanent
deformation, particularly in bending. This finding implies that its Af may be higher than 37°C,
with insufficient austenitic phase to maintain adequate levels of force when stressed. To achieve
adequate springback in the anterior regions of 0.016 x 0.022” BF wires, frequent intake of hot
liquids may be necessary.
In bending, 0.016 x 0.022” BF wire has been advertised to produce 80g-280g at the superelastic
plateau from incisal to molar regions of the arch.30 This corresponds to 250% increase in force
levels. In our study, BF wire of this size produced 31-164g corresponding to almost 400%
increase. Due to differences in testing methodology, these values cannot be directly compared.
Our archwires were divided into three equally long sections and tested at the midpoint. It is
conceivable that these numbers may have been more similar if an alternative method design was
used or if different testing points of each section were selected.
If the force levels of GT-NiTi wires were designed to match the surface area of the roots of teeth
they act on, both the resultant and claimed percent increase in force still appear much too large.
Jepsen56 determined that the average surface area of central maxillary incisor root is 204mm2, the
first premolar is 234mm2 and the molar is 433mm2. This corresponds to surface area increase of
14% between incisor and premolar, and 85% between premolar and molar. The surface area of
molar is only 112% larger than that of an incisor, a difference of three and a half times smaller
than the observed ~400% change in force levels in bending. In torsion, there was around a 40%
increase in torsional moment between consecutive sections from anterior to posterior regions of
the arch. Although the difference is less extreme, it is also incongruent with root surface area
with a larger difference between incisor and premolar sections and a smaller difference between
premolar and molar sections.

55
Clinically, when variable regional stress and temperatures are considered, the difference in force
levels between anterior and posterior sections of the BF wires may be even greater. For instance,
if anterior teeth are much more malpositioned than posterior teeth, which is often the case,
increased stress at the incisal region of the wire would tend to drive its force levels down due to
SIM. Moreover, since oral temperatures tend to be lower anteriorly compared to posteriorly
(especially in mouth breathers),57 martensitic state would be promoted and decrease the force
levels further such that it may be ineffective. In this case, larger dimension BF wire may be
appropriate, especially if three-dimensional control is required.
In practical terms, designing an archwire whose force delivery perfectly matches the demands of
the occlusion is an impossible task. This is due to countless number of variables that determine
the stress perceived by the root including large variations in the size and potentially number of
teeth,4 their position, inter-bracket distance,4 wire-bracket friction or binding,58 bracket
design,52,59 mode of ligation,59 roundness of the wire’s edges,37 and the type of movements that
are required.4
What complicates the force prescription of GT-NiTi wires even further is the fact that no optimal
force values for tooth movement in bending nor torsion currently exist.60 Compared to the
existing studies, the values yielded by both three-point bending and torsions tests can generally
be considered low. This is not surprising as thermodynamic NiTi are known to deliver lower
forces than earlier generation NiTi6–8, which is thought to be beneficial from a biologic stand
point.4
However, it is important to keep in mind that while first and second order movements may be
achieved, torque correction with these wires may occur at a much slower rate, if at all. Studying
superelastic NiTi wires in torsion at oral temperature, Partowi et al.36 considered torquing
moments below 5Nmm (509 g�mm) to be ineffective. The investigators found that torque
produced by NiTi dimensions smaller than 0.017 x 0.025” to be inadequate as they were below
this threshold point. Interestingly, larger dimension wires did not seem to provide additional
moment. In our study, the maximum mean moment recorded in the incisal section of BF wires
was 284 g�mm in 0.018 x 0.022” which is low. When slot-wire play is considered, this value
would be even lower. While there was a clear relationship between moment magnitude on cross-
sectional dimension in our study, it cannot be assumed that larger dimension wires will provide

56
more torque based on the study mentioned. Moreover, it has been postulated that since torque
expression depends on a tight engagement between the edges of the wire and bracket slot, NiTi is
unable to yield effective torque expression due to its low modulus of elasticity along, reduced
hardness,34,59 and increased wire edge rounding.37
4.4 Mean Length of the Unloading Superelastic Plateau in Bending and Torsion
In bending, the mean length of the superelastic plateaus was found to increase from anterior to
posterior sections of GT-NiTi with statistically significant differences between almost all
comparisons. No significant differences were found for the control wires. This suggests that the
posterior segments of BF wires may produce forces that are more consistent over larger range of
deflections compared to anterior segments. Interestingly, an opposite trend was seen in torsion.
Longer plateaus were observed for incisor compared to molar sections of GT-NiTi implying that
the anterior sections rather than posterior section would provide more consistent force over a
larger range of activations. Due to a large standard deviation, however, the disparity was only
statistically significant in 0.018 x 0.025” BF wires where the unloading plateau of the molar
section was 21.96% smaller than that of the incisor section.
This finding implies that if GT-NiTi wires are indeed differentially heat-treated, it may affect
this property differently depending on how stress is applied. However, the difference in length
between adjacent segments is considerably small (about 0.1mm (5%) in bending and mostly 5°
(15%) in torsion), especially within the methodological limitations of this experiment as
discussed previously. The clinical significance of these differences is subject to debate.
The variables that may impact the length of the superelastic plateau have not been well explored
in the existing literature. One study found that the plateau length in bending was affected by the
brand as well as the temperature.8 In the case of NS F200, the length of the plateau was 1.8-
2.1mm for temperatures above 33°C to 40°C but was significantly lower at 30°C with 1mm
length. A study by Bartzela et al.10 found that the length of the plateau in 0.016 x 0.022”
superelastic NiTi was longer than the length of 0.018 x 0.025” superelastic NiTi by about 0.1
mm. The effect of size was not apparent in our study except for anterior and premolar sections of
0.016 x 0.022” control wires which were 0.1mm longer than 0.018 x 0.025”. The effect of size

57
was also not clear-cut in a study assessing round wires where smaller size did not always
produce longer plateaus.7
Meling and Ødegaard37 examined the effect of temperature on eight brands of rectangular NiTi
wires in torsion and found that at 37°C temperature deflected to 25° twist, the length of the
unloading superelastic plateau was generally narrow (1-3°) but started at torsional twist angles
similar to our study (20-23°). Plateau lengths between 17.52-24.10° were recorded in our study
which are significantly greater. However, since this is a linear measurement influenced by the
extent of activation, this discrepancy can be explained by much greater end range activations in
our study. In that study, NS F100 recorded the widest plateau of 6° and the plateau was evident
when activated to 25° twist, corroborating the fact that these wires show unloading plateau of
significant lengths.
The effect of differential heat-treatment on the length of the unloading superelastic plateau in
bending may be inferred from one study. Mullins et al.50 compared 0.018 x 0.025” NS F100,
F200 and F300 archwires analogous to incisor (higher martensite), premolar, molar (higher
austenite) sections of GT-NiTi. The length of the unloading superelastic plateau of NS F100 was
statistically shorter than both NS F200 and NS F300 by 0.10-0.20 mm, somewhat supporting the
trend found in this study. As in our study, this represented less than 10% difference in the length
of the plateau and unlikely to be clinically meaningful. These differences were also not readily
perceived by visual inspection of the deactivation curves. To determine their relationship more
clearly, a study that directly explores the effect of heat-treatment on the length of the superelastic
plateau is needed.
4.5 Mean Slope of the Unloading Superelastic Plateau in Bending and Torsion
The slope of the superelastic plateau, representing consistency of active force, showed an
increasing trend from anterior to posterior sections of the arch in GT-NiTi in both bending and
torsion. This implies that the force delivered by anterior sections is more consistent than
posterior sections. Due to greater data scatter in torsion, statistically significant results were only
observed between incisor and molar sections. In bending, a statistical significance between
premolar and molar sections was also found.

58
Interestingly, control wires in the bending test showed a similar trend as GT-NiTi with
statistically significant difference between all segments. This is in contrast to the torsion test
where no difference was found between sections of the control wires. This finding implies that if
differential heat-treatment has an impact on the slope of the unloading superelastic plateau, it
was more apparent in torsion. In bending, the curvature of the specimens or the methodology of
testing had more influence on the outcomes, overpowering any effect that a differential heat-
treatment might have had.
Literature exploring the factors that affect the slope of the unloading superelastic plateau is
scarce and inconclusive. One finding that was consistent in our study is that larger dimension
wires produced steeper slopes compared to smaller dimension. Segner and Ibe9 tested a battery
of round and rectangular superelastic NiTi wires using the three-point bracket test. No consistent
relationship between slope and archwire size could be discerned. Lombardo et al.7, studying
traditional and thermodynamic round NiTi wires, also could not find a clear relationship between
wire dimension and slope.
A few studies measured the slopes of thermodynamic NiTi archwires more specifically.
Comparing the slopes of posterior segments of 0.016 x 0.022” NS F80, F160 and F240, which
may be analogous to incisor, premolar, and molar of BF wires from TTR perspective, there was a
decrease rather than increase in slope values contradicting our findings.9 However, differences
were small and such patterns were not shown for the GAC’s 0.016” Sentalloy wires (light,
medium, and heavy). Mullins et al.50 on the other hand, found that the slope tended to increase
with increasing stiffness of 0.018 x 0.025” NS (F100 > F200 > F300), which is in line with our
findings.
The increase in the mean slope between molar and incisor regions in both tests was just over
60%. For the bending test this was 18.5-27.42 g/mm and for torsion, 3.77-4.94 g�mm/°. These
differences were not readily perceived by visual inspection of the deactivation curves. Whether
such differences are clinically significant or relevant is currently unknown. These results cannot
be used to endorse the superior clinical effectiveness of incisor regions over posterior regions of
GT-NiTi. Instead, it lends support to the notion that differential heat-treatment may affect the
force-displacement ratio of thermodynamic NiTi wires at the unloading superelastic plateau.
Further studies to discern the influences of differential heat treatment on force-delivering

59
characteristics such as the slope and length of the of the plateau and their clinical significance are
needed.
4.6 Limitations of the study This study explored the properties of two sizes of a single brand of GT-NiTi at a specific
temperature under significant degrees of deformation. It is known that performance of
thermodynamic NiTi archwires is influenced by their chemical composition and manufacturing
processing,2,49 dimensions,6,7 testing conditions,48 ambient temperature,8,12,13 and strain.16 Thus,
any variability in these parameters may influence their performance and must be kept in mind
when interpreting the results of this study. As with NGT-NiTi wires, it is expected that GT-NiTi
from other manufacturers and of different dimensions would have variability in the measured
parameters and degrees of superelasticity.
Furthermore, the current investigation was performed in vitro, thus applications of our findings
to clinical scenarios should be treated with caution. As already discussed, exact forces and
moments delivered by archwires in clinical scenarios would be influenced by a multitude of
bracket-, wire-, malocclusion-, and environment-related variables and their interactions.
The tests were executed at 36±1°C. It is known that intraoral temperature varies throughout the
day27 and temperature fluctuations are known to affect the properties of thermodynamic NiTi
wires.8,12,38,53,61 Since the anterior, incisor regions of the arch are closest to ambient air, the mean
temperature tends to be lower than posterior, molar regions.27,57 This could potentially lead to
even greater differences between force levels delivered by anterior and posterior sections as
previously discussed. Since some permanent deformation was visible for the incisor section of
0.016 x 0.022” in this study at 36±1°C, these archwires may deliver forces much too low,
especially in mouth breathers.
It must be kept in mind that the differential properties of GT-NiTi explored in this study are only
apparent if superelastic plateau is reached. The superelastic plateau is meaningless if it is induced
at extreme levels of twist or deflection. The extent of deflection and twist in this study can be
considered high. This end range was chosen to ensure expressivity of the superelastic plateau and
similar numbers are recommended by ISO 1584145 guidelines and was used in other studies.36,52

60
Clinically, this may only characterize the behavior of the wire during moderate to severe
malalignment and may not be applicable in more mild cases.9
In our study, the induction of superelastic plateau began around 0.4 mm in bending deflections
and 22° in torsion. Clinically, it may be especially difficult to achieve this level of activation in
torsion as the highest bracket prescription is just over 20°.62 Moreover, for a 0.016 x 0.022” SS
wire in a 0.018” bracket, up to 18° mean torsional play has been recorded, which is significant.63
If minimal strain to induce superelastic plateau cannot be reached, the differentiation of observed
force levels would not be expressed and the wire will function as NGT-NiTi with a linear force-
deflection relationship throughout the arch.
4.7 Clinical Application Until GT-NiTi wires are tested in clinical trials and a clear benefit over traditional NiTi is shown,
the effects of differential forces that they deliver in-vivo are unknown and the claim that these
archwires are more “biologically favorable” remains a hypothetical idea. To date, a few
randomized control trials have compared the performance of different types of NiTi. Generally,
they have failed to find any differences in terms of speed of alignment and negative sequelae to
the patient.64 Thus, the specific archwire selection still remains at the discretion of the clinician.
Using the findings of this study, however, clinicians can more confidently consider the use of
GT-NiTi if graded forces are needed for the clinical situation at hand. It has been suggested that
such wires may be a good choice as a second wire after initial alignment is attained. It can be
used to achieve further alignment with the additional benefit of correcting the Curve of Spee
and/or shape of the dental arch. It can also be used later in treatment when posterior occlusion
needs settling, anterior rotations are still present, and leveling to correct overbite is yet to occur
as in cases of strong musculature.30 It may also be useful in the middle of treatment after bracket
repositioning, particularly the incisors, if losing control of posterior segments with lighter wires
is undesirable.

61
4.8 Suggestions for Future Research Testing GT-NiTi wires from other manufacturers could help solidify the conclusions of this
study. Moreover, understanding the behavior and force level range that can be expected from
other GT-NiTi on the market would be beneficial to the clinician interested in using this type of
NiTi wire. Testing these wires in a bracket set-up deflected to smaller deflections or twist angles
may also reveal whether the observed regional differences of the GT-NiTi wires are still relevant
in cases of mild malpositions within more clinically relevant scenarios. Testing these wires at a
full range of temperatures seen intraorally may give further insight into their intraoral
performance. Finally, the performance of GT-NiTi archwires can be assessed in-vivo in terms of
efficiency of movement and adverse outcomes (patient discomfort, root resorption) and
compared to the performance of traditional NiTi archwires.

62
Chapter 5 Conclusions
1. The BioForce GT-NiTi wire that were tested possessed different mechanical properties
throughout the archwire.
2. There were statistically significant differences in the forces and moments of the
unloading superelastic plateaus for GT-NiTi archwires (I < Pm < M) compared to NGT-
NiTi archwires during bending and torsion, respectively.
3. The differences were more pronounced in bending than in torsion. In bending, the
premolar section delivered 2.5 times as much force and incisor section, and the molar
section delivered twice as much force as the premolar section. In torsion, the difference
between incisor and premolar and premolar and molar was on average, a 1.4-fold
increase from the incisor to the premolar and the premolar to the molar sections.
4. Small differences in length and slope of the unloading superelastic plateau in bending and
torsion were also observed. The clinical relevance of these findings is questionable.
5. Clinically, the differential mechanical properties of GT-NiTi tested may not be achieved
in activations smaller than 0.4 mm deflection and 22° twist.

63
References 1. do Amaral Ferreira M, Luersen MA, Borges PC. Nickel-titanium alloys: a systematic
review. Dental Press J Orthod. 2012;17(3):71-82.
2. Miura F, Mogi M, Ohura Y, Hamanaka H. The super-elastic property of the Japanese NiTi
alloy wire for use in orthodontics. Am J Orthod Dentofacial Orthop. 1986;90(1):1-10.
3. Schwarz AM. Tissue changes incidental to orthodontic tooth movement. Int J Orthod Oral
Surg Radiogr. 1932;18(4):331-352.
4. Proffit WR. Contemporary Orthodontics. 4th ed. St. Louis, Mo.: Mosby Elsevier; 2007.
5. Miura F, Mogi M, Ohura Y. Japanese NiTi alloy wire: use of the direct electric resistance
heat treatment method. Eur J Orthod. 1988;10(3):187.
6. Gatto E, Matarese G, Bella G Di, Nucera R, Borsellino C, Cordasco G. Load-deflection
characteristics of superelastic and thermal nickel-titanium wires. Eur J Orthod.
2013;35(1):115-123.
7. Lombardo L, Marafioti M, Stefanoni F, Mollica F, Siciliani G. Load deflection
characteristics and force level of nickel titanium initial archwires. Angle Orthod.
2012;82(3):507-521. doi:10.2319/032511-213.1
8. Sakima MT, Dalstra M, Melsen B. How does temperature influence the properties of
rectangular nickel-titanium wires? Eur J Orthod. 2006;28(3):282-291.
9. Segner D, Ibe D. Properties of superelastic wires and their relevance to orthodontic
treatment. Eur J Orthod. 1995;17(5):395-402.
10. Bartzela TN, Senn C, Wichelhaus A. Load-deflection characteristics of superelastic
nickel-titanium wires. Angle Orthod. 2007;77(6):991-998.
11. Nakano H, Satoh K, Norris R, et al. Mechanical properties of several nickel-titanium alloy
wires in three-point bending tests. Am J Orthod Dentofacial Orthop. 1999;115(4):390-
395.

64
12. Parvizi F, Rock WP. The load/deflection characteristics of thermally activated orthodontic
archwires. Eur J Orthod. 2003;25(4):417-421.
13. Bolender Y, Verniere A, Rapin C, Filleul MP. Torsional superelasticity of NiTi archwires.
Angle Orthod. 2010;80(6):1100-1109.
14. Gurgel JA, Kerr S, Powers JM, Pinzan A. Torsional properties of commercial nickel-
titanium wires during activation and deactivation. Am J Orthod Dentofacial Orthop.
2001;120(1):76-79.
15. Kauffman G, Mayo I. The Story of Nitinol: The Serendipitous Discovery of the Memory
Metal and Its Applications. Chem Educ. 1996;2(2):1-21.
16. Burstone CJ, Qin B, Morton JY. Chinese NiTi wire--a new orthodontic alloy. Am J
Orthod. 1985;87(6):445-452.
17. Oltjen JM, Jr MGD, Ghosh J, Nanda RS, Currier GF. Stiffness-deflection behavior of
selected orthodontic wires. Angle Orthod. 1997;67(3):209-218. doi:2.
18. Thompson SA. An overview of nickel-titanium alloys used in dentistry. Int Endod J.
2000;33(4):297-310.
19. Santoro M, Nicolay OF, Cangialosi TJ. Pseudoelasticity and thermoelasticity of nickel-
titanium alloys: a clinically oriented review. Part I: Temperature transitional ranges. Am J
Orthod Dentofacial Orthop. 2001;119(6):587-593.
20. Santoro M, Beshers DN. Nickel-titanium alloys: stress-related temperature transitional
range. Am J Orthod Dentofacial Orthop. 2000;118(6):685-692.
21. Evans TJ, Durning P. Aligning archwires, the shape of things to come?--a fourth and fifth
phase of force delivery. Br J Orthod. 1996;23(3):269-275.
22. Santoro M, Nicolay OF, Cangialosi TJ. Pseudoelasticity and thermoelasticity of nickel-
titanium alloys: a clinically oriented review. Part II: Deactivation forces. Am J Orthod
Dentofacial Orthop. 2001;119(6):594-603.

65
23. Andreasen GF, Morrow RE. Laboratory and clinical analyses of nitinol wire. Am J
Orthod. 1978;73(2):142-151.
24. Khier SE, Brantley WA, Fournelle RA. Bending properties of superelastic and
nonsuperelastic nickel-titanium orthodontic wires. Am J Orthod Dentofacial Orthop.
1991;99(4):310-318.
25. Chen R, Zhi YF, Arvystas MG. Advanced Chinese NiTi alloy wire and clinical
observations. Angle Orthod. 1992;62(1):59-66.
26. Tonner RI, Waters NE. The characteristics of super-elastic Ni-Ti wires in three-point
bending. Part I: The effect of temperature. Eur J Orthod. 1994;16(5):409-419.
27. Moore RJ, Watts JT, Hood JA, Burritt DJ. Intra-oral temperature variation over 24 hours.
Eur J Orthod. 1999;21(3):249-261.
28. Mistakidis I, Gkantidis N, Topouzelis N. Review of properties and clinical applications of
orthodontic wires. Hell Orthod Rev. 2011;14(1):45-66.
29. Lanyon LE, Rubin CT. Static vs dynamic loads as an influence on bone remodelling. J
Biomech. 1984;17(12):897-905.
30. Kuftinec MM. Making a Good Use of a Good Material: BioForce Arch Wires. GAC White
Pap Rep. 2008.
http://www.dentsplygac.eu/sites/all/files/userfiles/France/bioforce_white_paper.pdf.
31. Pelton AR, Russell SM, DiCello J. The physical metallurgy of nitinol for medical
applications. JOM. 2003;55(5):33-37.
32. Drake SR, Wayne DM, Powers JM, Asgar K. Mechanical properties of orthodontic wires
in tension, bending, and torsion. Am J Orthod. 1982;82(3):206-210.
33. Mallory DC, English JD, Powers JM, Brantley WA, Bussa HI. Force-deflection
comparison of superelastic nickel-titanium archwires. Am J Orthod Dentofac Orthop.
2004;126(1):110-112.

66
34. Gurgel JA, Kerr S, Powers JM, LeCrone V. Force-deflection properties of superelastic
nickel-titanium archwires. Am J Orthod Dentofacial Orthop. 2001;120(4):378-382.
35. Nakano T, Hotokezaka H, Hashimoto M, et al. Effects of different types of tooth
movement and force magnitudes on the amount of tooth movement and root resorption in
rats. Angle Orthod. 2014;84(6):1079-1085.
36. Partowi S, Keilig L, Reimann S, Jäger A, Bourauel C. Experimental Analysis of Torque
Characteristics of Orthodontic Wires. J Orofac Orthop / Fortschritte der
Kieferorthopädie. 2010;71(5):362-372.
37. Meling TR, Odegaard J. On the variability of cross-sectional dimensions and torsional
properties of rectangular nickel-titanium arch wires. Am J Orthod Dentofacial Orthop.
1998;113(5):546-557.
38. Meling TR, Odegaard J. The effect of temperature on the elastic responses to longitudinal
torsion of rectangular nickel titanium archwires. Angle Orthod. 1998;68(4):357-368.
39. Ingram SB, Gipe DP, Smith RJ. Comparative range of orthodontic wires. Am J Orthod
Dentofac Orthop. 1986;90(4):296-307.
40. Kusy RP, Dilley GJ. Materials Science Elastic Modulus of a Triple-stranded Stainless
Steel Arch Wire via Three- and Four-point Bending. J Dent Res. 1984;63(10):1232-1240.
41. Kusy RP, Dilley GJ. Elastic property ratios of a triple-stranded stainless steel arch wire.
Am J Orthod. 1984;86(3):177-188.
42. Kusy RP. On the use of nomograms to determine the elastic property ratios of orthodontic
arch wires. Am J Orthod. 1983;83(5):374-381.
43. Schaus JG, Nikolai RJ. Localized, transverse, flexural stiffnesses of continuous arch
wires. Am J Orthod. 1986;89(5):407-414.
44. Garrec P, Tavernier B, Jordan L. Evolution of flexural rigidity according to the cross-
sectional dimension of a superelastic nickel titanium orthodontic wire. Eur J Orthod.
2005;27(4):402-407.

67
45. International Standard ISO 15841:2014(E) Dentistry - Wires for use in Orthodontics.
46. Iijima M, Ohno H, Kawashima I, Endo K, Mizoguchi I. Mechanical behavior at different
temperatures and stresses for superelastic nickel-titanium orthodontic wires having
different transformation temperatures. Dent Mater. 2002;18(1):88-93.
47. Tonner RI, Waters NE. The characteristics of super-elastic Ni-Ti wires in three-point
bending. Part II: Intra-batch variation. Eur J Orthod. 1994;16(5):421-425.
48. Wilkinson PD, Dysart PS, Hood JA, Herbison GP. Load-deflection characteristics of
superelastic nickel-titanium orthodontic wires. Am J Orthod Dentofacial Orthop.
2002;121(5):483-495.
49. Yoneyama T, Doi H, Hamanaka H, Okamoto Y, Mogi M, Miura F. Super-elasticity and
thermal behavior of Ni-Ti alloy orthodontic arch wires. Dent Mater J. 1992;11(1):1-10.
50. Mullins WS, Bagby MD, Norman TL. Mechanical behavior of thermo-responsive
orthodontic archwires. Dent Mater. 1996;12(5):308-314.
51. Filleul MP, Jordan L. Torsional properties of Ni-Ti and copper Ni-Ti wires: the effect of
temperature on physical properties. Eur J Orthod. 1997;19(6):637-646.
52. Archambault A, Major TW, Carey JP, Heo G, Badawi H, Major PW. A comparison of
torque expression between stainless steel, titanium molybdenum alloy, and copper nickel
titanium wires in metallic self-ligating brackets. Angle Orthod. 2010;80(5):884-889.
53. Meling TR, Odegaard J. The effect of short-term temperature changes on the mechanical
properties of rectangular nickel titanium archwires tested in torsion. Angle Orthod.
1998;68(4):369-376.
54. Sarul M, Kawala B, Kawala M, Antoszewska-Smith J. Do the NiTi low and constant force
levels remain stable in vivo? Eur J Orthod. 2015;37:656-664.
55. Spini TS, Valarelli FP, Cancado RH, Freitas KMS de, Villarinho DJ. Transition
temperature range of thermally activated nickel-titanium archwires. J Appl Oral Sci.
2014;22(2):109-117.

68
56. Jepsen A. Root surface measurement and a method for x-ray determination of root surface
area. Acta Odontol Scand. 1963;21:35-46.
57. Volchansky A, Cleaton-Jones P, Wright PG, Fatti LP. Gingival and labial vestibular
temperature in young individuals. J Dent. 1985;13(4):323-330.
58. Garner LD, Allai WW, Moore BK. A comparison of frictional forces during simulated
canine retraction of a continuous edgewise arch wire. Am J Orthod Dentofac Orthop.
1986;90(3):199-203.
59. Morina E, Eliades T, Pandis N, Jager A, Bourauel C. Torque expression of self-ligating
brackets compared with conventional metallic, ceramic, and plastic brackets. Eur J
Orthod. 2008;30(3):233-238.
60. Ren Y, Maltha JC, A. MV ’t H, Kuijpers-Jagtman A. Optimum force magnitude for
orthodontic tooth movement: a mathematic model. Am J Orthod Dentofac Orthop.
2004;125(1):71-77.
61. Meling TR, Ødegaard J. The effect of short-term temperature changes on superelastic
nickel-titanium archwires activated in orthodontic bending. Am J Orthod Dentofac
Orthop. 2001;119(3):263-273.
62. Proffit WR, Turvey TA, Phillips C. The hierarchy of stability and predictability in
orthognathic surgery with rigid fixation: an update and extension. Head Face Med.
2007;3:21.
63. Meling TR, Odegaard J. The effect of second-order couple on the application of torque.
Am J Orthod Dentofacial Orthop. 1998;113(3):256-262.
64. Jian F, Lai W, Furness S, et al. Initial arch wires for tooth alignment during orthodontic
treatment with fixed appliances. Cochrane database Syst Rev. 2013;4:CD007859.