Embed Size (px)
Citation preview

11(2014) 245 - 259
Abstract In this work, tensile and shear modulus, as well as Poisson's ratio of a woven orthotropic nanocomposite plate were determined from vibration data. Plates used in the experiment were 16 layers S2-glass/epoxy composite manufactured by vacuum assisted wet lay-up. The nanocomposite plate was obtained by adding 0%, 1%, 2%, 5% and 10% nanoclays in weight to the epoxy matrix. A Finite Element model of the composite plate combined with a gradient method was applied to obtain an approximate numerical solution to experimental data in order to estimate the mechanical proper-ties. Two different modal procedures were employed: the Laser Anemometry and Hammer test. A modal analysis was made in both cases to determine structural mode shape and associated frequencies, modal and mechanical properties for different nanoclay composite plates, as well as assessing its sensitivity to Modal Analysis.
Keywords Modal analysis, mechanical properties, nanocomposites, finite elements, inverse methods.
Mechanical propert ies of nanocomposite laminated structure and its sensibi l ity to modal analysis proce-dure
1 INTRODUCTION
The nanocomposite is a laminated structure where nanoparticles are inserted into epoxy matrix, such procedure can improve some of the mechanical properties of the laminate. Another attrac-tive aspect of a nanocomposite structure is the reduction of damage due to impact loadings. Among researchers who have studied the effect of nanoparticles, Yasmin et al. (2003) and Isik et al. (2003) also found an increase in the elastic modulus and toughness.
A more comprehensive study on clay-epoxy nanocomposites was undertaken by Haque and Shamsuzzoha (2003), which evaluated both mechanical and thermal properties. Their main con-clusions were that thermo-mechanical properties mostly increase with low clay loadings (1-2% in
Horácio Va ladares Duarte *
Lázaro Valent im Donadon
Antônio Ferre ira Ávi la
Universidade Federal de Minas Gerais, Escola de Engenharia, Departamento de Engenharia Mecânica, Avenida Antônio Carlos 6627, ZIP CODE 31270-901. Received in 05 Feb 2013 In revised form 03 May 2013 * Author email: [email protected]

246 H. V. Duarte et al. / Mechanical properties of nanocomposite laminated structure and its sensibility to modal analysis procedure
Latin American Journal of Solids and Structures 11(2014) 245 - 259
weight), but decrease with higher clay loadings (≥ 5% in weight). In addition, the use of nanoclays also decreases the coefficient of thermal expansion (CTE).
They also observed a degradation of properties at higher clay loadings. This phenomenon could be due to the phase-separated structures and defects in cross-linked structures. For lami-nated composite and layered structures such as plasma sprayed coatings the vibration technique has proven to be an appropriate method (Lauwagie et al., 2008). The dynamic response of a sys-tem depends on geometric and material properties. This principle and the development of new techniques have made it possible to determine the material properties from vibration measure-ments. Usually the in plane engineering constants Ex, Ey, υxy and Gxy are obtained from flexural vibration measurements of a plate.
There are various methodologies reported in the literature (Lauwagie et al., 2008; Ayorinde and Yu, 2005; Hwang and Chang, 2000), but all of them use modal analysis for experimental mode identification and employ an optimization method to approximate the actual results to the-oretical or Finite Element models. In this work, the procedure proposed by Hwang is used. A commercial code, Ansys, which also offers the function of design optimization, is employed to model the woven laminate orthotropic plate.
Two modal procedures are employed, Doppler Anemometry and a modified Hammer Test. The Laser Doppler Vibrometer method is reliable, fast, and less sensitive to environmental conditions, it does not dependent on operator skills and can be easily confined to spaces with a controlled environment. In this method the testing plate must be coupled to the force sensor which is linked to the excitation shaker, with the result that this mounting adds an extra mass to system. To deal with this, additional mass inertia and rotatory inertia were included in the Finite Element model. The traditional Hammer Test was performed and results were compared.
Batista (2005) also used the method proposed by Hwang and Chang (2000), the method works quite well for isotropic and orthotropic plates. However, for angle ply laminates, due to the com-plexities of mode shapes some constants are not well identified.
The objective of this paper was to study how nanoparticle concentration may affect material properties. In order to isolate influences other than nanoparticle loadings, all manufacturing pa-rameters were kept fixed, with the exception of the nanoclay concentration. An additional objec-tive was to determine the sensitivity of the inverse method to vibration testing method. 2 MATERIALS AND TESTING PROCEDURE
The nanocomposite prepared for this work was a S2-glass/epoxy-clay. The epoxy formulation was based on two parts, part A (diglycidyl ether of bisphenol A) and part B - an aliphatic amine hardener - (triethylenetetramine). The nanoclay particles used in this study are organically modi-fied montmorillonite in a platelet form, while the S2-glass fiber has a plain-weave woven fabric configuration with a density of 180 g/m2 from Texiglass. The S2-glass/epoxy-nanoclay composite is a laminate plate with 16 layers and a 65% fiber volume fraction, orientation [0]16, orthotropic. The nanocomposite synthesis followed the methodology proposed by Avila et al (2006a) and (2006b). In order to be able to investigate the nanoparticles influence on vibration analysis and its mechanical properties, samples with 0%, 1%, 2%, 5% and 10% of nanoclay with respect to the

H. V. Duarte et al. / Mechanical properties of nanocomposite laminated structure and its sensibility to modal analysis procedure 247
Latin American Journal of Solids and Structures 11(2014) 245 - 259
matrix mass were employed. All plates were rectangular and had the same dimensions: 136mm x 116mm x 2.4mm. 2.1 Modal Analysis
The vibration analyses were performed to determine the mode shapes, natural frequencies and the damping coefficient. The first vibration testing were performed using a Laser Doppler Vibrometer, model OFV-303.8 and controller model OFV 3001 S from Politec, a Hewlett Packard data acqui-sition system model 35670A, a mini-shaker, a power amplifier and force transducer from PCB. The tested plates were suspended using a fine nylon wire and excited by a random signal (white noise). A piezoelectric force transducer was used as reference for the FRFs, which was bonded to the plate and linked by the stinger to the shaker. The point force, the position in which the force transducer was fixed, were the same point for all experiments, the experimental set-up is shown in Fig. 1. The velocity of the plate surface was measured using a grid of 35 points by the laser Doppler vibrometer.
Figure 1 Experimental set-up for Laser Doppler Vibrometer method
The data acquisition system processed the signal response of the measurement point, generat-ing the Mobility (velocity/force) Function Response Frequency (FRF) for each point of the plate. A modal analysis program was used to identify the mode shape using the 35 FRFs for each plate, such program is based on polynomial interpolation and employs the Chebyshev Orthogonal Poly-nomials method (Arruda et al., 1996).
A second modal technique was also employed. In this second experiment tests were performed using the same plates and measurement points. But in this case, an Impact Hammer with a built-in force transducer was used, making it possible to excite the structure measuring the applied force. The experimental set-up can be seen in Fig. 2. The hammer force is measured at each grid point and the plate acceleration response (rms) is measured by the accelerometer at a fixed point, same position for all plates. Due to the reduced size of the plates, it was used a miniature accel-erometer from PCB type 352A71 with mass of 0.64 grams, which represents 100 times less weight than the plates, while the excitation hammer is PCB model 086C05.
248 H. V. Duarte et al. / Mechanical properties of nanocomposite laminated structure and its sensibility to modal analysis procedure
Latin American Journal of Solids and Structures 11(2014) 245 - 259
Figure 2 Experimental set-up for hammer method
Using a hammer impact and one accelerometer to perform modal analysis, it can be done fix-ing the accelerometer and moving the impact point or fixing the impact point and moving the accelerometer. Despite the accelerometer mass being very light weight, 0.64 grams, compared with the plate mass, the best way was observed to fix the accelerometer position and to move the im-pact point. In fact, even been very light weight, the change in accelerometer position drifted a little the natural frequencies what degenerate the mode shape analysis. So the best way to obtain the mode shape was to fix the accelerometer position and to move the impact point (Hu and Wang, 2009). The modal analysis program employed to analyses the results was the same as for the previous case. 2.2 Inverse Method
The procedure used to identify the mechanical properties is based on the inverse method, where were combined a gradient method and a Finite Element Model of the composite plate. The opti-mization is a zero-order approach method, offered as a tool of the FE commercial code, and fol-lowing the Hwang procedure (Hwang and Chang, 2000; Hwang et al., 2009). The state variables ξn are related to the difference between FE, 𝑓!!", and experimental modal nth frequency fn:
𝜉! =𝑓!!" − 𝑓!
𝑓!100 (1)
The cost function F is defined as:
𝐹 𝐸!" ,𝐺!" , υ!" = 𝜉!!
!!!
(2)
where mechanical properties are Tensile Modulus Exy, Shear Modulus Gxy and the Poisson's ratio υxy. Besides, it was used the default values for the Ansys optimization. In both methods, Laser Doppler and Hammer, the FE routine employed shell elements to model the plates, the shell element shell181 which is an Ansys element that has four nodes and six degrees of freedom in each node and which allows multi-layers to model laminate structures.

H. V. Duarte et al. / Mechanical properties of nanocomposite laminated structure and its sensibility to modal analysis procedure 249
Latin American Journal of Solids and Structures 11(2014) 245 - 259
The shell181 element is based on the Mindlin-Reissner theory, which is usually referred to as first order shear deformation theory. The FE model also employed the mass21 element to consider the effect of mass and rotary inertia of the force transducer bonded to the plate. In Gagneja et al. (2001), there are theoretical discussions and experimental results concerning length to thickness ratios of composite structures and the FE type chosen for this study. Besides, the mass of the force transducer must be included in the FE representation in order to obtain good results due to the fact that the mass of the plates are considerably small, around 64 grams each. 3 RESULTS
3.1 Vibrometer Doppler laser method
The structure was modeled by 320 shell elements in a regular quadrilateral mesh and by one con-centrated mass element. A traditional mesh test was performed to confirm FEM precision in the experimental frequency range. The results showed that there was no difference between the experimental mode shapes for 1%, 2%, 5% and 10% nanoclay composite and those of the reference resin plate, Fig. 3; the main difference being with regards to modal frequency.
Figure 3 Mode shapes for Resin plate. On the left side the experimental mode shapes, on right the same modes at the end of the
inverse approximation method.

250 H. V. Duarte et al. / Mechanical properties of nanocomposite laminated structure and its sensibility to modal analysis procedure
Latin American Journal of Solids and Structures 11(2014) 245 - 259
Figure 3 (continued) Mode shapes for Resin plate. On the left side the experimental mode shapes, on right the same modes at the end of the inverse approximation method.
On Table 1 there was summarized the modal Doppler results, the natural frequencies and the associated damping coefficients for each experimental mode in the frequency range that appears. For the 2%, 5% and 10% nanoclay composite plates, the analysis identified ‘spurious modes’ that were detached. On Tab 1 those identified as ‘spurious modes’ are designated by sm* on the right upper side of the mode frequency.
Table 1 Matrix composite content and Modal Properties. Composite
Matriz Mass [gr]
Modal Properties Mode Shapes 1st 2nd 3rd 4th 5th 6th 7th
Pure Epoxy
66,37 Nat. Frequency [Hz] 180,6 344,4 423,6 568,7 692,9 735,2 Damping Coef. 0,0297 0.0166 0,0098 0,0112 0,0137 0,0131
Nanoclay 1% weight
65,27 Nat. Frequency [Hz] 184,9 347,4 424,8 550,1 683,4 728,2 Damping Coef. 0,0209 0,0247 0,0088 0,0136 0,0137 0,0138
Nanoclay 2% weight
66,92 Nat. Frequency [Hz] 173,6 361,3 424,0 578,0 655,3sm 716,1 783,0 Damping Coef. 0,023 0,0248 0,0116 0,0173 0,0052 0,0134 0,0166
Nanoclay 5% weight
67,46 Nat. Frequency [Hz] 202,3 336,0sm 430,1 494,6 645,0 747,6 821,5 Damping Coef. 0,0372 0,0445 0,0162 0,0233 0,0134 0,0011 0,0169
Nanoclay 10% weight
67,89 Nat. Frequency [Hz] 196,0 329,8sm 425,5 477,6 610,3 702,8 764,1 Damping Coef. 0,0335 0,0412 0,0266 0,0163 0,0133 0,0135 0,0153

H. V. Duarte et al. / Mechanical properties of nanocomposite laminated structure and its sensibility to modal analysis procedure 251
Latin American Journal of Solids and Structures 11(2014) 245 - 259
Analyzing the reference Resin and 1% Nanocomposite plate, it is possible to observe that the mode shapes did not show any unexpected behavior and the mechanical properties were obtained by direct application of the inverse method, while for 2% nanocomposite plate two modes, 4 and 5, presented a similar shape, Fig 4. That behavior does not make sense theoretically or experi-mentally and it had not been observed in the previous cases.
Figure 4 Mode Shapes for 2% nanocomposite plate. At the left side the experimental 4th mode (578.0 Hz), at center the experi-mental spurious 4th mode (655.3 Hz) and on the right, the final optimized FE mode shape.
The finite element simulation showed a low frequency coupling mode between the plate and the force transducer, below the first mode shape natural frequency, for all plate simulations. This coupled frequency mode was similar to a rigid body mode as the transducer was modeled as a punctual element with mass and rotational inertia but without dimensions. This FE low frequen-cy mode offered an answer to the similar modes: it was a coupling mode between the experi-mental apparatus and the elastic plate. The coupling mode between the test plate and the force transducer was named 'spurious mode', but in reality it was neither spurious nor an experimental or analysis error. This mode is termed as spurious because it is merging with the natural vibration set frequencies of the plate and disturbing the analysis. Due to the complexity of model contacts and connections, a numerical model to deal with the dynamical coupling between the plate and force transducer, elastic stinger and shaker was not implemented. So the dynamical coupling appeared somewhat similar to a low frequency rigid body mode. The nanocomposite mass in the matrix changed the elastic properties of the plates and the coupling frequency mode moved inside the range of the experimental plate natural fre-quencies as the nanoclay mass and mechanical properties changed for each plate matrix composi-tion. Some published works, such as the work of Hwang et al. (2009), have presented methods for dealing with missing frequencies in measurement frequencies sets or those sets with natural fre-quencies with large errors due to measurement problems. The Hwang work deals with incomplete set of experimental data and selects the best one with minimal cost function F, where the proce-dure uses a genetic algorithm program. The main idea was employed in this work. The solution presented here is to find the best plate mode set, each set with similar modes, by comparing the error between the experimental mode frequencies and those frequencies at the end of the optimi-zation process.
252 H. V. Duarte et al. / Mechanical properties of nanocomposite laminated structure and its sensibility to modal analysis procedure
Latin American Journal of Solids and Structures 11(2014) 245 - 259
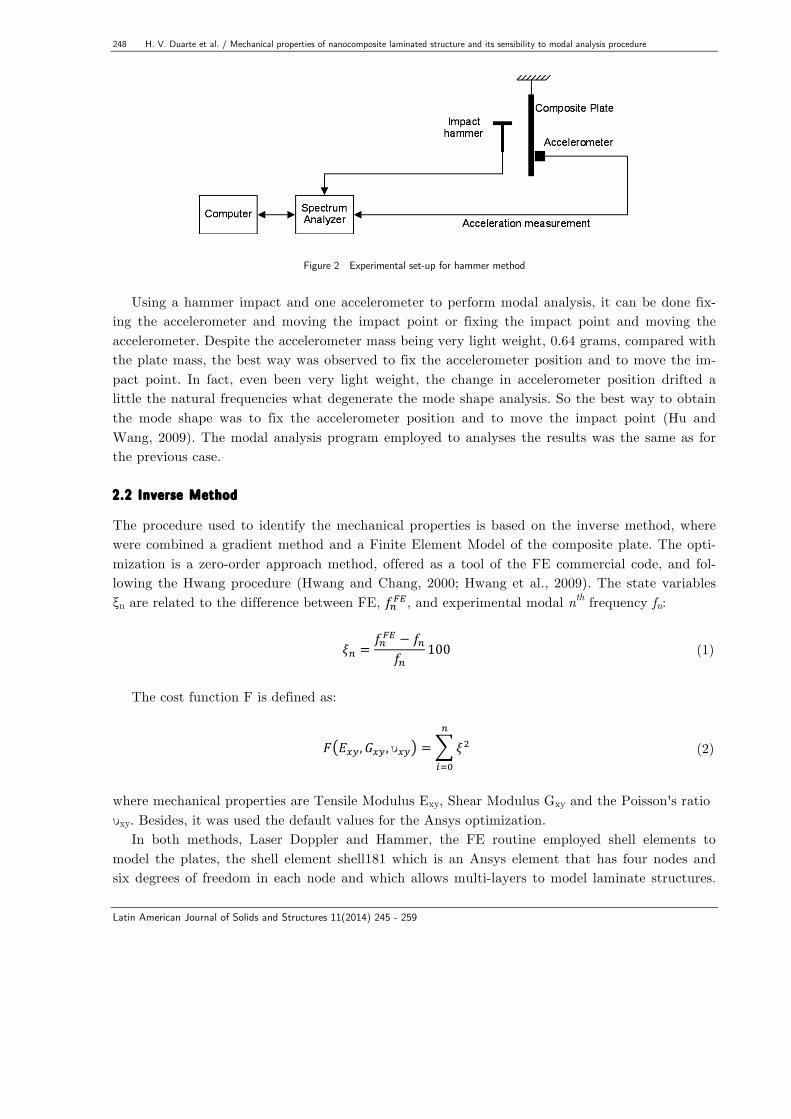
In other words, the optimization was not done for all frequencies in a single process. A new mode frequency was included in the previous set, the minimization was performed and elastic properties found. The latest elastic properties were used as an initial value in a new minimization process where the next mode frequency was to be included in this updated set, each minimization run is named as iteration. The latest iteration was performed using a small tolerance for the cost function F, Eq. 2, for all cases F <|10-2|.
Table 2 Frequency mode error ξn in each iteration. Frequency for the 4th mode 578 Hz.
iteration ξ1 ξ2 ξ3 ξ4 ξ5 ξ6 Σξn 1st 0,01 0 0 0 0 0 0,01 2nd 0,04 0,04 0 0 0 0 0,08 3rd 0,99 2,08 2,22 0 0 0 5,28 4th 0,98 2,10 2,20 0,79 0 0 6,08 5th 1,03 2,02 2,28 0,67 2,30 0 8,29 6th 1,03 2,03 2,27 0,69 2,28 3,92 12,2
Table 2 and Tab. 3 show the frequency error for each mode set in the minimization procedure for the 2% content nanoclay plate. Table 2 presents the error ξ for each natural frequency in each iteration. In this case, the fourth mode frequency is supposed to be the 578.0 Hz, the similar mode shape with 655.3 Hz frequency being removed from the frequency set, so there are six actu-al modes. Table 3 presents the same error evolution considering the fifth experimental mode fre-quency (655.3 Hz) as actually fourth mode frequency, with mode with 578.0 Hz being discarded from these analyses.
Table 3 Frequency mode error ξn in each iteration. Frequency for the 4th mode 655,3 Hz.
Iteration ξ1 ξ2 ξ3 ξ4 ξ5 ξ6 Σξn
1st 0,01 0 0 0 0 0 0,01 2nd 0,04 0,04 0 0 0 0 0,08 3rd 0,99 2,08 2,22 0 0 0 5,28 4th 1,01 7,52 2,06 2,73 0 0 13,3 5th 1,03 2,42 1,53 8,84 1,67 0 15,5 6th 0,99 2,46 2,10 9,53 2,11 4,14 21,3
Table 4 Frequency mode error ξn at the end of the best set minimization process, for 5% and 10% plates.
Plat content ξ1 ξ2 ξ3 ξ4 ξ5 ξ6 Σξn Nanoclay 5% 1,01 5,14 6,68 2,10 2,54 6,34 23,8 Nanoclay 10% 1,00 8,53 8,04 2,09 3,42 6,69 29,8

H. V. Duarte et al. / Mechanical properties of nanocomposite laminated structure and its sensibility to modal analysis procedure 253
Latin American Journal of Solids and Structures 11(2014) 245 - 259
Figure 5 On upper line the mode shapes for 5%, 10% nanoclay plate on the bottom line. In the left column the experimental spurious modes (336.0 Hz) for 5% nanocomposite and below (329.8 Hz) for 10% nanocomposite. In the center column the experimental best fit for the 2nd mode 430.1 Hz for 5% and 425.5 Hz for 10% nanocomposite, both out of phase by 180°. At right the final optimized FE
mode shape. Table 3 shows highest error while Tab. 2 shows the lowest errors ξ for the fourth mode and for the sum of errors. Thus, the fourth mode with frequency 578.0 Hz was used to determine the elas-tic properties shown on Tab. 7. The fifth mode shape, with frequency of 655.3 Hz, was considered a coupling mode between the experimental apparatus and the elastic plate for this 2% content nanoclay plate and deemed to be a ‘spurious mode’. As it was shown on Tab. 1 the same behavior was observed for plates with 5% and 10% of nanoparticle content. On Tab. 4 is presented the final iteration for both plates with the best fre-quency set. The 5% nanoclay content plate modes with 336.0 Hz and 430.1 Hz have a similar mode shape, and the experimental third mode, 430 Hz, presented a better fit at the end of opti-mization process. For the 10% nanoparticle plate, the second and third modes are similar also, and the third mode, with 425.5 Hz, had, similarly, the best approximation. In Tab. 7 are the final properties for the best set for the minimization process as presented in Tab. 2, Tab. 3, and Tab. 4. 3.2 Hammer excitation method
This method is described in Section (2.1), and the excitation was performed by a hammer impact on each point of the grid and the response measured at a fixed point by a mini-accelerometer. The Finite Element model employed was that of the previous case. The only difference was that the plate structure was modeled by 1190 shell elements plus a concentrated mass element. This regular quadrilateral mesh was used to match the mass element

254 H. V. Duarte et al. / Mechanical properties of nanocomposite laminated structure and its sensibility to modal analysis procedure
Latin American Journal of Solids and Structures 11(2014) 245 - 259
position, accelerometer mass, with a node on the mesh. The accelerometer position was chosen so as to provide the best signal for all excitation points. The modal properties in Tab. 5 display several differences when compared with Tab. 1. The main difference are related to the natural frequencies, because the force transducer used on Dop-pler Vibrometer test had a large mass, so the experimental assembly had a large mass and low natural frequencies.
Table 5 Matrix composite content and Modal Properties for Hammer Excitation.
Composite
Matriz Mass [gr]
Modal Properties Mode Shapes 1st 2nd 3rd 4th 5th 6th
Pure Epoxy
66,37 Nat. Frequency [Hz] 245,9 492,1 655,7 702,1 816,4 1295 Damping Coef. 0,0271 0,0077 0,0083 0,0108 0,0135 0,0154
Nanoclay 1% weight
65,27 Nat. Frequency [Hz] 250,5 469,9 646,2 692,4 813,4 1294 Damping Coef. 0,0209 0,0069 0,0074 0,0109 0,0114 0,0091
Nanoclay 2% weight
66,92 Nat. Frequency [Hz] 260,0 487,0 668,6 668,6 722,6 848,5 Damping Coef. 0,0201 0,0069 0,0069 0,0069 0,0100 0,0104
Nanoclay 5% weight
67,46 Nat. Frequency [Hz] 268,7 503,4 675,7 743,5 861,2 Damping Coef. 0,0230 0,0073 0,0081 0,0119 0,0120
Nanoclay 10% weight
67,89 Nat. Frequency [Hz] 260,8 500,6 673,1 726,3 847,5 Damping Coef. 0,0242 0,0077 0,0073 0,0132 0,0118
The damping coefficient changed with the frequencies and resin matrix contents in both exper-iments. The damping factor is sensitive to frequency for the great majority of materials. As the excitation force and technique to implement it is different in each experiment and the frequencies are quite dissimilar in each mode, it is difficult to compare the damping results. However, for the hammer method, the damping coefficient has the same numerical magnitude order for each mode independent of the material used in this experimental procedure. For the Doppler Vibrometer method the damping coefficient presents dispersion without a trend. Table 6 presents the final individual error ξn for each mode n at the final minimization process that approximates the FE model mode frequencies to experimental natural frequencies by chang-ing the mechanical properties, such as planar Elastic Modulus Exy [GPa], shear Modulus Gxy [GPa] and Poisson coefficient υxy.
Table 6 Frequency mode error ξn at the end of the best set minimization process.
Plat content ξ1 ξ2 ξ3 ξ4 ξ5 ξ6 Σ𝜉!! Resin 0,43 1,20 1,26 1,14 1,03 0,35 5,70
Nanoclay 1th 0,02 0,48 0,13 0,09 0,10 0,53 0,55 Nanoclay 2th 0,39 0,11 0,43 0,72 0,02 0,87 Nanoclay 5th 0,12 1,22 1,26 1,27 0,73 5,24 Nanoclay 10th 0,07 0,76 0,55 0,16 0,42 1,08

H. V. Duarte et al. / Mechanical properties of nanocomposite laminated structure and its sensibility to modal analysis procedure 255
Latin American Journal of Solids and Structures 11(2014) 245 - 259
3.3 Mechanical properties
On Tab. 7 are the mechanical properties for the Doppler Vibrometer Method(1), and for Hammer Method, method(2). In Tab. 7, the Shear Modulus shows good agreement between the two meth-ods. There is an increase in the Shear Modulus with nanoclay mass up to 5% content and a de-creasing tendency for the highest content. With the exception of the 2% nanocomposite content that, in both experiments, showed a different behavior, the difference between the results for the two methods is less than 6.5% for the Shear Modulus.
Table 7 Frequency mode error ξn at the end of the best set minimization process.
Composition Exy [GPa](1) Exy [GPa](2) Gxy [GPa](1) Gxy [GPa](2) υxy(1) υxy
(2) Resin 27,3 23,3 4,2 4,2 0,104x10-7 0,182x10-3
Nanoclay 1th 28,3 24,3 5,1 4,8 0,102x10-3 0,133 Nanoclay 2th 31,9 23,6 3,8 4,7 0,733x10-3 0,78 Nanoclay 5th 36,1 24,7 5,3 5,0 0,136x10-3 0,044 Nanoclay 10th 35,7 24,6 5,0 4,7 0,271x10-3 0,104
On Tab. 7 the Elastic Modulus showed a noticeable difference when comparing both methods. The Elastic Modulus in the Doppler Method(1) presented a continuous and remarkable improve-ment with the nanoclay content, while in the Hammer Method(2) there is a 4.3% improvement from resin to 1% nanoclay and almost the same value was maintained for the other specimens. The 2% nanocomposite plate displayed a slight decrease for the Hammer method. These unex-pected results for the 2% nanocomposite in the Elastic Modulus and Shear Modulus for both methods may be due to problems in the specimen preparation.
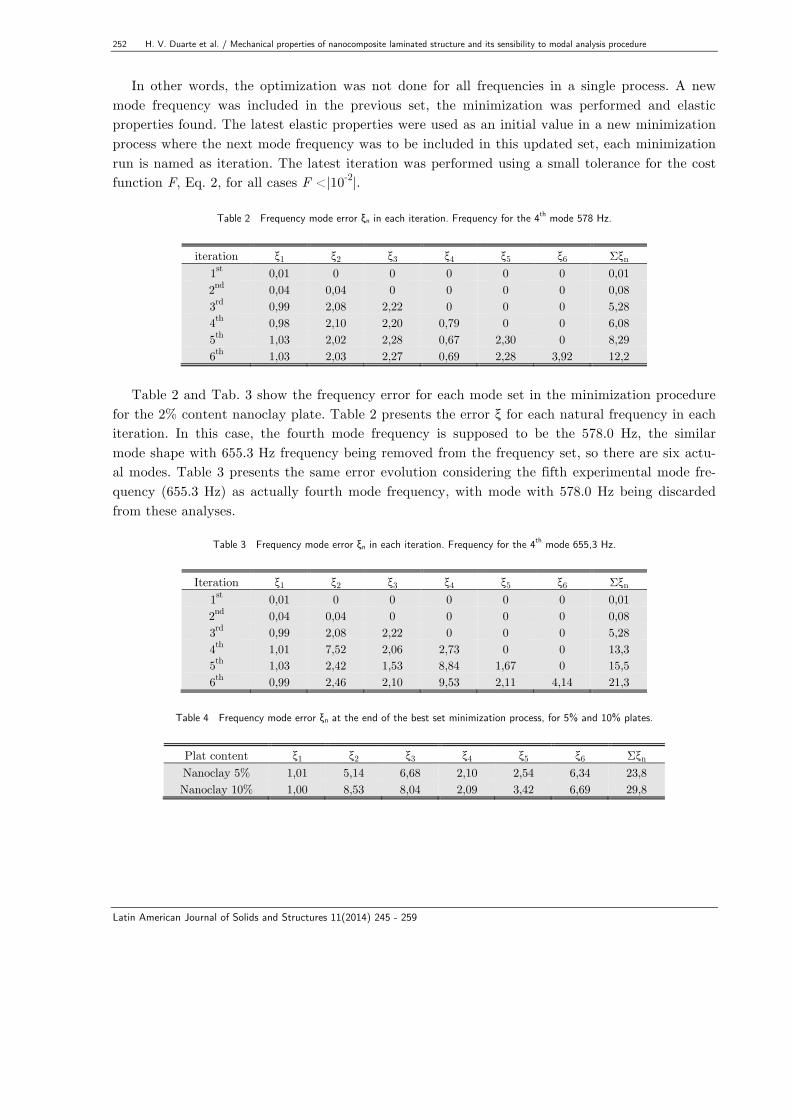
Figure 6 Mode Shapes for 1% nanocomposite plate, hammer method. At the left column the experimental mode shapes at right the FE mode at the end of optimization process.
256 H. V. Duarte et al. / Mechanical properties of nanocomposite laminated structure and its sensibility to modal analysis procedure
Latin American Journal of Solids and Structures 11(2014) 245 - 259
Figure 6 (continued) Mode Shapes for 1% nanocomposite plate, hammer method. At the left column the experimental mode
shapes at right the FE mode at the end of optimization process.
For both methods the maximum Elastic Modulus value occurs for the 5% nanocomposite plate, and for this specimen, the difference between the methods also attains its maximum. For the two plates, the Resin and 1% Nanoclay plates, where the Doppler method does not display the 'spurious modes', the difference between the methods is constant, being around 17%. An ex-planation for this difference is that the transducer prevents the plate flexure on the attachment region in Doppler Vibrometer method. The plate was modeled to consider the mass and transduc-er inertia in a single point but not to consider the improvement in the plate stiffness on the at-tachment region. But the biggest difference between the two methods refers to the Poisson Coefficient. This property has a very low value when compared with the Shear or Elastic Modulus, and this differ-ence presents some numerical problems when the Poisson's Ratio is evaluated. From Tab. 7 it is obvious that the data from the Doppler Method is very different from usual values. The results from Hammer Method are closer to expected values. The Poisson's Ratio is very sensitive to aspect ratio between the width and length of the plate, and this is related to the coupled deformation in two orthogonal directions (Lauwagie et al.,

H. V. Duarte et al. / Mechanical properties of nanocomposite laminated structure and its sensibility to modal analysis procedure 257
Latin American Journal of Solids and Structures 11(2014) 245 - 259
2003). This means that coupled modes presenting bending in both orthogonal directions, that is torsional-bending modes, are the best mode shapes to identify the Poisson Coefficient. The three last mode shapes on Fig. 6 are the best to identify the Poisson's Ratio when they are well defined (Lauwagie et al., 2010). The Poisson Coefficient is related to well-identified experimental coupled mode shapes and good consistency between them. The Figure 6 presents the six mode shapes for 1% nanoclay plate, for highest content plate only the first five mode shapes were identified, Tab. 5. In Fig. 3, for the Doppler Method, all mode shapes seem to be deformed by the presence of sensor mass and do not have a well-defined coupled bending mode. These poorly defined torsional-bending modes may explain the poor re-sults for Poisson's ratio obtained by this procedure. And the plate stiffness, on the force trans-ducer attachment region not considered in FE model, is again an explanation for these results. There are also a relation between the cost function low value (total frequency mode error ξ2, on Tab. 6) and the best results for the Poisson's ratio for the Hammer method (2), Tab. 7. Of course a low value for ξ2 does not mean that the Poisson's coefficient is correct but for high val-ues of cost function F the Poisson's ratio is untrusted, and this was observed for all cases present-ed in this work. 4 CONCLUSIONS
The results summarized on Tab. 7 suggest that the behavior of the shear modulus is probably linked to the improvement in shock resistance with the nanoclay content matrix plate. This ten-dency was previously associated with the increase in the damping coefficient (Avila et al., 2006a), but in this work the high damping coefficient was linked to 'spurious modes'. The Hammer Method is the more reliable, the errors between the experimental frequencies and those obtained from the Finite Element model are the smallest. Results obtained by this tech-nique showed a limited growth in the Elasticity Modulus value with the improvement of nano-particles mass in the matrix of the composite. As the Elasticity Modulus is more dependent on fiber properties than the properties of the matrix, those results are considered coherent with the theory. The laser vibrometer measurements showed a more significant increase in the Elasticity Modu-lus, but the presence of 'spurious modes' in the range of natural frequencies of the plate it showed that the Finite Element model does not accurately describe the phenomenon. As a consequence, this method presented the greatest errors at the end of the error minimization process. It was also observed that, using this methodology, the pure resin and 1% nano content plates did not display ‘spurious modes’ inside experimental frequency range, but they did show a 17% difference in the Elasticity Modulus value when compared with those obtained by means of the Hammer procedure. The Laser Doppler Vibrometer technique has several desirable features and, to make the model more realistic, probably the plate stiffness on the force transducer attachment region can be considered in FE model. There is also the problem of the excessive mode distortion resulting in unreliable values for Poisson's ratio. The Shear Modulus was less sensitive to the problems observed for Elastic Modulus and Pois-son's ratio experimental values. The Shear Modulus presented close values for both methods, with the dispersion of values within the expected. The Elasticity modulus depends on, at least, two

258 H. V. Duarte et al. / Mechanical properties of nanocomposite laminated structure and its sensibility to modal analysis procedure
Latin American Journal of Solids and Structures 11(2014) 245 - 259
flexural modes of vibration, on longitudinal and transverse axes, the Poisson's ratio depends on the tree well defined torsion-bending modes, and the Shear Modulus property is linked to the first mode shape, a torsion mode (Ayorinde and Yu, 2005; Lauwagie et al., 2010), that is well defined and of easy measurement and identification. It also seems to be less sensitive to transducer at-tachment problems. The added stiffness by the transducer is a plausible explanation for the ob-served difference, between the two methods, for Young's modulus and Poisson's ratio, but there was not a remarkable influence on the shearing module. This robustness of the Shear Modulus measurements may be an important aspect for choosing mechanical properties for monitoring production or, in some applications, the structural health of components. Although the great majority of the test specimens for elastic properties determina-tion are square or rectangular plates, there is no direct relation between properties and mode shapes. Mode shapes change according to width to length aspect ratios, fiber or principal axis orientation (Ayorinde and Yu, 2005; Lauwagie et al., 2008), experimental set-up and so on. So a complex structure must be carefully analyzed to take advantage of the best Mode Shapes for the desirable elastic properties. The inverse method using a FE model proved to be a powerful, fast and very flexible method of analysis. In both measurement methods, there are problems with the mass of the transducers and, in both cases, mass and rotational inertia had to be considered in FE model. The cost func-tion F, seems to be an indicator to assess the quality of the numerical approximation of the Pois-son's coefficient. Acknowledgements The authors gratefully acknowledge the support provided by the Fundação de Amparo a Pesquisa de Minas Gerais FAPEMIG. References
Arruda J.R.F., Rio S.A.V., and Santos L.A.S.B.( 1996). A space-frequency data compression method for spa-tially dense laser doppler vibrometer measurements. Journal of Shock and Vibration (Wiley), 3(2):127-133. Ayorinde E.O. and Yu L. (2005). On the elastic characterization of composite plates with vibration data. Journal of Sound and Vibration, 283(1):243-262. Avila, A.F., Duarte, H.V., and Soares, M.I. (2006a). The nanoclay influence on impact response of laminate plates. Latim American Journal of Solids and Structures, 3:3-20. Avila, A.F., Donadon, L. V. and Duarte, H.V. (2008). A modal analysis of nanoclay-epoxy-fiber glass compo-site. Composite and Structures, v. 83, p. 324-333. Batista, F.B. (2005). Identificação de parâmetros elásticos em placas finas de materiais compósitos. Master de-gree dissertation. Unicamp, Campinas, Brazil. Gagneja S., Gibson R.F., and Ayorinde E.O. (2001). Design of test specimens for the determination of elastic through-thickness shear properties of thick composites from measured modal vibration frequencies. Composites Science and Technology, 61(1):679-687 Haque A. and Shamsuzzoha M.(2003). S2-glass/epoxy polymer nanocomposites: manufacturing, structures, thermal and mechanical properties. Journal of Composite Materials, 37(20):1821-1837. Hu H. and Wang J. (2009). Damage detection of a woven fabric composite laminate using a modal strain en-ergy method. Engineering Structures, 31:1042_1055.

H. V. Duarte et al. / Mechanical properties of nanocomposite laminated structure and its sensibility to modal analysis procedure 259
Latin American Journal of Solids and Structures 11(2014) 245 - 259
Hwang S.F. and Chang C.S. (2000). Determination of elastic constants of materials by vibration testing. Com-posite Structures, 49:183-190. Hwang S.F., Wu J.C., and He R.S. (2009). Identification of effective elastic constants of composite plates based on a hybrid genetic algorithm. Composite Structures, 90:217-224. Isik I., Yilmazer U., and Bayram G. (2003). Impact modified epoxy/montmorillonite nanocomposites: synthe-sis and characterization. Polymer, 44(25):6371-6377. Lauwagie T., Lambrinou K., Patsias S., Haylen W., and J. V. (2008). Resonat-based identification of the pois-son's ratio of orthotropic materials. NDT&E International, 41(1):88-97. Lauwagie T., Lambrinou K., Sol H., and Haylen W. (2010). Resonat-based identification of the poisson's ratio of orthotropic materials. NDT&E International, 50(1):437-447. Lauwagie T., Sol H., Roebbsen G., Haylen W., Shi Y., and Biest O.V. (2003). Mixed numerical/experimental identi_cation of elastic properties of orthotropic metal plates. NDT&E International, 36(1):487-495. Yasmin A., Abot J., and Daniel I. (2003). Processing of clay-epoxy nanocomposites by shear mixing. Scripta Materialia, 49(1):81-86.