Embed Size (px)
Citation preview
1378
IntroductionTerrestrial animals that differ widely in mass, morphology
and lineage can show similar locomotor mechanics (Full,1989). For constant-average-speed terrestrial locomotion,animals resemble relatively simple ‘spring-loaded invertedpendulum’ (SLIP) systems (Cavagna et al., 1977; Farley et al.,1993). Using simple mathematical models such as the SLIPmodel to describe movement allows for design and function tobe understood in terms of overall mechanical task constraints(Full and Koditschek, 1999). For example, considering humanlegs as linear springs allowed the joints most responsible forleg stiffness to be identified (Farley and Morgenroth, 1999).
In contrast to constant-average-speed locomotion, themechanics of unsteady locomotion are poorly understood(Alexander, 2003; Dickinson et al., 2000; Greene, 1985).Greene and McMahon argued that leg force production limitshuman turning performance during maximum-effort curverunning. Based on the assumption that the ability to generateforce constrains turning performance, they presented a modelthat fits the observed relationship between maximum runningspeed and curve radius (Greene, 1985; Greene, 1987).Maximum speed decreases may primarily be due to limitationsof force generation capabilities of the inside leg (Chang et al.,2001; Rand and Ohtsuki, 2000). However, leg force production
does not appear to constrain performance for other animalssuch as greyhounds (Usherwood and Wilson, 2005).
By artificially increasing yaw inertia, body shape was shownto limit maximum turning performance (Carrier et al., 2001).Moreover, during sidestep (using the leg contralateral to theturn direction) and crossover (using the leg ipsilateral to theturn direction) cutting maneuvers, Jindrich et al. argued that forhumans, body shape constrains leg forces during sub-maximalspeed turns (Jindrich et al., 2006). Specifically, theyhypothesized that the braking forces observed during walkingand running turns are required to prevent over-rotation aboutthe vertical axis, and presented a simple algebraic modelcapable of predicting ground reaction forces in severalconditions. A variant of this model was also successful indescribing leg force directions used by cockroaches duringturning maneuvers (Jindrich and Full, 1999). However, humansare not ancestrally cursorial (Schmitt and Lemelin, 2002), andit is unclear whether the constraints on leg forces observed inhumans apply to other bipeds. Specifically, it is unclearwhether braking forces are required for bipeds of different bodyshape. Ostriches Struthio camelus Linnaeus are cursorialbipeds that depend on running to escape predation, and wouldbe expected to be highly maneuverable. Consequently,ostriches represent an ideal species with which to test this
We studied the strategies used by cursorial bipeds(ostriches) to maneuver during running. Eight ostricheswere induced to run along a trackway and execute turns.Ground reaction forces and three-dimensional kinematicsof the body and leg joints were simultaneously recorded,allowing calculation of joint angles and quasi-static netjoint torques. Sidesteps, where the leg on the outside of theturn changes the movement direction, and crossoversusing the inside leg, occurred with nearly equal frequency.Ostriches executed maneuvers using a simple controlstrategy that required minimal changes to leg kinematicsor net torque production at individual joints. Although
ostriches did use acceleration or braking forces to controlbody rotation, their morphology allowed for bothcrossovers and sidesteps to be accomplished with minimalnet acceleratory/braking force production. Moreover,body roll and ab/adduction of the leg shifted the footposition away from the turn direction, reducing theacceleratory/braking forces required to prevent under- orover-rotation and aligning the leg with the ground reactionforce.
Key words: sidestepping, cutting, maneuverability, stability,navigation, locomotion.
Summary
The Journal of Experimental Biology 210, 1378-1390Published by The Company of Biologists 2007doi:10.1242/jeb.001545
Mechanics of cutting maneuvers by ostriches (Struthio camelus)
Devin L. Jindrich1,*, Nicola C. Smith2, Karin Jespers2 and Alan M. Wilson2,3
1Department of Kinesiology, Physical Education Building East 107B, Arizona State University, Tempe AZ, 85287-0404, USA, 2Structure and Motion Laboratory, The Royal Veterinary College, Hawkshead Lane, North Mymms,
Hatfield, Hertfordshire, AL9 7TA, UK and 3Structure and Motion Laboratory, Institute of Orthopaedics andMusculoskeletal Sciences, University College London, Royal National Orthopedic Hospital, Brockley Hill, Stanmore,
Middlesex, HA7 4LP, UK*Author for correspondence (e-mail: [email protected])
Accepted 6 February 2007
THE JOURNAL OF EXPERIMENTAL BIOLOGY
1379Ostrich maneuvering
question and better understand the mechanics of high-performance bipedal maneuverability.
Ostriches could use several possible strategies for achievingthe mechanical requirements of changing the movementdirection of the center of mass (COM) (deflection) and rotatingthe body (rotation) during running turns. For example, in turnsthat take place over multiple strides, cockroaches deflect androtate in the same stride with body rotation slightly laggingdeflection, whereas mice show the opposite pattern where bodyorientation changes lead deflection (Jindrich and Full, 1999;Walter, 2003). The pattern in mice was attributed to a divisionof labor where front legs are primarily responsible for rotationand hindlegs responsible for deflection, which also takesadvantage of the lower rotational inertia of the body at forelimb-to-hindlimb step transitions. Similar differences among limbgirdles are observed in some primate species (Demes et al.,2006). Other such divisions of labor, such as preferentially usingone leg to turn, are also possible. For example, bipeds couldpreferentially use sidesteps or crossover cuts.
In addition to the potential for different behavioralmaneuvering strategies there are also many potential motorstrategies that could be employed. Maneuvers could result fromsubstantial changes in muscle force and joint torque at one orfew joints, or alternatively from strategies that involvemodulation and coordination of torque production at manyjoints. During smooth curve walking, for example, humans turnby modulating coordination patterns observed during straightwalking (Courtine and Schieppati, 2004).
The goals of this study were to understand the behavioraland control strategies used by ostriches to turn within thecontext of the mechanical constraints on legged maneuvers. Tothis end, we tested the following hypotheses: (1) duringanticipated turns, ostriches deflect the trajectory of their COMand rotate their body in the same step; (2) similar to humans,ostriches modulate body rotation during running turns bygenerating braking forces; (3) turning requires substantialmodulation of joint kinematics and torque production for allleg degrees of freedom.
To test these hypotheses, we measured ground reactionforces and joint kinematics while ostriches executed runningturns. We measured acceleration/braking forces and comparedthem to the predictions of a simple turning model to evaluatewhether ostriches use these forces to prevent under- or over-rotation as humans do (Jindrich et al., 2006). To evaluate thecontrol strategies employed, we used a quasi-static method toestimate net joint torques during turning and compared them tostraight running trials.
Materials and methodsEight juvenile ostriches Struthio camelus L. (mass=22±5·kg,
mean ± s.d., range 16–30·kg) were used in the study. Theanimals were hand-reared from the age of 1 week, and alltreatment and experimental procedures were approved by theanimal care and use committee at the Royal Veterinary College.
The ostriches were trained to run along a 23·m rubber
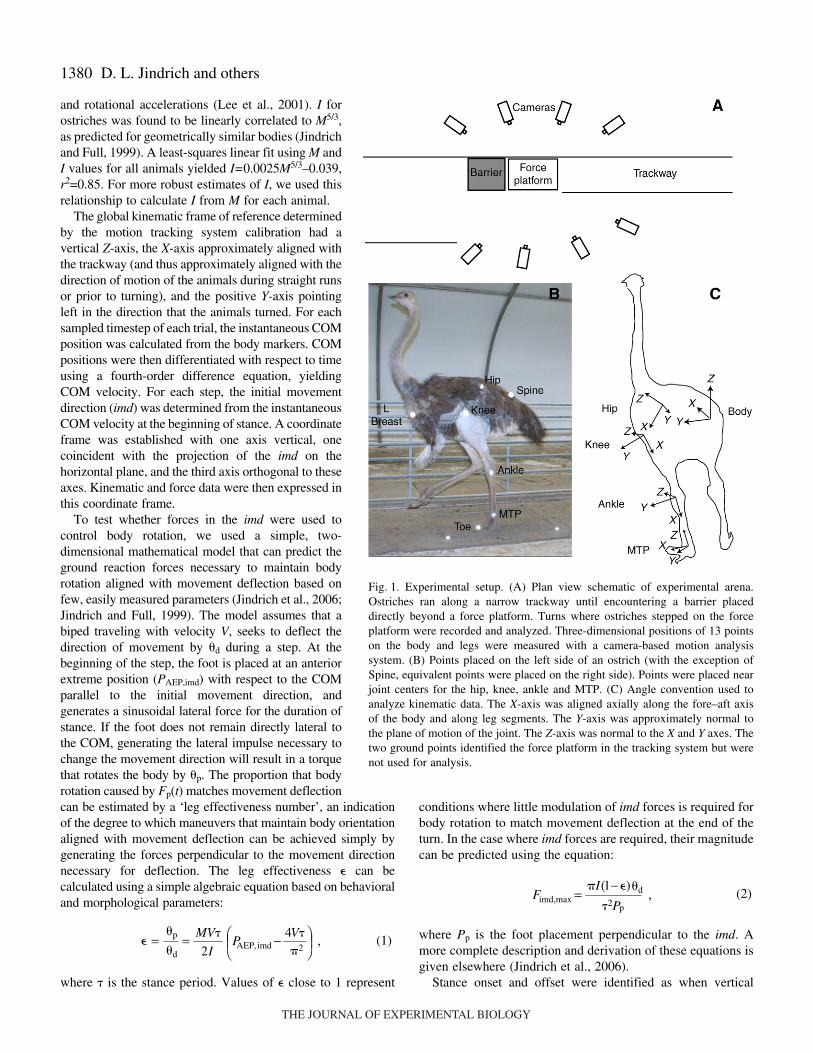
trackway with a force platform (model 9287BA, KistlerInstrumente AG, Winterthur, Switzerland) embedded mid-wayalong the length. Metal fencing constrained the runningdirection to an approximately 1·m corridor, and preventedturning before the force platform. To elicit turning maneuvers,the area enclosed by the metal fencing immediately around theforce platform was enlarged, and a large (approximately 1·m3)cardboard box placed on the trackway behind the platform(Fig.·1A). When confronted with the box, the ostriches executedeither sidestep or crossover cuts to the left, which were followedby immediate turns to the right (not analyzed) as the animalscontinued running around the box. Trials where at least one footwas entirely in contact with the force platform during the stanceperiod were selected for analysis. Following the turning trials,the box barrier was removed, and all animals were induced torun down the same trackway, but not to turn. Depending onwhether the ostrich contacted the force platform with the left orright leg, and whether the animal executed a straight run or turn,we grouped trials under four conditions: straight running withthe left (SL) and right (SR) legs, crossover turns with the leftleg (TL), and sidestep turns with the right leg (TR).
The three-dimensional positions of 13 retroreflectivemarkers attached to the body were measured at 240·Hz usingan eight-camera motion tracking system (ProReflex MotionCapture, Qualysis, Inc., Gothenburg, Sweden). Five markerswere attached to the body, one above the sacral spine, two onthe left and right breast, respectively, and two lateral to eachhip joint center (Fig.·1B). For the body markers, small areas offeathers were cut away and the markers attached to the skin,improving marker placement consistency from day to day. Fouradditional markers were placed on each leg lateral to the knee,ankle and metatarsal-phalangeal (MTP) joints, and one markerwas placed on the dorsal skin above the distal interphalangealjoint of the first phalanx (Toe). Kinematic data from body andjoint markers were filtered using a fourth-order low-passButterworth filter with a cut-off frequency of 20·Hz.
A coordinate frame for the body was established using thefive fixed points on the body: the spine, hip and breast points.During some periods of some trials, one or more body pointswould become obscured from enough camera views to preventtracking. As long as three of the five body points were tracked,the positions of the remaining missing points werereconstructed based on the three or more visible points andspatial relationships among the body points established duringperiods when at least four points (the three tracked points andthe missing points) were simultaneously visible.
The position of the COM relative to the body points wasestablished for each animal by measuring center of pressure(COP) location when the animal was standing quietly on theforce platform, and using the method of zero crossing (Lafondet al., 2004; Zatsiorsky and King, 1998). Given the COMlocation, the moment of inertia (I) of the animals about thevertical axis could be determined by enticing the animals toexecute a nearly stationary turn on the force platform, trackingthe COM motion and body rotation, and solving for I using theequations of motion for a rigid body, the known mass (M), linear
THE JOURNAL OF EXPERIMENTAL BIOLOGY
1380
and rotational accelerations (Lee et al., 2001). I forostriches was found to be linearly correlated to M5/3,as predicted for geometrically similar bodies (Jindrichand Full, 1999). A least-squares linear fit using M andI values for all animals yielded I=0.0025M5/3–0.039,r2=0.85. For more robust estimates of I, we used thisrelationship to calculate I from M for each animal.
The global kinematic frame of reference determinedby the motion tracking system calibration had avertical Z-axis, the X-axis approximately aligned withthe trackway (and thus approximately aligned with thedirection of motion of the animals during straight runsor prior to turning), and the positive Y-axis pointingleft in the direction that the animals turned. For eachsampled timestep of each trial, the instantaneous COMposition was calculated from the body markers. COMpositions were then differentiated with respect to timeusing a fourth-order difference equation, yieldingCOM velocity. For each step, the initial movementdirection (imd) was determined from the instantaneousCOM velocity at the beginning of stance. A coordinateframe was established with one axis vertical, onecoincident with the projection of the imd on thehorizontal plane, and the third axis orthogonal to theseaxes. Kinematic and force data were then expressed inthis coordinate frame.
To test whether forces in the imd were used tocontrol body rotation, we used a simple, two-dimensional mathematical model that can predict theground reaction forces necessary to maintain bodyrotation aligned with movement deflection based onfew, easily measured parameters (Jindrich et al., 2006;Jindrich and Full, 1999). The model assumes that abiped traveling with velocity V, seeks to deflect thedirection of movement by �d during a step. At thebeginning of the step, the foot is placed at an anteriorextreme position (PAEP,imd) with respect to the COMparallel to the initial movement direction, andgenerates a sinusoidal lateral force for the duration ofstance. If the foot does not remain directly lateral tothe COM, generating the lateral impulse necessary tochange the movement direction will result in a torquethat rotates the body by �p. The proportion that bodyrotation caused by Fp(t) matches movement deflectioncan be estimated by a ‘leg effectiveness number’, an indicationof the degree to which maneuvers that maintain body orientationaligned with movement deflection can be achieved simply bygenerating the forces perpendicular to the movement directionnecessary for deflection. The leg effectiveness � can becalculated using a simple algebraic equation based on behavioraland morphological parameters:
where � is the stance period. Values of � close to 1 represent
(1)
⎟⎠⎞⎜
⎝⎛ −= ,=
�2,4
2
V�P
I
MV�imdAEP�d
�p�
D. L. Jindrich and others
conditions where little modulation of imd forces is required forbody rotation to match movement deflection at the end of theturn. In the case where imd forces are required, their magnitudecan be predicted using the equation:
where Pp is the foot placement perpendicular to the imd. Amore complete description and derivation of these equations isgiven elsewhere (Jindrich et al., 2006).
Stance onset and offset were identified as when vertical
(2)�d(
imd,max�2P
�IF
1 �)−= ,
p
Fig.·1. Experimental setup. (A) Plan view schematic of experimental arena.Ostriches ran along a narrow trackway until encountering a barrier placeddirectly beyond a force platform. Turns where ostriches stepped on the forceplatform were recorded and analyzed. Three-dimensional positions of 13 pointson the body and legs were measured with a camera-based motion analysissystem. (B) Points placed on the left side of an ostrich (with the exception ofSpine, equivalent points were placed on the right side). Points were placed nearjoint centers for the hip, knee, ankle and MTP. (C) Angle convention used toanalyze kinematic data. The X-axis was aligned axially along the fore–aft axisof the body and along leg segments. The Y-axis was approximately normal tothe plane of motion of the joint. The Z-axis was normal to the X and Y axes. Thetwo ground points identified the force platform in the tracking system but werenot used for analysis.
THE JOURNAL OF EXPERIMENTAL BIOLOGY
1381Ostrich maneuvering
forces (Fv) exceeded or dropped below 5% of the maximumforces of the trial, respectively. For some steps (typically thesecond step of a trial), the foot only partially contacted the forceplatform. Consequently, if the maximum Fv of an identifiedstance period did not exceed 75% of the maximum Fv for theentire trial, the step was discarded. In addition, some stepsshowed a ‘toe’ region where low forces were maintained, andthe maximum Fv did not occur at mid-stance. Consequently, forcalculating � and PAEP,imd for Eqn·1 and Eqn·2, stance onset andoffset were normalized to center the maximum Fv at mid-stride.On average, � decreased by 3% and PAEP,imd decreased by 6%.
To characterize the motions of the body and legs, we assumedthat the body had 6 degrees of freedom (d.f.) and that the legscould be characterized using five primary rotational d.f. Motionsof the body relative to the global coordinate system weredescribed using Euler angles in the order Z-X-Y. Rotation aboutZ (yaw) and Y (pitch) were calculated from the vectors connectingthe spine and mid-breast and mid-hip points, respectively.Rotation about X (roll) was calculated from the hip points.
We modeled the legs as a chain of rigid segments using thepoints placed over the joint centers. The orientation of the firstsegment (the femur) was expressed relative to the body usingEuler angles in the order Y then Z, to align the X-axis along thelong axis of the femur. The Y angle corresponds to flexion/extension, and the Z angle approximates ab/adduction of the hipjoint relative to the body, although the correspondence between
Euler angles and common clinical definitions of rotations is notexact (Wu et al., 2002; Wu et al., 2005). Each successivesegment was related to the proximal segment using Euler anglesin the order Z then Y. Z-rotation approximates ab/adduction ofthe distal segment, and Y-rotations approximateflexion–extension of the joint (Fig.·1C). These calculations donot account for potential axial rotations about segmental X-axes.
Forces and moments were transformed into the kinematiccoordinate system using an empirical calibration derived frommeasurements of COP location in the force platform coordinateframe [corrected according to the method described elsewhere(Bobbert and Schamhardt, 1990)], using a known weight withposition measured using the motion tracking system. The freemoment was calculated using the forces and moments measuredby the force platform (Holden and Cavanagh, 1991). Due to theinability to fully account for axial (X) rotations using the markerset employed, complete inverse-dynamics calculations of jointtorques were not possible. Consequently, quasi-static jointtorques (that do not account for segmental inertias) werecalculated from the endpoint forces and moments and legconfiguration angles using an iterative Newton–Euler algorithm(Craig, 1989). Quasi-static torques for each joint were expressedin the coordinate system of the distal segment of the joint(McLean et al., 2005): Ty represents flexion/extension torque,Tz varus/valgus torque, and Tx rotational torque about thesegment axis. Torque impulse for each d.f. was calculated by
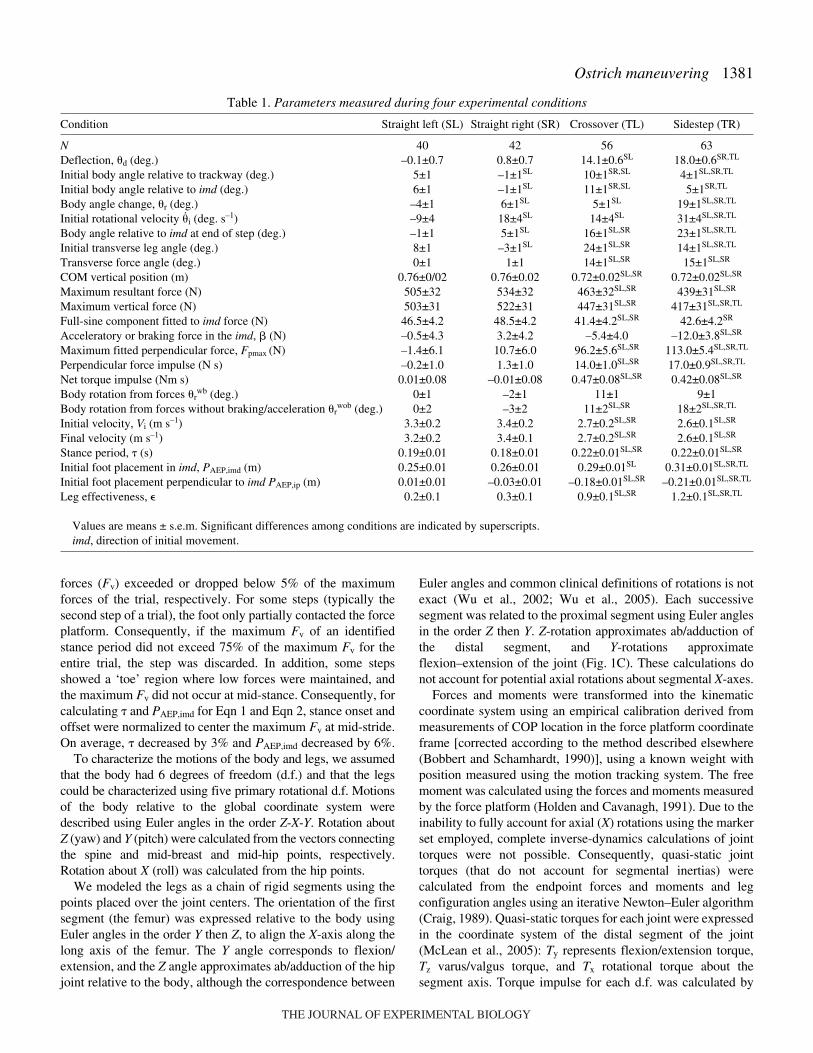
Table·1. Parameters measured during four experimental conditions
Condition Straight left (SL) Straight right (SR) Crossover (TL) Sidestep (TR)
N 40 42 56 63Deflection, �d (deg.) –0.1±0.7 0.8±0.7 14.1±0.6SL 18.0±0.6SR,TL
Initial body angle relative to trackway (deg.) 5±1 –1±1SL 10±1SR,SL 4±1SL,SR,TL
Initial body angle relative to imd (deg.) 6±1 –1±1SL 11±1SR,SL 5±1SR,TL
Body angle change, �r (deg.) –4±1 6±1SL 5±1SL 19±1SL,SR,TL
Initial rotational velocity �i (deg.·s–1) –9±4 18±4SL 14±4SL 31±4SL,SR,TL
Body angle relative to imd at end of step (deg.) –1±1 5±1SL 16±1SL,SR 23±1SL,SR,TL
Initial transverse leg angle (deg.) 8±1 –3±1SL 24±1SL,SR 14±1SL,SR,TL
Transverse force angle (deg.) 0±1 1±1 14±1SL,SR 15±1SL,SR
COM vertical position (m) 0.76±0/02 0.76±0.02 0.72±0.02SL,SR 0.72±0.02SL,SR
Maximum resultant force (N) 505±32 534±32 463±32SL,SR 439±31SL,SR
Maximum vertical force (N) 503±31 522±31 447±31SL,SR 417±31SL,SR,TL
Full-sine component fitted to imd force (N) 46.5±4.2 48.5±4.2 41.4±4.2SL,SR 42.6±4.2SR
Acceleratory or braking force in the imd, � (N) –0.5±4.3 3.2±4.2 –5.4±4.0 –12.0±3.8SL,SR
Maximum fitted perpendicular force, Fpmax (N) –1.4±6.1 10.7±6.0 96.2±5.6SL,SR 113.0±5.4SL,SR,TL
Perpendicular force impulse (N·s) –0.2±1.0 1.3±1.0 14.0±1.0SL,SR 17.0±0.9SL,SR,TL
Net torque impulse (Nm·s) 0.01±0.08 –0.01±0.08 0.47±0.08SL,SR 0.42±0.08SL,SR
Body rotation from forces �rwb (deg.) 0±1 –2±1 11±1 9±1
Body rotation from forces without braking/acceleration �rwob (deg.) 0±2 –3±2 11±2SL,SR 18±2SL,SR,TL
Initial velocity, Vi (m·s–1) 3.3±0.2 3.4±0.2 2.7±0.2SL,SR 2.6±0.1SL,SR
Final velocity (m·s–1) 3.2±0.2 3.4±0.1 2.7±0.2SL,SR 2.6±0.1SL,SR
Stance period, � (s) 0.19±0.01 0.18±0.01 0.22±0.01SL,SR 0.22±0.01SL,SR
Initial foot placement in imd, PAEP,imd (m) 0.25±0.01 0.26±0.01 0.29±0.01SL 0.31±0.01SL,SR,TL
Initial foot placement perpendicular to imd PAEP,ip (m) 0.01±0.01 –0.03±0.01 –0.18±0.01SL,SR –0.21±0.01SL,SR,TL
Leg effectiveness, � 0.2±0.1 0.3±0.1 0.9±0.1SL,SR 1.2±0.1SL,SR,TL
Values are means ± s.e.m. Significant differences among conditions are indicated by superscripts.imd, direction of initial movement.
THE JOURNAL OF EXPERIMENTAL BIOLOGY
1382 D. L. Jindrich and others
integrating torque with respect to time. All calculations wereperformed using custom analysis routines written in MATLAB(The Math Works, Inc., Natick, MA, USA).
To compare kinematic, force and torque data amongdifferent trials, data were linearly rescaled to phase of stance,with a resolution of 0.1%, resulting in time series of 1000points. Scaled force, angle and torque time series from left andright legs during straight steps were averaged to yield referencetrajectories for each parameter, degree of freedom, and leg. Tostatistically compare kinematic time series, the referencetrajectories for straight-running trials for each leg weresubtracted from the data for each trial corresponding to thesame leg, yielding a set of differences from the referencetrajectory for each trial. The L-2 norm of the differences wascalculated to yield a single ‘error’ value for each kinematicparameter and trial (Jindrich and Full, 1999).
We statistically compared measured parameters usingrepeated-measures ANOVA, with animal as the repeatedmeasure and maneuver type (SL, SR, TL and TR) as the maineffect. Reported means and standard errors (s.e.m.) representleast-squares means from the ANOVA model. We used theJMP 4.0 (SAS Institute, Inc., Cary, NC, USA) softwarepackage for statistical calculations.
ResultsOstriches did not execute sidestep or crossover cuts with
frequencies significantly different from 50% (�2 test; P>0.5),and the observed body anglechanges were not significantlydifferent between sidesteps andcrossover cuts (Table·1).However, ostriches showedsignificantly greater movementdeflection for sidestep cutsrelative to crossovers. Themovement deflections of 14°and 18° corresponded to turningradii of 2.4·m for crossovers and1.8·m for sidesteps,respectively.
0 10 20 30 40 50 60 70 80 90 100
Proportion of stance period (%)
–5
0
5
10
15
20
25–5
0
5
10
15
20
25M
ovem
ent d
irect
ion
(deg
.)B
ody
angl
e (d
eg.)
TL
SL
TR
SR
TL
SL
TR
SR
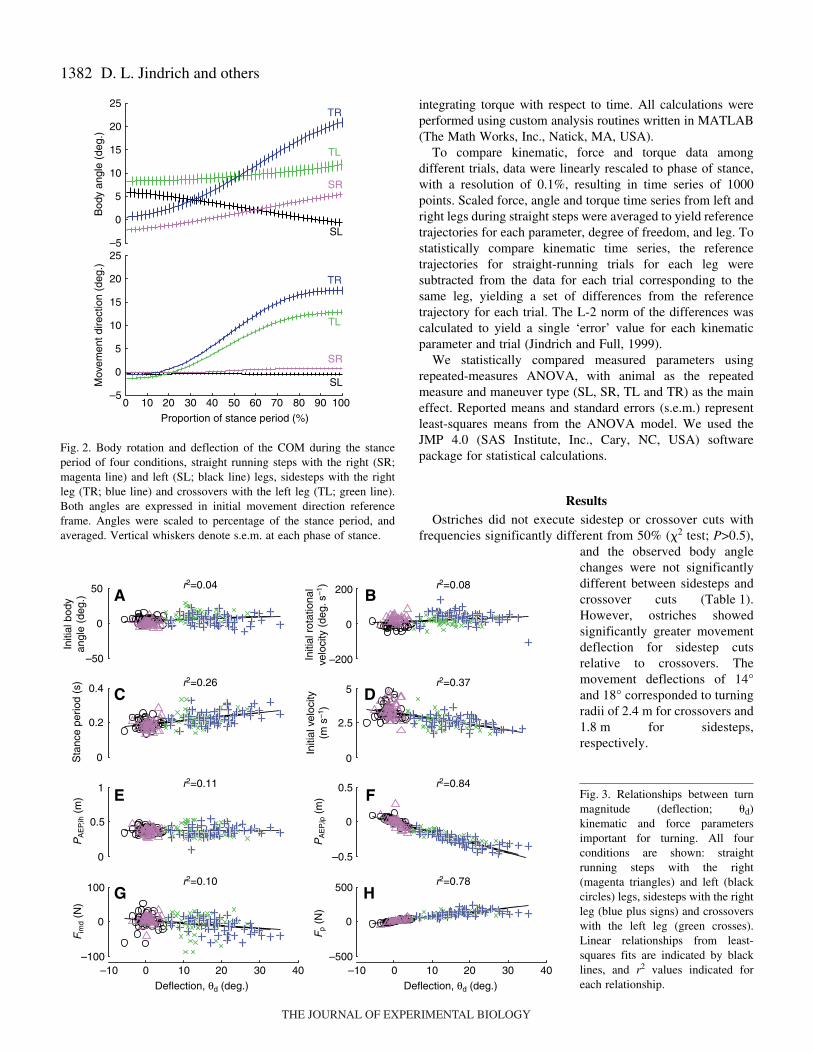
Fig.·2. Body rotation and deflection of the COM during the stanceperiod of four conditions, straight running steps with the right (SR;magenta line) and left (SL; black line) legs, sidesteps with the rightleg (TR; blue line) and crossovers with the left leg (TL; green line).Both angles are expressed in initial movement direction referenceframe. Angles were scaled to percentage of the stance period, andaveraged. Vertical whiskers denote s.e.m. at each phase of stance.
–50
0
50
–200
0
200
0
0.2
0.4
0
0.5
1
–0.5
0
0.5
–10 0 10 20 30 40–100
0
100
Deflection, θd (deg.)
–10 0 10 20 30 40–500
0
500
Deflection, θd (deg.)
0
5
2.5
r2=0.04 r2=0.08
r2=0.26 r2=0.37
r2=0.11 r2=0.84
r2=0.10 r2=0.78
Initi
al r
otat
iona
lve
loci
ty (
deg.
s–1
)In
itial
vel
ocity
(m s
–1)
PA
EP,
ip (
m)
Fp
(N)
Initi
al b
ody
angl
e (d
eg.)
Sta
nce
perio
d (s
)P
AE
P,ih (
m)
Fim
d (N
)
A B
C D
E F
G H
Fig.·3. Relationships between turnmagnitude (deflection; �d)kinematic and force parametersimportant for turning. All fourconditions are shown: straightrunning steps with the right(magenta triangles) and left (blackcircles) legs, sidesteps with the rightleg (blue plus signs) and crossoverswith the left leg (green crosses).Linear relationships from least-squares fits are indicated by blacklines, and r2 values indicated foreach relationship.
THE JOURNAL OF EXPERIMENTAL BIOLOGY
1383Ostrich maneuvering
During sidesteps, ostriches deflect the trajectory of their COMand rotate their body in the same step. Ostriches overcome
normal body rotation during crossovers
Ostriches anticipated turns with changes in body orientationand rotational velocity. Initial body angles relative to thetrackway and imd for sidesteps were significantly differentfrom both straight runs with the same leg and crossover cuts(Table·1). However, these differences in body orientation weresmall relative to the changes in body angle achieved during thesubsequent step. The initial body angle before sidesteps was 6°higher than for straight steps of the same leg, compared to
changes in body angle of almost 20° for sidesteps. Over 90%of the body rotation during sidesteps occurred during stepswhere movement direction was deflected. Sidesteps thereforeinvolved simultaneous changes in movement direction andbody orientation.
Crossover cuts, however, showed less absolute body rotation,and rotation was not closely associated with movementdeflection (Fig.·2). Rotation during crossover steps onlyaccounted for one-third of the total body rotation, with increasedinitial body rotation accounting for the remainder. However,relative to straight running steps with the same leg ostriches
Sid
e vi
ew
Fron
t vie
w
Straight run
Crossover
Sidestep
Top
view
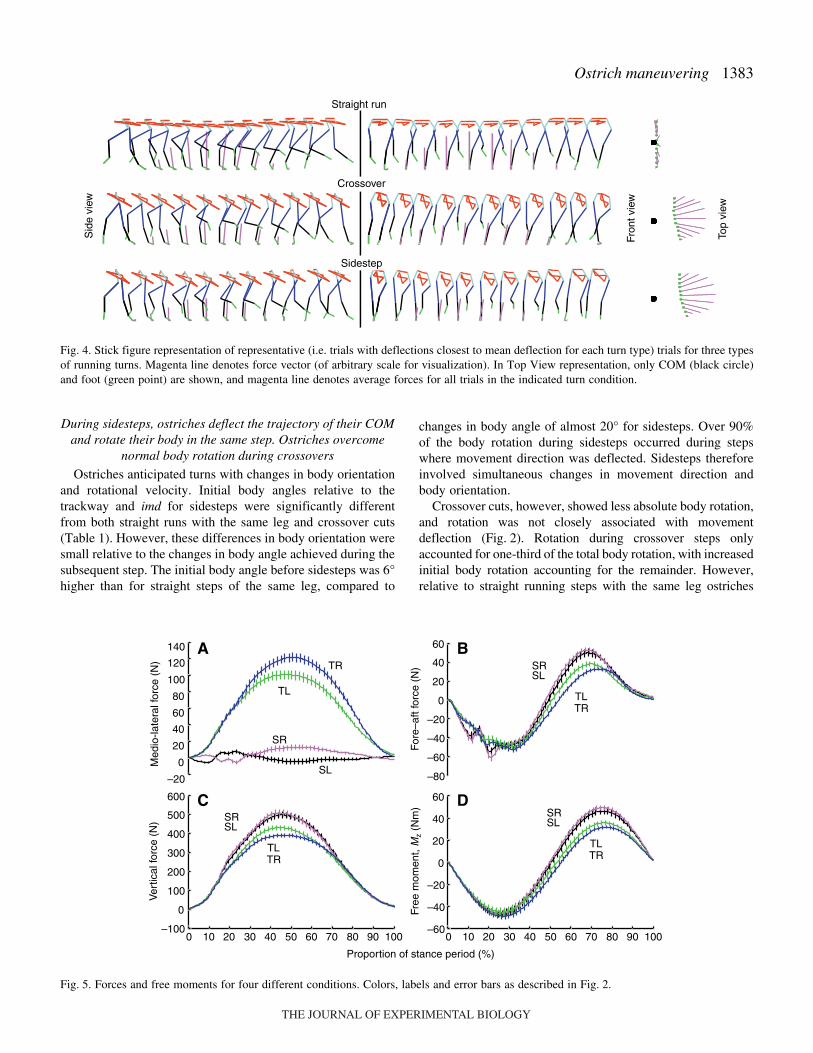
Fig.·4. Stick figure representation of representative (i.e. trials with deflections closest to mean deflection for each turn type) trials for three typesof running turns. Magenta line denotes force vector (of arbitrary scale for visualization). In Top View representation, only COM (black circle)and foot (green point) are shown, and magenta line denotes average forces for all trials in the indicated turn condition.
0 10 20 30 40 50 60 70 80 90 100 0 10 20 30 40 50 60 70 80 90 100
–80
–60
–40
–20
0
20
40
60
–100
0
100
200
300
400
500
600
–20
0
20
40
60
80
100
120
140
–60
–40
–20
0
20
40
60
TL
SL
TR
SR
Proportion of stance period (%)
TL
SL
TR
SR
TL
SL
TR
SR
TL
SL
TR
SR
Free
mom
ent,
Mz
(Nm
)F
ore–
aft f
orce
(N
)
Med
io-la
tera
l for
ce (
N)
Ver
tical
forc
e (N
)
A B
C D
Fig.·5. Forces and free moments for four different conditions. Colors, labels and error bars as described in Fig.·2.
THE JOURNAL OF EXPERIMENTAL BIOLOGY
1384
showed comparable anticipation of turns: 6° and 5° increases inbody angle and 13°s–1 and 23°s–1 in rotational velocity forsidesteps and crossovers, respectively. Consequently, theincreased initial body rotation observed during crossovers waslargely due to the body orientation during steps of the left leg.Although the body orientation changes during crossovers wereless pronounced ostriches simultaneously deflected the bodyand overcame changes on body orientation that normally occurduring steps with the ipsilateral leg.
D. L. Jindrich and others
Turning involved minor changes to kinematics and forces, butfew parameters were strongly correlated with turn magnitude
Turn magnitude was associated with lateral shifts in legplacement, but other kinematic parameters did not show strongrelationships with turn magnitude, despite significant overallchanges for turning trials. Turn magnitude, as indicated by themovement deflection (�d) during the final turning step showedweak associations with both initial body angle �i and initialbody rotational velocity �i, as indicated by correlationcoefficients (r2) of less than 0.1 (Fig.·3A,B). Stance periods (�)were 15–20% longer and initial velocity (Vi) 20–25% lowerduring both sidesteps and crossover cuts, but neither showedstrong correlations to �d (Table·1; Fig.·3C,D). Anterior extremefoot placement in the movement direction (PAEP,imd) showed asignificant increase only for sidesteps, but also showed weakcorrelations with �d (Fig.·3E). In contrast, sidesteps and
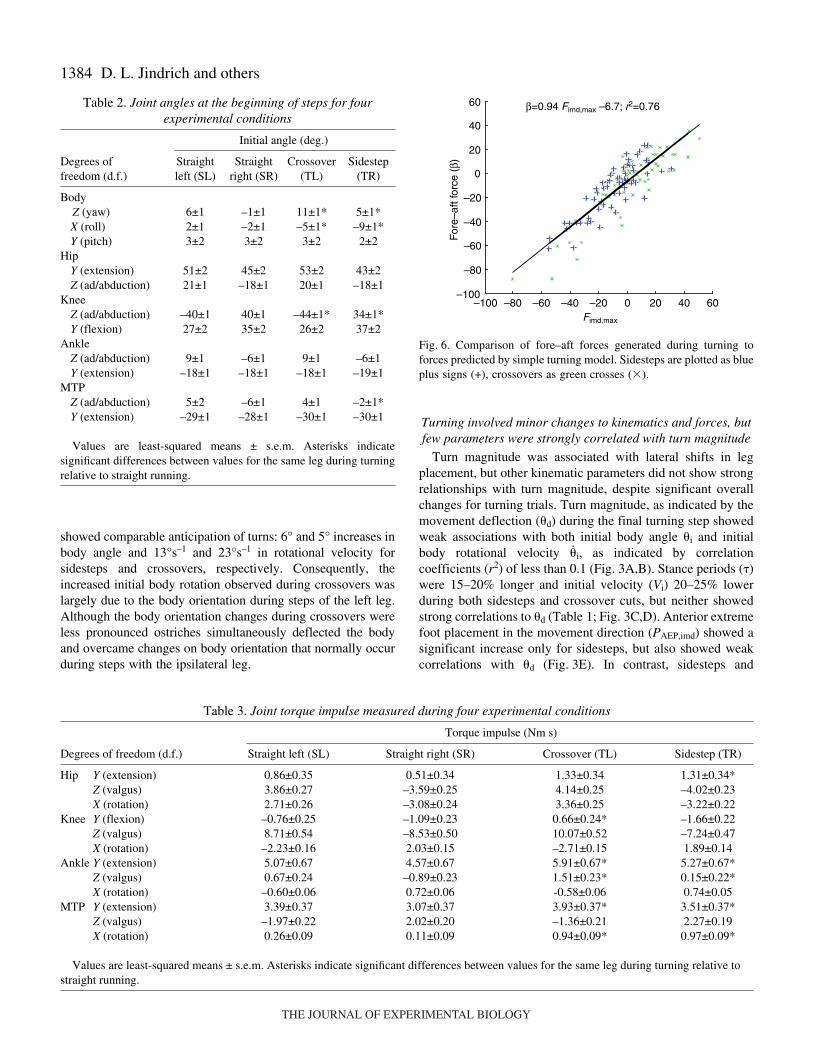
Table·2. Joint angles at the beginning of steps for fourexperimental conditions
Initial angle (deg.)
Degrees of Straight Straight Crossover Sidestepfreedom (d.f.) left (SL) right (SR) (TL) (TR)
BodyZ (yaw) 6±1 –1±1 11±1* 5±1*X (roll) 2±1 –2±1 –5±1* –9±1*Y (pitch) 3±2 3±2 3±2 2±2
HipY (extension) 51±2 45±2 53±2 43±2Z (ad/abduction) 21±1 –18±1 20±1 –18±1
KneeZ (ad/abduction) –40±1 40±1 –44±1* 34±1*Y (flexion) 27±2 35±2 26±2 37±2
AnkleZ (ad/abduction) 9±1 –6±1 9±1 –6±1Y (extension) –18±1 –18±1 –18±1 –19±1
MTPZ (ad/abduction) 5±2 –6±1 4±1 –2±1*Y (extension) –29±1 –28±1 –30±1 –30±1
Values are least-squared means ± s.e.m. Asterisks indicatesignificant differences between values for the same leg during turningrelative to straight running.
Table·3. Joint torque impulse measured during four experimental conditions
Torque impulse (Nm·s)
Degrees of freedom (d.f.) Straight left (SL) Straight right (SR) Crossover (TL) Sidestep (TR)
Hip Y (extension) 0.86±0.35 0.51±0.34 1.33±0.34 1.31±0.34*Z (valgus) 3.86±0.27 –3.59±0.25 4.14±0.25 –4.02±0.23X (rotation) 2.71±0.26 –3.08±0.24 3.36±0.25 –3.22±0.22
Knee Y (flexion) –0.76±0.25 –1.09±0.23 0.66±0.24* –1.66±0.22Z (valgus) 8.71±0.54 –8.53±0.50 10.07±0.52 –7.24±0.47X (rotation) –2.23±0.16 2.03±0.15 –2.71±0.15 1.89±0.14
Ankle Y (extension) 5.07±0.67 4.57±0.67 5.91±0.67* 5.27±0.67*Z (valgus) 0.67±0.24 –0.89±0.23 1.51±0.23* 0.15±0.22*X (rotation) –0.60±0.06 0.72±0.06 -0.58±0.06 0.74±0.05
MTP Y (extension) 3.39±0.37 3.07±0.37 3.93±0.37* 3.51±0.37*Z (valgus) –1.97±0.22 2.02±0.20 –1.36±0.21 2.27±0.19X (rotation) 0.26±0.09 0.11±0.09 0.94±0.09* 0.97±0.09*
Values are least-squared means ± s.e.m. Asterisks indicate significant differences between values for the same leg during turning relative tostraight running.
–100 –80 –60 –40 –20 0 20 40 60–100
–80
–60
–40
–20
0
20
40
60
Fimd,max
For
e–af
t for
ce (
β)
β=0.94 Fimd,max –6.7; r2=0.76
Fig.·6. Comparison of fore–aft forces generated during turning toforces predicted by simple turning model. Sidesteps are plotted as blueplus signs (+), crossovers as green crosses (�).
THE JOURNAL OF EXPERIMENTAL BIOLOGY
1385Ostrich maneuvering
crossover cuts both showed significant lateral and medialshifts, respectively, in foot placement perpendicular to the imd(Ppi) relative to straight runs (Table·1), and Ppi also showed aclose correlation with �d (Fig.·3F).
Both sidesteps and crossover cuts require substantialincreases in forces perpendicular to the initial movementdirection (Fp; Fig.·4B, Fig.·5A). Turning involved 10- to nearly100-fold increases in maximum force in the horizontal planeperpendicular to imd (Fpmax) and perpendicular force impulserelative to straight running, and 50-fold increases in net torqueimpulse about the COM (Table·1). Relative to Fp and net torqueimpulses, changes to vertical forces and free moment about thevertical axis (FMz) were modest (Fig.·4A, Fig.·5B–D).Differences in FMz that could contribute to modulating bodyrotation were also small: body rotation due to FMz was0.2±0.4° for sidesteps and 1.7±0.4° for crossovers.
Acceleratory or braking forces control body rotation duringrunning turns
Although the group differences in acceleratory/brakingforces in the imd among maneuver types were small, ostrichesdid use forces in the imd to control body rotation duringturning. Only sidestep cuts showed significant differences inacceleratory/braking forces (�) relative to straight-running
steps with the same leg (Table·1). Expected rotations withoutacceleratory/braking forces (�r
wob) for sidesteps were twice thebody rotation due to total forces (�r
wb). Crossover cuts did notshow significant differences in average � relative to straightruns, and body rotations of 11° without braking forces were notdifferent from the body rotation due to total forces.
Ostriches had average leg ‘effectiveness’ of 0.9 and 1.2 forcrossovers and sidesteps, respectively (Table·1), indicating thaton average the forces required for movement deflection shouldgenerate appropriate body rotations during turning. However,using Eqn·1 and Eqn·2 to predict the braking forces necessaryto prevent over-rotation yielded a strong positive correlation(Fig.·6). The simple turning model based on the assumptionthat forces in the imd are used to modulate body rotation couldexplain over 70% of the variance in imd force used duringsidesteps and crossover cuts, supporting the hypothesis that forindividual trials, braking forces did prevent under- or over-rotation during running turns. The slope of 0.94 was onlyslightly below the expected slope of 1 for an isometricrelationship. Ostriches generated net braking forces during52% of all trials and 60% of turning trials. That acceleratoryforces were present in 40% of the turning trials is consistentwith the hypothesis that ostriches used either braking oracceleratory forces to modulate body rotation when necessary.
0 10 20 30 40 50 60 70 80 90 100 0 10 20 30 40 50 60 70 80 90 100 0 10 20 30 40 50 60 70 80 90 100
–5
0
5
10
15
20
25
40
45
50
55
60
65
70
75
20
30
40
50
60
70
80
–12–10–8–6–4–2024
–25–20–15–10–505
10152025
–30–28–26–24–22–20–18–16–14–12
–1
0
1
2
3
4
5
6
–60
–50
–40
–30
–20
–10
0
Body Z (Yaw) Body Y (Pitch)Body X (Roll)
Hip Y (extension) Hip Z (ab/adduction)
Knee Y (flexion) Ankle Y (extension)
Proportion of stance period (%)
MTP Y (extension)
A B C
D E
F G H
TL*
SL
TR*
SRTL*
SL
TR*
SR
TL
SL
TRSR
SL
TRSR
TL*SL
TR*SR
TLSL
TR*SR
TL*SL
TR*
SR
Ang
le (
deg.
) TL*
TL*SL
TR*SR
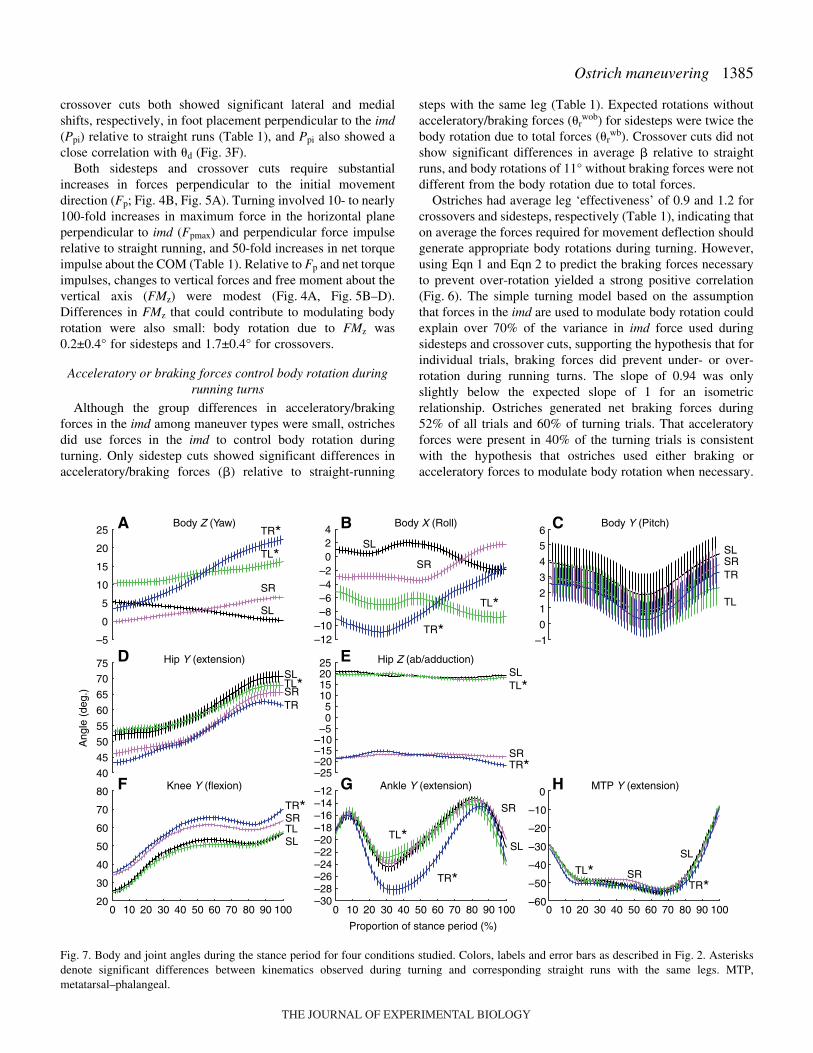
Fig.·7. Body and joint angles during the stance period for four conditions studied. Colors, labels and error bars as described in Fig.·2. Asterisksdenote significant differences between kinematics observed during turning and corresponding straight runs with the same legs. MTP,metatarsal–phalangeal.
THE JOURNAL OF EXPERIMENTAL BIOLOGY
1386
Turning did not require substantial modulation of jointkinematics and torque production
In addition to changes in initial body yaw, ostriches initiatedturning steps with significant changes to body roll (Table·2).These changes in roll diminished over the stance period ofturning steps for sidesteps, but persisted for crossover cuts(Fig.·7C). However, few changes in initial joint kinematicswere observed. The only significant differences in initial jointangles were in knee and MTP Z, representing increasedadduction at the knee and decreased adduction at the MTP(Table·2).
Significant changes in joint kinematics over the course ofturning steps were evident in many joint d.f.s (Fig.·7).However, most of these significant differences were due to
D. L. Jindrich and others
increased variability in joint angle trajectories during turningtrials. Substantial offsets in joint angle trajectory were onlyevident in ankle extension during sidesteps.
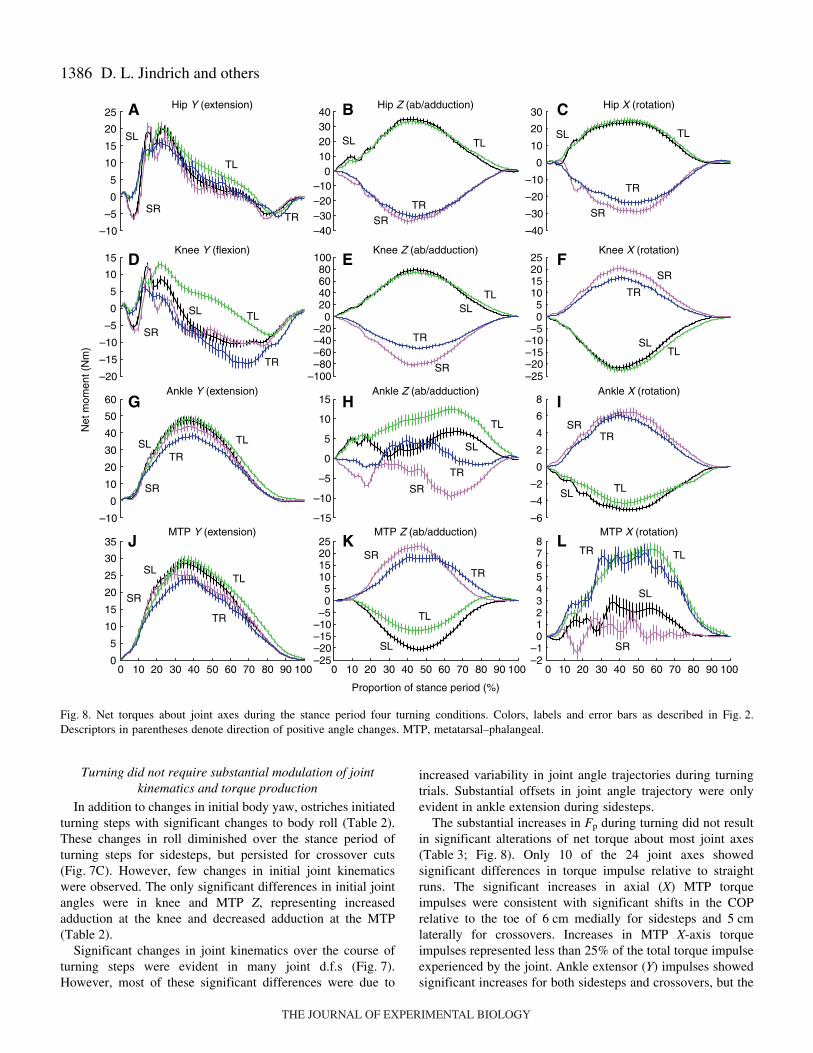
The substantial increases in Fp during turning did not resultin significant alterations of net torque about most joint axes(Table·3; Fig.·8). Only 10 of the 24 joint axes showedsignificant differences in torque impulse relative to straightruns. The significant increases in axial (X) MTP torqueimpulses were consistent with significant shifts in the COPrelative to the toe of 6·cm medially for sidesteps and 5·cmlaterally for crossovers. Increases in MTP X-axis torqueimpulses represented less than 25% of the total torque impulseexperienced by the joint. Ankle extensor (Y) impulses showedsignificant increases for both sidesteps and crossovers, but the
–10
–5
0
5
10
15
20
25
–20
–15
–10
–5
0
5
10
15
–10
0
10
20
30
40
50
60
0
5
10
15
20
25
30
35
–40–30–20–10
010203040
–100–80–60–40–20
020406080
100
–15
–10
–5
0
5
10
15
–25–20–15–10–505
10152025
–40
–30
–20
–10
0
10
20
30
–25–20–15–10–505
10152025
–6
–4
–2
0
2
4
6
8
–2–1012345678
0 10 20 30 40 50 60 70 80 90 1000 10 20 30 40 50 60 70 80 90 100 10 20 30 40 50 60 70 80 90 1000
Proportion of stance period (%)
Net
mom
ent (
Nm
)
Hip Y (extension)A Hip Z (ab/adduction)B Hip X (rotation)C
Knee Z (ab/adduction)D
Knee Y (flexion)E
Knee X (rotation)F
Ankle Z (ab/adduction)G
Ankle Y (extension)H
Ankle X (rotation)I
MTP X (rotation)L
MTP Y (extension)K
MTP Z (ab/adduction)J
TL
SL
TRSR
TLSL
TRSR
TLSL
TR
SR
TLSL
TR
SR
TLSL
TR
SR
TLSL
TR
SR
TLSLTR
SR
TL
SL
TR
SR TLSL
TRSR
TLSL
TR
SR
TL
SL
TR
SR TL
SL
TR
SR
Fig.·8. Net torques about joint axes during the stance period four turning conditions. Colors, labels and error bars as described in Fig.·2.Descriptors in parentheses denote direction of positive angle changes. MTP, metatarsal–phalangeal.
THE JOURNAL OF EXPERIMENTAL BIOLOGY
1387Ostrich maneuvering
increases were only 17% and 15% for crossovers and sidesteps,respectively. Although turning also resulted in changes inloading about the ankle Z-axis, the absolute changes of 0.84and 1.04·Nm·s were less than 20% of the total torque impulsesexperienced by the joint. Similar to the ankle, crossover cutswere associated with significantly greater flexor torques at theknee. The knee flexion torques pass through zero, resulting insmall net torque impulses during straight-ahead locomotion.Although the increased knee flexor torque impulses duringcrossovers were twofold those during straight running, theabsolute magnitude of the impulses only increased by 10%.Similarly, hip extensor torques during sidesteps also increasedover twofold relative to straight-ahead running, but the absolutetorque increase was only 44%. Overall, although significantchanges in net joint torque impulse were observed, for mostjoints these changes were small relative to the net torqueimpulses experienced at each joint.
DiscussionOstriches did not show a preference for sidesteps or
crossovers. During sidesteps, ostriches deflected theirmovement direction and rotated their body in the same step.During crossovers ostriches primarily changed their movementdirection but little body rotation occurred. However, bothsidesteps and crossovers showed comparable changes in bodyorientation relative to straight running and both showed similaranticipatory adjustments in body rotation at the beginning ofthe step. Leg effectiveness numbers were within 20% of 1,indicating that only small acceleration/braking forces onaverage should be necessary to control body rotation duringturning. As predicted, measured acceleration/braking forceswere small in magnitude relative to vertical forces and theforces parallel or perpendicular to the initial movementdirection. However, during individual trials ostriches did useacceleration/braking forces to control body orientation duringrunning turns. The measured forces matched the forcespredicted to maintain body orientation aligned with movementdirection at the end of the turn. The adjustments to footplacement employed were primarily achieved by changes inbody attitude and abduction of the shank. Despite the largechanges in direction and ground reaction forces necessary tomaneuver, large changes in joint torques were not observed.
Several experimental limitations should be taken intoaccount when interpreting these results. First, due to thestructure of the trackway, barrier and motion analysis systemthe trials could not be randomized. Straight running trials werecollected beginning 1 day following data collection fromturning trials. This non-random presentation of straight runsmay have contributed to the observed asymmetry of somekinematic and dynamic parameters (i.e. Fig.·7). Moreover, theenvironment around the trackway was not symmetrical, and thepresence of computers and experimenters to the left of the forceplatform could also have contributed to the observedasymmetries. Variability in marker placement was also asource of measurement noise. For example, markers on the
breast could move dorso-ventrally relative to the other bodymarkers with each breath. Although these motions couldchange the calculated COM location vertically, we expect thatthe fore–aft and medio-lateral noise due to respiration to besmall. Finally, in these experiments we elicited turns of modestmagnitude, and ostriches can certainly execute turns sharperthan the 14–18° turns we studied. Consequently, our findingsdo not exclude the possibility that ostriches use differentstrategies during turns of very different magnitudes or speeds.
The three-dimensional nature of maneuvers requires aconsideration of the three-dimensional movements of the bodyand limbs. To completely characterize the position or motion ofa limb, the segmental (i.e. bone) orientations should be measuredand related to each other using consistent angle conventions(Grood and Suntay, 1983; Wu et al., 2002). Determining boneorientations, however, requires multiple markers on eachsegment, and was not possible in this study. Consequently, wechose to affix markers to landmarks near each joint center, andcharacterize joint motion using an angle convention that capturesthe most important features of movement. However, thischaracterization was not complete, and some potential types ofmovement (such as axial rotation of the segments), could not beuniquely identified. Moreover, the nature of our kinematiccharacterization prevented inverse-dynamic calculations of jointtorques that would account for the contributions of segmentalacceleration to ground reaction forces. However, the impact ofthese limitations is reduced by the repeated-measuresexperimental design, and the small differences in jointkinematics observed among the four conditions.
Although ostriches did not change their stride topreferentially turn with one leg, the kinematics of executingcrossovers and sidesteps were different. The greater initial bodyrotation, and reduced rotation observed during crossovers,suggest that body rotation is limited. One reason for reducedrotation during crossovers is the lower leg effectiveness of theinside leg relative to the outside leg (Table·1). However, with aleg effectiveness of 0.9, the body rotation caused by Fp wouldbe expected to be 90% of the deflection magnitude, instead of36%. This difference is likely caused by other mechanicalfactors such as the inertia of the swing leg. During straightrunning steps with the left leg, the body rotated on average –4°(i.e. clockwise; Table·1). The same mechanical factors are likelyto constrain rotation during crossovers. Relative to straight stepswith the left leg, body angles changed 10° during crossovers, or83% of the measured deflection. The remaining discrepancymay be due to the need to swing the right leg in the turn direction(medially) for correct placement in the subsequent step, similarto the effects of swing-leg inertia suggested in studies of humanmaneuvering (Jindrich et al., 2006). For crossovers, the bodyrotation due to this medial movement would act against the turndirection, and could contribute to the reduced body rotationduring turning steps. The similarity of net torque impulses aboutthe COM during sidesteps and crossovers supports thepossibility that swing-leg inertia reduces body rotation duringcrossovers. Although ostriches generated forces appropriate forbody rotation to match movement deflection during crossovers,
THE JOURNAL OF EXPERIMENTAL BIOLOGY
1388
body rotation during turning was likely reduced by swing-leginertia. Ostriches appeared to compensate for this limitation bybeginning crossovers with increased initial body yaw into theturning direction.
Ostrich morphology is appropriate for effective maneuvers
When humans execute 30° sidestep and crossover cuts,braking forces are 26% of Fpmax compared to 6–11% forostriches executing 15–20° turns (Jindrich et al., 2006).Moreover, whereas humans generated almost exclusivelybraking forces during sidesteps and crossovers, 40% of the netforces observed during turns for ostriches were acceleratory.Although both ostriches and humans used braking/accelerationforces to control body rotation, this required almost exclusivelybraking forces by humans. This can be explained in part bydifferences in leg effectiveness. Whereas humans turn with�=2.0–2.5, ostriches operated at � of approximately half thesevalues, 0.9–1.2 (close to 1). Differences in body shape canaccount for some of the differences observed between ostrichesand humans. In contrast to the orthograde posture of humans,ostriches have a pronograde (i.e. more horizontal than vertical)trunk orientation that results in a larger moment of inertia aboutthe vertical axis. The relationship M/I for ostriches was 86% ofthat for humans, and an ostrich-shaped human would beexpected to have �=1.2. However, � is most sensitive to therelationship of PAEP,imd to � and Vi (i.e. the multiplicand ofEqn·1). The fore–aft foot placement (PAEP,imd) for ostriches wasbelow (76–79%) those used by humans, but this was almostcompletely offset by decreases in � (ostriches 81–85% ofhumans), and Vi (ostriches 87–93% of humans). Themultiplicand of Eqn·1 for ostriches was 95% of human values.Consequently, most of the differences between ostriches andhumans were explained by differences in body morphology.Ostrich morphology is appropriate for effective maneuvers thatrequire minimal acceleratory or braking forces.
Turns could be executed with minimal changes in legkinematics or joint torque production
Ostriches did not substantially alter body or leg kinematicsto turn, and the kinematic changes resulted in few alterationsto joint torques relative to straight-ahead runnning. The lateralshifts in foot placement relative to the COM (PAEP,ip; Table·1)were caused by increased body roll and increased kneeadduction and abduction for crossovers and sidesteps,respectively (Table·2). Considering the height of the COM of76·cm, an initial body roll of 9° would be expected to result ina change in PAEP,ip of 12·cm in the absence of joint anglechanges, approximately 60% of the observed shift for sidesteps.For crossovers, body roll alone without changes in legkinematics would be expected to account for 37% of the PAEP,ip
shift. The remainder of PAEP,ip shift can be accounted for by Zrotation at the knee: increased adduction during crossovers andabduction during sidesteps, which both serve to shift the footposition towards the outside of the turn. This rotation is mostlikely due to axial thigh rotation, but varus/valgus movementsat the knee could also have contributed to the observed Z-
D. L. Jindrich and others
rotation. These observed adjustments at the knee joint aresimilar to changes in knee angles observed by guinea fowlrunning over rough terrain (Daley and Biewener, 2006). Theonly other significant change in initial angle, MTP Z,contributed to the medial shift in PAEP,ip during crossovers, butwas small in magnitude and could not account for substantialshifts in foot position given the length of the foot.
Body roll and leg ab/adduction resulted in transverse legangles (the angle of the line connecting the toe and hip) thatparalleled changes in transverse force angle during turns(Table·1). Transverse leg angle increased by 16° duringcrossovers and 17° during sidesteps, compared to 14° changesin force angle. Although medio-lateral shifts in the COPresulted in increased X and Z torques at the MTP and anklejoints, the alignment of the leg and force angles preventedsignificant increases in X and Z torque impulses at the knee andhip. Surprisingly, Y torques (extension at the ankle and flexionat the knee) increased during crossovers despite a significantdecrease in the resultant force (Tables 1, 3). This was mostlikely due to the increased body yaw at the initiation of the turnduring crossovers, which served to increase the component ofFp directed in the positive fore–aft direction, relative to the leg.Patterns of fore–aft and vertical forces relative to the imd weremaintained during crossovers (Fig.·4), even though thisresulted in changes in net torque impulses at distal joints.Overall, considering the large increases in Fp required forturning, changes in joint loading were small: less than 25%with the exception of hip extensor torques during sidesteps.This smooth transition from running to turning is reminiscentof the smooth transition between grounded and aerial runningobserved in these animals (Rubenson et al., 2004).
These results suggest that, with an appropriately designedmorphological system, maneuvers can be executed withminimal changes to running dynamics. Although acceleratoryand braking forces did serve to control body rotation, maneuversdid not involve substantial changes to leg kinematics or jointloading. Consequently, these results suggest that maneuvers inostriches could result from minor modifications of the spring-like behavior of legs during running. Theoretical studies of‘Lateral Leg Springs’ have shown that horizontal-planemaneuvers can be executed by spring–mass systems with minorshifts in COP location (Schmitt and Holmes, 2000), aproposition experimentally supported in insects (Jindrich andFull, 1999). These findings parallel theoretical and experimentalstudies of saggital-plane maneuvers, where the spring-likeproperties of legs can contribute to energy input in the form ofmuscle work to result in high performance (McGowan et al.,2005; Seyfarth et al., 1999). Changes in leg placement cancontribute to stabilizing movements both through bodydynamics and influencing leg stiffness (Farley et al., 1998;Seyfarth et al., 2002; Seyfarth et al., 2003). Additional study isrequired to determine how musculoskeletal dynamicscontributes to satisfying both the translational and rotationalstability requirements during three-dimensional maneuvers.
In summary, ostrich morphology is appropriate formaneuvering without requiring large braking or acceleratory
THE JOURNAL OF EXPERIMENTAL BIOLOGY
1389Ostrich maneuvering
forces. However, ostriches did use forces in the initialmovement direction to control body rotation. Ostrichesexecuted maneuvers using a simple control strategy thatrequired minimal changes to leg kinematics or net torqueproduction at individual joints. Body roll and ab/adduction ofthe leg shifted the foot position away from the turn direction,reducing the braking or acceleration forces required to controlbody rotation and aligning the leg with the ground reactionforce.
List of symbols and abbreviationsCOM center of massCOP center of pressured.f. degrees of freedomFMz free moment about the vertical axisFp force in horizontal plane perpendicular to the imdFpmax maximum force in horizontal plane perpendicular
to the imdFv vertical forceI moment of inertia about the vertical axisimd initial movement directionM body massMTP metatarsal–phalangealPAEP,imd anterior extreme foot placement in the initial
movement directionPp foot placement perpendicular the imdPpi initial foot placement perpendicular the imdSL straight-running step with the left legSLIP spring-loaded inverted pendulumSR straight-running step with the right legt timeTL left turn stepping with the left leg (crossover)TR left turn stepping with the right leg (sidestep)Tx torque about the X segment axis (axial rotation)Ty torque about the Y segment axis
(flexion/extension)Tz torque about the Z segment axis (varus/valgus)V velocity magnitudeVi initial velocity magnitude� acceleratory or braking force in the imd� leg effectiveness number�d angular change in velocity vector (magnitude of
deflection)�p body rotation due to lateral impulse necessary for
movement deflection�r
wb expected body rotation with acceleratory orbraking forces in the imd
�rwob expected body rotation without acceleratory or
braking forces in the imd� initial body angle�i initial body rotational velocity� stance period
The authors acknowledge the BBSRC for funding thiswork. A.W. is a BBSRC Research Fellow and holder of the
Royal Society Wolfson Research Merit award. The authorsthank Justine Robillard, Dr Jim Usherwood, Dr Renate Weller(Royal Veterinary College, UK) and Prof. Roger Woledge(Kings College London, UK) for their technical help.
ReferencesAlexander, R. M. (2003). Stability and manoeuvrability of terrestrial
vertebrates. Integr. Comp. Biol. 42, 158-164.Bobbert, M. F. and Schamhardt, H. C. (1990). Accuracy of determining the
point of force application with piezoelectric force plates. J. Biomech. 23,705-710.
Carrier, D. R., Walter, R. M. and Lee, D. V. (2001). Influence of rotationalinertia on turning performance of theropod dinosaurs: clues from humanswith increased rotational inertia. J. Exp Biol. 204, 3917-3926.
Cavagna, G. A., Heglund, N. C. and Taylor, C. R. (1977). Mechanical workin terrestrial locomotion: two basic mechanisms for minimizing energyexpenditure. Am. J. Physiol. 233, R243-R261.
Chang, Y. H. and Kram, R. (2007). Limitations to maximum running speedson flat curves. J. Exp. Biol. 210, 971-982.
Courtine, G. and Schieppati, M. (2004). Tuning of a basic coordinationpattern constructs straight-ahead and curved walking in humans. J.Neurophysiol. 91, 1524-1535.
Craig, J. (1989). Introduction to Robotics: Mechanics and Control. Reading,MA: Addison-Wesley.
Daley, M. A. and Biewener, A. A. (2006). Running over rough terrain revealslimb control for intrinsic stability. Proc. Natl. Acad. Sci. USA 103, 15681-15686.
Demes, B., Carlson, K. J. and Franz, T. M. (2006). Cutting corners: thedynamics of turning behaviors in two primate species. J. Exp. Biol. 209, 927-937.
Dickinson, M. H., Farley, C. T., Full, R. J., Koehl, M. A. R., Kram, R. andLehman, S. (2000). How animals move: an integrative view. Science 288,100-106.
Farley, C. T. and Morgenroth, D. C. (1999). Leg stiffness primarily dependson ankle stiffness during human hopping. J. Biomech. 32, 267-273.
Farley, C., Glasheen, J. and McMahon, T. A. (1993). Running springs: speedand animal size. J. Exp. Biol. 185, 71-86.
Farley, C. T., Houdijk, H. H., Van Strien, C. and Louie, M. (1998).Mechanism of leg stiffness adjustment for hopping on surfaces of differentstiffnesses. J. Appl. Physiol. 85, 1044-1055.
Full, R. J. (1989). Mechanics and energetics of terrestrial locomotion: bipedsto polypeds. In Energy Transformations in Cells and Organisms.Proceedings of the 10th Conference of the European Society forComparative Physiology and Biochemistry (ed. W. Wieser and E. Gnaiger),pp. 175-181. Innsbruck, Stuttgart, New York: Georg Thieme Verlag.
Full, R. J. and Koditschek, D. E. (1999). Templates and anchors:neuromechanical hypotheses of legged locomotion on land. J. Exp. Biol.202, 3325-3332.
Greene, P. R. (1985). Running on flat turns: experiments, theory, andapplications. J. Biomech. Eng. 107, 96-103.
Greene, P. R. (1987). Sprinting with banked turns. J. Biomech. 20, 667-680.Grood, E. S. and Suntay, W. J. (1983). A joint coordinate system for the
clinical description of three-dimensional motions: application to the knee. J.Biomech. Eng. 105, 136-144.
Holden, J. P. and Cavanagh, P. R. (1991). The free moment of groundreaction in distance running and its changes with pronation. J. Biomech. 24,887-897.
Jindrich, D. L. and Full, R. J. (1999). Many-legged maneuverability:dynamics of turning in hexapods. J. Exp. Biol. 202, 1603-1623.
Jindrich, D. L., Besier, T. F. and Lloyd, D. G. (2006). A hypothesis for thefunction of braking forces during running turns. J. Biomech. 39, 1611-1620.
Lafond, D., Duarte, M. and Prince, F. (2004). Comparison of three methodsto estimate the center of mass during balance assessment. J. Biomech. 37,1421-1426.
Lee, D. V., Walter, R. M., Deban, S. M. and Carrier, D. R. (2001). Influenceof increased rotational inertia on the turning performance of humans. J. Exp.Biol. 204, 3927-3934.
McGowan, C. P., Baudinette, R. V., Usherwood, J. R. and Biewener, A. A.(2005). The mechanics of jumping versus steady hopping in yellow-footedrock wallabies. J. Exp. Biol. 208, 2741-2751.
McLean, S. G., Huang, X. and van den Bogert, A. J. (2005). Association
THE JOURNAL OF EXPERIMENTAL BIOLOGY
between lower extremity posture at contact and peak knee valgus momentduring sidestepping: implications for ACL injury. Clin. Biomech. BristolAvon 20, 863-870.
Rand, M. K. and Ohtsuki, T. (2000). EMG analysis of lower limb musclesin humans during quick change in running directions. Gait Posture 12, 169-183.
Rubenson, J., Heliams, D. B., Lloyd, D. G. and Fournier, P. A. (2004). Gaitselection in the ostrich: mechanical and metabolic characteristics of walkingand running with and without an aerial phase. Proc. Biol. Sci 271, 1091-1099.
Schmitt, D. and Lemelin, P. (2002). Origins of primate locomotion: gaitmechanics of the woolly opossum. Am. J. Phys. Anthropol. 118, 231-238.
Schmitt, J. and Holmes, P. (2000). Mechanical models for insect locomotion:dynamics and stability in the horizontal plane II. Application. Biol. Cybern.83, 517-527.
Seyfarth, A., Friedrichs, A., Wank, V. and Blickhan, R. (1999). Dynamicsof the long jump. J. Biomech. 32, 1259-1267.
Seyfarth, A., Geyer, H., Günther, M. and Blickhan, R. (2002). A movementcriterion for running. J. Biomech. 35, 649-655.
Seyfarth, A., Geyer, H. and Herr, H. (2003). Swing-leg retraction: a simplecontrol model for stable running. J. Exp. Biol. 206, 2547-2555.
Usherwood, J. R. and Wilson, A. M. (2005). Biomechanics: no force limiton greyhound sprint speed. Nature 438, 753-754.
Walter, R. M. (2003). Kinematics of 90 degree running turns in wild mice. J.Exp Biol. 206, 1739-1749.
Wu, G., Siegler, S., Allard, P., Kirtley, C., Leardini, A., Rosenbaum, D.,Whittle, M., D’Lima, D. D., Cristofolini, L., Witte, H. et al. (2002). ISBrecommendation on definitions of joint coordinate system of various jointsfor the reporting of human joint motion – part I: ankle, hip, and spine.International Society of Biomechanics. J. Biomech. 35, 543-548.
Wu, G., van der Helm, F. C., Veeger, H. E., Makhsous, M., Van Roy, P.,Anglin, C., Nagels, J., Karduna, A. R., McQuade, K., Wang, X. et al.(2005). ISB recommendation on definitions of joint coordinate systems ofvarious joints for the reporting of human joint motion – Part II: shoulder,elbow, wrist and hand. J. Biomech. 38, 981-992.
Zatsiorsky, V. M. and King, D. L. (1998). An algorithm for determininggravity line location from posturographic recordings. J. Biomech. 31, 161-164.
D. L. Jindrich and others1390
THE JOURNAL OF EXPERIMENTAL BIOLOGY