Embed Size (px)
Citation preview

ARTICLE IN PRESS
0022-5096/$ - se
doi:10.1016/j.jm
�CorrespondE-mail addr
Journal of the Mechanics and Physics of Solids 56 (2008) 172–183
www.elsevier.com/locate/jmps
Mechanics of indentation of plastically graded materials—II:Experiments on nanocrystalline alloys with grain size gradients
I.S. Choia,b, A.J. Detora, R. Schwaigerb, M. Daoa, C.A. Schuha, S. Suresha,�
aDepartment of Materials Science and Engineering, Massachusetts Institute of Technology, Cambridge, MA 02139, USAbForschungszentrum Karlsruhe, Institute for Materials Research II, 76344 Karlsruhe, Germany
Received 8 November 2006; received in revised form 5 July 2007; accepted 6 July 2007
Abstract
A systematic study of depth-sensing indentation was performed on nanocrystalline (nc) Ni–W alloys specially
synthesized with controlled unidirectional gradients in plastic properties. A yield strength gradient and a roughly constant
Young’s modulus were achieved in the nc alloys, using electrodeposition techniques. The force vs. displacement response
from instrumented indentation experiments matched very well with that predicted from the analysis of Part I of this paper.
The experiments also revealed that the pile-up of the graded alloy around the indenter is noticeably higher than that for the
two homogeneous reference alloys that constitute the bounding conditions for the graded material. These trends are also
consistent with the predictions of the indentation analysis.
r 2007 Elsevier Ltd. All rights reserved.
Keywords: Functionally graded materials; Indentation and hardness; Mechanical testing; Nanostructured materials; Numerical algorithms
1. Introduction
The framework for analyzing the mechanics of instrumented indentation in ductile solids with a linearthrough-thickness variation of yield strength was presented in Part I. Here, we present experimental resultsthat provide direct means to assess the predictions of the indentation analysis by recourse to grain size gradednanocrystalline (nc) alloys with controlled unidirectional gradients in plastic properties and essentially novariation in elastic properties.
It is a significant experimental challenge to design and fabricate an elastically homogeneous, but plasticallygraded, fully dense alloy with a linear variation in yield strength as a function of depth below the indentedsurface. Ideally, such a model material system should possess the following attributes:
1.
values of Young’s modulus and Poisson’s ratio should be spatially invariant; 2. the yield strength of the material should vary significantly (and preferably linearly) as a function of depthbeneath the indented surface;
e front matter r 2007 Elsevier Ltd. All rights reserved.
ps.2007.07.006
ing author. Tel.: +1 617 253 3320; fax: +1 617 253 0868.
ess: [email protected] (S. Suresh).
ARTICLE IN PRESSI.S. Choi et al. / J. Mech. Phys. Solids 56 (2008) 172–183 173
3.
the processing method employed should provide sufficient flexibility to adjust the thickness of the gradedmaterial as compared with the region of elastic deformation surrounding the indenter, for indentations atmultiple length scales;4.
the internal interfaces (e.g., grain boundaries or layer interfaces) in the graded material should besufficiently well bonded so as to avoid brittle fracture in the region of intense deformation surrounding theindenter (since this is likely to offset any potential benefits of mechanical property gradation) and5.
in order to critically assess the experimental trends in light of the predictions reported in Part I, theprocessing method either should not lead to long-range internal stresses (Suresh and Mortensen, 1998;Suresh, 2001), or the model system and/or test methods employed should be sufficiently quantitative so asto facilitate the separation of any potential effects of residual stresses on the inferred indentation response.In light of these considerations, the model graded system chosen for direct comparison with the analysis inPart I was a grain size graded nc Ni–W alloy. This choice was motivated by a number of factors. For example,nc metals and alloys (with average and maximum grain size values below 100 nm) can now be produced atfull density using a variety of experimental methods (Gleiter, 2000; Kumar et al., 2003; Meyers et al., 2006;Dao et al., 2007). Introducing a gradient in grain size leads to one in yield strength via the classical Hall–Petcheffect, but without necessarily requiring a gradient in elastic properties. Furthermore, the strain hardeningcoefficient of nc metals is essentially zero over a broad range of achievable yield stresses, and consequently,gradients in strain hardening behavior can be minimized as well. Finally, indentation as well as frictionalsliding experiments conducted on nc metals point to their relatively stronger resistance to contact damage,especially resistance to crack initiation, as compared to their microcrystalline counterparts (Schuh et al., 2002;Bellemare et al., 2007a, b).
In what follows, we first briefly describe the experimental technique used to synthesize plastically gradedNi–W alloys. To ensure that this material meets the ideal requirements outlined above, we next conduct adetailed evaluation of the mechanical properties as a function of thickness through the specimen. This includesan evaluation of the plastic and elastic properties to justify a proper comparison with—and to parameterize—the computational model of Part I. We conclude with a direct comparison between the experimental andcomputational indentation response of a plastically graded material, simultaneously validating the modelingapproach and material synthesis technique.
2. Preparation of graded Ni–W alloys
With the requirements laid out above in mind, we have worked with a model nc Ni–W system in the presentstudy. Grain size has been graded from �90 to �20 nm (resulting in a hardness range of �4.8 to �8.3GPa,respectively) over a 20 mm thickness. This fine level of microstructural control has been realized using a newelectrodeposition technique (Detor and Schuh, 2005, 2007).
Nanocrystalline Ni–W alloys processed by electrodeposition exhibit a characteristic relationship betweencomposition and grain size. This relationship is rooted in the thermodynamics of grain boundary segregation:W atoms apparently stabilize grain boundaries, so that increases in W content compel the system to finer grainsizes (Weissmuller, 1993). A key practical consequence of this effect is that grain size can be tailored viajudicious control of alloy composition. By tailoring the electrodeposition process to affect the level of Wincorporation in growing deposits, grain size can be changed in situ to create a graded structure. Moreover, thehardness contrast that can be achieved in this system is quite high, ranging from �2 to �9GPa, while thechange in elastic modulus is only of order �10% and the strain hardening coefficient is uniform and aboutequal to zero. Thus, the graded specimens produced in this work represent a model system with, at leastnominally, a gradient in only the hardness/yield strength, without any appreciable gradients in othermechanical properties.
We note that for comparison with the model in Part I of this paper, a linear spatial gradient in strength isrequired. Because the Hall–Petch equation is parabolic (i.e., strength increases as the reciprocal square root ofgrain size), a parabolic grain size profile is required in order to linearly grade strength. This represents astraightforward adaptation of the method presented in Detor and Schuh (2007), which we have implementedhere.
ARTICLE IN PRESSI.S. Choi et al. / J. Mech. Phys. Solids 56 (2008) 172–183174
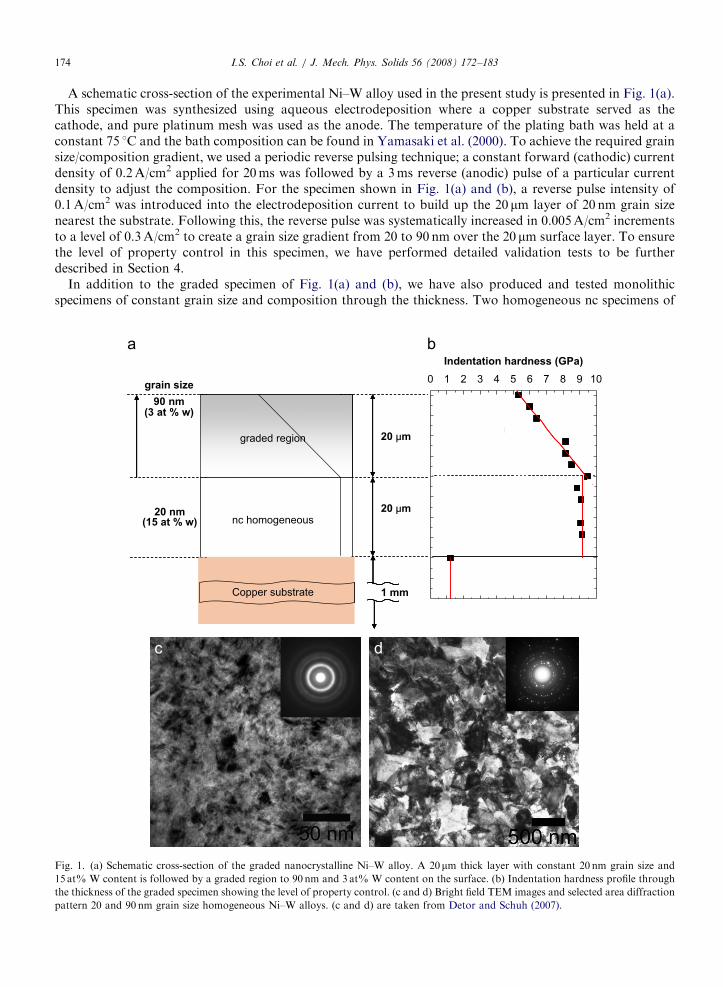
A schematic cross-section of the experimental Ni–W alloy used in the present study is presented in Fig. 1(a).This specimen was synthesized using aqueous electrodeposition where a copper substrate served as thecathode, and pure platinum mesh was used as the anode. The temperature of the plating bath was held at aconstant 75 1C and the bath composition can be found in Yamasaki et al. (2000). To achieve the required grainsize/composition gradient, we used a periodic reverse pulsing technique; a constant forward (cathodic) currentdensity of 0.2A/cm2 applied for 20ms was followed by a 3ms reverse (anodic) pulse of a particular currentdensity to adjust the composition. For the specimen shown in Fig. 1(a) and (b), a reverse pulse intensity of0.1A/cm2 was introduced into the electrodeposition current to build up the 20 mm layer of 20 nm grain sizenearest the substrate. Following this, the reverse pulse was systematically increased in 0.005A/cm2 incrementsto a level of 0.3A/cm2 to create a grain size gradient from 20 to 90 nm over the 20 mm surface layer. To ensurethe level of property control in this specimen, we have performed detailed validation tests to be furtherdescribed in Section 4.
In addition to the graded specimen of Fig. 1(a) and (b), we have also produced and tested monolithicspecimens of constant grain size and composition through the thickness. Two homogeneous nc specimens of
grain size
90 nm(3 at % w)
0 1 32 4 5 6 7 8 9 10
Indentation hardness (GPa)
graded region
nc homogeneous
Copper substrate
20 µm
20 µm
1 mm
20 nm(15 at % w)
Fig. 1. (a) Schematic cross-section of the graded nanocrystalline Ni–W alloy. A 20mm thick layer with constant 20 nm grain size and
15 at% W content is followed by a graded region to 90 nm and 3 at% W content on the surface. (b) Indentation hardness profile through
the thickness of the graded specimen showing the level of property control. (c and d) Bright field TEM images and selected area diffraction
pattern 20 and 90 nm grain size homogeneous Ni–W alloys. (c and d) are taken from Detor and Schuh (2007).

ARTICLE IN PRESSI.S. Choi et al. / J. Mech. Phys. Solids 56 (2008) 172–183 175
20 and 90 nm grain size were deposited to a thickness of 40 mm as shown in Figs. 1(c) and (d). Thesehomogeneous specimens bound the expected properties of the graded specimen, and will serve as a usefulcomparison in the analysis that follows.
In preparation for indentation tests, the specimens were mechanically polished using diamond suspensionsof 1 and 0.25 mm particle size. Final electropolishing was then conducted in a solution of ethanol,2-butoxyethanol, perchloric acid, and water in a LectroPol-5 (Struers A/S, Rødovre, Denmark).The electropolishing technique was chosen to avoid work hardening by mechanical polishing, to minimizethe removal of material from the graded portion of the specimen (which amounted to �4 mm), and to give thelowest possible surface roughness. To ensure that the electropolishing did not induce any significant structuralchanges, we have compared the indentation response of electropolished homogeneous 20 and 90 nm grain sizeNi–W specimens with those prepared only by mechanical polishing. The difference in load between these twotechniques was found to be small (less than 3%) at depths over 1 mm, which is the range most relevant to thepresent analysis.
3. Indentation procedure
Indentation experiments were conducted using a Nano Indenter XP (MTS Systems Corporation, EdenPrairie, MN, USA) with a diamond Berkovich tip. The tip radius is about 150 nm, but the effect of tipbluntness is not important since the indentation depth is �3.5 mm (b150 nm). This instrument uses a coil-magnet assembly for loading the probe, and measures the displacement into the sample with a capacitancegauge; it is known for its low machine compliance in the high-load range and for precise detection of samplecontact. In addition to accurate load and displacement data, the instrument also provides continuousmeasurement of the contact stiffness via a superimposed AC signal during loading (i.e., the so-calledcontinuous stiffness measurement (CSM) method) so that the indentation hardness and modulus evaluatedusing the Oliver–Pharr method (Oliver and Pharr, 1992) can be tracked continuously throughout the depth ofindentation. With this method, we also develop the means to verify how the hardness of a graded materialvaries as a function of indentation depth and to compare with the trends predicted in Part I. Further detailsabout this instrument can be found in the literature (Oliver and Pharr, 1992).
For each specimen, at least eight indentations were made to a depth of 4 mm at a constant indentation strainrate of 0.05 s�1. Following this, the load was held constant for 10 s, the tip was unloaded to 10% of themaximum load, held for 50 s in order to determine the displacement rate produced by drift, and finally fullyunloaded. The data were subsequently corrected for machine compliance, and also for drift assuming aconstant rate throughout the test.
Fig. 2(a) shows a typical indentation geometry using a conical indenter at the maximum indentation depth,hm, with its corresponding contact radius, am. Fig. 2(b) illustrates the residual profile after complete unloading,where hr is the residual indentation depth, hp is the pile-up height and ar is the residual impression radius. Thepile-up height hp is an important parameter that is closely related to the accurate measurement of theindentation impression radius ar and hardness value. Ignoring the pile-up effect can result in considerable
hphr
ar
hm
am
ConicalIndenter
�
Fig. 2. Schematic drawings and nomenclature of indentation with a conical indenter. (a) Indentation geometry at the maximum
indentation depth, hm, with its corresponding contact radius, am. (b) Residual profile after complete unloading, where hr is the residual
indentation depth, hp is the pile-up height and ar is the residual impression radius.

ARTICLE IN PRESSI.S. Choi et al. / J. Mech. Phys. Solids 56 (2008) 172–183176
errors in extracting mechanical properties from instrumented indentation experiments (Oliver and Pharr,2004). According to the computational study in Part I, plastically graded materials have unique pile-upbehavior as well. The pile-up ratio of hp/hr in these materials is a function of the maximum indentation depthhm, while the pile-up ratio for homogeneous materials is constant during self-similar sharp indentation.Furthermore, the pile-up ratio for the case of an increasing strength gradient is higher than that for the case ofthe homogeneous material with a surface yield strength equivalent to that of the graded material, which isopposite to the conventional trend. To examine the effect of a plastic gradient on the pile-up of the materialaround the indenter, high-load conical indentations are required, combined with accurate measurements of thepile-up profile and residual depth. For these experiments, we employed a Micromaterials MicroTest 200indenter (Micromaterials Ltd., Wrexham, UK) equipped with a diamond conical indenter with a tip apexangle of 70.31 and a tip radius of �2 mm. Note that this blunted tip is only �0.125 mm shorter than aperfectly sharp tip at this apex angle, while the maximum indentation depth would be about 20 times theblunted length; the tip can therefore be approximately treated as sharp. For each specimen, at least sixindentations were made to a residual indentation depth of about 2.4 mm at a constant indentation strain rate of0.05 s�1. The residual pile-up height (hp) and residual indentation depth (hr) were measured using aKLA-Tencor P-10 surface profilometer (KLA-Tencor Corporation, San Jose, California, USA).
4. Mechanical characterization of the graded specimen
Before comparing the experimental indentation response with the computational model presented in Part Iof this paper, we first discuss our experiments designed to test the conformity of our specimen to the ‘idealspecimen’ requirements outlined in the introduction. We first require a continuous and sufficiently largegradient in yield strength normal to the specimen surface, which we have tested by performing indentationhardness tests as a function of thickness through the electrodeposited Ni–W alloy. Typically, the through-thickness gradient is characterized using cross-sectional indentations. Here, however, we take a differentapproach, where the hardness profile was obtained by first polishing the specimen surface at a slight angle, toreveal a wide, oblique section plane through the Ni–W coating. Normal indents were then made in a seriesfrom the surface to the copper substrate. Each indent was performed to a depth of 1 mm and hardness wasaveraged in the shallow depth range from 400 to 800 nm to achieve as localized a measurement as possible.
Extracting the hardness profile in this way serves a very important purpose in the present work, in thecontext of managing and interpreting the possible role of residual stress in indentation, as outlined in theintroduction. Although we have no data regarding the possible presence or absence of residual stresses in thegraded specimen, it is reasonable to assume that if any such residual stresses were present they would be of anin-plane biaxial character (as expected in general for deposited films and coatings). Our hardnessmeasurements, being conducted nearly on the plane normal axis, implicitly incorporate information aboutbiaxial residual stress. Thus, the unknown residual stress state of our specimen (and even any possiblegradients in the residual stress state) are naturally accounted for in our measurements; if these are used tocalibrate the model from Part I, residual stress is effectively eliminated as a source of error. As an additionalbenefit, the use of an oblique section also allows for higher resolution of the through-thickness hardness. Theresulting hardness profile for the graded specimen is shown in Fig. 1(a) and (b), clear linear trend can be seenwith hardness increasing through the sample thickness.
In addition to the hardness profile technique described above, we have also measured hardness continuouslyusing the CSM method; this technique serves as an additional means to confirm the level of property variationthrough the experimental specimen. Hardness measured using this method is plotted as a function ofindentation depth in Fig. 3 for the graded and homogeneous specimens. The hardness of the homogeneousspecimens is constant over the full range of indentation depth measuring �8.3 and �4.8GPa for the 20 and90 nm grain size cases, respectively. Therefore, no indentation size effect for nc Ni–W alloys was observed forgrain sizes between 20 and 90 nm in the given indentation range. Note that this is different from cases wherethe indentation size effect results from geometrically necessary dislocations in larger crystals (Nix and Gao,1998). The possible deformation mechanisms in nc materials are significantly different from those observedin microcrystalline materials, and they operate at length scales comparable to the grain size (Dao et al., 2007).

ARTICLE IN PRESS
0.5 1.0 1.5 2.0 2.5 3.0 3.5
4.5
5.0
5.5
6.0
6.5
7.0
7.5
8.0
8.5
Ind
en
tatio
n h
ard
ne
ss (
GP
a)
Indentation depth (μm)
fine nc Ni-W alloy (homogeneous)
coarse nc Ni-W alloy (homogeneous)
graded nc Ni-W alloy (increasing gradient in σy)
Fig. 3. Indentation hardness vs. indentation depth for the graded and homogeneous nc Ni–W alloys. The fine-grained homogenous alloy
maintains a high constant hardness of �8.3GPa while the coarse-grained alloy has the lowest hardness of �4.8GPa. The hardness of the
graded specimen increases with indentation depth between these two extremes.
I.S. Choi et al. / J. Mech. Phys. Solids 56 (2008) 172–183 177
In the present study, the maximum indentation depth (�3.5 mm) was chosen to be much greater than theexperimental grain sizes (less than 100 nm), so it seems reasonable that no indentation size effect is observed.
In contrast to the above results on homogeneous specimens, the graded specimen shows non-self-similarbehavior, such that hardness increases with depth as the indenter accesses material of decreasing grain size(note that the surface hardness of the graded specimen is slightly higher than the value for the 20 nmhomogeneous case, because some portion of the graded region near the surface was removed duringpolishing). The measurements presented in Figs. 1(b) and 3 are consistent with one another, and confirm thepresence and magnitude of the strength gradient in the experimental specimen.
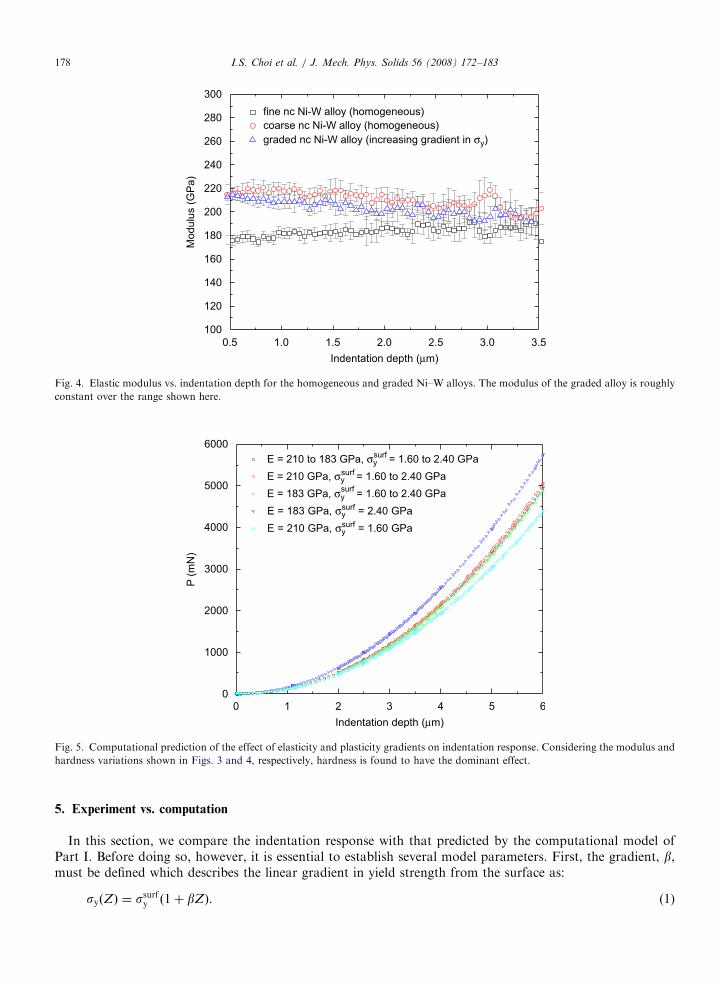
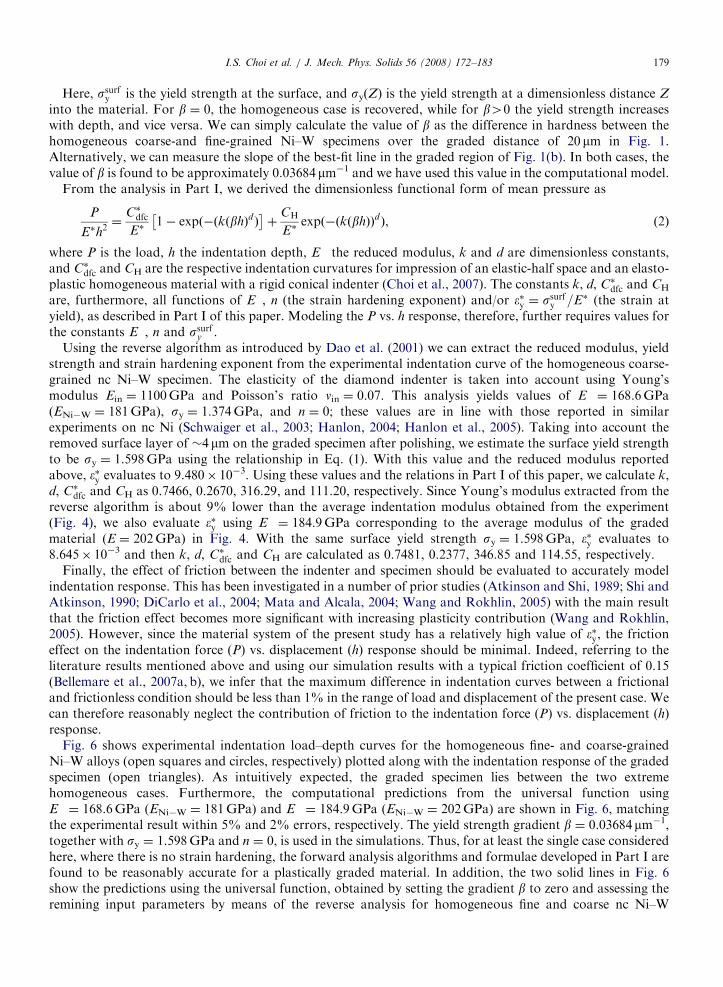
With characterization of the plastic properties, we now address the additional important point requiring anegligible change in elastic modulus through the graded Ni–W specimen. Using the CSM method we have alsomeasured the Young’s modulus (taking Poisson’s ratio as 0.3) as a function of indentation depth; the resultsare presented in Fig. 4. The most important result captured here is that the Young’s modulus of the gradedspecimen is roughly constant through the thickness and, within the scatter of the data, the Young’s modulus ofall three specimens (homogeneous and graded) is comparable. It is interesting to note, however, that theYoung’s modulus of the fine-grained specimen (20 nm) having higher W content appears to have a slightlylower modulus than the coarser-grained specimen. To check whether this possible modulus change could havea significant impact on the indentation response, several simulations have been conducted for the variouspossible extreme cases. Using the FE model setup developed in Part I of this paper (Choi et al., 2007), fiveload–depth curves are plotted in Fig. 5. The upper and lower curves (blue and cyan, respectively) representhomogeneous fine (20 nm) and coarse (90 nm)-grained Ni–W specimens with constant moduli of 183 and210GPa from the mean values of moduli in Fig. 4. The middle red (open circle) and green (open triangle)curves plot the response for the experimentally observed gradient in yield strength with constant modulus of210 and 183GPa, respectively. And, finally, the middle black (open square) curve represents a material havingboth yield strength and modulus gradients. From these computations, we conclude that even the most extremepossible elastic modulus gradient in the experimental material will have a negligible effect on the indentationresponse; the gradient in plasticity will therefore be the focus in the remainder of this paper.
From the above analysis, the graded nc Ni–W alloy meets the requirements laid out in the Introduction, andcan be considered a good model system against which to validate the computational results from Part I of thispaper.
ARTICLE IN PRESS
0.5 1.0 1.5 2.0 2.5 3.0 3.5
100
120
140
160
180
200
220
240
260
280
300
Mo
du
lus (
GP
a)
Indentation depth (μm)
fine nc Ni-W alloy (homogeneous)
coarse nc Ni-W alloy (homogeneous)
graded nc Ni-W alloy (increasing gradient in σy)
Fig. 4. Elastic modulus vs. indentation depth for the homogeneous and graded Ni–W alloys. The modulus of the graded alloy is roughly
constant over the range shown here.
0 1 2 3 4 5 60
1000
2000
3000
4000
5000
6000
P (
mN
)
Indentation depth (μm)
E = 210 to 183 GPa, σy = 1.60 to 2.40 GPasurf
surf
surf
surf
surf E = 210 GPa, σy = 1.60 to 2.40 GPa
E = 183 GPa, σy = 1.60 to 2.40 GPa
E = 183 GPa, σy = 2.40 GPa
E = 210 GPa, σy = 1.60 GPa
Fig. 5. Computational prediction of the effect of elasticity and plasticity gradients on indentation response. Considering the modulus and
hardness variations shown in Figs. 3 and 4, respectively, hardness is found to have the dominant effect.
I.S. Choi et al. / J. Mech. Phys. Solids 56 (2008) 172–183178
5. Experiment vs. computation
In this section, we compare the indentation response with that predicted by the computational model ofPart I. Before doing so, however, it is essential to establish several model parameters. First, the gradient, b,must be defined which describes the linear gradient in yield strength from the surface as:
syðZÞ ¼ ssurfy ð1þ bZÞ. (1)
ARTICLE IN PRESSI.S. Choi et al. / J. Mech. Phys. Solids 56 (2008) 172–183 179
Here, ssurfy is the yield strength at the surface, and sy(Z) is the yield strength at a dimensionless distance Z
into the material. For b ¼ 0, the homogeneous case is recovered, while for b40 the yield strength increaseswith depth, and vice versa. We can simply calculate the value of b as the difference in hardness between thehomogeneous coarse-and fine-grained Ni–W specimens over the graded distance of 20 mm in Fig. 1.Alternatively, we can measure the slope of the best-fit line in the graded region of Fig. 1(b). In both cases, thevalue of b is found to be approximately 0.03684 mm�1 and we have used this value in the computational model.
From the analysis in Part I, we derived the dimensionless functional form of mean pressure as
P
E�h2¼
C�dfcE�
1� expð�ðkðbhÞdÞ� �
þCH
E�expð�ðkðbhÞÞdÞ, (2)
where P is the load, h the indentation depth, E� the reduced modulus, k and d are dimensionless constants,and C�dfc and CH are the respective indentation curvatures for impression of an elastic-half space and an elasto-plastic homogeneous material with a rigid conical indenter (Choi et al., 2007). The constants k, d, C�dfc and CH
are, furthermore, all functions of E�, n (the strain hardening exponent) and/or ��y ¼ ssurfy =E� (the strain atyield), as described in Part I of this paper. Modeling the P vs. h response, therefore, further requires values forthe constants E�, n and ssurfy .
Using the reverse algorithm as introduced by Dao et al. (2001) we can extract the reduced modulus, yieldstrength and strain hardening exponent from the experimental indentation curve of the homogeneous coarse-grained nc Ni–W specimen. The elasticity of the diamond indenter is taken into account using Young’smodulus Ein ¼ 1100GPa and Poisson’s ratio nin ¼ 0.07. This analysis yields values of E� ¼ 168.6GPa(ENi�W ¼ 181GPa), sy ¼ 1.374GPa, and n ¼ 0; these values are in line with those reported in similarexperiments on nc Ni (Schwaiger et al., 2003; Hanlon, 2004; Hanlon et al., 2005). Taking into account theremoved surface layer of �4 mm on the graded specimen after polishing, we estimate the surface yield strengthto be sy ¼ 1.598GPa using the relationship in Eq. (1). With this value and the reduced modulus reportedabove, ��y evaluates to 9.480� 10�3. Using these values and the relations in Part I of this paper, we calculate k,d, C�dfc and CH as 0.7466, 0.2670, 316.29, and 111.20, respectively. Since Young’s modulus extracted from thereverse algorithm is about 9% lower than the average indentation modulus obtained from the experiment(Fig. 4), we also evaluate ��y using E� ¼ 184.9GPa corresponding to the average modulus of the gradedmaterial (E ¼ 202GPa) in Fig. 4. With the same surface yield strength sy ¼ 1.598GPa, ��y evaluates to8.645� 10�3 and then k, d, C�dfc and CH are calculated as 0.7481, 0.2377, 346.85 and 114.55, respectively.
Finally, the effect of friction between the indenter and specimen should be evaluated to accurately modelindentation response. This has been investigated in a number of prior studies (Atkinson and Shi, 1989; Shi andAtkinson, 1990; DiCarlo et al., 2004; Mata and Alcala, 2004; Wang and Rokhlin, 2005) with the main resultthat the friction effect becomes more significant with increasing plasticity contribution (Wang and Rokhlin,2005). However, since the material system of the present study has a relatively high value of ��y, the frictioneffect on the indentation force (P) vs. displacement (h) response should be minimal. Indeed, referring to theliterature results mentioned above and using our simulation results with a typical friction coefficient of 0.15(Bellemare et al., 2007a, b), we infer that the maximum difference in indentation curves between a frictionaland frictionless condition should be less than 1% in the range of load and displacement of the present case. Wecan therefore reasonably neglect the contribution of friction to the indentation force (P) vs. displacement (h)response.
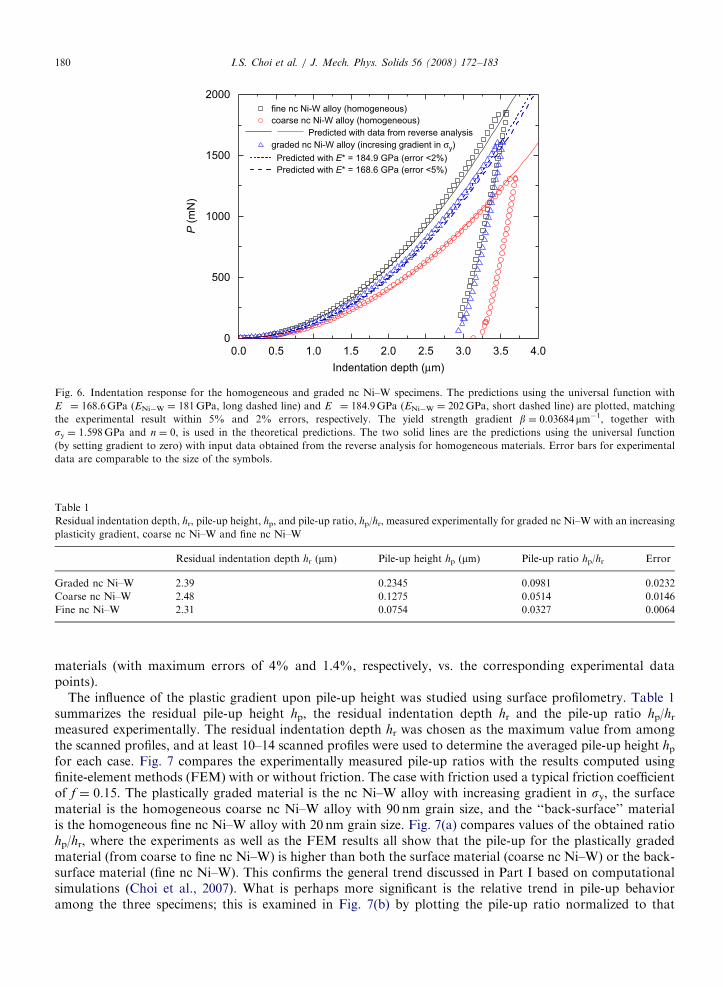
Fig. 6 shows experimental indentation load–depth curves for the homogeneous fine- and coarse-grainedNi–W alloys (open squares and circles, respectively) plotted along with the indentation response of the gradedspecimen (open triangles). As intuitively expected, the graded specimen lies between the two extremehomogeneous cases. Furthermore, the computational predictions from the universal function usingE� ¼ 168.6GPa (ENi�W ¼ 181GPa) and E� ¼ 184.9GPa (ENi�W ¼ 202GPa) are shown in Fig. 6, matchingthe experimental result within 5% and 2% errors, respectively. The yield strength gradient b ¼ 0.03684 mm�1,together with sy ¼ 1.598GPa and n ¼ 0, is used in the simulations. Thus, for at least the single case consideredhere, where there is no strain hardening, the forward analysis algorithms and formulae developed in Part I arefound to be reasonably accurate for a plastically graded material. In addition, the two solid lines in Fig. 6show the predictions using the universal function, obtained by setting the gradient b to zero and assessing theremining input parameters by means of the reverse analysis for homogeneous fine and coarse nc Ni–W
ARTICLE IN PRESS
0.0 2.01.0 2.51.50.5 3.0 3.5 4.00
500
1000
1500
2000
Predicted with data from reverse analysis
fine nc Ni-W alloy (homogeneous)
coarse nc Ni-W alloy (homogeneous)
graded nc Ni-W alloy (incresing gradient in σy)
Predicted with E* = 184.9 GPa (error <2%)
Predicted with E* = 168.6 GPa (error <5%)
P (
mN
)
Indentation depth (μm)
Fig. 6. Indentation response for the homogeneous and graded nc Ni–W specimens. The predictions using the universal function with
E� ¼ 168.6GPa (ENi�W ¼ 181GPa, long dashed line) and E� ¼ 184.9GPa (ENi�W ¼ 202GPa, short dashed line) are plotted, matching
the experimental result within 5% and 2% errors, respectively. The yield strength gradient b ¼ 0.03684mm�1, together with
sy ¼ 1.598GPa and n ¼ 0, is used in the theoretical predictions. The two solid lines are the predictions using the universal function
(by setting gradient to zero) with input data obtained from the reverse analysis for homogeneous materials. Error bars for experimental
data are comparable to the size of the symbols.
Table 1
Residual indentation depth, hr, pile-up height, hp, and pile-up ratio, hp/hr, measured experimentally for graded nc Ni–W with an increasing
plasticity gradient, coarse nc Ni–W and fine nc Ni–W
Residual indentation depth hr (mm) Pile-up height hp (mm) Pile-up ratio hp/hr Error
Graded nc Ni–W 2.39 0.2345 0.0981 0.0232
Coarse nc Ni–W 2.48 0.1275 0.0514 0.0146
Fine nc Ni–W 2.31 0.0754 0.0327 0.0064
I.S. Choi et al. / J. Mech. Phys. Solids 56 (2008) 172–183180
materials (with maximum errors of 4% and 1.4%, respectively, vs. the corresponding experimental datapoints).
The influence of the plastic gradient upon pile-up height was studied using surface profilometry. Table 1summarizes the residual pile-up height hp, the residual indentation depth hr and the pile-up ratio hp/hrmeasured experimentally. The residual indentation depth hr was chosen as the maximum value from amongthe scanned profiles, and at least 10–14 scanned profiles were used to determine the averaged pile-up height hpfor each case. Fig. 7 compares the experimentally measured pile-up ratios with the results computed usingfinite-element methods (FEM) with or without friction. The case with friction used a typical friction coefficientof f ¼ 0.15. The plastically graded material is the nc Ni–W alloy with increasing gradient in sy, the surfacematerial is the homogeneous coarse nc Ni–W alloy with 90 nm grain size, and the ‘‘back-surface’’ materialis the homogeneous fine nc Ni–W alloy with 20 nm grain size. Fig. 7(a) compares values of the obtained ratiohp/hr, where the experiments as well as the FEM results all show that the pile-up for the plastically gradedmaterial (from coarse to fine nc Ni–W) is higher than both the surface material (coarse nc Ni–W) or the back-surface material (fine nc Ni–W). This confirms the general trend discussed in Part I based on computationalsimulations (Choi et al., 2007). What is perhaps more significant is the relative trend in pile-up behavioramong the three specimens; this is examined in Fig. 7(b) by plotting the pile-up ratio normalized to that

ARTICLE IN PRESS
0.00
0.05
0.10
0.15
0.20
Graded Coarse nc Fine nc
Graded Coarse nc Fine nc
h p/h
r
Experiment
FEM: f=0.15
FEM: f=0
Experiment
FEM: f=0.15
FEM: f=0
0.0
0.5
1.0
1.5
2.0
No
rma
lize
d h
p/h r
Fig. 7. Residual pile-up height measured experimentally and computed using FEMs with or without friction at the interface between the
indenter and the specimen. The plastically graded material is the nc Ni–W alloy with increasing gradient in sy, the surface material is the
homogeneous coarse nc Ni–W alloy with 90 nm grain size, and the back-surface material is the homogeneous fine nc Ni–W alloy with
20 nm grain size. (a) Direct comparison of the ratio hp/hr. (b) Comparison of the ratio hp/hr normalized to that of the surface coarse nc
Ni–W material.
I.S. Choi et al. / J. Mech. Phys. Solids 56 (2008) 172–183 181
obtained for the surface material. Here, we now see more directly the effect of the plastic gradient inpromoting pile-up, and the fact that this relative trend is captured well by the FEM calculations.
A final interesting finding illustrated in Fig. 7 is that, although friction has little effect on the P–h response,it does have significant influence on the pile-up height. When the frictional force is considered, the FEMresults are reasonably close to the experimental observations. As discussed in Marx and Balke (1997), Cheng
ARTICLE IN PRESSI.S. Choi et al. / J. Mech. Phys. Solids 56 (2008) 172–183182
and Cheng (1998) and Bellemare et al. (2007a, b), the strain hardening exponent also has a strong influence onthe pile-up height. This is one possible factor contributing to the discrepancies between the experimental andthe computational results. Nevertheless, the relative trends for all cases are very consistent, as seen in Fig. 7(b).
6. Conclusions
In the present work, the experimental indentation response of a plastically graded nc alloy has been directlycompared with the prediction of a computational model. The requirements of a suitable experimental materialwith which to perform this validation have been presented, leading to the development of a graded nc alloy,where a grain size gradient has been used to vary strength. Through detailed analysis of through-thicknessproperties we have confirmed that the experimental specimen exhibits ideal plastically graded behavior,showing a clear linear trend in hardness with negligible change in elastic modulus. After calibrating theunknown constants in the dimensionless function for linearly graded plastic material presented in Part I of thispaper, the experimental and computation indentation load–depth curves as well as normalized pile-up ratioswere found to exhibit excellent agreement.
Acknowledgments
This research was supported by the Defense University Research Initiative on Nano-Technology(DURINT) on ‘‘Damage and Failure Resistant Nanostructured Materials’’ which is funded at MIT by theOffice of Naval Research, Grant no. N00014-01-1-0808, and by a Grant to MIT from the Schlumberger-DollCompany. CAS and AJD were supported by the US Army Research Office, under Grant DAAD19-03-1-0235.CAS also acknowledges the support of the US National Science Foundation, under Grant DMI-0620304.
References
Atkinson, M., Shi, H., 1989. Friction effect in low load hardness testing of iron. Mater. Sci. Technol. 5 (6), 613–614.
Bellemare, S., Dao, M., Suresh, S., 2007a. The frictional sliding response of elasto-plastic materials in contact with a conical indenter. Int.
J. Solids Struct. 44 (6), 1970–1989.
Bellemare, S., Dao, M., Suresh, S., 2007b. Effects of mechanical properties and surface friction on elasto-plastic sliding contact. Mech.
Mater., in press.
Cheng, Y.T., Cheng, C.M., 1998. Effects of ‘sinking in’ and ‘piling up’ on estimating the contact area under load in indentation. Philos.
Mag. Lett. 78 (2), 115–120.
Choi, I.S., Dao, M., Suresh, S., 2007. Indentation of plastically graded materials: I. Analysis. J. Mech. Phys. Solids, in press. doi:10.1016/
j.jmps.2007.07.007.
Dao, M., Chollacoop, N., Van Vliet, K.J., Venkatesh, T.A., Suresh, S., 2001. Computational modeling of the forward and reverse
problems in instrumented sharp indentation. Acta Mater. 49 (19), 3899–3918.
Dao, M., Lu, L., Asaro, R.J., De Hosson, J.T.M., Ma, E., 2007. Toward a quantitative understanding of mechanical behavior of
nanocrystalline metals. Acta Mater. 55 (12), 4041–4065.
Detor, A.J., Schuh, C.A., 2005. Method for Producing Alloy Deposits and Controlling the Nanostructure Thereof Using Negative Current
Pulsing Electrodeposition, and Articles Incorporating Such Deposits. US Patent Application #11/147,146.
Detor, A.J., Schuh, C.A., 2007. Tailoring and patterning the grain size of nanocrystalline alloys. Acta Mater. 55 (1), 371–379.
DiCarlo, A., Yang, H.T.Y., Chandrasekar, S., 2004. Prediction of stress–strain relation using cone indentation: effect of friction. Int. J.
Numer. Methods Eng. 60 (3), 661–674.
Gleiter, H., 2000. Nanostructured materials: basic concepts and microstructure. Acta Mater. 48 (1), 1–29.
Hanlon, T., 2004. Grain Size Effects on the Fatigue Response of Nanocrystalline Materials. Deptartment of Materials Science and
Engineering, Cambridge, MIT.
Hanlon, T., Tabachnikova, E.D., Suresh, S., 2005. Fatigue behavior of nanocrystalline metals and alloys. Int. J. Fatigue 27 (10–12),
1147–1158.
Kumar, K.S., Van Swygenhoven, H., Suresh, S., 2003. Mechanical behavior of nanocrystalline metals and alloys. Acta Mater. 51 (19),
5743–5774.
Marx, V., Balke, H., 1997. A critical investigation of the unloading behavior of sharp indentation. Acta Mater. 45 (9), 3791–3800.
Mata, M., Alcala, J., 2004. The role of friction on sharp indentation. J. Mech. Phys. Solids 52 (1), 145–165.
Meyers, M.A., Mishra, A., Benson, D.J., 2006. Mechanical properties of nanocrystalline materials. Prog. Mater. Sci. 51 (4), 427–556.
Nix, W.D., Gao, H.J., 1998. Indentation size effects in crystalline materials: a law for strain gradient plasticity. J. Mech. Phys. Solids 46
(3), 411–425.
ARTICLE IN PRESSI.S. Choi et al. / J. Mech. Phys. Solids 56 (2008) 172–183 183
Oliver, W.C., Pharr, G.M., 1992. An improved technique for determining hardness and elastic-modulus using load and displacement
sensing indentation experiments. J. Mater. Res. 7 (6), 1564–1583.
Oliver, W.C., Pharr, G.M., 2004. Measurement of hardness and elastic modulus by instrumented indentation: advances in understanding
and refinements to methodology. J. Mater. Res. 19 (1), 3–20.
Schuh, C.A., Nieh, T.G., Yamasaki, T., 2002. Hall-Petch breakdown manifested in abrasive wear resistance of nanocrystalline nickel.
Scripta Mater. 46 (10), 735–740.
Schwaiger, R., Moser, B., Dao, M., Chollacoop, N., Suresh, S., 2003. Some critical experiments on the strain-rate sensitivity of
nanocrystalline nickel. Acta Mater. 51 (17), 5159–5172.
Shi, H., Atkinson, M., 1990. A friction effect in low-load hardness testing of copper and aluminum. J. Mater. Sci. 25 (4), 2111–2114.
Suresh, S., 2001. Graded materials for resistance to contact deformation and damage. Science 292 (5526), 2447–2451.
Suresh, S., Mortensen, A., 1998. Fundamentals of Functionally Graded Materials. Institute of Materials, London.
Wang, L., Rokhlin, S.I., 2005. Universal scaling functions for continuous stiffness nanoindentation with sharp indenters. Int. J. Solids
Struct. 42 (13), 3807–3832.
Weissmuller, J., 1993. Alloy effects in nanostructures. Nanostruct. Mater. 3 (1–6), 261–272.
Yamasaki, T., Tomohira, R., Ogino, Y., Schlossmacher, P., Ehrlich, K., 2000. Formation of ductile amorphous & nanocrystalline Ni–W
alloys by electrodeposition. Plat. Surf. Finish. 87 (5), 148–152.