Embed Size (px)
Citation preview
ISIJ International, Vol. 60 (2020), No. 9
© 2020 ISIJ 2038
ISIJ International, Vol. 60 (2020), No. 9, pp. 2038–2043
* Corresponding author: E-mail: [email protected]: https://doi.org/10.2355/isijinternational.ISIJINT-2019-765
1. Introduction
Steel sheets coated with Zn, Al, or other metals, or painted steel sheets, are widely used in electric home appli-ances, building materials, automobiles, and other applica-tions. Galvanized-steel sheets are a representative type of coated steel sheet. In 2017 in Japan, 10.67 million tons1) of galvanized-steel sheets were produced, accounting for 78% of all coated steel sheets produced. The most important performance requirement of galvanized-steel sheets is cor-rosion resistance. The galvanized coating demonstrates its corrosion resistance in preventing the corrosion of the steel substrate from producing red rust to mar the surface appear-ance and to reduce thickness and strength.
To further improve the corrosion resistance of galvanized-steel sheets, various types of Zn-alloy-coated steel sheets have been developed by using Al or Mg. One such example is hot-dip Zn–11mass%Al–3mass%Mg–0.2mass%Si (mass%, hereinafter abbreviated to %) alloy-coated steel sheets (SD) and hot-dip Zn–6%Al–3%Mg-alloy-coated steel sheets. They have better corrosion resistance than hot-dip galvanized-steel sheets (GI) and are used in building materials, outdoor
Mechanism of Corrosion Protection at Cut Edge of Zn-11%Al-3%Mg-0.2%Si Coated Steel Sheets
Yuki SUZUKI,1)* Shinichi YAMAGUCHI,2) Masamitsu MATSUMOTO3) and Izumi MUTO4)
1) Yawata R & D Lab., Nippon Steel Corporation, 1-1 Tobihatacho, Tobata, Kitakyushu, Fukuoka, 804-8501 Japan.2) Process Research Lab., Nippon Steel Corporation, 20-1 Shintomi, Futtsu, Chiba, 293-8511 Japan.3) Materials Engineering Div., Nippon Steel Technology Co., Ltd., 1-8 Fuso-Cho, Amagasaki, Hyogo, 660-0891 Japan.4) Department of Materials Science, Graduate School of Engineering, Tohoku University, 6-6-02, Aza-aoba, Aramaki, Aoba, Sendai, 980-8579 Japan.
(Received on November 27, 2019; accepted on January 30, 2020; originally published in Tetsu-to-Hagané, Vol. 105, 2019, No. 7, pp. 752–758)
Steel coated with zinc and zinc alloys is widely utilized for home appliances, construction, automobiles, and other applications due to its high corrosion resistance. In this work, the corrosion behavior at cut edges of Zn–11%Al–3%Mg–0.2%Si-alloy-coated steel sheets (SD) was investigated with a cyclic wet–dry corrosion test. The results showed that SD has anticorrosive property superior to that of zinc-coated steel sheets (GI) during the early period of corrosion. GI produced red rust, whereas SD produced no red rust. After the cyclic wet–dry corrosion test, zinc-containing white rust was deposited on steel substrate. In the case of SD, magnesium reached the center of the cut edge, and a larger area on the steel was covered with white rust. Polarization measurements of steel substrate on which white rust was deposited clarified that the white rust of SD reduced both the anodic and cathodic current densities of the steel substrate more than GI. In the case of SD, the galvanic current between the steel substrate with white rust and the coating layer was small compared to that in the case of GI. It is suggested that this anticorrosive property of SD is caused by magnesium-containing white rust.
KEY WORDS: zinc-coated steel; Zn–11%Al–3%Mg–0.2%Si; cut edge; corrosion product; electrochemical property.
electric home appliances, and many other applications where they are exposed to severe corrosion environments.2,3)
The steel substrate is exposed at cut edges produced when coated steel sheets are cut and at sites where the coating layers of coated steel sheets are damaged by the strenuous fabrication in the manufacturing process before they are actually used. When the steel substrate is exposed to water, salt, oxygen, and other corrosion factors, red rust, a corro-sion product of iron, forms at such cut edges and at damaged coating sites, marring the steel surface appearance. The for-mation of red rust must be prevented in applications where the surface appearance is critical, such as visible structural members of prefabricated houses and train station buildings, stands of solar panels, and noise barriers on roads.
At cut edges where the zinc coating and the steel sub-strate, dissimilar metals, are both exposed to a corrosive environment, the sacrificial protection works whereby the less noble zinc coating is dissolved, but the more noble steel substrate does not corrode. The length of the period during which the corrosion protection of the steel substrate can be maintained depends on such factors as the electrical conductivity of an adhered solution, thickness of the zinc-coating layer relative to the steel thickness, and protective effect of the corrosion product of the dissolved zinc coating (hereinafter referred to as “white rust”). The zinc coating
ISIJ International, Vol. 60 (2020), No. 9
© 2020 ISIJ2039
has a significant effect on the formation of red rust.Nakamura4) reported that red rust forms at the cut edges
where the steel substrate is exposed (hereinafter referred to as “exposed steel substrate sites”) when the thickness is large and the substrate is exposed over a wide area. It was also reported that, after a few months of outdoor exposure, dense white rust covers all exposed steel substrate sites and proves very effective in suppressing the formation of red rust from the subsequent corrosion of the steel substrate. Morimoto et al.2) investigated the corrosion protection mechanism of SD on flat surfaces and determined that the protective effect of dense white rust improves the corrosion resistance of SD.
Komatsu et al.5) studied the protection mechanism of Zn–6%Al–3%Mg-alloy-coated steel sheets by focusing on the composition and morphology of white rust, as described above, concerning SD. They discussed the role of Mg in the coating layer on the flat surfaces of the Zn–6%Al–3%Mg-alloy-coated steel sheets, the electrochemical properties after the corrosion test, and the formation behavior of white rust. These studies centered on the effect of white rust on flat surfaces.
However, few findings are available on the protective effect of white rust deposited at the exposed steel substrate sites of cut edges. Yamamoto et al.6) performed cathodic polarization measurements with zinc-alloy-coated steel specimens and demonstrated the protective effect of white rust. Few reports have been published on the protective mechanism of white rust to suppress the formation of the initial red rust.
In this study, initial red rust at cut edges was investigated, and it was found that the inhibition of initial red rust forma-tion is affected by white rust. The role of white rust at the exposed steel substrate sites was examined electrochemi-cally to clarify the red rust inhibition mechanism of white rust at the SD cut edges.
2. Experimental
2.1. MaterialsGI and SD were used as experimental materials. The steel
sheets were 0.6 mm thick, and the coating layer thickness was 10 μm per side. To measure the galvanic current flow-ing between the coating layer and the steel substrate of GI and SD, metal sheets of the same element composition as that of the coating layers were used. (These metal sheets are hereinafter referred to as “GI(C)” and “SD(C),” respec-tively.) It was confirmed that the metal sheets had the same microstructures as those of the coating layers.
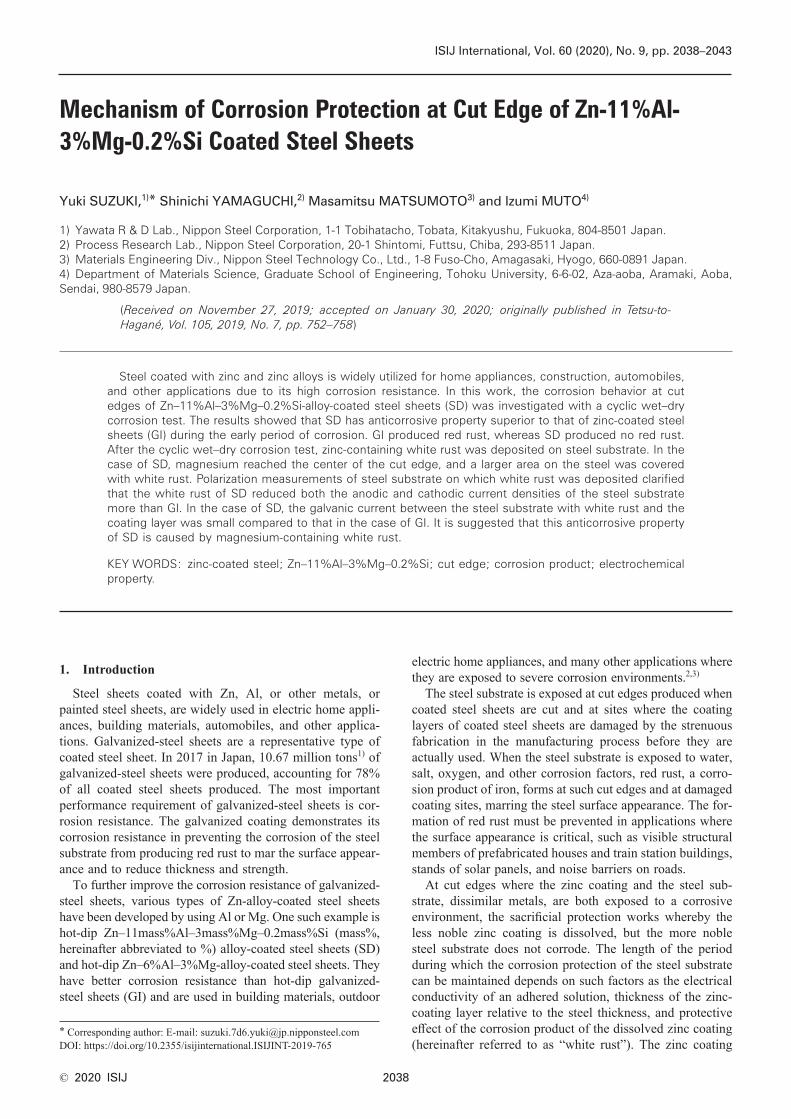
2.2. Cyclic Wet–Dry Corrosion TestFigure 1 shows the procedure for preparing cyclic wet–
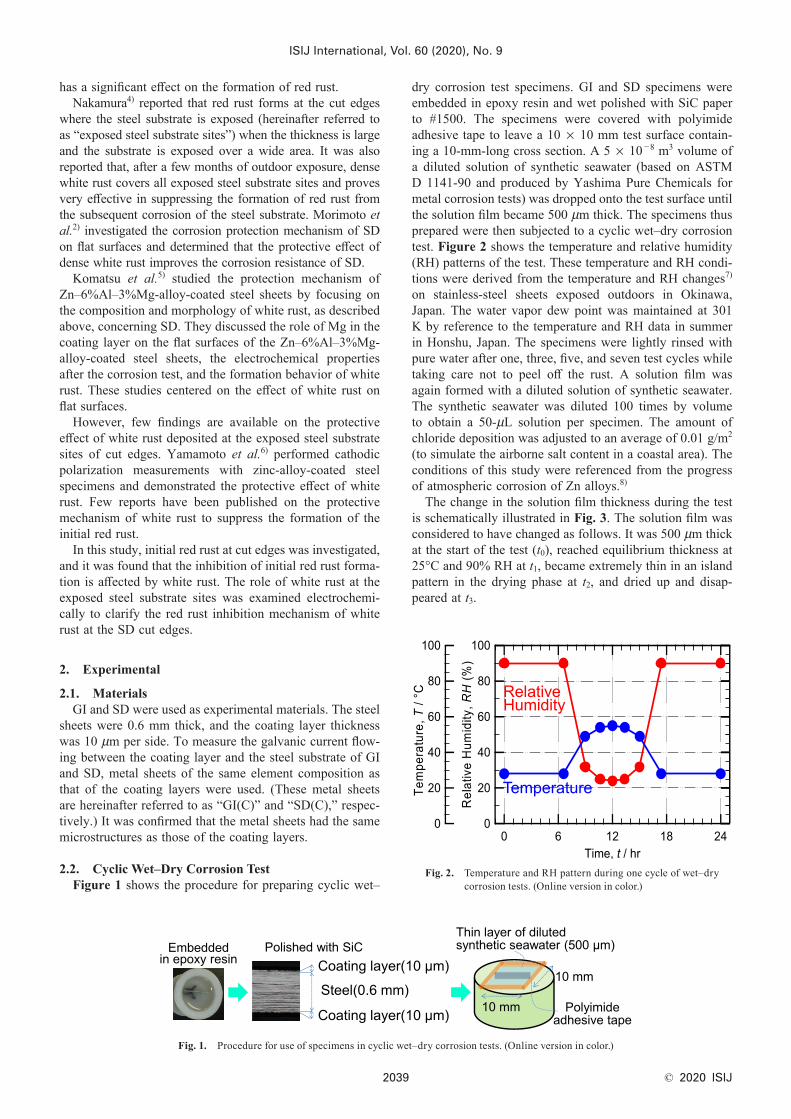
dry corrosion test specimens. GI and SD specimens were embedded in epoxy resin and wet polished with SiC paper to #1500. The specimens were covered with polyimide adhesive tape to leave a 10 × 10 mm test surface contain-ing a 10-mm-long cross section. A 5 × 10 −8 m3 volume of a diluted solution of synthetic seawater (based on ASTM D 1141-90 and produced by Yashima Pure Chemicals for metal corrosion tests) was dropped onto the test surface until the solution film became 500 μm thick. The specimens thus prepared were then subjected to a cyclic wet–dry corrosion test. Figure 2 shows the temperature and relative humidity (RH) patterns of the test. These temperature and RH condi-tions were derived from the temperature and RH changes7) on stainless-steel sheets exposed outdoors in Okinawa, Japan. The water vapor dew point was maintained at 301 K by reference to the temperature and RH data in summer in Honshu, Japan. The specimens were lightly rinsed with pure water after one, three, five, and seven test cycles while taking care not to peel off the rust. A solution film was again formed with a diluted solution of synthetic seawater. The synthetic seawater was diluted 100 times by volume to obtain a 50-μL solution per specimen. The amount of chloride deposition was adjusted to an average of 0.01 g/m2 (to simulate the airborne salt content in a coastal area). The conditions of this study were referenced from the progress of atmospheric corrosion of Zn alloys.8)
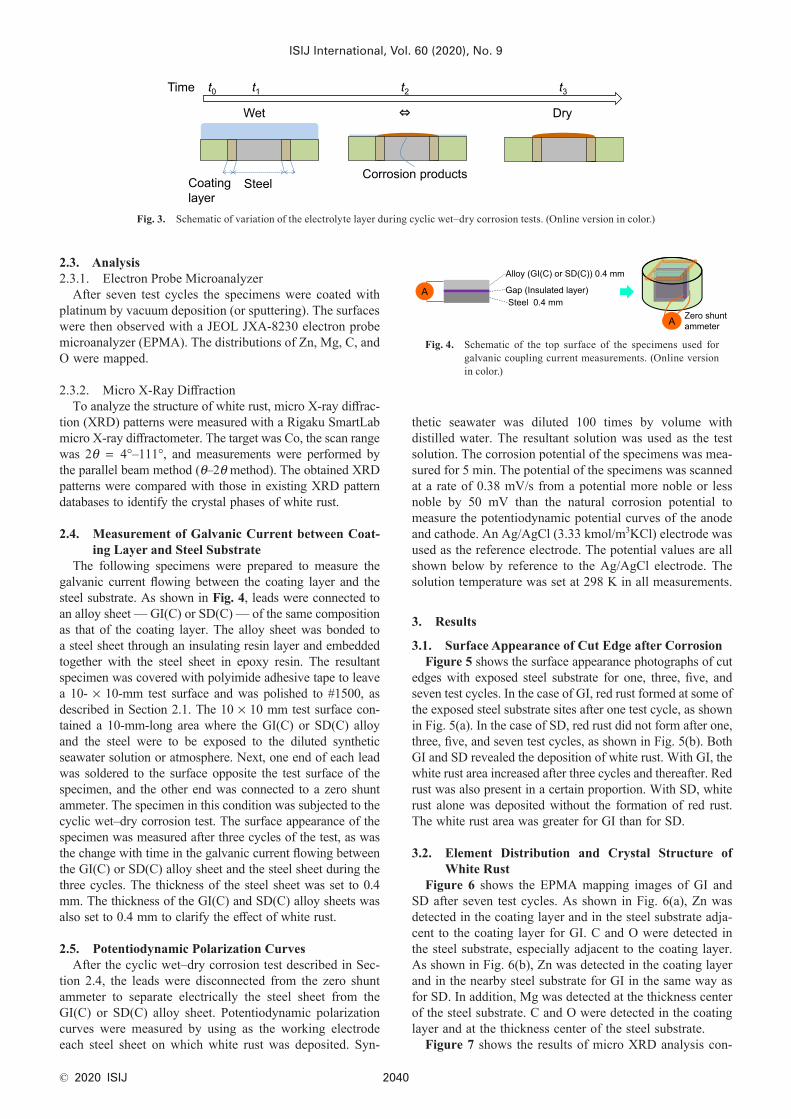
The change in the solution film thickness during the test is schematically illustrated in Fig. 3. The solution film was considered to have changed as follows. It was 500 μm thick at the start of the test (t0), reached equilibrium thickness at 25°C and 90% RH at t1, became extremely thin in an island pattern in the drying phase at t2, and dried up and disap-peared at t3.
Fig. 1. Procedure for use of specimens in cyclic wet–dry corrosion tests. (Online version in color.)
Fig. 2. Temperature and RH pattern during one cycle of wet–dry corrosion tests. (Online version in color.)
ISIJ International, Vol. 60 (2020), No. 9
© 2020 ISIJ 2040
2.3. Analysis2.3.1. Electron Probe Microanalyzer
After seven test cycles the specimens were coated with platinum by vacuum deposition (or sputtering). The surfaces were then observed with a JEOL JXA-8230 electron probe microanalyzer (EPMA). The distributions of Zn, Mg, C, and O were mapped.
2.3.2. Micro X-Ray DiffractionTo analyze the structure of white rust, micro X-ray diffrac-
tion (XRD) patterns were measured with a Rigaku SmartLab micro X-ray diffractometer. The target was Co, the scan range was 2θ = 4°–111°, and measurements were performed by the parallel beam method (θ–2θ method). The obtained XRD patterns were compared with those in existing XRD pattern databases to identify the crystal phases of white rust.
2.4. Measurement of Galvanic Current between Coat-ing Layer and Steel Substrate
The following specimens were prepared to measure the galvanic current flowing between the coating layer and the steel substrate. As shown in Fig. 4, leads were connected to an alloy sheet — GI(C) or SD(C) — of the same composition as that of the coating layer. The alloy sheet was bonded to a steel sheet through an insulating resin layer and embedded together with the steel sheet in epoxy resin. The resultant specimen was covered with polyimide adhesive tape to leave a 10- × 10-mm test surface and was polished to #1500, as described in Section 2.1. The 10 × 10 mm test surface con-tained a 10-mm-long area where the GI(C) or SD(C) alloy and the steel were to be exposed to the diluted synthetic seawater solution or atmosphere. Next, one end of each lead was soldered to the surface opposite the test surface of the specimen, and the other end was connected to a zero shunt ammeter. The specimen in this condition was subjected to the cyclic wet–dry corrosion test. The surface appearance of the specimen was measured after three cycles of the test, as was the change with time in the galvanic current flowing between the GI(C) or SD(C) alloy sheet and the steel sheet during the three cycles. The thickness of the steel sheet was set to 0.4 mm. The thickness of the GI(C) and SD(C) alloy sheets was also set to 0.4 mm to clarify the effect of white rust.
2.5. Potentiodynamic Polarization CurvesAfter the cyclic wet–dry corrosion test described in Sec-
tion 2.4, the leads were disconnected from the zero shunt ammeter to separate electrically the steel sheet from the GI(C) or SD(C) alloy sheet. Potentiodynamic polarization curves were measured by using as the working electrode each steel sheet on which white rust was deposited. Syn-
thetic seawater was diluted 100 times by volume with distilled water. The resultant solution was used as the test solution. The corrosion potential of the specimens was mea-sured for 5 min. The potential of the specimens was scanned at a rate of 0.38 mV/s from a potential more noble or less noble by 50 mV than the natural corrosion potential to measure the potentiodynamic potential curves of the anode and cathode. An Ag/AgCl (3.33 kmol/m3KCl) electrode was used as the reference electrode. The potential values are all shown below by reference to the Ag/AgCl electrode. The solution temperature was set at 298 K in all measurements.
3. Results
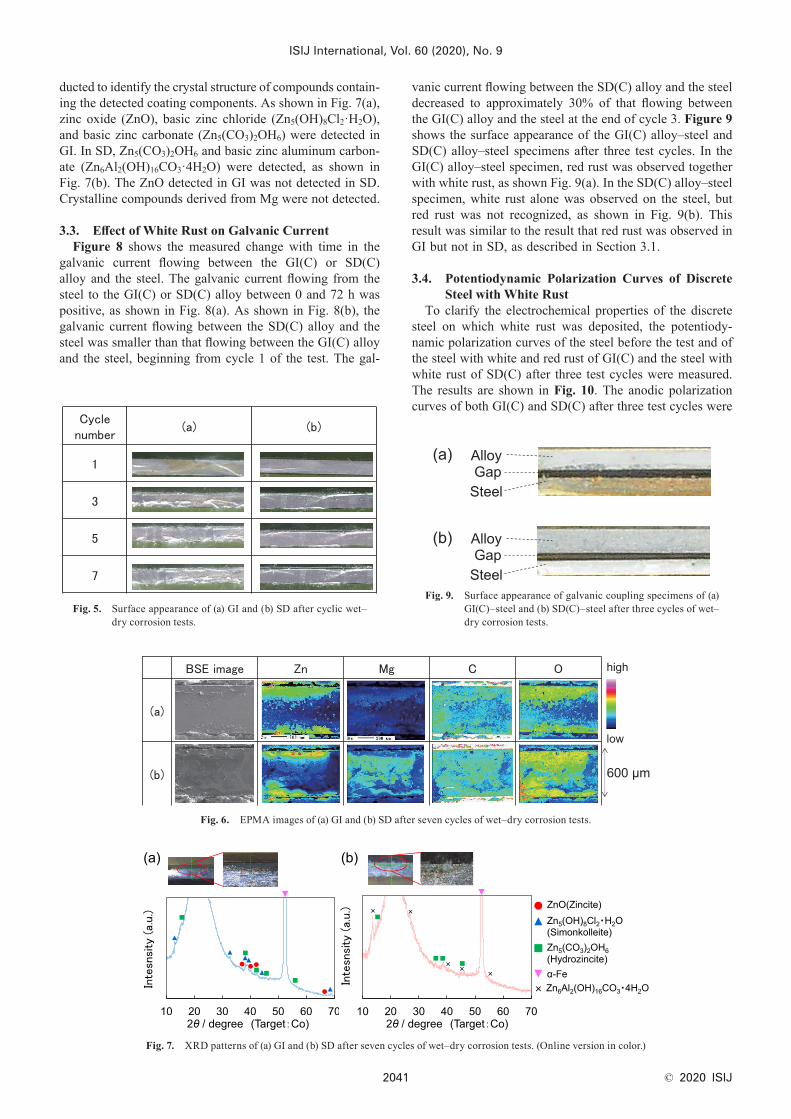
3.1. Surface Appearance of Cut Edge after CorrosionFigure 5 shows the surface appearance photographs of cut
edges with exposed steel substrate for one, three, five, and seven test cycles. In the case of GI, red rust formed at some of the exposed steel substrate sites after one test cycle, as shown in Fig. 5(a). In the case of SD, red rust did not form after one, three, five, and seven test cycles, as shown in Fig. 5(b). Both GI and SD revealed the deposition of white rust. With GI, the white rust area increased after three cycles and thereafter. Red rust was also present in a certain proportion. With SD, white rust alone was deposited without the formation of red rust. The white rust area was greater for GI than for SD.
3.2. Element Distribution and Crystal Structure of White Rust
Figure 6 shows the EPMA mapping images of GI and SD after seven test cycles. As shown in Fig. 6(a), Zn was detected in the coating layer and in the steel substrate adja-cent to the coating layer for GI. C and O were detected in the steel substrate, especially adjacent to the coating layer. As shown in Fig. 6(b), Zn was detected in the coating layer and in the nearby steel substrate for GI in the same way as for SD. In addition, Mg was detected at the thickness center of the steel substrate. C and O were detected in the coating layer and at the thickness center of the steel substrate.
Figure 7 shows the results of micro XRD analysis con-
Fig. 3. Schematic of variation of the electrolyte layer during cyclic wet–dry corrosion tests. (Online version in color.)
Fig. 4. Schematic of the top surface of the specimens used for galvanic coupling current measurements. (Online version in color.)
ISIJ International, Vol. 60 (2020), No. 9
© 2020 ISIJ2041
ducted to identify the crystal structure of compounds contain-ing the detected coating components. As shown in Fig. 7(a), zinc oxide (ZnO), basic zinc chloride (Zn5(OH)8Cl2·H2O), and basic zinc carbonate (Zn5(CO3)2OH6) were detected in GI. In SD, Zn5(CO3)2OH6 and basic zinc aluminum carbon-ate (Zn6Al2(OH)16CO3·4H2O) were detected, as shown in Fig. 7(b). The ZnO detected in GI was not detected in SD. Crystalline compounds derived from Mg were not detected.
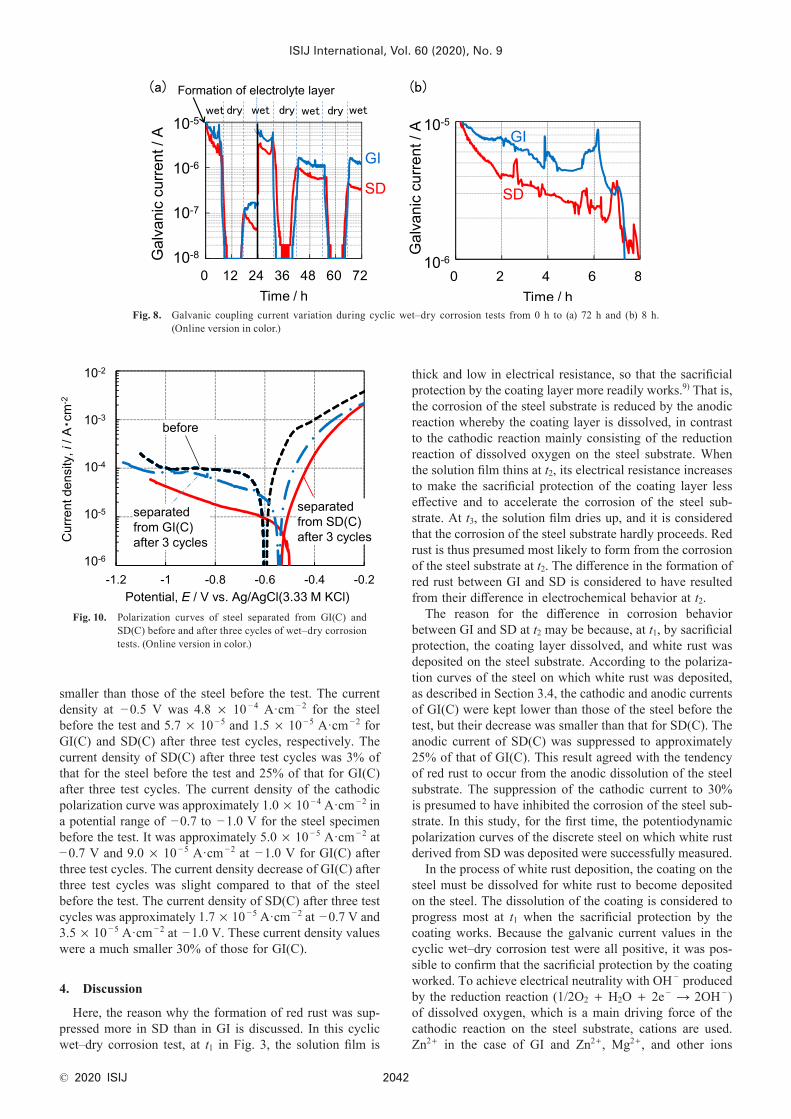
3.3. Effect of White Rust on Galvanic CurrentFigure 8 shows the measured change with time in the
galvanic current flowing between the GI(C) or SD(C) alloy and the steel. The galvanic current flowing from the steel to the GI(C) or SD(C) alloy between 0 and 72 h was positive, as shown in Fig. 8(a). As shown in Fig. 8(b), the galvanic current flowing between the SD(C) alloy and the steel was smaller than that flowing between the GI(C) alloy and the steel, beginning from cycle 1 of the test. The gal-
vanic current flowing between the SD(C) alloy and the steel decreased to approximately 30% of that flowing between the GI(C) alloy and the steel at the end of cycle 3. Figure 9 shows the surface appearance of the GI(C) alloy–steel and SD(C) alloy–steel specimens after three test cycles. In the GI(C) alloy–steel specimen, red rust was observed together with white rust, as shown Fig. 9(a). In the SD(C) alloy–steel specimen, white rust alone was observed on the steel, but red rust was not recognized, as shown in Fig. 9(b). This result was similar to the result that red rust was observed in GI but not in SD, as described in Section 3.1.
3.4. Potentiodynamic Polarization Curves of Discrete Steel with White Rust
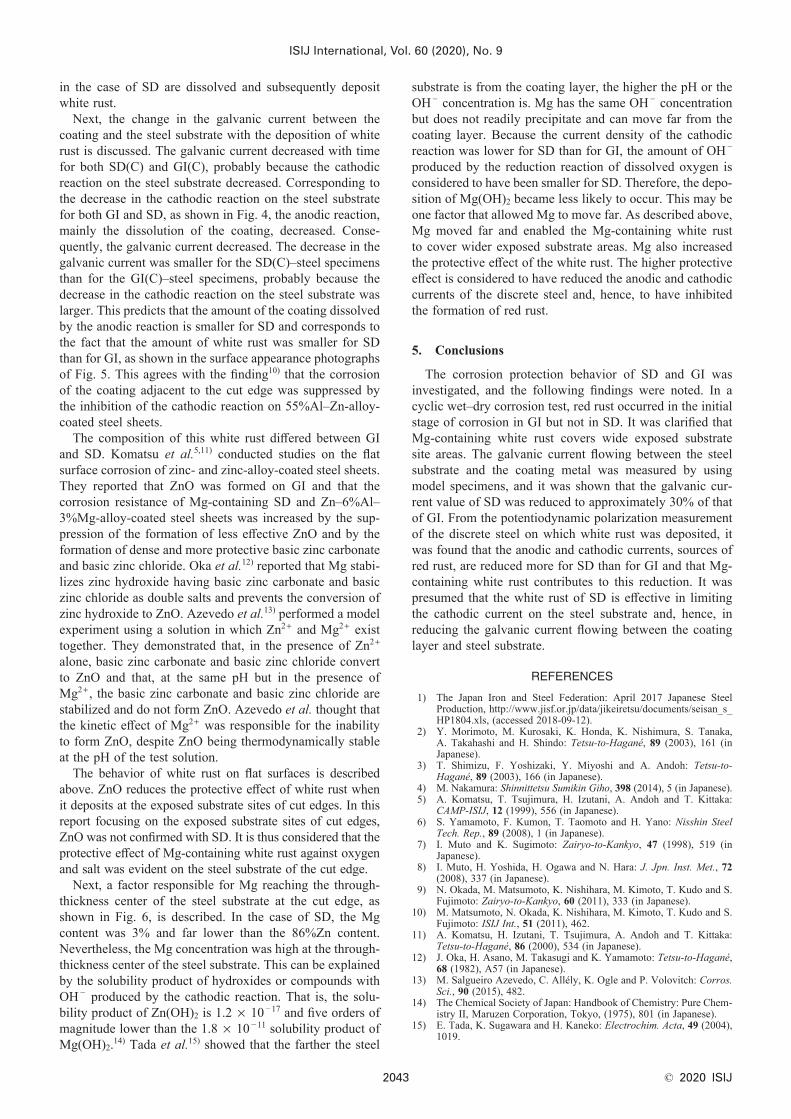
To clarify the electrochemical properties of the discrete steel on which white rust was deposited, the potentiody-namic polarization curves of the steel before the test and of the steel with white and red rust of GI(C) and the steel with white rust of SD(C) after three test cycles were measured. The results are shown in Fig. 10. The anodic polarization curves of both GI(C) and SD(C) after three test cycles were
Fig. 5. Surface appearance of (a) GI and (b) SD after cyclic wet–dry corrosion tests.
Fig. 6. EPMA images of (a) GI and (b) SD after seven cycles of wet–dry corrosion tests.
Fig. 7. XRD patterns of (a) GI and (b) SD after seven cycles of wet–dry corrosion tests. (Online version in color.)
Fig. 9. Surface appearance of galvanic coupling specimens of (a) GI(C)–steel and (b) SD(C)–steel after three cycles of wet–dry corrosion tests.
ISIJ International, Vol. 60 (2020), No. 9
© 2020 ISIJ 2042
smaller than those of the steel before the test. The current density at −0.5 V was 4.8 × 10 −4 A·cm −2 for the steel before the test and 5.7 × 10 −5 and 1.5 × 10 −5 A·cm −2 for GI(C) and SD(C) after three test cycles, respectively. The current density of SD(C) after three test cycles was 3% of that for the steel before the test and 25% of that for GI(C) after three test cycles. The current density of the cathodic polarization curve was approximately 1.0 × 10 −4 A·cm −2 in a potential range of −0.7 to −1.0 V for the steel specimen before the test. It was approximately 5.0 × 10 −5 A·cm −2 at −0.7 V and 9.0 × 10 −5 A·cm −2 at −1.0 V for GI(C) after three test cycles. The current density decrease of GI(C) after three test cycles was slight compared to that of the steel before the test. The current density of SD(C) after three test cycles was approximately 1.7 × 10 −5 A·cm −2 at −0.7 V and 3.5 × 10 −5 A·cm −2 at −1.0 V. These current density values were a much smaller 30% of those for GI(C).
4. Discussion
Here, the reason why the formation of red rust was sup-pressed more in SD than in GI is discussed. In this cyclic wet–dry corrosion test, at t1 in Fig. 3, the solution film is
thick and low in electrical resistance, so that the sacrificial protection by the coating layer more readily works.9) That is, the corrosion of the steel substrate is reduced by the anodic reaction whereby the coating layer is dissolved, in contrast to the cathodic reaction mainly consisting of the reduction reaction of dissolved oxygen on the steel substrate. When the solution film thins at t2, its electrical resistance increases to make the sacrificial protection of the coating layer less effective and to accelerate the corrosion of the steel sub-strate. At t3, the solution film dries up, and it is considered that the corrosion of the steel substrate hardly proceeds. Red rust is thus presumed most likely to form from the corrosion of the steel substrate at t2. The difference in the formation of red rust between GI and SD is considered to have resulted from their difference in electrochemical behavior at t2.
The reason for the difference in corrosion behavior between GI and SD at t2 may be because, at t1, by sacrificial protection, the coating layer dissolved, and white rust was deposited on the steel substrate. According to the polariza-tion curves of the steel on which white rust was deposited, as described in Section 3.4, the cathodic and anodic currents of GI(C) were kept lower than those of the steel before the test, but their decrease was smaller than that for SD(C). The anodic current of SD(C) was suppressed to approximately 25% of that of GI(C). This result agreed with the tendency of red rust to occur from the anodic dissolution of the steel substrate. The suppression of the cathodic current to 30% is presumed to have inhibited the corrosion of the steel sub-strate. In this study, for the first time, the potentiodynamic polarization curves of the discrete steel on which white rust derived from SD was deposited were successfully measured.
In the process of white rust deposition, the coating on the steel must be dissolved for white rust to become deposited on the steel. The dissolution of the coating is considered to progress most at t1 when the sacrificial protection by the coating works. Because the galvanic current values in the cyclic wet–dry corrosion test were all positive, it was pos-sible to confirm that the sacrificial protection by the coating worked. To achieve electrical neutrality with OH − produced by the reduction reaction (1/2O2 + H2O + 2e − → 2OH −) of dissolved oxygen, which is a main driving force of the cathodic reaction on the steel substrate, cations are used. Zn2+ in the case of GI and Zn2+ , Mg2+ , and other ions
Fig. 8. Galvanic coupling current variation during cyclic wet–dry corrosion tests from 0 h to (a) 72 h and (b) 8 h. (Online version in color.)
Fig. 10. Polarization curves of steel separated from GI(C) and SD(C) before and after three cycles of wet–dry corrosion tests. (Online version in color.)
ISIJ International, Vol. 60 (2020), No. 9
© 2020 ISIJ2043
in the case of SD are dissolved and subsequently deposit white rust.
Next, the change in the galvanic current between the coating and the steel substrate with the deposition of white rust is discussed. The galvanic current decreased with time for both SD(C) and GI(C), probably because the cathodic reaction on the steel substrate decreased. Corresponding to the decrease in the cathodic reaction on the steel substrate for both GI and SD, as shown in Fig. 4, the anodic reaction, mainly the dissolution of the coating, decreased. Conse-quently, the galvanic current decreased. The decrease in the galvanic current was smaller for the SD(C)–steel specimens than for the GI(C)–steel specimens, probably because the decrease in the cathodic reaction on the steel substrate was larger. This predicts that the amount of the coating dissolved by the anodic reaction is smaller for SD and corresponds to the fact that the amount of white rust was smaller for SD than for GI, as shown in the surface appearance photographs of Fig. 5. This agrees with the finding10) that the corrosion of the coating adjacent to the cut edge was suppressed by the inhibition of the cathodic reaction on 55%Al–Zn-alloy-coated steel sheets.
The composition of this white rust differed between GI and SD. Komatsu et al.5,11) conducted studies on the flat surface corrosion of zinc- and zinc-alloy-coated steel sheets. They reported that ZnO was formed on GI and that the corrosion resistance of Mg-containing SD and Zn–6%Al–3%Mg-alloy-coated steel sheets was increased by the sup-pression of the formation of less effective ZnO and by the formation of dense and more protective basic zinc carbonate and basic zinc chloride. Oka et al.12) reported that Mg stabi-lizes zinc hydroxide having basic zinc carbonate and basic zinc chloride as double salts and prevents the conversion of zinc hydroxide to ZnO. Azevedo et al.13) performed a model experiment using a solution in which Zn2+ and Mg2+ exist together. They demonstrated that, in the presence of Zn2+ alone, basic zinc carbonate and basic zinc chloride convert to ZnO and that, at the same pH but in the presence of Mg2+ , the basic zinc carbonate and basic zinc chloride are stabilized and do not form ZnO. Azevedo et al. thought that the kinetic effect of Mg2+ was responsible for the inability to form ZnO, despite ZnO being thermodynamically stable at the pH of the test solution.
The behavior of white rust on flat surfaces is described above. ZnO reduces the protective effect of white rust when it deposits at the exposed substrate sites of cut edges. In this report focusing on the exposed substrate sites of cut edges, ZnO was not confirmed with SD. It is thus considered that the protective effect of Mg-containing white rust against oxygen and salt was evident on the steel substrate of the cut edge.
Next, a factor responsible for Mg reaching the through-thickness center of the steel substrate at the cut edge, as shown in Fig. 6, is described. In the case of SD, the Mg content was 3% and far lower than the 86%Zn content. Nevertheless, the Mg concentration was high at the through-thickness center of the steel substrate. This can be explained by the solubility product of hydroxides or compounds with OH − produced by the cathodic reaction. That is, the solu-bility product of Zn(OH)2 is 1.2 × 10 −17 and five orders of magnitude lower than the 1.8 × 10 −11 solubility product of Mg(OH)2.14) Tada et al.15) showed that the farther the steel
substrate is from the coating layer, the higher the pH or the OH − concentration is. Mg has the same OH − concentration but does not readily precipitate and can move far from the coating layer. Because the current density of the cathodic reaction was lower for SD than for GI, the amount of OH − produced by the reduction reaction of dissolved oxygen is considered to have been smaller for SD. Therefore, the depo-sition of Mg(OH)2 became less likely to occur. This may be one factor that allowed Mg to move far. As described above, Mg moved far and enabled the Mg-containing white rust to cover wider exposed substrate areas. Mg also increased the protective effect of the white rust. The higher protective effect is considered to have reduced the anodic and cathodic currents of the discrete steel and, hence, to have inhibited the formation of red rust.
5. Conclusions
The corrosion protection behavior of SD and GI was investigated, and the following findings were noted. In a cyclic wet–dry corrosion test, red rust occurred in the initial stage of corrosion in GI but not in SD. It was clarified that Mg-containing white rust covers wide exposed substrate site areas. The galvanic current flowing between the steel substrate and the coating metal was measured by using model specimens, and it was shown that the galvanic cur-rent value of SD was reduced to approximately 30% of that of GI. From the potentiodynamic polarization measurement of the discrete steel on which white rust was deposited, it was found that the anodic and cathodic currents, sources of red rust, are reduced more for SD than for GI and that Mg-containing white rust contributes to this reduction. It was presumed that the white rust of SD is effective in limiting the cathodic current on the steel substrate and, hence, in reducing the galvanic current flowing between the coating layer and steel substrate.
REFERENCES
1) The Japan Iron and Steel Federation: April 2017 Japanese Steel Production, http://www.jisf.or.jp/data/jikeiretsu/documents/seisan_s_HP1804.xls, (accessed 2018-09-12).
2) Y. Morimoto, M. Kurosaki, K. Honda, K. Nishimura, S. Tanaka, A. Takahashi and H. Shindo: Tetsu-to-Hagané, 89 (2003), 161 (in Japanese).
3) T. Shimizu, F. Yoshizaki, Y. Miyoshi and A. Andoh: Tetsu-to-Hagané, 89 (2003), 166 (in Japanese).
4) M. Nakamura: Shinnittetsu Sumikin Giho, 398 (2014), 5 (in Japanese).5) A. Komatsu, T. Tsujimura, H. Izutani, A. Andoh and T. Kittaka:
CAMP-ISIJ, 12 (1999), 556 (in Japanese).6) S. Yamamoto, F. Kumon, T. Taomoto and H. Yano: Nisshin Steel
Tech. Rep., 89 (2008), 1 (in Japanese).7) I. Muto and K. Sugimoto: Zairyo-to-Kankyo, 47 (1998), 519 (in
Japanese).8) I. Muto, H. Yoshida, H. Ogawa and N. Hara: J. Jpn. Inst. Met., 72
(2008), 337 (in Japanese).9) N. Okada, M. Matsumoto, K. Nishihara, M. Kimoto, T. Kudo and S.
Fujimoto: Zairyo-to-Kankyo, 60 (2011), 333 (in Japanese).10) M. Matsumoto, N. Okada, K. Nishihara, M. Kimoto, T. Kudo and S.
Fujimoto: ISIJ Int., 51 (2011), 462.11) A. Komatsu, H. Izutani, T. Tsujimura, A. Andoh and T. Kittaka:
Tetsu-to-Hagané, 86 (2000), 534 (in Japanese).12) J. Oka, H. Asano, M. Takasugi and K. Yamamoto: Tetsu-to-Hagané,
68 (1982), A57 (in Japanese).13) M. Salgueiro Azevedo, C. Allély, K. Ogle and P. Volovitch: Corros.
Sci., 90 (2015), 482.14) The Chemical Society of Japan: Handbook of Chemistry: Pure Chem-
istry II, Maruzen Corporation, Tokyo, (1975), 801 (in Japanese).15) E. Tada, K. Sugawara and H. Kaneko: Electrochim. Acta, 49 (2004),
1019.