Embed Size (px)
Citation preview

1
Mechanism of Interferon-gamma mediated down-regulation of Interleukin-10
gene expression
Annette Schaefer1, Claudia Unterberger
2, Marion Frankenberger
2, Marion Lohrum
3,
Karl J Staples1,6
, Thomas Werner4, Henk Stunnenberg
3, Loems Ziegler-Heitbrock
1,2,5
1 Department of Infection, Immunity and Inflammation, University of Leicester, UK,
2 Clinical Cooperation Group „Inflammatory Lung Diseases“, Asklepios-Fachklinik
and Helmholtz Zentrum München, German Research Center for Environmental
Health, Gauting, Germany 3 Department of Molecular Biology, Nijmegen Centre for
Molecular Life Sciences, Nijmegen, The Netherlands
4 Genomatix Software GmbH, München, Germany
5 to whom correspondence should be addressed at Clinical Cooperation Group
„Inflammatory Lung Diseases“, Robert-Koch-Allee 29, 82131 Gauting, Germany
e-mail: [email protected]
6Current address: Division of Infection, Inflammation & Repair, University of
Southampton, Southampton, UK
Abbreviations
Stat = signal transducer and activator of transcription
ChIP = chromatin-immuno-precipitation
IFN = Interferon-gamma

2
Abstract
Expression of the anti-inflammatory cytokine IL-10 is suppressed by the pro-
inflammatory interferon but the mechanism of this action is unknown. We analysed
activity of IL-10 promoter luciferase reporter constructs in transfected RPMI 8226.1
B cells that were treated at –2h with IFN (1000U/ml) followed by stimulation with
LPS (100 ng/ml) at 0h. IFN treatment suppressed LPS-induced IL-10 promoter
activity in a construct carrying the –1044 promoter and also one containing the –195
promoter. The suppression was independent of the IRF-motif at –182 but involved the
Stat-motif at –120. In gelshift analysis this Stat motif did bind LPS-induced Stat3 and
with IFN treatment it did, in addition, bind Stat1. ChIP analysis for detection of
transcription factor binding to chromatin in intact cells demonstrated Stat3 binding to
the proximal IL-10 promoter when cells are stimulated with LPS only. Treatment with
IFN only led to Stat1 binding in ChIP analysis and treatment with IFN plus LPS led
to reduced Stat3 binding while Stat1 binding remained high. Finally, LPS-induced
activity of the trimeric Stat-motif in front of the luciferase reporter was suppressed by
IFN . These data demonstrate that IFN down-regulates expression of the IL-10 gene
by a novel mechanism that involves displacement of transactiving Stat3 by IFN -
induced Stat1.
3
Introduction
IL-10 is a major immunosuppressive cytokine produced by T-cells, B-cells, dendritic
cells and monocytes / macrophages (Fiorentino et al., 1989) (de Waal Malefyt et al.,
1992) (Chang et al., 2000). The immunosuppressive activity of IL-10 is highlighted
by the findings that IL-10 knock-out mice show spontaneous autoimmune disease and
increased resistance to infection (Bettelli et al., 1998) (Dai et al., 1997).
IL-10 acts by binding to the IL-10R1 / IL-10R2 receptor complex, which recruits the
kinases Jak1 and Tyk2 and these then phosphorylate and activate Stat3 and -1
transcription factors (Donnelly et al., 1999) (Williams et al., 2004). IL-10 can
suppress the immune response via this signalling cascade by decreasing cell surface
expression of MHC class II and by down-regulating the expression of cytokines like
TNF (de Waal Malefyt et al., 1991). Stat3 appears to be the dominant factor that
mediates IL-10 action but how this leads to down-regulation of genes like TNF is still
unknown (Williams et al., 2004).
Changes in the expression of IL-10 upon activation of leukocytes are mainly
transcriptional and several factors have been implicated in its control. For the murine
IL-10 gene an important role of Sp1 in regulating the LPS-stimulated promoter
activity was reported (Brightbill et al., 2000). The respective motif is promoter
proximal and its mutation reduced both the inducible and the constitutive promoter
activity in the murine RAW 264 macrophage cell line (Brightbill et al., 2000) (Tone et
al., 2000). Ma et al. (Ma et al., 2001a) noted a Sp1 site at –636 bp of the human
promoter, which appeared to be responsible for all the inducible activity in
monoblastic cells. For the human gene, transactivation by catecholamines appears to
require the action of C/EBP (Brenner et al., 2003) and the most important motif
TTGCAAAA, which is 44 bp downstream of the TATA box. Furthermore, there is
evidence for a role of c-Maf in IL-10 gene expression, but c-Maf may act indirectly
by activating other transcription factors (Cao et al., 2002).
Based on deletion and linker scanning analysis we have identified a Stat motif at –120
that is crucial to gene expression in a human B cell line when stimulated with LPS
(Benkhart et al., 2000). This motif was also shown to be essential together with an up-
stream IRF site for IFN -induced IL-10 expression (Ziegler-Heitbrock et al., 2003).
These data are in conflict with earlier findings of Takeda (Takeda et al., 1999), who

4
found increased IL-10 in Stat3 knock-out animals. The role of Stat3 in IL-10 gene
expression was, however, confirmed in other cell lines and in knock-out mice
(Herbeuval et al., 2004) (Cheng et al., 2003) (Maritano et al., 2004). Recently it was
shown that SOCS3 deficiency in murine TCR-stimulated T cells led to increased Stat3
activity and IL-10 expression (Kinjyo et al., 2006). Furthermore, constitutive IL-10
expression in T cell lines can be blocked by depletion of Stat3 by RNA interference
(Kasprzycka et al., 2006). Hence it appears that the Stat-motif in the human IL-10
gene may be a central trans-element in regulation of this gene.
Expression of the IL-10 gene is controlled by interferons, in that IFNα induces IL-10
while IFN can downregulate IL-10 gene expression (Ziegler-Heitbrock et al., 2003).
(Chomarat et al., 1993). When looking at the molecular mechanism, the induction by
IFNα was shown to regulated via a IRF-Stat module in the IL-10 promoter (Ziegler-
Heitbrock et al., 2003). For IFN mediated suppression of gene expression various
mechanisms have been proposed including suppression of Sp3 (Hughes et al., 2002)
or down-regulation of C/EBP (Tengku-Muhammad et al., 2000). The main
transcription factor used by IFN is Stat1 (Schroder et al., 2004). We have shown
earlier that over-expression of Stat1 will counter the activation of the human IL-10
promoter (Ziegler-Heitbrock et al., 2003). In the present report we demonstrate that
IFN -induced Stat1 will compete with and displace Stat3 from the endogenous human
IL-10 promoter thus leading to suppression of IL-10 gene expression.

5
Material and Methods
Cell culture and stimulation
The RPMI 8226.1 B cell line (Ziegler-Heitbrock et al., 1994) was grown in 75 cm2
tissue culture flasks (Greiner, Gloucestershire, UK) in RPMI 1640 medium
(Biochrom KG/seromed®, Berlin, Germany) supplemented with 200 U/ml penicillin,
200 µg/ml streptomycin (15140-122, Gibco, Paisley, UK), 2 mM L-glutamine
(25030-024, Gibco), 10 x non-essential amino acids (K 0293, Biochrom KG), 1 mM
oxal-acetate, 1 mM pyruvate and 9 µg/ml insulin (O-5003, Sigma-Aldrich, Dorset,
UK). This medium was passed through a Gambro U-2000 ultrafiltration column
(Gambro Medizintechnik GmbH, Planegg-Martinsried, Germany) to deplete
contaminating LPS, followed by the addition of 10 % v/v low LPS fetal calf serum
(Biochrom). Cells were pre-treated with IFN at 1000 U/ml (generously provided by
Dr. Wieland Wolf, Rentschler Biotechnologie, Laupheim, Germany) and were
stimulated with highly purified LPS from Salmonella minnesota (L-6261, Sigma-
Aldrich) at 100 ng/ml unless stated otherwise.
ELISA for IL-10 protein
ELISA was performed using the human IL-10 ELISA system (BMS215/2, Bender
MedSystems, Vienna, Austria) according to the manufacturer’s instructions. In brief,
cell culture supernatants were added to wells with pre-coated anti-IL-10 antibody and
biotin-conjugated anti-IL-10 was added, followed by streptavidin-HRP and substrate.
Readings at 450 nm were transformed into pg/ml with reference to recombinant IL-10
standard titration.
RT-PCR analysis of gene expression
For mRNA isolation, 5 x 10⁶ cells were lysed with 1 ml of Tri-Reagent (T9424,
Sigma-Aldrich) and processed according to manufacturer’s instructions. After
addition of chloroform and centrifugation the aqueous upper phase was recovered and
mRNA was precipitated with isopropanol, washed with 75% v/v ethanol and
dissolved in water. Reverse transcription was done using 1st Strand cDNA Synthesis
Kit for RT-PCR (1483188, Roche, East Sussex, UK) with AMV RT and
hexanucleotide primers (Amersham Pharmacia, Buckinghamshire, UK) in the
presence of nucleotides and RNAsin according to the manufacturer’s instructions. The

6
cDNA was then used for PCR with the LightCycler-FastStart DNA Master SYBR
Green I (3003230, Roche) in a LightCycler (Roche). IL-10 amplification was carried
out in parallel with amplification of the housekeeping gene -2-microglobulin for
normalisation. Primers used for IL-10 amplification were sense 5’-GCC TAA CAT
GCT TCG AGA TC-3’, antisense 5’-TGA TGT CTG GGT CTT GGT TC-3’
amplifying a 207 bp fragment. The primers used for -2-microglobulin amplification
were sense 5’-GGC TAT CCA GCG TAC TCC AAA-3’ and antisense 5’-CAA CTT
CAA TGT CGG ATG GAT G-3’ amplifying a 116 bp fragment. The PCR conditions
were as follows: initial denaturation at 95 C for 10 min; then cycles of 96 C for 10 s,
60 C for 10 s, 72 C for 25 s. mRNA expression levels of IL-10 were normalized to
the expression levels of -2-microglobulin.
Transfection of RPMI 8226 with reporter plasmids and luciferase assay
Promoter luciferase reporter plasmids used were a construct containing –1044 bp
upstream of the IL-10 transcription start (pIL-10 (-1044).luci), a construct containing
–195 bp upstream of the IL-10 transcription start (pIL-10 (-195).luci, the same
construct with a mutation of the IRF-site (pIL-10(-195 IRFmut).luci) and a construct
with a trimer of the –120 Stat-site of the IL-10 promoter (p3xLS4.luci) as described in
(Benkhart et al., 2000) and (Ziegler-Heitbrock et al., 2003).
RPMI 8226.1 cells were transfected according to (Shakhov et al., 1990). In brief, 107
cells in 1 ml RPMI 1640 medium supplemented with 2 mM L-glutamine were
admixed with 5 μg reporter gene plasmid and 125 μg/ml DEAE-Dextran (E1210,
ProFection, Promega, Southampton, UK). After 90 min at 37 C, we added 100 μl of
DMSO (D-5879, Sigma-Aldrich) for 150 sec. Cells were then washed and cultured for
4 days in 6 well plates.
Cells were treated with 1000 U/ml IFN and 100 ng/ml LPS and cell lysates were
prepared 6 h after LPS treatment using Luciferase Assay System (E1500, Promega),
ReportaLightTM
Reporter Gene Detection Kit (LT07-316, BioWhittaker, Berkshire,
UK) or Enhanced Luciferase Assay Kit (Berthold Detection Systems, Pforzheim,
Germany) according to the manufacturer’s instructions. Luciferase activity was
determined in a Berthold LB 9501 luminometer and the RLU/μg protein was
calculated for each lysate. Protein concentration of each lysate was determined using
BioRad DC Protein Assay Reagents (500-0116).
7
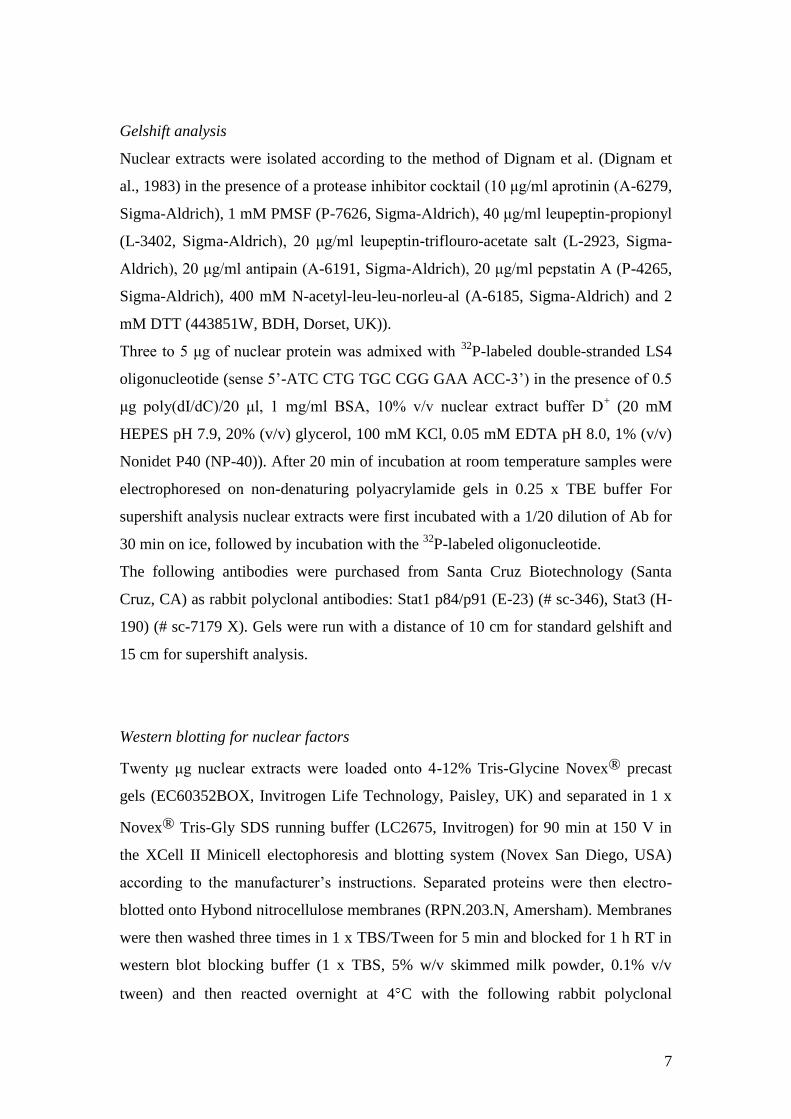
Gelshift analysis
Nuclear extracts were isolated according to the method of Dignam et al. (Dignam et
al., 1983) in the presence of a protease inhibitor cocktail (10 μg/ml aprotinin (A-6279,
Sigma-Aldrich), 1 mM PMSF (P-7626, Sigma-Aldrich), 40 μg/ml leupeptin-propionyl
(L-3402, Sigma-Aldrich), 20 μg/ml leupeptin-triflouro-acetate salt (L-2923, Sigma-
Aldrich), 20 μg/ml antipain (A-6191, Sigma-Aldrich), 20 μg/ml pepstatin A (P-4265,
Sigma-Aldrich), 400 mM N-acetyl-leu-leu-norleu-al (A-6185, Sigma-Aldrich) and 2
mM DTT (443851W, BDH, Dorset, UK)).
Three to 5 μg of nuclear protein was admixed with 32
P-labeled double-stranded LS4
oligonucleotide (sense 5’-ATC CTG TGC CGG GAA ACC-3’) in the presence of 0.5
μg poly(dI/dC)/20 μl, 1 mg/ml BSA, 10% v/v nuclear extract buffer D+ (20 mM
HEPES pH 7.9, 20% (v/v) glycerol, 100 mM KCl, 0.05 mM EDTA pH 8.0, 1% (v/v)
Nonidet P40 (NP-40)). After 20 min of incubation at room temperature samples were
electrophoresed on non-denaturing polyacrylamide gels in 0.25 x TBE buffer For
supershift analysis nuclear extracts were first incubated with a 1/20 dilution of Ab for
30 min on ice, followed by incubation with the 32
P-labeled oligonucleotide.
The following antibodies were purchased from Santa Cruz Biotechnology (Santa
Cruz, CA) as rabbit polyclonal antibodies: Stat1 p84/p91 (E-23) (# sc-346), Stat3 (H-
190) (# sc-7179 X). Gels were run with a distance of 10 cm for standard gelshift and
15 cm for supershift analysis.
Western blotting for nuclear factors
Twenty μg nuclear extracts were loaded onto 4-12% Tris-Glycine Novex® precast
gels (EC60352BOX, Invitrogen Life Technology, Paisley, UK) and separated in 1 x
Novex® Tris-Gly SDS running buffer (LC2675, Invitrogen) for 90 min at 150 V in
the XCell II Minicell electophoresis and blotting system (Novex San Diego, USA)
according to the manufacturer’s instructions. Separated proteins were then electro-
blotted onto Hybond nitrocellulose membranes (RPN.203.N, Amersham). Membranes
were then washed three times in 1 x TBS/Tween for 5 min and blocked for 1 h RT in
western blot blocking buffer (1 x TBS, 5% w/v skimmed milk powder, 0.1% v/v
tween) and then reacted overnight at 4 C with the following rabbit polyclonal

8
antibodies from Santa Cruz: Stat1 p84/p91 (E-23) (sc-346), p-Stat1 (Tyr701) (sc-
7988-R), Stat3 (C-20) (sc-482), p-Stat3 (Tyr 705) (sc79993-R), RNA polymerase II
(N20) (sc-899) overnight at 4 C. Membranes were washed followed by incubation
with horse-radish peroxidase conjugated anti-Ig antibody (A-0545, Sigma). Finally,
filters were incubated with ECLTM
western blotting detection reagents (RPN2106,
Amersham) and chemiluminescence was detected by exposure to x-ray film.
Chromatin immunoprecipitation
For ChIP 108
cells were resuspended in 1 x PBS with 1% v/v formaldehyde and
incubated for 20 min at RT to cross-link the protein to the DNA. The reaction was
stopped by addition of glycine to 0.125 M final concentration. The cells were washed
twice in 1 x PBS and lysed for 10 min on ice with a protease inhibitor containing lysis
buffer (50 mM Tris/HCl pH 8.0, 10 mM EDTA pH 8.0, 1% w/v SDS). All buffers
used in ChIP were supplemented with a protease-inhibitor cocktail of 1 mM PMSF, 1
μg/ml leupeptin-propionyl, 1 μg/ml leupeptin-triflouro-acetate salt, 1 μg/ml aprotinin,
0.1 μg/ml antipain. The chromatin was sheared by sonication of the samples 4 times
for 15 s using a Soniprep 150 sonicator (Sanyo, Leicestershire, UK) at a setting of 10
microns, with 1 min incubation on ice between each sonication. Supernatants were
precleared by incubation for 30 min at 4 C with 10 μl each of sepharose A beads
(50% slurry) (17-0780-01, Amersham) and protein G beads (P-3296, Sigma-Aldrich).
Next, the supernatants were diluted 1:2 with dilution buffer (0.01% SDS, 1% Triton,
1.2 mM EDTA pH 8.0, 16.7 mM Tris/HCl pH 8.0, 167 mM NaCl) and
immunoprecipitated overnight at 4 C with antibodies against transcription factors
Stat3 (sc-482, Santa Cruz) or Stat1 (sc-346, Santa Cruz). Rabbit IgG (sc-2027, Santa
Cruz) was used to control for non-specific binding. This material was then admixed
with protein A and G sepharose beads for 2 h at 4 C followed by sequentially
washing of the beads twice with dilution buffer (0.01% w/v SDS, 1% v/v Triton, 1.2
mM EDTA pH 8.0, 16.7 mM Tris/HCl pH 8.0, 167 mM NaCl), twice with wash
buffer 1 (2 mM EDTA pH 8.0, 20 mM Tris/HCl pH 8.0, 1% v/v Triton, 0.1% w/v
SDS, 150 mM NaCl) and twice with wash buffer 3 (10 mM Tris/HCl pH 8.0, 1 mM
EDTA pH 8.0). The bead pellet was then resuspended twice in elution buffer (1% w/v
SDS, 0.1 M NaHCO3), the supernatant material was pooled and decrosslinked in the

9
presence of 0.2 M NaCl for 4 h at 65 C. DNA was isolated by phenol/chloroform
extraction following classical procedures and used for PCR amplification.
Amplification of the IL-10 promoter fragment using SYBR®Green Taq ReadyMix™
(S 1816, Sigma-Aldrich) was carried out in a LightCycler (Roche) with the primers
sense 5’-GCA GAA GTT CAT GTT CAA CCA A-3’ and antisense 5’-AGG CCT
CTT CAT TCA TTA AAA A-3’ amplifying a 152 bp fragment. The PCR conditions
were as follows: initial denaturation at 95 C for 10 min; then cycles of 96 C for 10 s,
60 C for 10 s, 72 C for 25 s. All PCR signals from immunoprecipitated DNA were
normalized to PCR signals from non-immunoprecipitated input DNA. The signals
obtained with precipitation with the control IgG was subtracted from the signals
obtained with the specific anti-Stat antibodies. Results are expressed as percentage of
the input.
Bioinformatic analysis
Analysis of mouse promoters for the combined STAT3/STAT1 motif as found in the
human IL10 promoter was carried out as follows (All tools were used as provided on
the GenomatixPortal, Genomatix, Munich unless other wise stated): The human
promoter was analyzed for STAT3 and STAT1 motifs using a weight matrix based
approach (MatInspector, GEMS launcher release 4.2.2). Results were used to define a
promoter model using the FASTM tool (GEMS launcher release 4.2.2). The distance
between the two STAT binding sites found in the human IL-10 promoter was 2 and
was set to a range of 2 – 5 in the model. Recognition of the human IL-10 motif was
verified using ModelInspector (GEMS launcher release 4.2.2). Then the promoters of
genes identified in the microarray study (29) as significantly downregulated (>3) were
analyzed for matches of this model as well as the whole database of mouse promoters
(ElDorado, release 4.1).
Statistical analysis
Data were analysed using one-tailed paired Student’s T-test. Results were considered
significant when *p<0.05.

10
Results
Effect of IFN on IL-10 mRNA and protein
In order to demonstrate that the effect of IFN on the IL-10 promoter will lead to
reduced mRNA synthesis we performed RT-PCR in cells at 6hs post LPS stimulation.
Data in Figure 1 A demonstrate a reduction of IL-10 mRNA by factor 2 when cells
were pretreated with IFN for 2hs followed by LPS stimulation for 6 hours. Also, IL-
10 protein levels were significantly reduced with IFNγ pre-treatment at 18hs post LPS
stimulation (Figure 1 B).
Effect of IFNγ pre-treatment on IL-10 promoter activity
For the study of the IL-10 promoter activity we transfected RPMI 8226 cells with the
pIL-10(-1044).luci plasmid using DEAE Dextran. Cells were then stimulated with
LPS and this led to an average 10-fold increase of luciferase activity (see lane 3 and
lane 1 in Figure 2). When IFN was added at the same time as LPS then the promoter
activity was significantly reduced but the strongest effect with a > 2-fold reduction
was seen when IFN was added 2 hours before stimulation with LPS (lane 4, Figure
2). We therefore chose the –2h addition of IFN for all further experiments. Of note,
when IFN alone was added at time 0 it did induce a 2-fold increase of the low level
promoter activity (lane 2 versus 1, Figure 2).
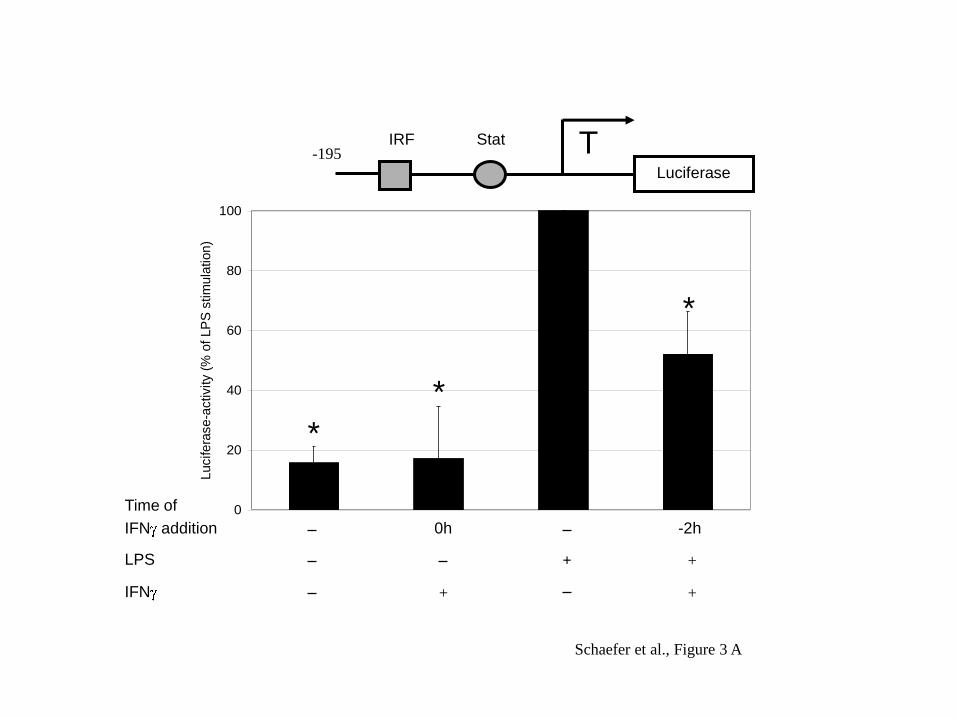
Next we analysed whether a shorter proximal fragment of the human IL-10 promoter
would give a similar suppressive effect of IFN . Transfection of the cells with a –195
bp fragment of the IL-10 promoter in the luciferase reporter construct also showed
robust induction by LPS and a clear suppression with addition of IFN (Figure 3A).
The –195 bp fragment contains an IRF and a Stat binding motif as indicated in the
promoter scheme in the upper part of Figure 3. The Stat site is required for LPS
induced transactivation as shown previously (Benkhart et al., 2000) and the IRF site
contributes to IFNα induction of the promoter (Ziegler-Heitbrock et al., 2003).
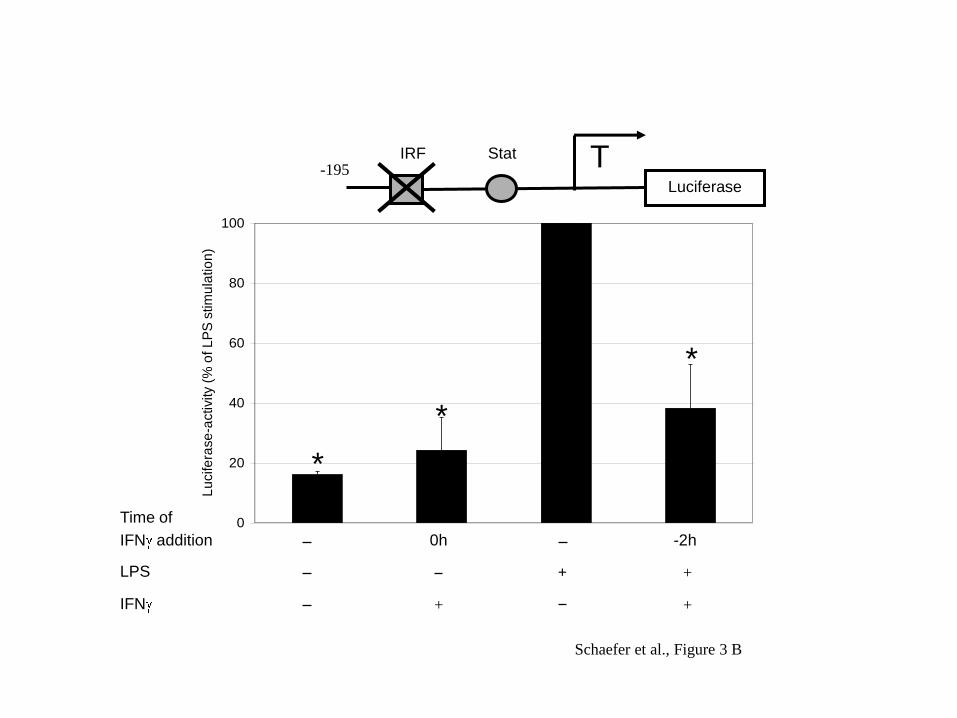
Mutation of the IRF-motif did not affect the ability of IFN to suppress the IL-10
promoter activity (Figure 3B, lane 4) indicating that IFN is not acting via this site.

11
The role of the Stat-site could not be tested by the mutation approach since mutation
would ablate the LPS signal, such that there would be no activity to be suppressed.
We therefore turned to a construct carrying a trimer of the Stat motif from the IL-10
promoter. Using this construct IFN could also suppress the LPS-induced promoter
activity albeit to a lesser extent (lane 4, Figure 3C). These data suggests that the
suppressive effect of IFN on the human IL-10 promoter may operate via the Stat site.
Taken together, it appears that the regulation of the IL-10 gene by IFN operates via
the –120 Stat site.
Effect of IFN on activation of Stat1 and Stat3
We then analysed the effect of IFN on phosphorylaton and mobilisation of Stat 1 and
Stat3. Analysis of Stat1 in nuclear extracts of RPMI 8226 cells revealed tyrosine
phosphorylation of Stat1 α by IFN treatment (Figure 4A, upper panel, lane 2), while
LPS alone did not affect tyrosine-phosphorylation of any Stat1 protein (lane 3). By
contrast, both Stat1 α and Stat1 were tyrosine phosphorylated when cells were
treated with both LPS and IFN (Figure 4A, upper panel, lane 4). Total Stat1 protein
in the nucleus also was increased most clearly upon treatment with both LPS and
IFN (Figure 4A, middle panel, lane 4).
Analysis of Stat3 revealed a robust tyrosine phosphorylation with LPS and this was
enhanced by co-treatment with IFN (Figure 4B, upper panel, lane 3 and 4). This
translated into an increased nuclear translocation of total Stat3 protein (Figure 4B,
middle panel, lane 3 and 4).
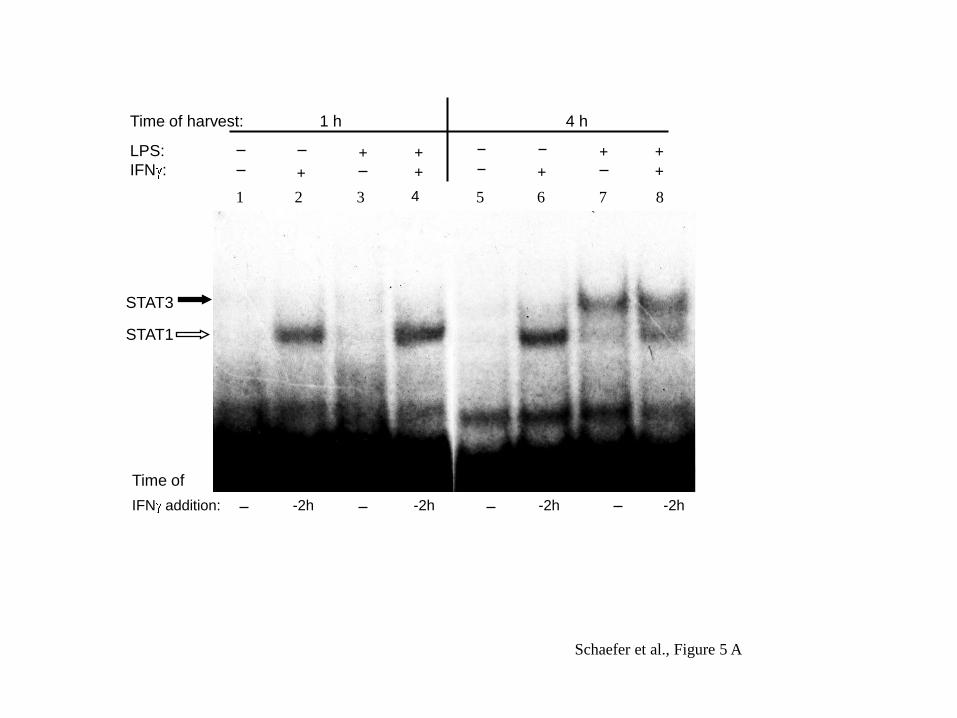
We then asked whether the same pattern would be seen when analysing DNA binding
activity. For this we performed gelshift analysis using the radiolabelled Stat motif
from the human IL-10 promoter. This motif was reacted with nuclear extracts of
RPMI 8226 cells taken at 1 and 4 hours post LPS stimulation as given in the left and
right panel, respectively, of Figure 5A.
These studies revealed that Stat1 binding was induced only by IFN (lanes 2 and 6 in
Figure 5A) but not by LPS. The clear DNA binding induced for Stat1 by IFN alone
suggests that the faint signal, seen in Figure 4A, upper panel, for IFN alone with
respect to tyrosine phosphorylation, is functionally relevant.

12
DNA binding of Stat3 was induced by LPS and not by IFN and as reported earlier
(14), this was seen most clearly after 4 hours of stimulation (Figure 5A, right panel).
The nature of the two DNA binding proteins was confirmed by supershift analysis.
Here the low motility upper band was shown to be Stat3 and the high motility lower
band was demonstrated to be Stat1 (Figure 5B).
This pattern of DNA binding for Stat1 and Stat3, induced by IFN and LPS treatment,
matches the tyrosine phosphorylation pattern seen in the Western blots (Figure 4).
The crucial finding of the gel shift analysis is seen in lane 8 of Figure 5A, right panel,
where with the combination of IFN treatment and LPS stimulation there is binding of
both LPS induced Stat3 and IFN induced Stat 1 to the motif. This suggests that the
IFN induced Stat1 might be competing with the LPS induced Stat3 for binding to the
–120 Stat motif of the human IL-10 promoter.
Effect of IFN on binding of Stat1 and Stat3 in the intact nucleus
We then performed ChIP analysis in order to investigate whether the Stat1 and 3
proteins, in fact, compete for binding to the promoter. PCR of a DNA fragment
encompassing the Stat-motif confirmed the calculated size of 152 bp. Precipitation
with anti-Stat3 antibody revealed good induction of Stat3 binding by LPS (lane 3 in
Figure 6A). When cells were pretreated with IFN then binding of Stat3 was
substantially reduced (lane 4, Figure 6A). A gel of the ChIP samples run with samples
taken at 30 cycles does support the findings in that the strongest band is visible in LPS
treated cells (Fig6B). Considering that tyrosine phosphorylated Stat3 is higher in
IFN /LPS cells than in LPS alone cells (Figure 4B, lane 4), the lower binding in ChIP
supports the concept that the abundantly available phosphorlylated Stat3 is prevented
from binding by a mechanism like competition.
When looking at ChIP for Stat1 we observed binding of this transcription factor in
IFN but not by LPS treated cells (Fig 6 C, lane 2 and 3). When cells were treated
with IFN plus LPS then Stat1 binding was increased further (Fig 6C, lane 4). Again
these quantitative PCR analyses are supported by an analysis of the 32 cycle products
in a gel (Fig 6 D). These ChIP analyses suggest that IFN treatment induces Stat1
binding, which displaces LPS induced Stat3 from the IL-10 promoter.

13
Discussion
While IFN will enhance various immune defence mechanisms (Boehm et al., 1997),
it also can suppress elements of the immune response. This includes the anti-
inflammatory cytokine IL-10, which is studied herein. The suppression of IL-10 by
IFN will thus contribute to the pro-inflammatory action of IFN (Chomarat et al.,
1993).
We have studied in this report the molecular mechanisms of IFN suppression of IL-
10 gene expression by looking at the transcriptional control of the IL-10 promoter. In
addition to histone acetylation and remodelling of the chromatin at the IL-10 locus
(Shoemaker et al., 2006) (Saraiva et al., 2005) several transcription factors have been
implicated in the expression of the IL-10 gene and this includes SP1 and c/EBP
(Brightbill et al., 2000) (Tone et al., 2000) (Ma et al., 2001a) (Brenner et al., 2003)
(Liu et al., 2003). We have provided evidence for a role for Stat3 in driving the
human IL-10 promoter in cells stimulated with LPS (Benkhart et al., 2000) (Ziegler-
Heitbrock et al., 2003). This is supported by data from Cheng et al, who found
absence of IL-10 expression in peritoneal macrophages of Stat3 knock-out mice
(Cheng et al., 2003) and by Maritano et al who showed reduced IL-10 in Stat3b
knock-out mice (Maritano et al., 2004). Furthermore, a role for Stat3 in IL-10
expression was demonstrated in murine and human T cells (Kinjyo et al., 2006)
(Kasprzycka et al., 2006).
Also, studies in human carcinoma cells showed that IL-6 induced IL-10 via the Stat3
transcription factor (Herbeuval et al., 2004). Finally, IRF transcription factors are
involved in expression of the gene in cells stimulated with IFN α (Ziegler-Heitbrock
et al., 2003).
IFN acts via a hetero-dimeric cell surface receptor consisting of one IFNGR1 and
one IFNGR2. Ligand binding induces formation of an IFNGR hetero-tetramer
followed by activation of JAK-1 leading to phosphorylation, dimerization and
translocation of Stat1 (for review see (Schroder et al., 2004)). Additional transcription
factor complexes induced are Stat1-Stat2 heterodimers and complexes of Stat1-Stat1
and Stat1-Stat2 with IRF9, the latter complex also termed ISGF3. Furthermore, IRF-1
is transcriptionally induced. Still, Stat1 appears to be the dominant nuclear factor that

14
mediates IFN action, since Stat1-/-
are a phenocopy of the IFN-/-
mice (Schroder et
al., 2004).
Provided that IFN acts at the level of transcription, then it might block IL-10
expression by interference with any of these transcription factors. For the lipoprotein
lipase gene IFN -induced suppression was shown to go along with a reduction in the
level of SP3 leading to reduced SP1/SP3 binding to respective motifs in the promoter
(Hughes et al., 2002). Also, IFN was shown to be able to down-regulate C/EBPα
(Tengku-Muhammad et al., 2000). Our previous studies (Benkhart et al., 2000) have,
however, shown that these factors are not involved in the regulation of this gene in
LPS stimulated human RPMI 8226.1 B cells. Hence, a direct action of IFN induced
Stat1 on the target gene is likely.
IFN was shown to down-regulate the IL-1 gene in murine macrophages but it was
unable to do so in Stat1-/-
animals (De Boer et al., 2001). Furthermore, IFN
suppresses MMP-9 via Stat1 (Ma et al., 2001b) and this appears to be due to
sequestration of CBP/p300 such that this coactivator is not available for transcription
of the MMP-9 gene (Ma et al., 2005).
With respect to IFN induced down-regulation of IL-10 Flores et al have studied
suppression of this cytokine in CpG stimulated dendritic cells (Flores et al., 2007)
They suggested that Stat1 might be involved but the findings were difficult to
interpret because IL-10 levels were decreased in Stat1-/- mice such that there was
little room for any potential further decrease induced by IFN . A role for Stat1 in
downregulation of IL-10 in mice was suggested based on the increased IL-10 mRNA
and protein levels in LPS treated Stat1-/-
animals (VanDeusen et al., 2006) However,
IFN did not appear to play a significant role in this Stat1 effect, since IFN-/-
animals
did not show such a pronounced increase of IL-10 expression (VanDeusen et al.,
2006). Still, these findings support a critical role of Stat1 in down-regulation of the
IL-10 gene.
Additional mechanisms that have been proposed to explain inhibition of Stat3
pathways by IFN induced Stat1 include sequestration of Stat3 by Stat1 (Hu et al.,
2005) and competition of Stat1 and Stat3 for binding to the cytoplasmic tail of the
IFNGRI (Qing and Stark, 2004).

15
Our studies show that a Stat-motif at –120 in the human IL-10 gene is instrumental
for LPS induction and for IFN mediated suppression of the gene. We have
previously shown that Stat3 over-expression can up-regulate and that Stat1 over-
expression can down-regulate the human –195 IL-10 promoter (Ziegler-Heitbrock et
al., 2003). Given that IFN acts mainly via Stat1 this suggests that IFN suppresses
the IL-10 gene via Stat1.
Our studies have demonstrated that suppression of the LPS-induced –1044 IL-10
promoter activity can be achieved when IFN is added simultaneously with LPS but a
clearly stronger effect can be achieved when IFN is added at –2hs (see Figure 2).
This finding is surprising given that LPS signalling leads to binding of Stat3 to the
promoter only with slow kinetics, while IFN can induce strong Stat1 binding already
at 1 h (Figure 5A). With this faster kinetics for Stat1 induction an additional pre-
culture time would not appear necessary. Hence at this stage the improved
suppression with very early addition of IFN remains unexplained. Although data in
Figure 2 suggest that a longer pre-culture period might give an even stronger effect,
we have not tested earlier addition of the cytokine since we wanted to focus on direct
actions of IFN and avoid indirect, secondary effects.
Suppression by IFN was also seen with a shorter –195 fragment of the IL-10
promoter and this contains Stat3 and IRF sites as previously described (Ziegler-
Heitbrock et al., 2003). With IFN acting both via Stat and IRF (Schroder et al., 2004)
we have then evaluated the role of these two sites. Here, mutagenesis of the IRF-site
did not affect the ability of IFN to suppress IL-10 promotor activity (see Fig 3B).
Hence, while it was shown that IFN suppresses IL-4 via IRF-1 und –2 (Elser et al.,
2002), this mechanism does not appear to be responsible for the suppression of IL-10.
Mutagenesis of the Stat-site is not informative for the study of IFN suppression of
the LPS induction, since with mutation of this site there is no induction by LPS
(Benkhart et al., 2000) and hence no activity that can be suppressed. We therefore
have taken a reporter gene construct containing a trimer of the Stat-motif. As IFN
suppressed LPS-induction of this construct we postulate a crucial role of this site for
the inhibitory effects of IFN action.
We, in fact, could show induction of nuclear Stat1 and Tyr701 phosphorylation by
IFN , which was more pronounced with the combination of LPS and IFN (Fig.4A).
As a control protein for Western blotting we have used RNA Polymerase II as a

16
constitutive nuclear protein. This usually gave weak signals, a finding that can be best
explained by our strategy of analysing the same blot first for phosphorylated Stat, then
for total Stat and then for Polymerase II such that for this final analysis blots have
been stripped twice.
IFN did not activate phosphorylation and translocation of Stat3, but it did enhance
LPS induction of this transcription factor. Given that Stat3 is driving the human IL-10
promoter such an induction of Stat3 can be expected to counter-act the blocking
action of IFN .
The Western blotting data are in line with the gel-shift analyses, which demonstrate
binding of both transcription factors Stat1 and Stat3 to the same motif, i.e. the –120
sequence of the IL-10 promoter (Fig 5A). Such binding of nuclear proteins to double-
stranded DNA motifs in-vitro does not necessarily reflect binding of these proteins to
the promoter in intact cells. We therefore have performed ChIP analysis and here we
could show binding of Stat3 upon LPS stimulation. With IFN pre-treatment this
binding was clearly reduced (Fig 6A). Hence, while the Western blot findings showed
enhanced presence of phosphorylated Stat3 in IFN /LPS treated cells, this did not
translate into enhanced binding of Stat3 to the promoter in intact cells. Therefore, a
mechanism has to exist that prevents Stat3 binding upon treatment of cells with IFN .
When performing ChIP for Stat1 we observed robust induction of Stat1 binding in
IFN /LPS treated cells (Fig 6B) targeting the same element of the IL-10 promoter.
Based on our studies using nuclear translocation, promoter activity analysis, binding
in gelshift and ChIP we propose that IFN induced Stat1 will bind to the Stat-motif in
the human IL-10 promoter and will displace Stat3. This concept is in line with our
earlier finding, which demonstrated that overexpression of Stat1 will reduce IL-10
promoter activity (Ziegler-Heitbrock et al., 2003). The Stat1 bound to the site can
have no activity or only weak transcriptional activity in order to prevent LPS-induced
Stat3 mediated IL-10 gene expression.
The Stat1 competition with Stat3 may operate for many other genes besides IL-10. In
earlier studies Ehrt et al (Ehrt et al., 2001) have analysed the transcriptome of murine
macrophages in response to IFN . Analysis of these data, kindly provided by Drs.
Ehrt and Nathan, for genes suppressed by IFN revealed 89 of 1299 genes that
decreased in expression 3-fold or more. In a bioinformatics search of the promoters of
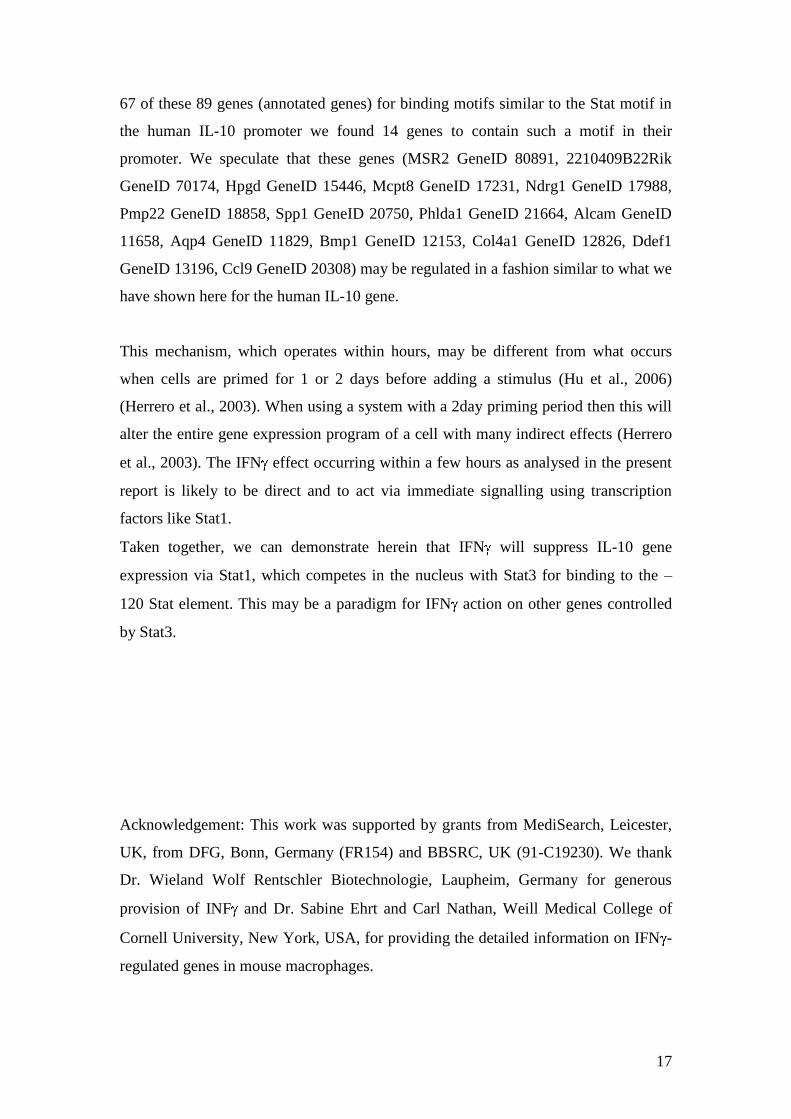
17
67 of these 89 genes (annotated genes) for binding motifs similar to the Stat motif in
the human IL-10 promoter we found 14 genes to contain such a motif in their
promoter. We speculate that these genes (MSR2 GeneID 80891, 2210409B22Rik
GeneID 70174, Hpgd GeneID 15446, Mcpt8 GeneID 17231, Ndrg1 GeneID 17988,
Pmp22 GeneID 18858, Spp1 GeneID 20750, Phlda1 GeneID 21664, Alcam GeneID
11658, Aqp4 GeneID 11829, Bmp1 GeneID 12153, Col4a1 GeneID 12826, Ddef1
GeneID 13196, Ccl9 GeneID 20308) may be regulated in a fashion similar to what we
have shown here for the human IL-10 gene.
This mechanism, which operates within hours, may be different from what occurs
when cells are primed for 1 or 2 days before adding a stimulus (Hu et al., 2006)
(Herrero et al., 2003). When using a system with a 2day priming period then this will
alter the entire gene expression program of a cell with many indirect effects (Herrero
et al., 2003). The IFN effect occurring within a few hours as analysed in the present
report is likely to be direct and to act via immediate signalling using transcription
factors like Stat1.
Taken together, we can demonstrate herein that IFN will suppress IL-10 gene
expression via Stat1, which competes in the nucleus with Stat3 for binding to the –
120 Stat element. This may be a paradigm for IFN action on other genes controlled
by Stat3.
Acknowledgement: This work was supported by grants from MediSearch, Leicester,
UK, from DFG, Bonn, Germany (FR154) and BBSRC, UK (91-C19230). We thank
Dr. Wieland Wolf Rentschler Biotechnologie, Laupheim, Germany for generous
provision of INF and Dr. Sabine Ehrt and Carl Nathan, Weill Medical College of
Cornell University, New York, USA, for providing the detailed information on IFN -
regulated genes in mouse macrophages.

18
Legends to Figures
Fig. 1: IFN inhibits LPS induced IL-10 mRNA and protein expression.
RPMI 8226.1 cells were treated for 2 h with IFN at 1000 U/ml previous to
stimulation with LPS at 100 ng/ml for 6h (mRNA) or 18 h (supernatant protein).
A: IL-10 mRNA. The mean of 9 experiments ± SD is shown.
B: IL-10 protein. The mean of 6 experiments ± SD is shown. 100% = 31.9 ± 23.7
ng/ml. * = p<0.05 when compared to LPS-stimulated cells.
Fig. 2. IFN suppresses LPS induction of the -1044 IL-10 promoter
.
RPMI 8226.1 cells transfected with pIL-10(-1044).luci (schematic representation of
construct above the graph) show a decrease in luciferase-activity when treated with
1000 U/ml IFN previous to stimulation with 100 ng/ml LPS for 6h. The mean of 6
experiments ± SD is shown. 100% = 16.1 ± 12.0 RLU/mg protein. * = p<0.05 when
compared to LPS-stimulated cells.
Fig. 3: IFN suppresses LPS induction of the -195 IL-10 promoter via the Stat site.
RPMI 8226.1 cells were transfected with pIL-10(-195wt).luci (A), pIL-10(-
195IRFmut).luci (B) or p3xLS4.luci (C) and then treated for 2 h with 1000 U IFN /
ml before stimulation with 100 ng LPS/ml for 6 h. Schematic representation of
transcription factor binding sites present in the construct above the graph. A: The
mean of 6 experiments ± SD is shown. 100% = 32.5 ± 12.4 RLU/mg protein. B: The
mean of 5 experiments ± SD is shown. 100% = 54.2 ± 30.0 RLU/mg protein. C: The
mean of 6 experiments ± SD is shown. 100% = 48.6 ± 23.6 RLU/mg protein. * =
p<0.05 when compared to LPS-stimulated cells.
Fig. 4: Translocation of phosphorylated Stat 1 and Stat3 into the nucleus
Western blots were performed with nuclear extracts. IFN was added at -2h ; LPS was
added at 0h. All samples were harvested at 4h after LPS stimulation.

19
A: IFN induces translocation of tyrosine-701 phosphorylated STAT1.
Upper panel: anti-p-STAT1 (Tyr 701) antibody; middle panel: anti-STAT1 p89/91
antibody; lower panel: anti-RNA-polymerase II antibody (Pol II). One of 4
experiments.
B: LPS causes translocation of tyrosine-phosphorylated STAT3 into the nucleus.
Upper panel: anti- p-STAT3 (Tyr 705) antibody; middle panel: anti-STAT3 (C20)
antibody; lower panel: anti-RNA-polymerase II antibody (Pol II). One of 4
experiments.
Fig. 5: Gelshift analysis of Stat binding to the –120 motif of the IL-10 promoter.
A: Nuclear extracts obtained from cells treated with LPS at 100 ng/ml and IFN at
1000 U/ml were admixed with the DNA motif representing the -120 STAT-binding
site of the IL-10 promoter. Nuclear extracts were obtained at 1 and 4 h past
stimulation. One of 3 experiments.
B: Nuclear extracts were admixed with anti Stat antibodies before addition of the
radio-labelled DNA-motif. Filled arrow = STAT3; open arrow = STAT1. One of 3
experiments.
Fig. 6: ChIP analysis of STAT-binding proteins
Chromatin of RPMI 8226.1 cells treated for 2 h with IFN at 1000 U/ml of previous
to stimulation with LPS at 100 ng/ml for 4 h was immunoprecipitated using STAT3
(C20) antibody(A,B).or STAT1 antibody (C,D). Recovery was expressed as % of
input. In A and C the means of 3 or 4 experiments ± SD is shown for STAT3 and
STAT1, respectively. B and D give an example each of a gel of the PCR products
after 30 and 32 cycles, respectively. * = p<0.05.

20
References
Benkhart E. M., Siedlar M., Wedel A., Werner T. and Ziegler-Heitbrock H. W.
(2000) Role of Stat3 in lipopolysaccharide-induced IL-10 gene expression.
J Immunol 165, 1612-7.
Bettelli E., Das M. P., Howard E. D., Weiner H. L., Sobel R. A. and Kuchroo V.
K. (1998) IL-10 is critical in the regulation of autoimmune
encephalomyelitis as demonstrated by studies of IL-10- and IL-4-deficient
and transgenic mice. J Immunol 161, 3299-306.
Boehm U., Klamp T., Groot M. and Howard J. C. (1997) Cellular responses to
interferon-gamma. Annu Rev Immunol 15, 749-95.
Brenner S., Prosch S., Schenke-Layland K., Riese U., Gausmann U. and Platzer
C. (2003) cAMP-induced Interleukin-10 promoter activation depends on
CCAAT/enhancer-binding protein expression and monocytic
differentiation. J Biol Chem 278, 5597-604.
Brightbill H. D., Plevy S. E., Modlin R. L. and Smale S. T. (2000) A prominent
role for Sp1 during lipopolysaccharide-mediated induction of the IL-10
promoter in macrophages. J Immunol 164, 1940-51.
Cao S., Liu J., Chesi M., Bergsagel P. L., Ho I. C., Donnelly R. P. and Ma X.
(2002) Differential regulation of IL-12 and IL-10 gene expression in
macrophages by the basic leucine zipper transcription factor c-Maf
fibrosarcoma. J Immunol 169, 5715-25.
Chang C. C., Wright A. and Punnonen J. (2000) Monocyte-derived CD1a+ and
CD1a- dendritic cell subsets differ in their cytokine production profiles,
susceptibilities to transfection, and capacities to direct Th cell
differentiation. J Immunol 165, 3584-91.
Cheng F., Wang H. W., Cuenca A., Huang M., Ghansah T., Brayer J., Kerr W.
G., Takeda K., Akira S., Schoenberger S. P., Yu H., Jove R. and
Sotomayor E. M. (2003) A critical role for Stat3 signaling in immune
tolerance. Immunity 19, 425-36.
Chomarat P., Rissoan M. C., Banchereau J. and Miossec P. (1993) Interferon
gamma inhibits interleukin 10 production by monocytes. J Exp Med 177,
523-7.
Dai W. J., Bartens W., Kohler G., Hufnagel M., Kopf M. and Brombacher F.
(1997) Impaired macrophage listericidal and cytokine activities are
responsible for the rapid death of Listeria monocytogenes-infected IFN-
gamma receptor-deficient mice. J Immunol 158, 5297-304.
De Boer M. L., Hu J., Kalvakolanu D. V., Hasday J. D. and Cross A. S. (2001)
IFN-gamma inhibits lipopolysaccharide-induced interleukin-1 beta in
primary murine macrophages via a Stat1-dependent pathway. J
Interferon Cytokine Res 21, 485-94.
de Waal Malefyt R., Haanen J., Spits H., Roncarolo M. G., te Velde A., Figdor
C., Johnson K., Kastelein R., Yssel H. and de Vries J. E. (1991)
Interleukin 10 (IL-10) and viral IL-10 strongly reduce antigen-specific
human T cell proliferation by diminishing the antigen-presenting capacity
of monocytes via downregulation of class II major histocompatibility
complex expression. J Exp Med 174, 915-24.

21
de Waal Malefyt R., Yssel H., Roncarolo M. G., Spits H. and de Vries J. E.
(1992) Interleukin-10. Curr Opin Immunol 4, 314-20.
Dignam J. D., Lebovitz R. M. and Roeder R. G. (1983) Accurate transcription
initiation by RNA polymerase II in a soluble extract from isolated
mammalian nuclei. Nucleic Acids Res 11, 1475-89.
Donnelly R. P., Dickensheets H. and Finbloom D. S. (1999) The interleukin-10
signal transduction pathway and regulation of gene expression in
mononuclear phagocytes. J Interferon Cytokine Res 19, 563-73.
Ehrt S., Schnappinger D., Bekiranov S., Drenkow J., Shi S., Gingeras T. R.,
Gaasterland T., Schoolnik G. and Nathan C. (2001) Reprogramming of
the macrophage transcriptome in response to interferon-gamma and
Mycobacterium tuberculosis: signaling roles of nitric oxide synthase-2
and phagocyte oxidase. J Exp Med 194, 1123-40.
Elser B., Lohoff M., Kock S., Giaisi M., Kirchhoff S., Krammer P. H. and Li-
Weber M. (2002) IFN-gamma represses IL-4 expression via IRF-1 and
IRF-2. Immunity 17, 703-12.
Fiorentino D. F., Bond M. W. and Mosmann T. R. (1989) Two types of mouse T
helper cell. IV. Th2 clones secrete a factor that inhibits cytokine
production by Th1 clones. J Exp Med 170, 2081-95.
Flores R. R., Diggs K. A., Tait L. M. and Morel P. A. (2007) IFN-gamma
negatively regulates CpG-induced IL-10 in bone marrow-derived
dendritic cells. J Immunol 178, 211-8.
Herbeuval J. P., Lelievre E., Lambert C., Dy M. and Genin C. (2004)
Recruitment of STAT3 for production of IL-10 by colon carcinoma cells
induced by macrophage-derived IL-6. J Immunol 172, 4630-6.
Herrero C., Hu X., Li W. P., Samuels S., Sharif M. N., Kotenko S. and Ivashkiv
L. B. (2003) Reprogramming of IL-10 activity and signaling by IFN-
gamma. J Immunol 171, 5034-41.
Hu X., Paik P. K., Chen J., Yarilina A., Kockeritz L., Lu T. T., Woodgett J. R.
and Ivashkiv L. B. (2006) IFN-gamma suppresses IL-10 production and
synergizes with TLR2 by regulating GSK3 and CREB/AP-1 proteins.
Immunity 24, 563-74.
Hu X., Park-Min K. H., Ho H. H. and Ivashkiv L. B. (2005) IFN-gamma-primed
macrophages exhibit increased CCR2-dependent migration and altered
IFN-gamma responses mediated by Stat1. J Immunol 175, 3637-47.
Hughes T. R., Tengku-Muhammad T. S., Irvine S. A. and Ramji D. P. (2002) A
novel role of Sp1 and Sp3 in the interferon-gamma -mediated suppression
of macrophage lipoprotein lipase gene transcription. J Biol Chem 277,
11097-106.
Kasprzycka M., Marzec M., Liu X., Zhang Q. and Wasik M. A. (2006)
Nucleophosmin/anaplastic lymphoma kinase (NPM/ALK) oncoprotein
induces the T regulatory cell phenotype by activating STAT3. Proc Natl
Acad Sci U S A 103, 9964-9.
Kinjyo I., Inoue H., Hamano S., Fukuyama S., Yoshimura T., Koga K., Takaki
H., Himeno K., Takaesu G., Kobayashi T. and Yoshimura A. (2006) Loss
of SOCS3 in T helper cells resulted in reduced immune responses and
hyperproduction of interleukin 10 and transforming growth factor-beta 1.
J Exp Med 203, 1021-31.
Liu Y. W., Tseng H. P., Chen L. C., Chen B. K. and Chang W. C. (2003)
Functional cooperation of simian virus 40 promoter factor 1 and

22
CCAAT/enhancer-binding protein beta and delta in lipopolysaccharide-
induced gene activation of IL-10 in mouse macrophages. J Immunol 171,
821-8.
Ma W., Lim W., Gee K., Aucoin S., Nandan D., Kozlowski M., Diaz-Mitoma F.
and Kumar A. (2001a) The p38 mitogen-activated kinase pathway
regulates the human interleukin-10 promoter via the activation of Sp1
transcription factor in lipopolysaccharide-stimulated human
macrophages. J Biol Chem 276, 13664-74.
Ma Z., Chang M. J., Shah R. C. and Benveniste E. N. (2005) Interferon-gamma-
activated STAT-1alpha suppresses MMP-9 gene transcription by
sequestration of the coactivators CBP/p300. J Leukoc Biol 78, 515-23.
Ma Z., Qin H. and Benveniste E. N. (2001b) Transcriptional suppression of
matrix metalloproteinase-9 gene expression by IFN-gamma and IFN-
beta: critical role of STAT-1alpha. J Immunol 167, 5150-9.
Maritano D., Sugrue M. L., Tininini S., Dewilde S., Strobl B., Fu X., Murray-
Tait V., Chiarle R. and Poli V. (2004) The STAT3 isoforms alpha and
beta have unique and specific functions. Nat Immunol 5, 401-9.
Qing Y. and Stark G. R. (2004) Alternative activation of STAT1 and STAT3 in
response to interferon-gamma. J Biol Chem 279, 41679-85.
Saraiva M., Christensen J. R., Tsytsykova A. V., Goldfeld A. E., Ley S. C.,
Kioussis D. and O'Garra A. (2005) Identification of a macrophage-
specific chromatin signature in the IL-10 locus. J Immunol 175, 1041-6.
Schroder K., Hertzog P. J., Ravasi T. and Hume D. A. (2004) Interferon-gamma:
an overview of signals, mechanisms and functions. J Leukoc Biol 75, 163-
89.
Shakhov A. N., Collart M. A., Vassalli P., Nedospasov S. A. and Jongeneel C. V.
(1990) Kappa B-type enhancers are involved in lipopolysaccharide-
mediated transcriptional activation of the tumor necrosis factor alpha
gene in primary macrophages. J Exp Med 171, 35-47.
Shoemaker J., Saraiva M. and O'Garra A. (2006) GATA-3 directly remodels the
IL-10 locus independently of IL-4 in CD4+ T cells. J Immunol 176, 3470-9.
Takeda K., Clausen B. E., Kaisho T., Tsujimura T., Terada N., Forster I. and
Akira S. (1999) Enhanced Th1 activity and development of chronic
enterocolitis in mice devoid of Stat3 in macrophages and neutrophils.
Immunity 10, 39-49.
Tengku-Muhammad T. S., Hughes T. R., Ranki H., Cryer A. and Ramji D. P.
(2000) Differential regulation of macrophage CCAAT-enhancer binding
protein isoforms by lipopolysaccharide and cytokines. Cytokine 12, 1430-
6.
Tone M., Powell M. J., Tone Y., Thompson S. A. and Waldmann H. (2000) IL-10
gene expression is controlled by the transcription factors Sp1 and Sp3. J
Immunol 165, 286-91.
VanDeusen J. B., Shah M. H., Becknell B., Blaser B. W., Ferketich A. K., Nuovo
G. J., Ahmer B. M., Durbin J. and Caligiuri M. A. (2006) STAT-1-
mediated repression of monocyte interleukin-10 gene expression in vivo.
Eur J Immunol 36, 623-30.
Williams L., Bradley L., Smith A. and Foxwell B. (2004) Signal transducer and
activator of transcription 3 is the dominant mediator of the anti-
inflammatory effects of IL-10 in human macrophages. J Immunol 172,
567-76.

23
Ziegler-Heitbrock H. W., Pechumer H., Petersmann I., Durieux J. J., Vita N.,
Labeta M. O. and Strobel M. (1994) CD14 is expressed and functional in
human B cells. Eur J Immunol 24, 1937-40.
Ziegler-Heitbrock L., Lotzerich M., Schaefer A., Werner T., Frankenberger M.
and Benkhart E. (2003) IFN-alpha induces the human IL-10 gene by
recruiting both IFN regulatory factor 1 and Stat3. J Immunol 171, 285-90.

Schaefer et al., Figure 1 A
Time of
IFN addition 0h -2h
LPS
IFN +
+
+
+
0
20
40
60
80
100
IL-1
0 m
RN
A (
% o
f L
PS
stim
ula
tio
n)
*
**

Schaefer et al., Figure 1 B
Time of
IFN addition 0h -2h
LPS
IFN +
+
+
+
0
20
40
60
80
100
IL-1
0 p
rote
in (
% o
f L
PS
sti
mu
lati
on
)
*
* *

0
20
40
60
80
100Lucifera
se A
ctivity (
% o
f LP
S s
tim
ula
tion)
*
*
*
**
*
Luciferase
Sp1 IRF Stat T
Time of
IFN addition 0h -2h -1h 0h
LPS
IFN
+
+
+
+
+
++
+
Schaefer et al., Figure 2
-1044
Luciferase
IRF Stat T
0
20
40
60
80
100Lucifera
se-a
ctivity (
% o
f LP
S s
tim
ula
tion)
*
*
*
Time of
IFN addition 0h -2h
LPS
IFN +
+
+
+
Schaefer et al., Figure 3 A
-195
Luciferase
IRF Stat T
0
20
40
60
80
100L
ucife
rase
-activity (
% o
f L
PS
stim
ula
tio
n)
*
*
*
Time of
IFN addition 0h -2h
LPS
IFN +
+
+
+
Schaefer et al., Figure 3 B
-195

Luciferase
Stat TStatStat
0
20
40
60
80
100
Lucifera
se-a
ctivity (
% o
f LP
S s
tim
ula
tion)
Time of
IFN addition 0h -2h
LPS
IFN +
+
+
+
*
*
*
*
Schaefer et al., Figure 3 C

Schaefer et al., Figure 4 A
LPS:
IFN :+
+
+
+
p-STAT1 (Tyr 701)
STAT1 /STAT1
p-STAT1 (Tyr 701)
Pol II

Schaefer et al., Figure 4 B
LPS:
IFN :+
+
+
+
p-STAT3 (Tyr 705)
STAT3
Pol II
STAT1
STAT3
LPS:
IFN :+
+
+
+
Time of harvest: 1 h 4 h
Time of
IFN addition: -2h -2h -2h -2h
1 2 3 4 5 6 7 8
+
+
+
+
Schaefer et al., Figure 5 A

Antibody to
STAT3 STAT1STAT1
STAT3
Schaefer et al., Figure 5 B

0
0.01
0.02
0.03
0.04
0.05
0.06
0.07
LPS
IFN+
+
+
+
*
Schaefer et al., Figure 6 A,B
Sta
t3 b
ind
ing
(%
reco
ve
ry)
Stat3
Input
LPS
IFN- + - + - + - +
- - + + - - + +
A
B
*

Sta
t1 b
ind
ing
(%
reco
ve
ry)
LPS
IFN+
+
+
+
Schaefer et al., Figure 6 C,D
0
0.005
0.01
0.015
0.02
0.025
0.03
0.035
0.04
0.045
Stat1
Input
LPS
IFN- + - + - + - +
- - + + - - + + D
C*
*