Embed Size (px)
Citation preview
Mechanism of the Northward-Propagating Intraseasonal Oscillation: Insights from aZonally Symmetric Model*
HAE-KYUNG LEE DRBOHLAV AND BIN WANG
Department of Meteorology, School of Ocean and Earth Science and Technology, University of Hawaii at Manoa, Honolulu, Hawaii
(Manuscript received 9 July 2003, in final form 8 September 2004)
ABSTRACT
The propagation and initiation mechanisms of the boreal summer intraseasonal oscillation (BSISO) in thesouth Asian summer monsoon are examined with a zonally symmetric atmospheric model. In the axiallysymmetric model the effects of zonally propagating atmospheric waves are intentionally excluded. Themodel specifies mean flows and depicts the lowest baroclinic mode and a barotropic mode in the freetroposphere. The two vertical modes are coupled by the time-mean vertical wind shear. The model atmo-sphere produces a 15–20-day oscillation, which is characterized by northward propagation of convectionfrom south of the equator to the Indian monsoon trough region and a reinitiation of convection in the regionbetween 10°S and the equator.
The northward propagation in the model is produced by the free troposphere barotropic divergence,which leads convection by about a quarter of a cycle. The vertical advection of summer-mean easterlyvertical wind shear by perturbation vertical motion inside the convective region induces barotropic diver-gence (convergence) to the north (south) of convection. This barotropic divergence triggers the moistureconvergence in the boundary layer to the north of convection, causing the northward propagation ofprecipitation.
The development of convection in the Southern Hemisphere near the equator is also produced by thedevelopment of the barotropic divergence in the free troposphere. When the BSISO convection is locatedin the Indian monsoon trough region, it creates Hadley-type anomalous circulation. This Hadley-typecirculation interacts with the monsoon flow through the meridional and vertical advections creating anoma-lous barotropic divergence and boundary layer convergence.
1. Introduction
Madden and Julian (1971) first discovered the 40–50-day oscillation and characterized this oscillation as east-ward-propagating, equatorially trapped, wavenumber-1baroclinic anomalies [the Madden–Julian oscillation(MJO) mode hereafter]. Although this MJO mode is ayearlong characteristic of the climate record, it does notrepresent the complexity of the boreal summer in-traseasonal oscillation (BSISO). During the borealsummer, not only eastward but also the meridionalpropagation of convection is found in the BSISO.
To characterize this complex structure of the MJO,Wang and Rui (1990) classified the MJO into threegroups based on the direction of propagation. The first
group consists of equatorially trapped and eastward-propagating convection. The second group includes thenortheast or southeast movement of convection fromthe Maritime Continent to the western Pacific. The north-eastward movement occurs during the Northern Hemi-sphere summer, whereas the southeastward propagationdevelops during the Southern Hemisphere summer.
The third group is characterized by eastward move-ment with a northward migration over the Indian and/or the western Pacific Ocean from May to October.Observational studies have identified this northwardmovement of deep convection in the Indian Ocean andwestern North Pacific during the boreal summer (e.g.,Yasunari 1979, 1980, 1981; Krishnamurti et al. 1985;Chen and Murakami 1988; Gadgil and Srinivasan 1990;Ouergli and De Felice 1996). In the Indian Ocean, con-vection originates near the equator and moves north-ward with a speed of about 0.75° latitude day�1 (Krish-namurti and Subrahmanyam 1982).
Although this northward-propagating mode is lessfrequent in its occurrence (20%) than the eastward-propagating one (65%), the accurate prediction of thenorthward-propagating mode is critical, since Indianmonsoon variability can be affected by the northward-
* School of Ocean and Earth Science and Technology Publica-tion Number 6489 and the International Pacific Research CenterPublication Number 294.
Corresponding author address: Dr. Hae-Kyung Lee Drbohlav,Istituto Nazionale di Geofisica e Vulcanologia Via Donato Creti12, 40128 Bologna, Italy.E-mail: [email protected]
952 J O U R N A L O F C L I M A T E VOLUME 18
© 2005 American Meteorological Society
JCL3306
propagating convection (Yasunari 1979; Krishnamurtiand Subrahmanyam 1982; Hartmann and Michelsen1989; Gautier and Di Julio 1990). However, the predict-ability of the northward-propagating BSISO leavesroom to be improved due to the lack of understandingof its mechanism.
A number of mechanisms have been proposed ontwo aspects of BSISO. The first aspect is the initiationof convection in the equatorial Indian Ocean. For ex-ample, Julian and Madden (1981) and Knutson et al.(1986) suggested that the initiation of equatorial out-going longwave radiation (OLR) anomalies in the In-dian monsoon region is associated with the eastward-propagating equatorial OLR anomalies. According toHu and Randall (1994, 1995), the initiation of convec-tion near the equator in the Indian Ocean is a result ofa stationary oscillating heat source that is forced by thenonlinear interaction among radiation, convection, andsurface moisture flux. Wang and Xie (1997) attributedthe initiation of the BSISO to westward-propagatingoff-equatorial moist Rossby waves. Their model resultsshowed that when moist Rossby waves in both hemi-spheres propagate westward and stall over the ArabianSea, the strong July-mean easterly vertical shear overthe northern Indian Ocean traps the southern cell ofthe moist Rossby wave close to the equator. Conse-quently, the decay of the northern cell transfers energyto the southern cell and triggers development of con-vection over the equatorial Indian Ocean.
The second aspect of BSISO is the northward propa-gation of convection. Webster (1983) introduced therole of the land surface heat fluxes and hydrologicalcycle on the northward propagation of convection.Goswami and Shukla (1984) and Anderson and Stevens(1987) emphasized the interaction between convectionand radiative relaxation in controlling the moist staticstability. Wang and Xie (1997) used an intermediatemodel to show that the northward propagations overthe Indian and western Pacific sectors are caused byemanation of the moist Rossby waves from Sumatraand the date line in equatorial western Pacific, respec-tively. The emanation occurs when the equatorial MJOmode (a coupled Kelvin–Rossby wave packet) attenu-ates over the Maritime Continent and in the centralPacific due to decreased moist static energy stored inthe boundary layer. This northwestward emanation ofRossby waves were observed and documented (Kemball-Cook and Wang 2001; Lawrence and Webster 2002).Especially, Lawrence and Webster (2002) argued thatthe impression of northward movement of convectionat a given longitude is a result of eastward movement ofthe northwestward-oriented band of convection.
However, the relative importance of zonally propa-gating waves for the northward-propagating BSISO isstill debatable. It is noticed that about one-half of thenorthward propagation that occurs over the IndianOcean is independent of the equatorial eastward-propagating MJO (Wang and Rui 1990). This suggests
that the northward propagation may not necessarily al-ways tie up with equatorial wave dynamics. This studyseeks to identify the independent mechanism that ac-counts for the northward-propagating BSISO in the In-dian Ocean region. The uniqueness of this study lies inthe assumption that the fundamental mechanism of thenorthward-propagating BSISO may exist without thezonally propagating wave effect. Based on this assump-tion, the research is directed to examine the atmo-spheric intrinsic dynamics regarding the initiation andpropagation of the BSISO. In the next section, themodel description is given. In section 3, the BSISOsimulated in the zonally symmetric model is described.The proposed mechanism for the propagation (section4) and initiation (section 5) of convection is followed byresults from further experiments (section 6). Finally,the summary and discussion are given in section 7.
2. Zonally symmetric model
In an attempt to exclude the influence of the zonallypropagating atmospheric waves on the northwardpropagation of convection, a two-dimensional (2D)model is used. The 2D model is a zonally averagedversion of the three-dimensional intermediate modeldeveloped by Wang and Xie (1997). The domain of the
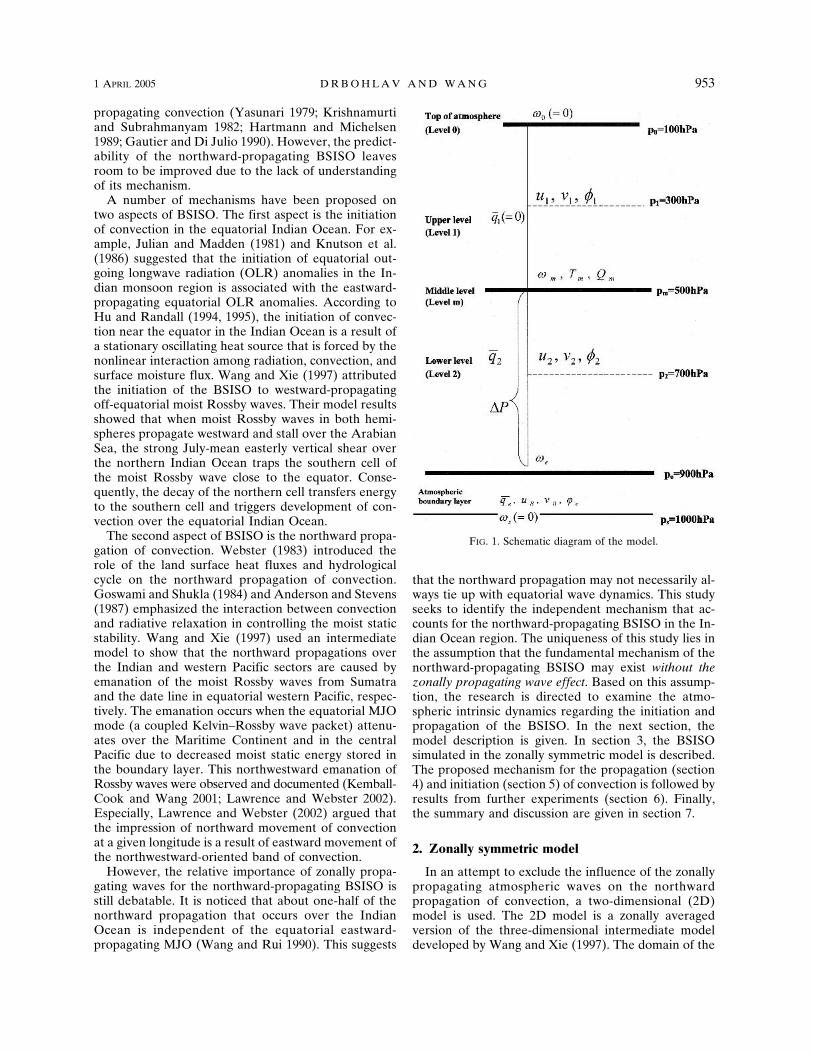
FIG. 1. Schematic diagram of the model.
1 APRIL 2005 D R B O H L A V A N D W A N G 953
model is confined to an equatorial � plane between40°S and 40°N with a meridional resolution of 2° lati-tude, and a time step of 10 min. At the meridionalboundaries the fluxes of mass, momentum, and heatnormal to the boundaries vanish. The model solves theinitial problem with the low-frequency perturbationmotion (anomalies) and the steady-state basic flows ofJune–July–August-mean (JJA) state. The time integra-tion is performed for the given initial condition of theKelvin type; a cosine wave structure in the initialanomalous zonal winds in the absence of any initialanomalous meridional winds.
The model consists of a two-level free atmosphereand one well-mixed boundary layer. The subscripts 1and 2 are used to indicate the upper (300 hPa) andlower (700 hPa) levels of the atmosphere, respectively.The subscript B represents the vertically averaged per-turbation in the boundary layer, while the subscript erepresents the perturbation at the top of the boundarylayer (Fig. 1). Momentum and continuity equations are
written at the upper and lower levels of free atmo-sphere (troposphere), and the thermodynamic and hy-drostatic equations are written at the middle level (500hPa), which is denoted by the subscript m. Using thesessubscripts, the 2D perturbation primitive equations in aP-coordinate and equatorial � plan are written as
�u�1�t
� ��1
�u�1�y
� ��1�u1
�y� �m
u�2 � u�1�p
� ��mu2 � u1
�p� �y��1 � �u�1 � K�2u�1, �1.1a�
���1�t
� ��1
���1�y
� ��1��1
�y� �m
��2 � ��1�p
� ��m�2 � �1
�p� �yu�1 �
��1�y
� ���1
� K�2��1, �1.1b�
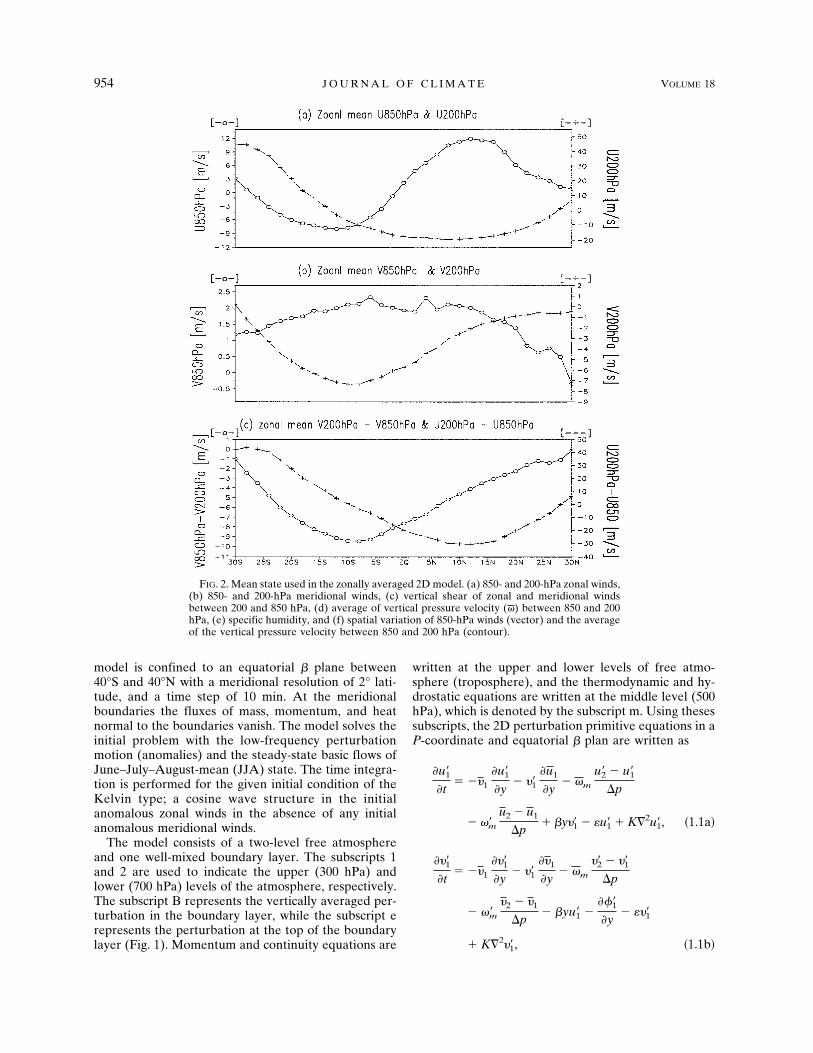
FIG. 2. Mean state used in the zonally averaged 2D model. (a) 850- and 200-hPa zonal winds,(b) 850- and 200-hPa meridional winds, (c) vertical shear of zonal and meridional windsbetween 200 and 850 hPa, (d) average of vertical pressure velocity (�) between 850 and 200hPa, (e) specific humidity, and (f) spatial variation of 850-hPa winds (vector) and the averageof the vertical pressure velocity between 850 and 200 hPa (contour).
954 J O U R N A L O F C L I M A T E VOLUME 18
���1�y
���m � 0
�p� 0, �1.1c�
�u�2�t
� ��2
�u�2�y
� ��2�u2
�y� �m
u�2 � u�1�p
� ��mu2 � u1
�p� �y��2 � �u�2 � K�2u�2,
�1.2a�
���2�t
� ��2
���2�y
� ��2��2
�y� �m
��2 � ��1�p
� ��m�2 � �1
�p� �yu�2 �
��2�y
� ���2
� K�2��2, �1.2b�
���2�y
���e � ��m
�p� 0, �1.2c�
FIG. 2. (Continued)
1 APRIL 2005 D R B O H L A V A N D W A N G 955
�T�m�t
� ���1 � �2
2 � �T�m�y
� ���1 � ��22 � �Tm
�y
�pm
RS��m �
Q�mCp
� T�m � K�2T�m, �1.3�
�2 � �1�p
� �RT�mpm
, �1.4�
where overbars and primes represent basic-state andperturbation quantity; u, �, �, , and T denote zonaland meridional winds, vertical pressure velocity, geo-potential, and temperature, respectively; , �, and R arethe Rayleigh friction coefficient, Newtonian cooling co-efficient, and specific gas constant, respectively; K is the
turbulent horizontal momentum or thermal diffusioncoefficient; S is the dry static stability parameter; and�p is the half-depth of the free troposphere.
The governing equations in the steady, well-mixedboundary layer can be described as
�y��B � Exu�B � 0, �2a�
��yu�B ���e�y
� Ey��B � 0, �2b�
��e � �ps � pe �����B�y �, �2c�
where ps and pe are pressure at the model surface andat the top of boundary layer, respectively; �e denotes
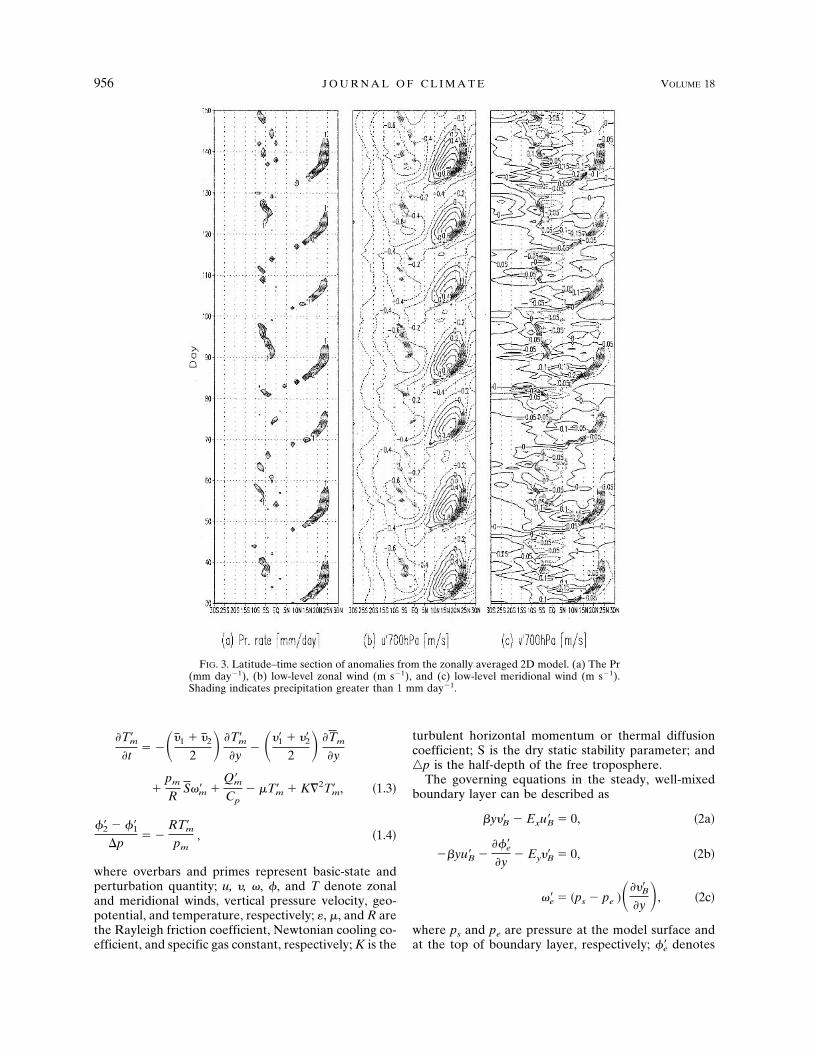
FIG. 3. Latitude–time section of anomalies from the zonally averaged 2D model. (a) The Pr(mm day�1), (b) low-level zonal wind (m s�1), and (c) low-level meridional wind (m s�1).Shading indicates precipitation greater than 1 mm day�1.
956 J O U R N A L O F C L I M A T E VOLUME 18

perturbation geopotential at pe; u�B and ��B are verticallyaveraged perturbation zonal and meridional winds inthe boundary layer, respectively; and Ex and Ey areRayleigh friction coefficients in the zonal and meridi-onal directions, respectively. From (2), the Ekmanpumping velocity can be written as
��e � D3
�2�e
�y2 � D4
��e�y
, �3�
where the coefficients are
D3 � ��ps � pe�Ex
ExEy � �2y2 ,
D4 �2�ps � pe�Ex�2y
�ExEy � �2y2�2 .
Due to mass conservation in a vertical column, the Ek-man pumping velocity in the barotropic boundary layeris related to free tropospheric divergence as the follow-ing:
��e � ��p k�1
2���k�y
. �4�
Combining (3) and (4) leads to an elliptical equationfor �e:
D3
�2�e
�y2 � D4
��e�y
� ��p k�1
2 ����K�y �. �5�
Here, the assumption, �e � �2 is made in order to closethe governing equations.
In the model, precipitation rate (Pr) is determined bythe moisture convergence in the planetary boundarylayer, and in the lower layer of the free atmosphere
Pr � ��ps � pe�����B�y �qe � �p����2
�y �q2, �6�
where qe and q2 are specific humidity of JJA-mean cli-matology. Combining (2c) and (4) leads to
�p����1�y
����2�y � � ��ps � pe�����B
�y �, �7�
which shows that the divergence in the free atmosphere(upper and lower troposphere) is balanced by the conver-gence in the boundary layer. Substituting (7) into (6) gives
Pr � �p����1�y
����2�y �qe � �p����2
�y �q2. �8�
FIG. 4. Latitudinal variation of precipitation rate (mm day�1)on days (a) 72, (b) 76, (c) 80, (d) 83, (e) 84, (f) 85, (g) 86, and(h) 87.
FIG. 5. Latitudinal variation of precipitation rate (-�-) andbaroclinic mode of moisture-divergence tendency [�/�t(����/�y)q2,���] on days (a) 84, (b) 85, (c) 86, (d) 87, and (e) 88.
1 APRIL 2005 D R B O H L A V A N D W A N G 957
From (1.1c), (1.2c), and (8), the Pr and the condensa-tional heating (Q�m) at the middle atmosphere pm areexpressed as
Pr � ���e�q2 � qe� � ��mq2, �9a�
Q�m �� bLc
�p����mq2 � ��e �qe � q2 ��, �9b�
where Q�m represents the irreversible condensationalheating; b measures the ratio of the amount of watervapor that condenses out to the total moisture conver-gence in the same air column; Lc is the latent heat; theswitch-on parameter, � is 1 when the Pr in (9a) is posi-tive and 0 otherwise.
3. Simulated BSISO
a. Basic state
The 2D model basic state represents an area averagefrom 60° to 100°E corresponding roughly to the southAsian summer monsoon region. The zonally averagedtime-mean flow is a JJA-mean circulation, which is cal-
culated from the European Centre for Medium-RangeWeather Forecasts (ECMWF) grid analysis data for theperiod 1979–92. The 200- and 850-hPa winds are usedas the mean winds at the upper and lower levels of themodel. The mean temperature at the middle level isdetermined from geopotential thickness between 200and 850 hPa by assuming hydrostatic balance. The ver-tical pressure velocity at the middle level is obtained byaveraging the values at 200 and 850 hPa. The specifichumidity at 1000 hPa is used for the basic-state freeatmospheric moisture content. A complete descriptionof the moisture profile can be found in Wang (1988).
Figure 2 illustrates the meridional structure of thebasic state. The maximum low-level easterlies and west-erlies are found at 12°S and 12°N, respectively (Fig. 2a).In the upper troposphere, zonal winds become wester-lies to the south of 14°S, while easterlies are dominantelsewhere (Fig. 2a). The vertical shear of zonal windsbecomes zero at 10°S, and westerly wind shear (easterlywind shear) is found in the area south (north) of 10°S(Fig. 2c). The JJA-mean meridional winds in the loweratmosphere are southerlies except in the region northof 28°N (Fig. 2b). In the upper atmosphere, northerliesare persistent in the whole domain (Fig. 2b). The ver-
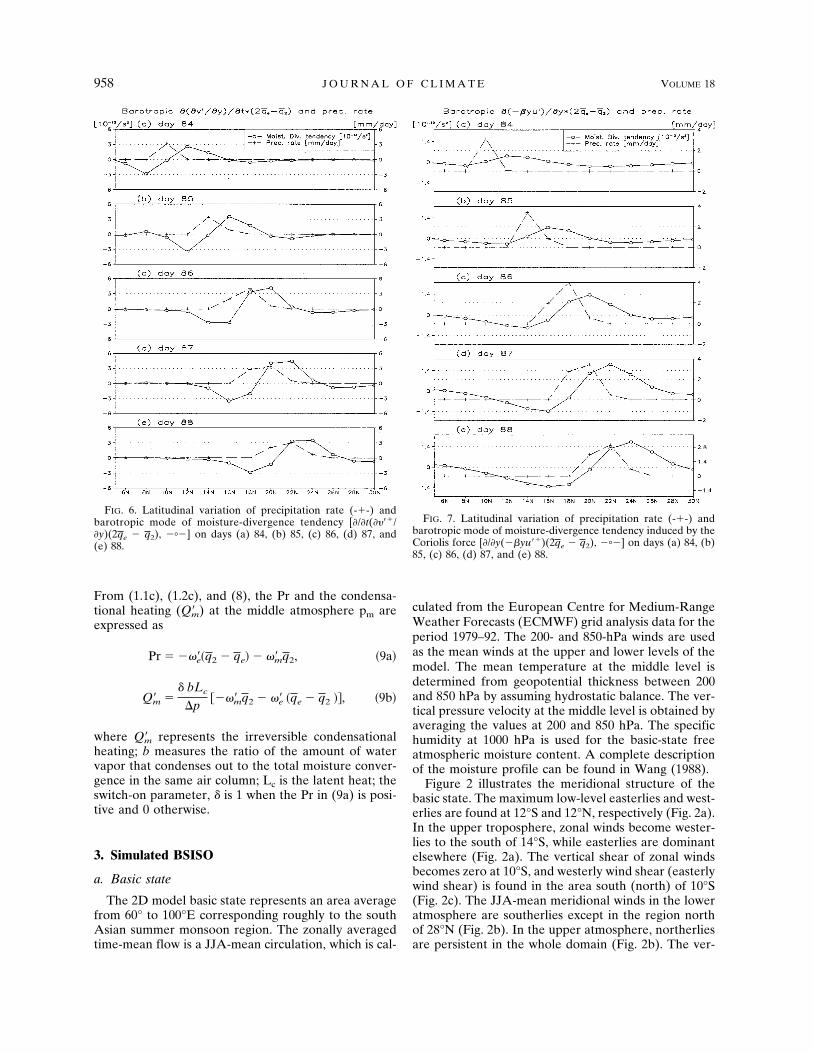
FIG. 6. Latitudinal variation of precipitation rate (-�-) andbarotropic mode of moisture-divergence tendency [�/�t(����/�y)(2qe � q2), ���] on days (a) 84, (b) 85, (c) 86, (d) 87, and(e) 88.
FIG. 7. Latitudinal variation of precipitation rate (-�-) andbarotropic mode of moisture-divergence tendency induced by theCoriolis force [�/�y(��yu��)(2qe � q2), ���] on days (a) 84, (b)85, (c) 86, (d) 87, and (e) 88.
958 J O U R N A L O F C L I M A T E VOLUME 18
tical shear in the meridional winds is northerly shear,which means that the northerly wind increases with in-creasing height (Fig. 2c).
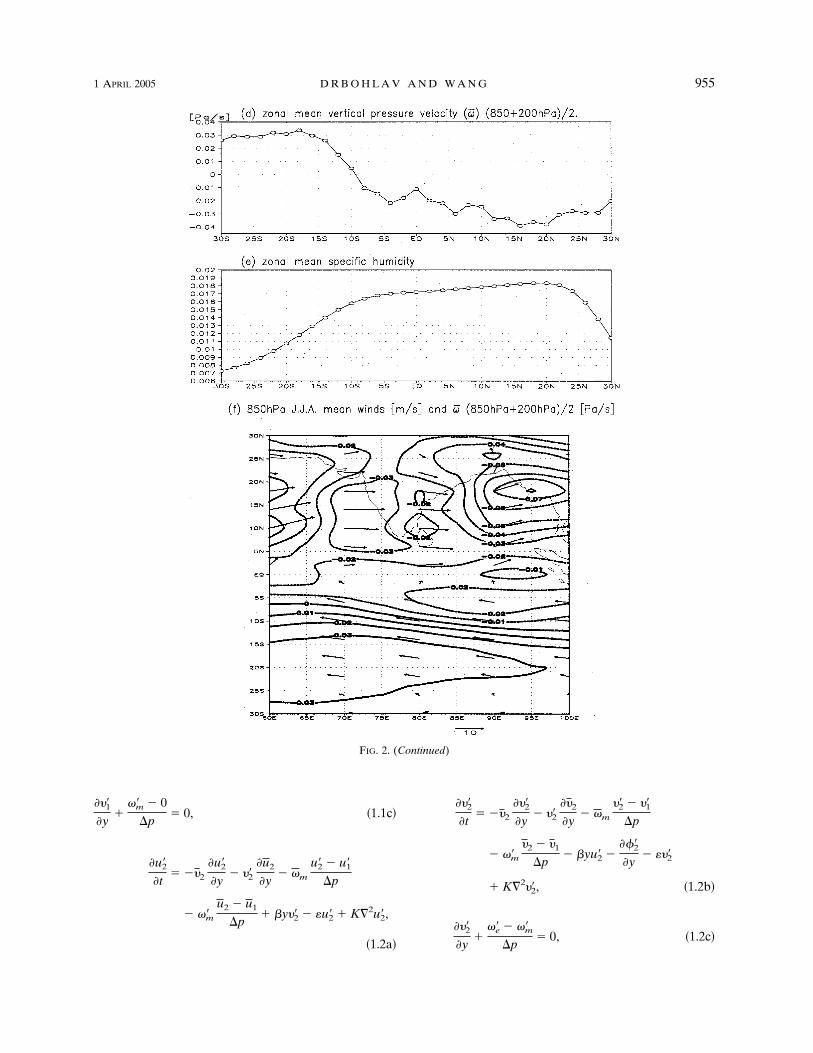
The JJA-mean vertical pressure velocity in the tropi-cal region indicates that a sinking (rising) motion isdominant to the south (north) of 10°S (Fig. 2d). TheJJA-mean specific humidity (Fig. 2e) increases fromsouthern boundary toward the Northern Hemisphere.A relatively sharp decrease of specific humidity isfound north of 20°N, since the existence of land de-creases the specific humidity. The spatial variation oflow-level JJA-mean winds and the JJA-mean verticalpressure velocity is shown in Fig. 2f. Note that withinthe domain of this study (60°–100°E), the zonal varia-tion of JJA-mean atmospheric variables is muchsmaller than the meridional variation. Thus, the zonallyaveraged basic state adequately represents the spatialvariation in this domain.
b. Simulation of intraseasonal oscillation in thezonally averaged model
Figure 3 shows the evolution of precipitation, and thelow-level zonal and meridional winds simulated by the2D model. Northward propagation of precipitation is
evident with a period of about 15–20 days (Fig. 3a).Two locations of strong precipitation are found. Onecovers from 10° to 25°N, and the other is located be-tween 10°S and the equator. Although a weak south-ward propagation of precipitation from 2° to 10°S isfound, the southern area of precipitation is not aswell organized as its counterpart in the north. The low-level winds in Figs. 3b and 3c show that convection(precipitation) is followed by westerlies and souther-lies. While the period of the oscillation is somewhatshorter than observed, the simulated northward propa-gation has a realistic structure (e.g., Sikka and Gadil1980; Lawrence and Webster 2002). The ability of thezonally averaged model in simulating BSISO suggeststhat the zonally propagating Rossby wave–like orKelvin wave–like convection is not a critical elementfor the northward propagation and the initiation of con-vection.
For a more detailed analysis, the period betweendays 72 and 87 is chosen as a life cycle of BSISO (Fig.4). At day 72, the maximum precipitation is located atthe latitude 20°N. When this precipitation anomalymoves northward from day 72 to 80, its intensity de-creases from more than 2.8 mm day�1 (day 72) to lessthan 0.25 mm day�1 (day 80). Meanwhile, new convec-
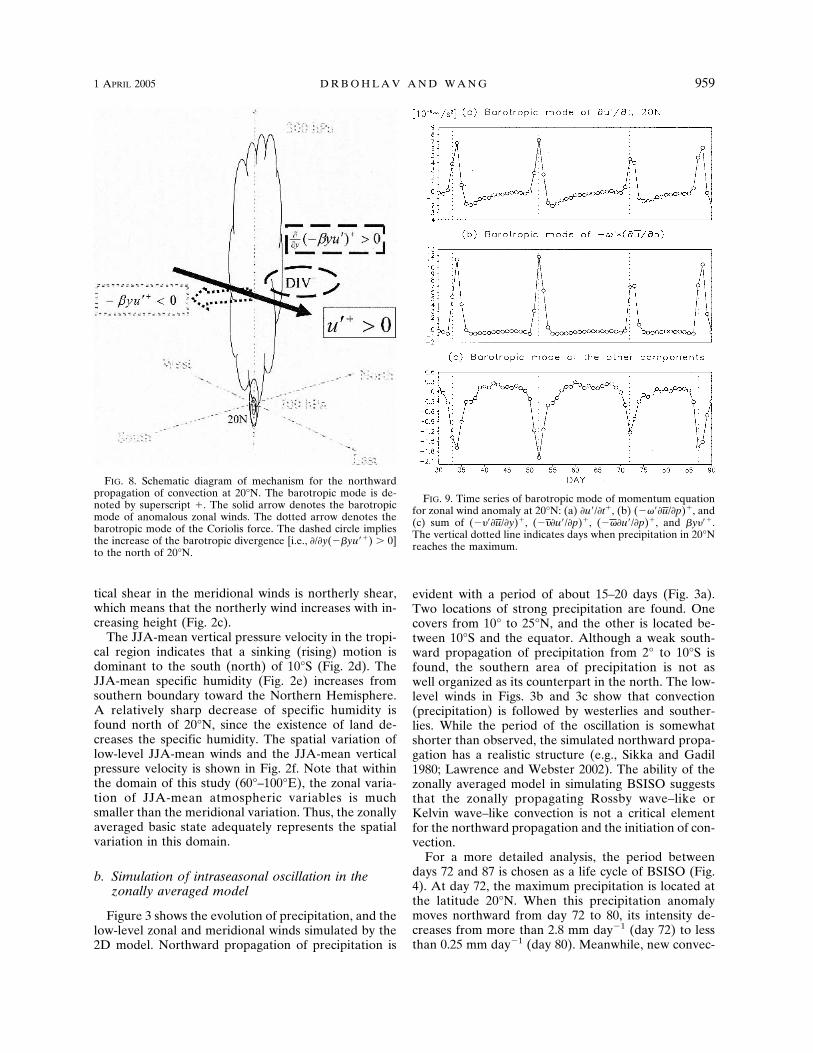
FIG. 8. Schematic diagram of mechanism for the northwardpropagation of convection at 20°N. The barotropic mode is de-noted by superscript �. The solid arrow denotes the barotropicmode of anomalous zonal winds. The dotted arrow denotes thebarotropic mode of the Coriolis force. The dashed circle impliesthe increase of the barotropic divergence [i.e., �/�y(��yu��) � 0]to the north of 20°N.
FIG. 9. Time series of barotropic mode of momentum equationfor zonal wind anomaly at 20°N: (a) �u�/�t�, (b) (����u/�p)�, and(c) sum of (����u/�y)�, (���u�/�p)�, (���u�/�p)�, and �y���.The vertical dotted line indicates days when precipitation in 20°Nreaches the maximum.
1 APRIL 2005 D R B O H L A V A N D W A N G 959
tion develops at 2°S at day 72. This new convection at2°S divides into the southward- and the northward-propagating cells. While the southward-propagatingconvection dissipates as it reaches 10°S at day 84, thenorthward-propagating convection intensifies until itarrives at 18°N at day 86. The propagation speed ofprecipitation in the 2D model is about 4° latitude day�1.Simulating the realistic period (30–90 day) and thepropagating speed (1° latitude day�1) of BSISO in the2D model is a difficult task due to the simplificationinvolved in the 2D model. For example, the absence ofthe zonal divergence in 2D model results in the fastgrowth of horizontal divergence (convergence), sincethere is no cancellation between the meridional andzonal divergences during the formation of the horizon-tal divergence (convergence). This might be one of thereasons why the simulated BSISO exhibits the shorterperiod and the faster propagating speed than that ofobservations. Despite this limitation, the 2D model issuccessful in qualitatively reproducing the observedfeatures of winds and precipitation associated with thenorthward-propagating BSISO. Thus, by examining themechanism of the model-simulated BSISO, one can stillobtain insight into the observed counterpart.
4. Mechanism of northward propagation
a. Barotropic and baroclinic mode
Understanding the mechanism of northward propa-gation of convection can be facilitated by analyzing thebarotropic and baroclinic modes of the atmosphere.The barotropic mode (A�) and baroclinic mode (A�)of an arbitrary variable (A) are defined as
A� �A1 � A2
2, A� �
A1 � A2
2. �10�
Combining (1.1c), (1.2c), (9a), and (10) leads to
Pr � �p�����
�y ��2qe � q2� � �p�����
�y �q2. �11�
The first and second terms in (11) indicate the contri-bution of the moisture convergence associated with thebarotropic and baroclinic modes of the atmosphere, re-spectively. In analyzing the result, the barotropic andbaroclinic modes are examined separately, since therole of the barotropic and baroclinic modes on BSISOis quite different. In particular, the baroclinic mode inthe 2D model enhances the intensity of the existingconvection, while the barotropic mode promotes the
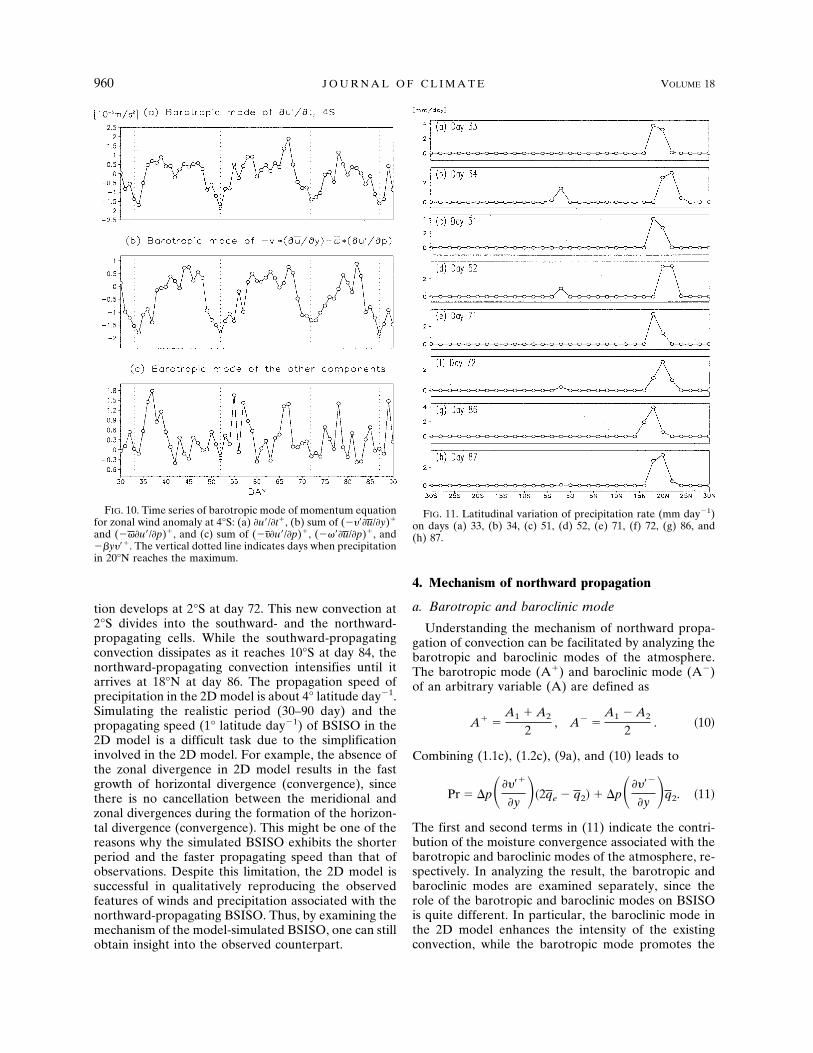
FIG. 10. Time series of barotropic mode of momentum equationfor zonal wind anomaly at 4°S: (a) �u�/�t�, (b) sum of (����u/�y)�
and (���u�/�p)�, and (c) sum of (���u�/�p)�, (����u/�p)�, and��y���. The vertical dotted line indicates days when precipitationin 20°N reaches the maximum.
FIG. 11. Latitudinal variation of precipitation rate (mm day�1)on days (a) 33, (b) 34, (c) 51, (d) 52, (e) 71, (f) 72, (g) 86, and(h) 87.
960 J O U R N A L O F C L I M A T E VOLUME 18
northward propagation of convection. For example,when latent heat is released at the center of convection,horizontal divergence (convergence) develops in theupper (lower) free atmosphere. The upper-level diver-gence and the lower-level convergence (strengtheningof the baroclinic mode) drive more moisture into theconvective center, so that existing convection is inten-sified. The barotropic mode of atmosphere, on theother hand, causes the northward propagation of con-vection by inducing the boundary layer moisture con-vergence to the north (ahead) of existing convection(explained in the section 4b).
Shown in Fig. 5 is the baroclinic mode of moisture-divergence tendency, which can be related to the pre-cipitation as
�
�tPr �
�
�t �����
�y �q2. �12�
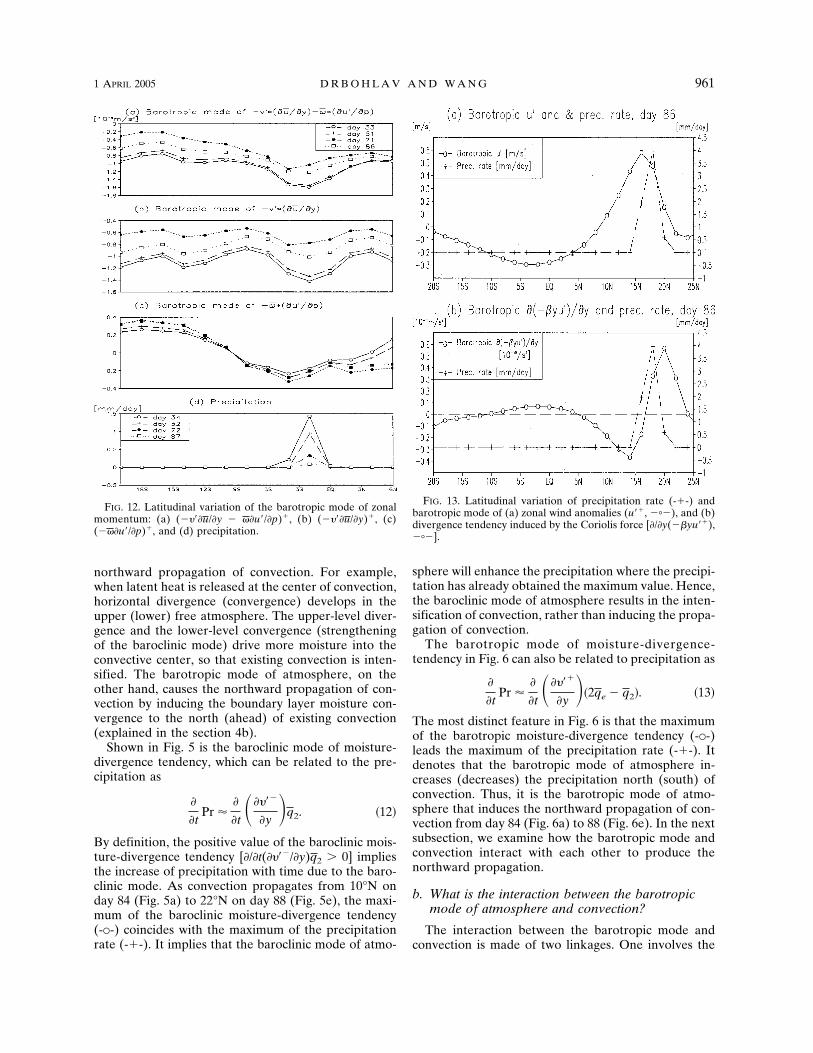
By definition, the positive value of the baroclinic mois-ture-divergence tendency [�/�t(����/�y)q2 � 0] impliesthe increase of precipitation with time due to the baro-clinic mode. As convection propagates from 10°N onday 84 (Fig. 5a) to 22°N on day 88 (Fig. 5e), the maxi-mum of the baroclinic moisture-divergence tendency(-�-) coincides with the maximum of the precipitationrate (-�-). It implies that the baroclinic mode of atmo-
sphere will enhance the precipitation where the precipi-tation has already obtained the maximum value. Hence,the baroclinic mode of atmosphere results in the inten-sification of convection, rather than inducing the propa-gation of convection.
The barotropic mode of moisture-divergence-tendency in Fig. 6 can also be related to precipitation as
�
�tPr �
�
�t �����
�y ��2qe � q2�. �13�
The most distinct feature in Fig. 6 is that the maximumof the barotropic moisture-divergence tendency (-�-)leads the maximum of the precipitation rate (-�-). Itdenotes that the barotropic mode of atmosphere in-creases (decreases) the precipitation north (south) ofconvection. Thus, it is the barotropic mode of atmo-sphere that induces the northward propagation of con-vection from day 84 (Fig. 6a) to 88 (Fig. 6e). In the nextsubsection, we examine how the barotropic mode andconvection interact with each other to produce thenorthward propagation.
b. What is the interaction between the barotropicmode of atmosphere and convection?
The interaction between the barotropic mode andconvection is made of two linkages. One involves the
FIG. 12. Latitudinal variation of the barotropic mode of zonalmomentum: (a) (����u/�y � ��u�/�p)�, (b) (����u/�y)�, (c)(���u�/�p)�, and (d) precipitation.
FIG. 13. Latitudinal variation of precipitation rate (-�-) andbarotropic mode of (a) zonal wind anomalies (u��, ���), and (b)divergence tendency induced by the Coriolis force [�/�y(��yu��),���].
1 APRIL 2005 D R B O H L A V A N D W A N G 961
influence of the barotropic mode on convection, andthe other is the feedback of convection on the barotro-pic mode. In the first linkage, the barotropic mode ofatmosphere affects convection by controlling the mois-ture convergence in the boundary layer. According to(7), convergence in the boundary layer is determinedby the divergence in the barotropic mode of the atmo-sphere. Hence, when the divergence of barotropicmode is located to the north of convection, it can gen-erate the boundary layer moisture convergence aheadof convection, and promotes the northward migrationof the BSISO.
In the feedback, convection enhances the barotropicmode of divergence [�/�t(����/�y) � 0] to the north of
convection by controlling the barotropic mode ofanomalous zonal wind (u��). In the 2D model themomentum equation of meridional winds can be ap-proximated by the sum of Coriolis force and geo-otential gradient force. Based on this approximation,the barotropic mode of the atmosphere can be ex-pressed as
����
�t� �
���
�y� �yu��, �14a�
�
�t �����
�y � ��
�y �����
�y � ��
�y���yu���. �14b�
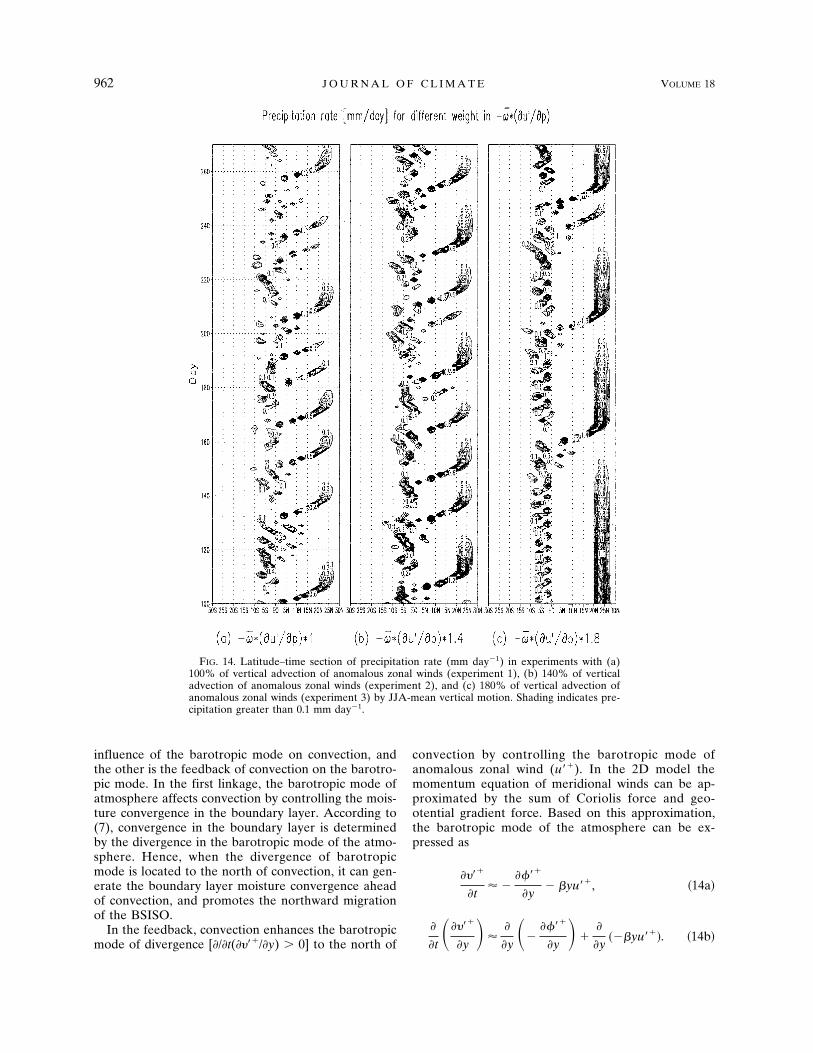
FIG. 14. Latitude–time section of precipitation rate (mm day�1) in experiments with (a)100% of vertical advection of anomalous zonal winds (experiment 1), (b) 140% of verticaladvection of anomalous zonal winds (experiment 2), and (c) 180% of vertical advection ofanomalous zonal winds (experiment 3) by JJA-mean vertical motion. Shading indicates pre-cipitation greater than 0.1 mm day�1.
962 J O U R N A L O F C L I M A T E VOLUME 18
Note that the barotropic mode of divergence tendency[�/�t(����/�y)] in (14b) is a function of geopotential gra-dient force [e.g., �/�y(����/�y)] and the Coriolis force[e.g., �/�y(��yu��)]. The resemblance between the me-ridional structures of �/�y(��yu��)(2qe � q2) (seeFig. 7) and �/�t(����/�y)(2qe � q2) (Fig. 6), in terms ofthe relative location of their maximum value with re-spect to convection, leads the further simplification of(14b) as
�
�t �����
�y � ��
�y���yu���. �15�
It is indicated in (15) that convection can influence thebarotropic mode of divergence by controlling the baro-tropic zonal winds.
Figure 8 displays a schematic diagram of this rela-tionship. When convection is located in the NorthernHemisphere, at say 20°N, the barotropic mode of zonalwinds inside convection becomes westerlies (u�� � 0,Fig. 8). The Coriolis force induced by these barotropicwesterlies (��yu�� � 0, Fig. 8) accelerates the baro-tropic northerly inside convection region (14a). In re-sponse to this local acceleration of northerly at the cen-ter of convection [��yu�� � 0, Fig. 8, and (14a)], thebarotropic divergence develops [�/�y(��yu��) � 0,(15)] to the north of convection (Fig. 8). This barotropicdivergence of the free atmosphere to the north of con-vection triggers moisture convergence in the boundarylayer and facilitates the northward propagation of con-vection. The relationship between the barotropic diver-gence and the barotropic zonal winds is such that the
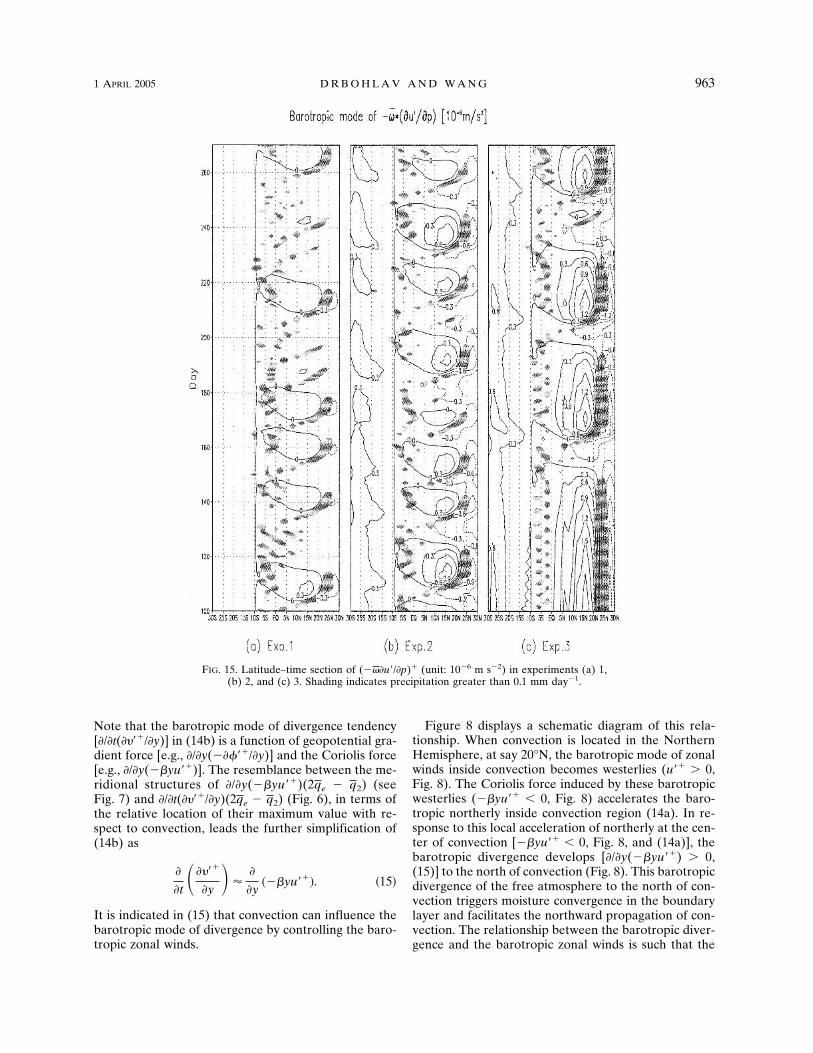
FIG. 15. Latitude–time section of (���u�/�p)� (unit: 10�6 m s�2) in experiments (a) 1,(b) 2, and (c) 3. Shading indicates precipitation greater than 0.1 mm day�1.
1 APRIL 2005 D R B O H L A V A N D W A N G 963
development of barotropic westerlies inside convectionis critical in order for convection to propagate north-ward.
The development of barotropic westerlies associatedwith convection can be explained by examining thebarotropic mode of zonal momentum equation, whichis derived by combining (1.1a), (1.2a), and (10):
�u�+
�t� ���
�u�
�y� ��
�u
�y� �
�u�
�p� ��
�u
�p
� �y�� � �u� � K�2u�
�y2 ��
. �16�
The barotropic mode of zonal winds is controlled byeach term on the rhs of (16). The relative dominance
among the terms in (16) changes during differentphases of convection. Especially, at the mature phase ofconvection the vertical advection of JJA-mean zonalwinds (����u/�p)� controls the variation of zonalwinds (�u�/�t�). For example, shown in Fig. 9 are thebarotropic modes of zonal wind tendency [(�u�/�t�),Fig. 9a], the vertical advection of JJA-mean zonal winds[(����u/�p)�, Fig. 9b], and the sum of other compo-nents in zonal momentum equation (Fig. 9c) at 20°N.Days 33, 52, 72, and 87 in Fig. 9 are the times when themaximum precipitation is found at 20°N, and markedwith the vertical dotted line. On those days the baro-tropic zonal wind tendency increases [(�u�/�t�) � 0, Fig.9a] as a result of positive vertical advection of JJA-mean zonal winds [(����u/�p)� � 0, Fig. 9b]. It meansthat when convection develops at 20°N the rising mo-
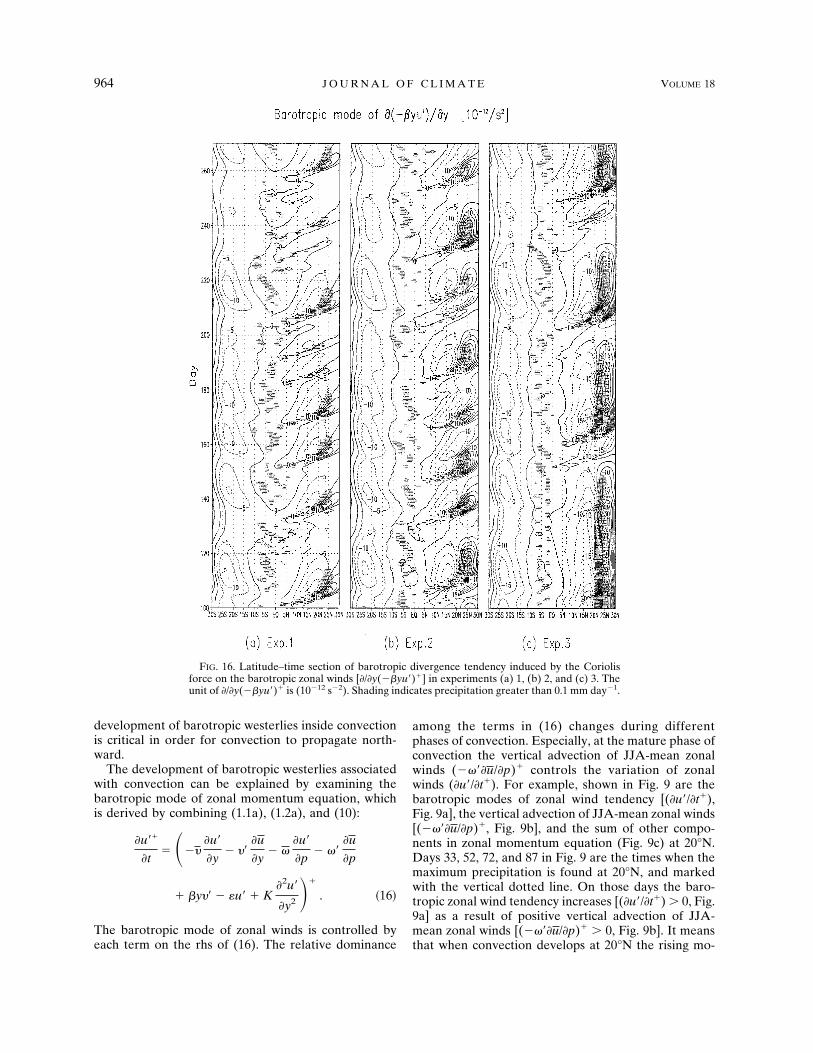
FIG. 16. Latitude–time section of barotropic divergence tendency induced by the Coriolisforce on the barotropic zonal winds [�/�y(��yu�)�] in experiments (a) 1, (b) 2, and (c) 3. Theunit of �/�y(��yu�)� is (10�12 s�2). Shading indicates precipitation greater than 0.1 mm day�1.
964 J O U R N A L O F C L I M A T E VOLUME 18
tion (�� � 0) inside convection advects the low-level,JJA-mean westerlies (u � 0, Fig. 2a) throughout thelayers, so that the westerly anomalies increase in boththe upper and lower level of the atmosphere. Since thispositive advection of JJA-mean zonal winds [(����u/�p)� � 0] is strongest near the convection, barotropicwesterlies are often found associated with convection asillustrated in the schematic diagram (Fig. 8).
The above mechanism may also be valid in theSouthern Hemisphere as long as the signs of the Corio-lis parameter (�y) and the JJA-mean vertical shear ofzonal winds (�u/�p) are considered. For instance, thechange in the Coriolis parameter across the equatorresults in the southward propagation of convection in
the Southern Hemisphere, only if the underlying verti-cal shear of JJA-mean zonal winds is easterly (�u/�p �0). When the vertical shear of the JJA-mean becomeswesterly (�u/�p � 0, Fig. 2c), as in the latitude south of10°S, the convection cannot propagate farther south.
5. The development of convection south of theequator
a. Development of barotropic easterlies
It is suggested in the previous section that the north-ward propagation of the BSISO depends on the verticaladvection of JJA-mean zonal winds [(����u/�p)�] as-
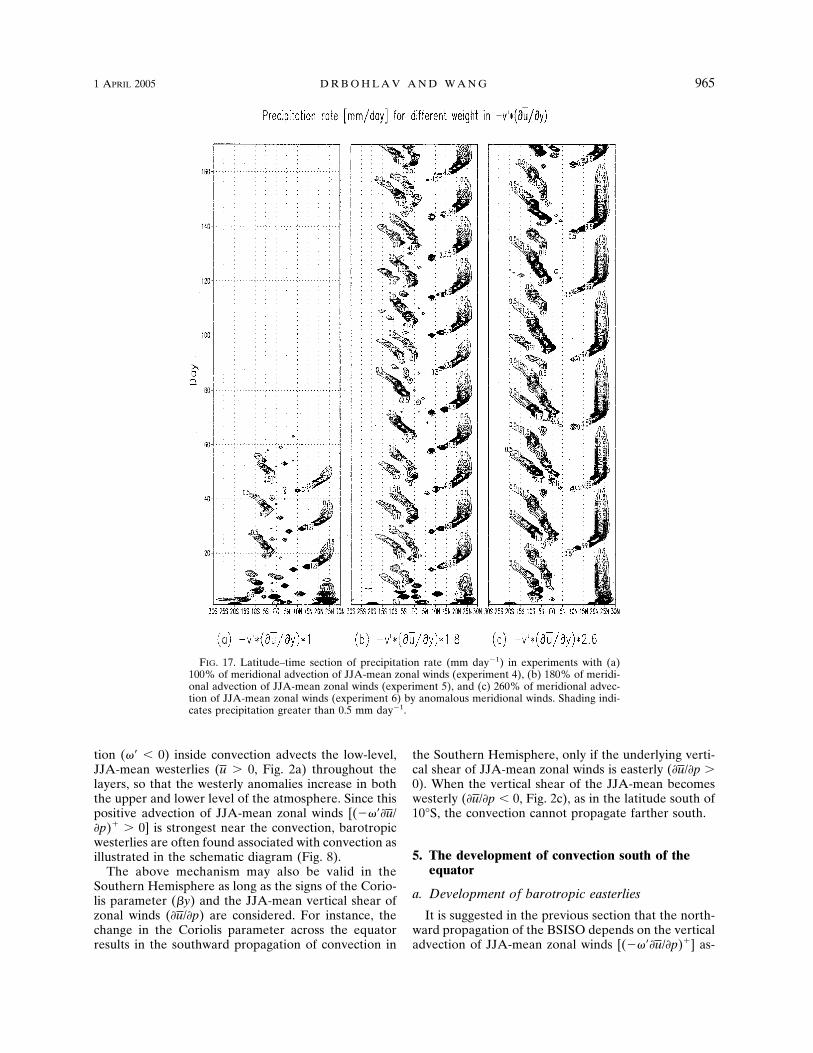
FIG. 17. Latitude–time section of precipitation rate (mm day�1) in experiments with (a)100% of meridional advection of JJA-mean zonal winds (experiment 4), (b) 180% of meridi-onal advection of JJA-mean zonal winds (experiment 5), and (c) 260% of meridional advec-tion of JJA-mean zonal winds (experiment 6) by anomalous meridional winds. Shading indi-cates precipitation greater than 0.5 mm day�1.
1 APRIL 2005 D R B O H L A V A N D W A N G 965
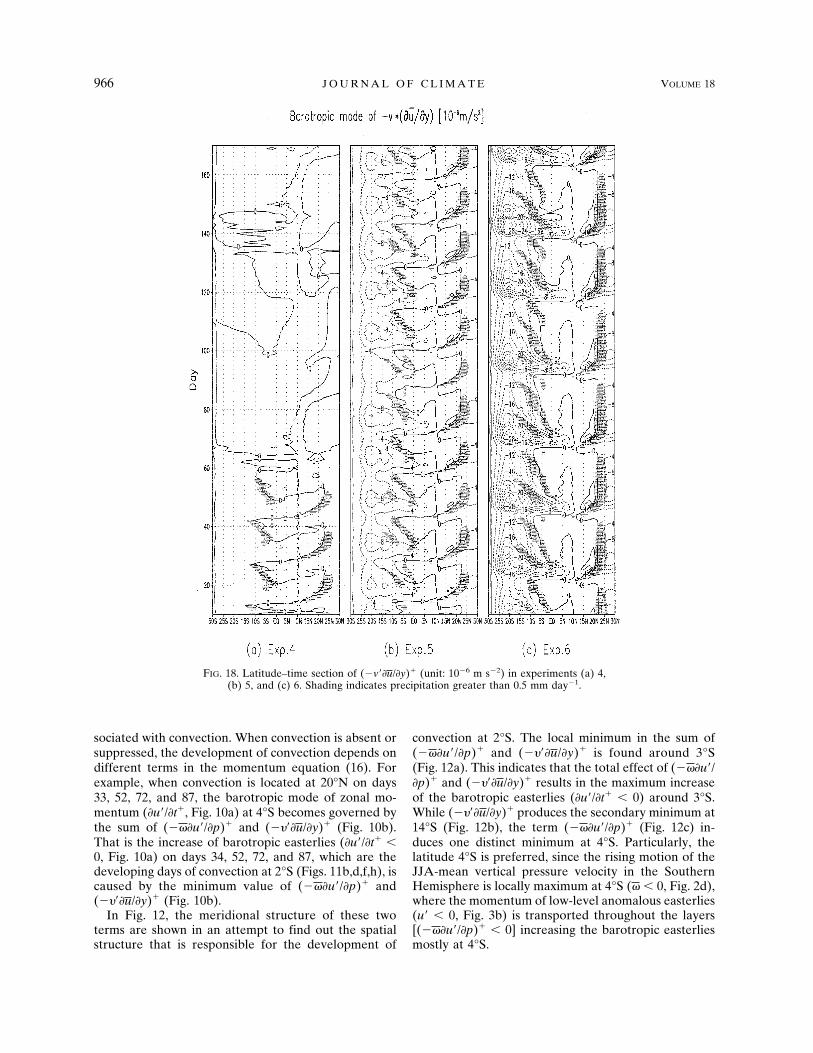
sociated with convection. When convection is absent orsuppressed, the development of convection depends ondifferent terms in the momentum equation (16). Forexample, when convection is located at 20°N on days33, 52, 72, and 87, the barotropic mode of zonal mo-mentum (�u�/�t�, Fig. 10a) at 4°S becomes governed bythe sum of (���u�/�p)� and (����u/�y)� (Fig. 10b).That is the increase of barotropic easterlies (�u�/�t� �0, Fig. 10a) on days 34, 52, 72, and 87, which are thedeveloping days of convection at 2°S (Figs. 11b,d,f,h), iscaused by the minimum value of (���u�/�p)� and(����u/�y)� (Fig. 10b).
In Fig. 12, the meridional structure of these twoterms are shown in an attempt to find out the spatialstructure that is responsible for the development of
convection at 2°S. The local minimum in the sum of(���u�/�p)� and (����u/�y)� is found around 3°S(Fig. 12a). This indicates that the total effect of (���u�/�p)� and (����u/�y)� results in the maximum increaseof the barotropic easterlies (�u�/�t� � 0) around 3°S.While (����u/�y)� produces the secondary minimum at14°S (Fig. 12b), the term (���u�/�p)� (Fig. 12c) in-duces one distinct minimum at 4°S. Particularly, thelatitude 4°S is preferred, since the rising motion of theJJA-mean vertical pressure velocity in the SouthernHemisphere is locally maximum at 4°S (� � 0, Fig. 2d),where the momentum of low-level anomalous easterlies(u� � 0, Fig. 3b) is transported throughout the layers[(���u�/�p)� � 0] increasing the barotropic easterliesmostly at 4°S.
FIG. 18. Latitude–time section of (�v��u/�y)� (unit: 10�6 m s�2) in experiments (a) 4,(b) 5, and (c) 6. Shading indicates precipitation greater than 0.5 mm day�1.
966 J O U R N A L O F C L I M A T E VOLUME 18

b. Roles of barotropic easterlies in the developmentof convection
When the increase of easterly momentum by ��� (�u/�y) and ��(�u�/�p) results in the local maximum ofbarotropic easterlies near 4°S on day 86 (u�� � 0, Fig.13a), these barotropic easterlies induce the barotropicdivergence [�/�y(��yu�)� � 0] in the latitude between10°S and 5°N (Fig. 13b). The barotropic divergence inthese latitudes, in turn, triggers the boundary layer con-vergence, which promotes the development of new con-vection in the latitude between 10°S and 5°N.
The physical meaning of [�/�y(��yu�)�] can be ex-amined by dividing this term into (��u��) and�y*(��u��/�y). That is,
�
�t �����
�y � ��
�y���yu��� � ��u�� � �y��
�u��
�y �.
�17�
The term (��u��) in (17) implies that the barotropiceasterlies (u�� � 0) can increase the barotropic diver-gence [�/�t(����/�y) � 0]. According to the term(��u��), the barotropic divergence must increase inthe whole latitude between 20°S and 6°N on day 86(Fig. 13a). However, because of the impact of the shearvorticity of the barotropic easterlies (��u��/�y) the lati-tude of [(�/�y)(��yu�)� � 0] is further confined on day86 (Fig. 13b).
FIG. 19. Latitude–time section of barotropic divergence tendency induced by the Coriolisforce on the barotropic zonal winds [�/�y(��yu�)�] in experiments (a) 4, (b) 5, and (c) 6. Theunit of �/�y(��yu�)� is (10�11 s�2). Shading indicates precipitation greater than 0.5 mm day�1.
1 APRIL 2005 D R B O H L A V A N D W A N G 967
6. Further numerical experiments
The analysis of the simulated BSISO in the 2D modelsuggests that (���u�/�p) and (����u/�y) control the de-velopment of convection in the Southern Hemisphere,while (����u/�p) causes the propagation of convectionin the Northern Hemisphere. In this section, this hy-pothesis is examined by using nine experiments. In thenine numerical experiments, the JJA-mean vertical ad-vection of anomalous zonal winds (���u�/�p), theanomalous meridional advection of JJA-mean zonalwinds (����u/�y), and the anomalous vertical advectionof JJA-mean zonal winds (����u/�p) are artificially en-hanced or reduced.
a. The effect of (���u�/�p) on the BSISO(experiments 1, 2, and 3)
In experiments 1, 2, and 3 the JJA-mean vertical ad-vection of anomalous zonal winds (���u�/�p) is de-signed to be 100% (experiment 1), 140% (experiment2), and 180% (experiment 3) of the original value, while(����u/�y) is set to be zero (experiments 1, 2, and 3)throughout these experiments. By comparing resultsamong experiments 1, 2, and 3, one may identify theeffect of the JJA-mean vertical advection of anomalouszonal winds on the intraseasonal oscillation. Whenthe magnitude of (���u�/�p) is increased from 100%(Fig. 14a) to 180% (Fig. 14c) the frequency of convec-
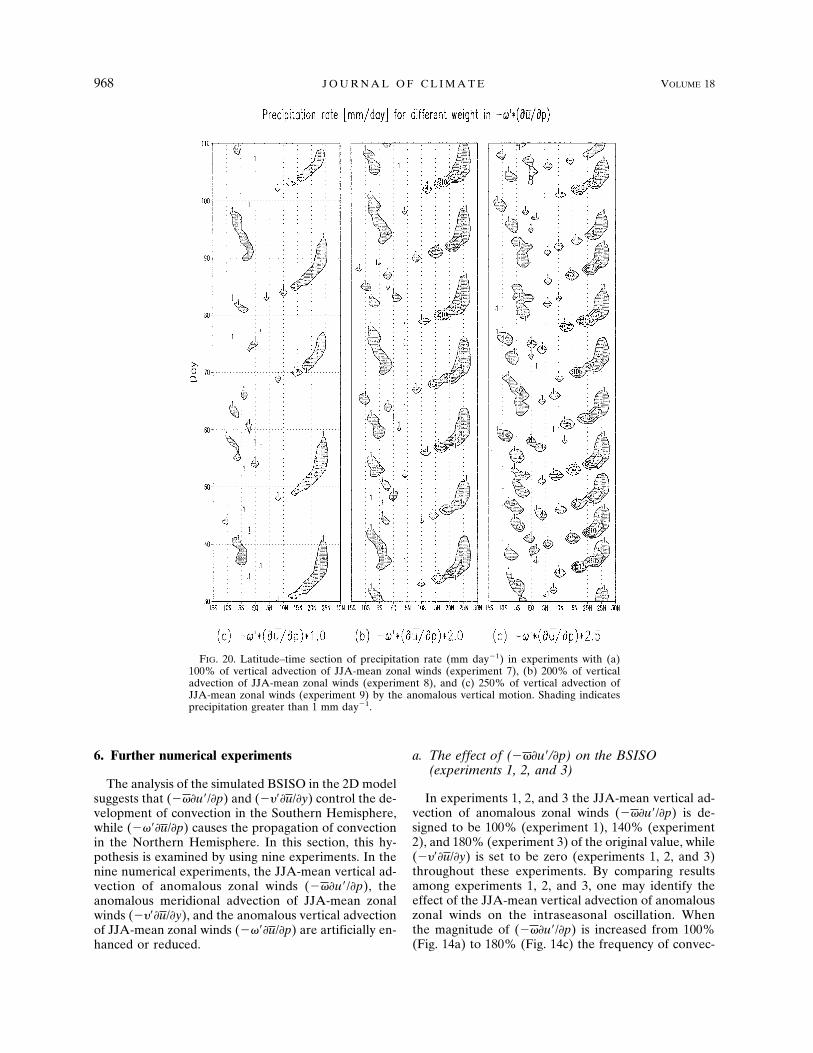
FIG. 20. Latitude–time section of precipitation rate (mm day�1) in experiments with (a)100% of vertical advection of JJA-mean zonal winds (experiment 7), (b) 200% of verticaladvection of JJA-mean zonal winds (experiment 8), and (c) 250% of vertical advection ofJJA-mean zonal winds (experiment 9) by the anomalous vertical motion. Shading indicatesprecipitation greater than 1 mm day�1.
968 J O U R N A L O F C L I M A T E VOLUME 18
tion decreases, while the intensity of convection in-creases.
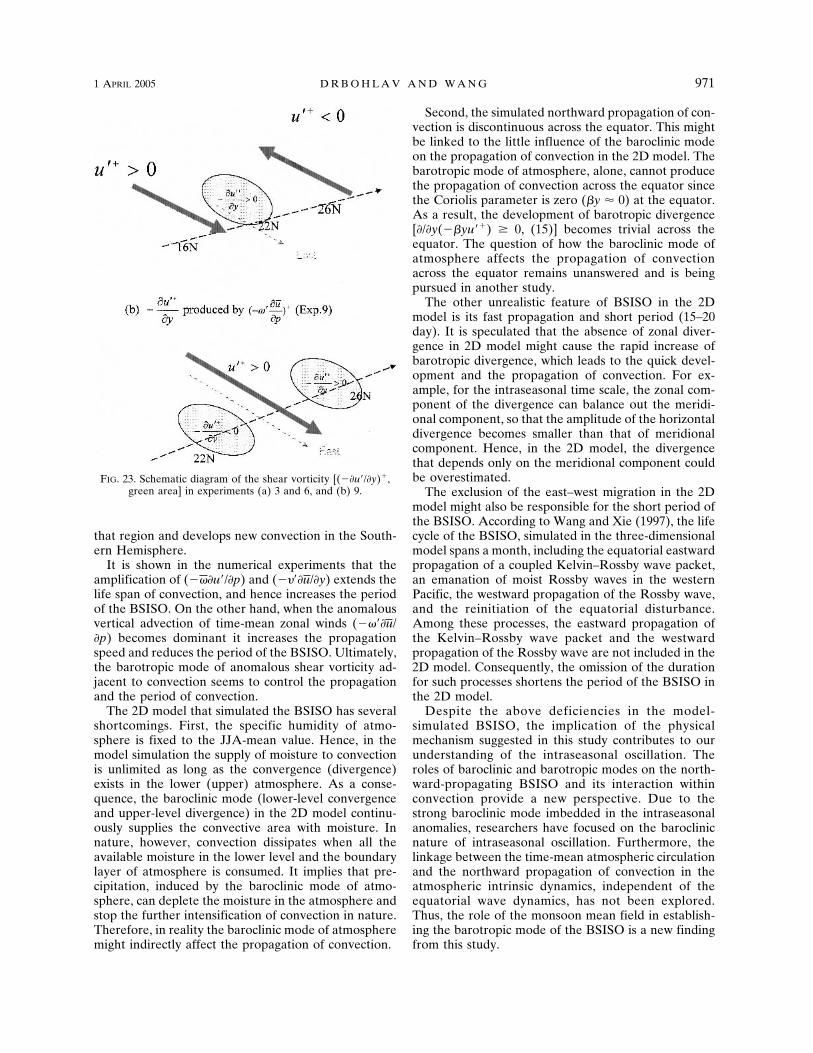
As (���u�/�p) becomes dominant (experiment 3;Fig. 15c), it accelerates the barotropic westerlies(���u�/�p � 0) and the barotropic easterlies (���u�/�p� 0) to the south and to the north of convection, re-spectively. Accordingly, the positive barotropic shearvorticity (��u��/�y � 0, Fig. 23a) develops in between,inducing barotropic divergence at 24°N [�(��yu�)�/�y� 0, Fig. 16c]. As a result, the life span of convection at24°N is extended, causing the low frequency of theBSISO in experiment 3.
b. The effect of (����u/�y) on the BSISO(experiments 4, 5, and 6)
In experiments 4, 5, and 6 (���u�/�p) is set to bezero, and (����u/�y) is weighted as 100% (experiment4), 180% (experiment 5), and 260% (experiment 6) ofthe original value. When (����u/�y) is weighted as100% the initial disturbances are dissipated by day 58(Fig. 17a). As (����u/�y) is enhanced to be 260% theintensity of the BSISO increases while the frequencydecreases (Fig. 17c). Similar to the case of experiment3, the reduced frequency of the BSISO in experiment 6seems to be related with the local acceleration of thebarotropic westerly at 18°N and the barotropic easterlyat 28°N (Fig. 18c). The resultant positive shear vorticity(Fig. 23a) generates the barotropic divergence (Fig.19c) in the region of convection, so that the period ofthe BSISO, as well as the duration of convection, isextended. In the Southern Hemisphere, the maximumbarotropic easterly at 20°S (Fig. 18c) enhances the baro-tropic divergence between 15°S and the equator (Fig.19c). Consequently, the convection in the SouthernHemisphere becomes well organized in experiment 6.
c. The effect of (����u/�p) on the BSISO(experiments 7, 8, and 9)
In experiments 7, 8, and 9 the weight of the anoma-lous vertical advection of JJA-mean zonal winds(����u/�p) is changed from 100% to 250% of its origi-nal value. As the weight of vertical advection increasesfrom 100% (Fig. 20a) to 250% (Fig. 20c), the frequency,propagating speed, and intensity of convection in-crease. The increase of the frequency in experiment 9 isdifferent from the previous experiments where the fre-quency decreases as the intensity of convection in-creases (experiments 3 and 6).
This discrepancy between experiments 3, 6, and 9may be caused by the different dissipating rates of con-vection. For, example, when convection is located at22°N in experiments 3 (Fig. 21a) and 6 (Fig. 21b) itbecomes stationary before it dissipates. On the otherhand, convection in experiment 9 (Fig. 21c) keepspropagating northward. The northward-propagatingconvection might have a faster dissipating rate, since
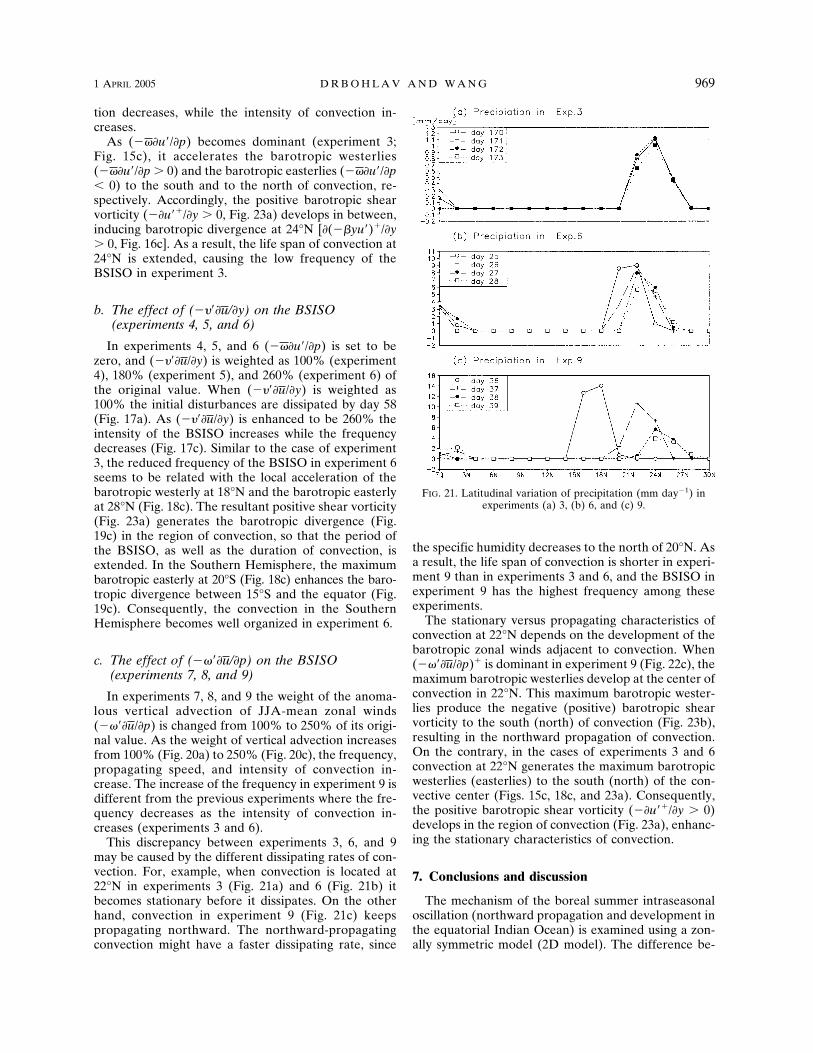
the specific humidity decreases to the north of 20°N. Asa result, the life span of convection is shorter in experi-ment 9 than in experiments 3 and 6, and the BSISO inexperiment 9 has the highest frequency among theseexperiments.
The stationary versus propagating characteristics ofconvection at 22°N depends on the development of thebarotropic zonal winds adjacent to convection. When(����u/�p)� is dominant in experiment 9 (Fig. 22c), themaximum barotropic westerlies develop at the center ofconvection in 22°N. This maximum barotropic wester-lies produce the negative (positive) barotropic shearvorticity to the south (north) of convection (Fig. 23b),resulting in the northward propagation of convection.On the contrary, in the cases of experiments 3 and 6convection at 22°N generates the maximum barotropicwesterlies (easterlies) to the south (north) of the con-vective center (Figs. 15c, 18c, and 23a). Consequently,the positive barotropic shear vorticity (��u��/�y � 0)develops in the region of convection (Fig. 23a), enhanc-ing the stationary characteristics of convection.
7. Conclusions and discussion
The mechanism of the boreal summer intraseasonaloscillation (northward propagation and development inthe equatorial Indian Ocean) is examined using a zon-ally symmetric model (2D model). The difference be-
FIG. 21. Latitudinal variation of precipitation (mm day�1) inexperiments (a) 3, (b) 6, and (c) 9.
1 APRIL 2005 D R B O H L A V A N D W A N G 969
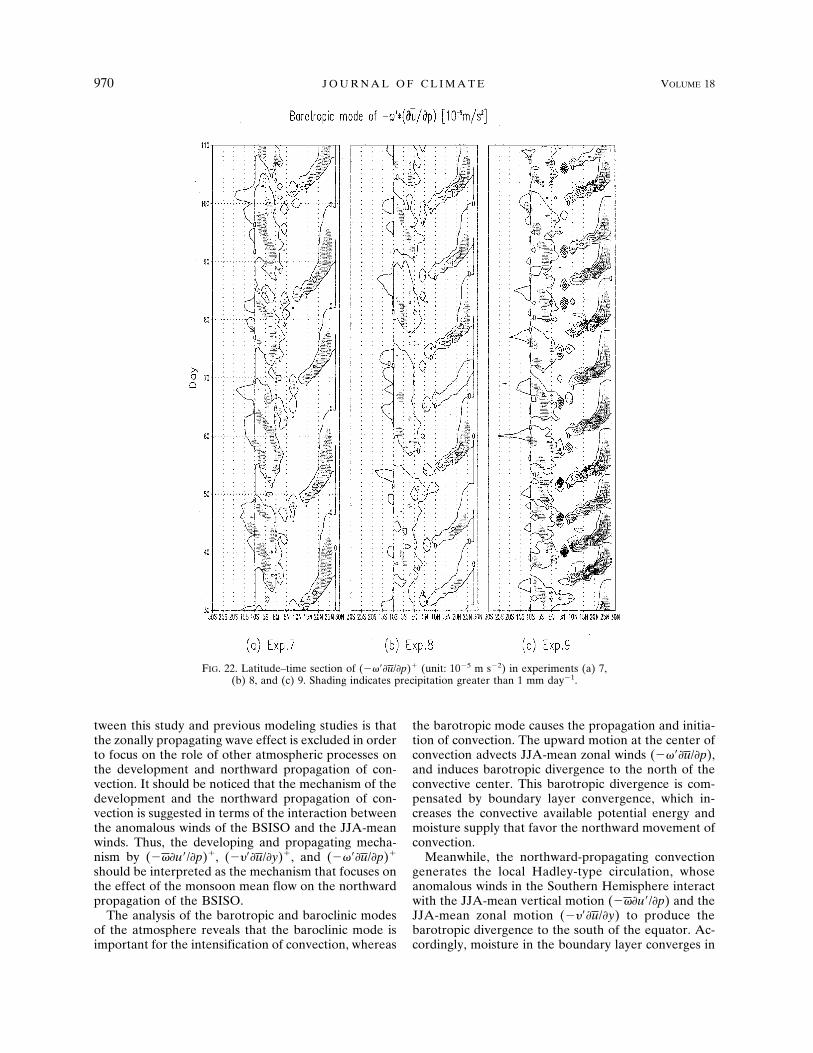
tween this study and previous modeling studies is thatthe zonally propagating wave effect is excluded in orderto focus on the role of other atmospheric processes onthe development and northward propagation of con-vection. It should be noticed that the mechanism of thedevelopment and the northward propagation of con-vection is suggested in terms of the interaction betweenthe anomalous winds of the BSISO and the JJA-meanwinds. Thus, the developing and propagating mecha-nism by (���u�/�p)�, (����u/�y)�, and (����u/�p)�
should be interpreted as the mechanism that focuses onthe effect of the monsoon mean flow on the northwardpropagation of the BSISO.
The analysis of the barotropic and baroclinic modesof the atmosphere reveals that the baroclinic mode isimportant for the intensification of convection, whereas
the barotropic mode causes the propagation and initia-tion of convection. The upward motion at the center ofconvection advects JJA-mean zonal winds (����u/�p),and induces barotropic divergence to the north of theconvective center. This barotropic divergence is com-pensated by boundary layer convergence, which in-creases the convective available potential energy andmoisture supply that favor the northward movement ofconvection.
Meanwhile, the northward-propagating convectiongenerates the local Hadley-type circulation, whoseanomalous winds in the Southern Hemisphere interactwith the JJA-mean vertical motion (���u�/�p) and theJJA-mean zonal motion (����u/�y) to produce thebarotropic divergence to the south of the equator. Ac-cordingly, moisture in the boundary layer converges in
FIG. 22. Latitude–time section of (����u/�p)� (unit: 10�5 m s�2) in experiments (a) 7,(b) 8, and (c) 9. Shading indicates precipitation greater than 1 mm day�1.
970 J O U R N A L O F C L I M A T E VOLUME 18
that region and develops new convection in the South-ern Hemisphere.
It is shown in the numerical experiments that theamplification of (���u�/�p) and (����u/�y) extends thelife span of convection, and hence increases the periodof the BSISO. On the other hand, when the anomalousvertical advection of time-mean zonal winds (����u/�p) becomes dominant it increases the propagationspeed and reduces the period of the BSISO. Ultimately,the barotropic mode of anomalous shear vorticity ad-jacent to convection seems to control the propagationand the period of convection.
The 2D model that simulated the BSISO has severalshortcomings. First, the specific humidity of atmo-sphere is fixed to the JJA-mean value. Hence, in themodel simulation the supply of moisture to convectionis unlimited as long as the convergence (divergence)exists in the lower (upper) atmosphere. As a conse-quence, the baroclinic mode (lower-level convergenceand upper-level divergence) in the 2D model continu-ously supplies the convective area with moisture. Innature, however, convection dissipates when all theavailable moisture in the lower level and the boundarylayer of atmosphere is consumed. It implies that pre-cipitation, induced by the baroclinic mode of atmo-sphere, can deplete the moisture in the atmosphere andstop the further intensification of convection in nature.Therefore, in reality the baroclinic mode of atmospheremight indirectly affect the propagation of convection.
Second, the simulated northward propagation of con-vection is discontinuous across the equator. This mightbe linked to the little influence of the baroclinic modeon the propagation of convection in the 2D model. Thebarotropic mode of atmosphere, alone, cannot producethe propagation of convection across the equator sincethe Coriolis parameter is zero (�y � 0) at the equator.As a result, the development of barotropic divergence[�/�y(��yu��) 0, (15)] becomes trivial across theequator. The question of how the baroclinic mode ofatmosphere affects the propagation of convectionacross the equator remains unanswered and is beingpursued in another study.
The other unrealistic feature of BSISO in the 2Dmodel is its fast propagation and short period (15–20day). It is speculated that the absence of zonal diver-gence in 2D model might cause the rapid increase ofbarotropic divergence, which leads to the quick devel-opment and the propagation of convection. For ex-ample, for the intraseasonal time scale, the zonal com-ponent of the divergence can balance out the meridi-onal component, so that the amplitude of the horizontaldivergence becomes smaller than that of meridionalcomponent. Hence, in the 2D model, the divergencethat depends only on the meridional component couldbe overestimated.
The exclusion of the east–west migration in the 2Dmodel might also be responsible for the short period ofthe BSISO. According to Wang and Xie (1997), the lifecycle of the BSISO, simulated in the three-dimensionalmodel spans a month, including the equatorial eastwardpropagation of a coupled Kelvin–Rossby wave packet,an emanation of moist Rossby waves in the westernPacific, the westward propagation of the Rossby wave,and the reinitiation of the equatorial disturbance.Among these processes, the eastward propagation ofthe Kelvin–Rossby wave packet and the westwardpropagation of the Rossby wave are not included in the2D model. Consequently, the omission of the durationfor such processes shortens the period of the BSISO inthe 2D model.
Despite the above deficiencies in the model-simulated BSISO, the implication of the physicalmechanism suggested in this study contributes to ourunderstanding of the intraseasonal oscillation. Theroles of baroclinic and barotropic modes on the north-ward-propagating BSISO and its interaction withinconvection provide a new perspective. Due to thestrong baroclinic mode imbedded in the intraseasonalanomalies, researchers have focused on the baroclinicnature of intraseasonal oscillation. Furthermore, thelinkage between the time-mean atmospheric circulationand the northward propagation of convection in theatmospheric intrinsic dynamics, independent of theequatorial wave dynamics, has not been explored.Thus, the role of the monsoon mean field in establish-ing the barotropic mode of the BSISO is a new findingfrom this study.
FIG. 23. Schematic diagram of the shear vorticity [(��u�/�y)�,green area] in experiments (a) 3 and 6, and (b) 9.
1 APRIL 2005 D R B O H L A V A N D W A N G 971
Acknowledgments. This study has been supported bythe Climate Dynamics Program of the National ScienceFoundation (ATMoo-73023). The authors thank Dr.Tim Li for his insightful comments and valuable sug-gestions during the course of the research.
REFERENCES
Anderson, J. R., and D. E. Stevens, 1987: The presence of linearwavelike modes in a zonally symmetric model of the tropicalatmosphere. J. Atmos. Sci., 44, 2115–2127.
Chen, T.-C., and T. Murakami, 1988: The 30–50-day variation ofconvective activity over the western Pacific Ocean with em-phasis on the northwestern region. Mon. Wea. Rev., 116, 892–906.
Drbohlav, H.-K., 2002: The mechanism of intraseasonal oscilla-tion in the south Asian monsoon region. Ph.D. dissertation,University of Hawaii at Manoa, 240 pp.
Gadgil, S., and J. Srinivasan, 1990: Low frequency variation oftropical convergence zones. Meteor. Atmos. Phys., 44, 119–132.
Gautier, C., and B. DiJulio, 1990: Cloud effects on air-sea inter-actions during the 1979 Indian summer monsoon as studiesfrom satellite observation. Meteor. Atmos. Phys., 44, 251–263.
Goswami, B. N., and J. Shukla, 1984: Quasi-periodic oscillationsin a symmetrical general circulation model. J. Atmos. Sci., 41,20–37.
Hartmann, D. L., and M. L. Michelsen, 1989: Intraseasonal peri-odicities in Indian rainfall. J. Atmos. Sci., 46, 2838–2862.
Hu, Q., and D. A. Randall, 1994: Low-frequency oscillations inradiative-convective systems. J. Atmos. Sci., 51, 1089–1099.
——, and ——, 1995: Low-frequency oscillations in radiative-convective systems. Part II: An idealized model. J. Atmos.Sci., 52, 478–490.
Julian, P. R., and R. A. Madden, 1981: Comments on a paper byT. Yasunari, A quasi stationary appearance of 30 to 40 dayperiod in the cloudiness fluctuation during the summer mon-soon over India. J. Meteor. Soc. Japan, 59, 435–437.
Kalnay, E., and Coauthors, 1996: The NCEP/NCAR 40-Year Re-analysis Project. Bull. Amer. Meteor. Soc., 77, 437–471.
Kemball-Cook, S., and B. Wang, 2001: Equatorial waves and air–
sea interaction in the boreal summer intraseasonal oscilla-tion. J. Climate, 14, 2923–2942.
Knutson, T. R., K. M. Weickmann, and J. E. Kutzbach, 1986:Global-scale intraseasonal oscillation of outgoing longwaveradiation and 250 mb zonal wind during Northern Hemi-sphere summer. Mon. Wea. Rev., 114, 605–623.
Krishnamurti, T. N., and D. Subrahmanyam, 1982: The 30-50 daymode at 850 mb during MONEX. J. Atmos. Sci., 39, 2088–2095.
——, D. K. Jayakumar, J. Sheng, N. Surgi, and A. Kumar, 1985:Divergent circulation on the 30 to 50 day time scale. J. Atmos.Sci., 42, 364–375.
Lawrence, D. M., and P. J. Webster, 2002: The boreal summerintraseasonal oscillation: Relationship between northwardand eastward movement of convection. J. Atmos. Sci., 59,1593–1606.
Madden, R., and P. R. Julian, 1971: Detection of a 40-50 dayoscillation in the zonal wind in the tropical Pacific. J. Atmos.Sci., 28, 702–708.
Ouergli, A., and P. De Felice, 1996: North-eastward propagating25-50 day mode and its link with Indian summer monsoonactivity. Meteor. Atmos. Phys., 61, 127–135.
Sikka, D. R., and S. Gadgil, 1980: On the maximum cloud zoneand the ITCZ over Indian longitudes during the southwestmonsoon. Mon. Wea. Rev., 108, 1840–1853.
Wang, B., 1988: Dynamics of tropical low-frequency waves: Ananalysis of the moist Kelvin wave. J. Atmos. Sci., 45, 2051–2065.
——, and H. Rui, 1990: Synoptic climatology of transient tropicalintraseasonal convection anomalies: 1975–1985. Meteor. At-mos. Phys., 44, 43–61.
——, and X. Xie, 1997: A model for boreal summer intraseasonaloscillation. J. Atmos. Sci., 54, 72–86.
Webster, P. J., 1983: Mechanisms of monsoon low-frequency vari-ability: Surface hydrological effects. J. Atmos. Sci., 40, 2110–2124.
Yasunari, T., 1979: Cloudiness fluctuations associated with North-ern Hemisphere summer monsoon. J. Meteor. Soc. Japan, 57,227–242.
——, 1980: A quasi-stationary appearance of 30-40 day period inthe cloudiness fluctuations during the summer monsoon overIndia. J. Meteor. Soc. Japan, 58, 225–229.
——, 1981: Structure of an Indian summer monsoon system witha period around 40 days. J. Meteor. Soc. Japan, 59, 336–354.
972 J O U R N A L O F C L I M A T E VOLUME 18