Embed Size (px)
Citation preview
Mechanisms and Distribution of Ion Channels in Retinal Ganglion Cells:Using Temperature as an Independent Variable
Jurgen F. Fohlmeister,1 Ethan D. Cohen,3 and Eric A. Newman2
1Department of Integrative Biology and Physiology and 2Department of Neuroscience, University of Minnesota, Minneapolis, Minnesota;and 3Office of Science and Engineering Laboratories, Center for Devices and Radiologic Health, U.S. Food and Drug Administration,Silver Spring, Maryland
Submitted 9 February 2009; accepted in final form 1 January 2010
Fohlmeister JF, Cohen ED, Newman EA. Mechanisms and distri-bution of ion channels in retinal ganglion cells: using temperature asan independent variable. J Neurophysiol 103: 1357–1374, 2010. Firstpublished January 6, 2010; doi:10.1152/jn.00123.2009. Trains of ac-tion potentials of rat and cat retinal ganglion cells (RGCs) were recordedintracellularly across a temperature range of 7–37°C. Phase plots of theexperimental impulse trains were precision fit using multicompartmentsimulations of anatomically reconstructed rat and cat RGCs. Actionpotential excitation was simulated with a “Five-channel model” [Na,K(delayed rectifier), Ca, K(A), and K(Ca-activated) channels] and thenonspace-clamped condition of the whole cell recording was exploited todetermine the channels’ distribution on the dendrites, soma, and proximalaxon. At each temperature, optimal phase-plot fits for RGCs occurredwith the same unique channel distribution. The “waveform” of theelectrotonic current was found to be temperature dependent, whichreflected the shape changes in the experimental action potentials andconfirmed the channel distributions. The distributions are cell-type spe-cific and adequate for soma and dendritic excitation with a safety margin.The highest Na-channel density was found on an axonal segment some50–130 �m distal to the soma, as determined from the temperature-dependent “initial segment–somadendritic (IS-SD) break.” The voltagedependence of the gating rate constants remains invariant between 7 and23°C and between 30 and 37°C, but undergoes a transition between 23and 30°C. Both gating-kinetic and ion-permeability Q10s remain virtu-ally constant between 23 and 37°C (kinetic Q10s � 1.9–1.95; perme-ability Q10s � 1.49–1.64). The Q10s systematically increase for T�23°C (kinetic Q10 � 8 at T � 8°C). The Na channels were consistently“sleepy” (non-Arrhenius) for T �8°C, with a loss of spiking for T �7°C.
I N T R O D U C T I O N
Whole cell recording of neurons faces a vexing technicalcontradiction: on the one hand, the complexity of the neuralgeometry makes it difficult to achieve the space-clamped condi-tion necessary for unequivocal data interpretation. Nonspace-clamped experimental records, on the other hand, implicitly har-bor full information that cannot be unequivocally extracted. Herewe add temperature, as an independent, easily manipulated vari-able, to eliminate some of the ambiguity in that informationextraction.
The modeling of the nonspace-clamped recordings is done inmulticompartment analyses of morphologically reconstructedneurons, whose dendritic processes and axon are divided intoshort segments (compartments). The added feature of nonspaceclamping is the electrotonic current, which is the current that
flows across the boundary between neighboring compartments(i.e., from one compartment directly into its neighbor). Theelectrotonic current carries information of the changing elec-trical status in the dendrites and axon to the recording site ofthe soma and is subject to change with temperature.
In the retina, previous studies have examined the relationshipbetween temperature and the kinetics of retinal function, such asphotoreception (Baylor et al. 1983; Donner et al. 1988), amacrinecell synaptic release (Veruki et al. 2003), the electroretinogram(Schellart et al. 1974), and the ganglion cell’s ability to respond tolight or contrast (e.g., Aho et al. 1993; Dhingra et al. 2003). Ourstudy evaluates action potentials across a large temperature range,to estimate the spatial distribution of ion channels in the retinalganglion cell, from the kinetic changes that occur. In the process,we evaluate elements of channel gating that continue to functionin concert and coherence to generate the action potentials acrossthat large temperature range.
Almost all retinal ganglion cells, including “phasic OFF-centercells” (e.g., Lankheet et al. 1989), respond with at least a shortperiod of tonic repetitive firing to constant depolarizing currentinjected into the soma. Our method of analysis (“phase plots”) ishighly discriminating of the precise waveform of action potentialsand exploits the impulse repetition to enhance the signal-to-noiseratio. The shape of the action potential changes with temperatureand it does so in conjunction with temperature-dependent changesin the “waveform” of the electrotonic current at the soma. It isthese changes in the waveform that allow us to exploit thenonspace-clamped recording condition to determine the necessaryspatial parameterization and to estimate the distribution of ionchannels throughout the encoder region of the neural morphology.
M E T H O D S
Experiments were performed on acutely isolated retinas of maleLong–Evans rats (175–300 g) and cats (Felis domesticus). Animalswere killed and retinas were prepared as described previously (Cohen1998; Newman 2003). Animals were treated in accordance with theguidelines of the Institutional Animal Care and Use Committees of theUniversity of Minnesota, Yale University, or the Department ofHealth and Human Services.
Rat retina
Rat retinas were held in place in a superfusion chamber with nylonthreads attached to a Pt ring and superfused at 2 to 3 ml/min withbicarbonate-buffered Ringer solution containing (in mM): NaCl, 111.0;KCl, 3.0; CaCl2, 2.0; MgSO4, 1.0; NaH2PO4, 0.5; dextrose, 15.0; andNaHCO3, 32; pH 7.44, equilibrated with 5% CO2-95% O2. Beforereaching the chamber, the superfusate was heated or cooled with a Peltier
Address for reprint requests and other correspondence: J. F. Fohlmeister,Department of Integrative Biology Physiology, 6-125 Jackson Hall, 321Church Street S.E., University of Minnesota, Minneapolis, MN 55455 (E-mail:[email protected]).
J Neurophysiol 103: 1357–1374, 2010.First published January 6, 2010; doi:10.1152/jn.00123.2009.
13570022-3077/10 $8.00 Copyright © 2010 The American Physiological Societywww.jn.org
on March 26, 2010
jn.physiology.orgD
ownloaded from

thermoelectric module. A microthermistor within the recording chambermonitored the temperature of the retinal preparation.
Current-clamp records were obtained from the rat ganglion cell somatanear the vitreal surface of isolated retinas using whole cell patch-clamprecording. Nerve impulse trains were obtained at closely spaced temper-atures throughout the range of 7.2 through 37.1°C, each in response to theminimum multiple of 20 pA that yielded maintained (tonic) repetitivefiring (Fig. 1). The standard protocol began near room temperature(�23°C), which was then stepwise lowered until spiking ceased, subse-quently stepwise increased to mammalian temperatures, then lowered toyield room-temperature controls at the beginning, middle, and end of theexperiment. Cell membrane potential was recorded with an Axon Instru-ments MultiClamp 700A amplifier (Molecular Devices, Union City, CA)and was digitized at 10, 20, or 40 kHz. Cells were stimulated withdepolarizing current pulses passed through the recording pipette. Thepatch pipette/intracellular solution contained (in mM), Na-methanesulfo-nate, 5.0; K-methanesulfonate, 128.0; MgCl2, 2.0; K-EGTA, 5.0; gluta-thione, 1.0; MgATP, 2.0; NaGTP, 0.2; Fluo-4 pentapotassium salt, 0.1;and HEPES, 5.0 (pH 7.4).
Cat retina
Cat retinal tissue was held in a microscopic chamber and superfusedwith a gravity-fed Ringer solution (5 ml/min) that was warmed by anin-line heater just before entering the retinal chamber. The temperature
was monitored by a thermocouple at the entrance to the chamber.Physiological temperature recordings from the isolated retina used abicarbonate-buffered Ringer solution containing the following salts (inmM): NaCl, 120; KCl, 3.1; KH2PO4, 0.5; NaHCO3, 23.0; Mg2SO4, 1.2;CaCl2, 1.15; 0.5% equine serum; 26 vitamins and amino acids, equili-brated with 5% CO2-95% O2 (Ames and Nesbett 1981).
The action potentials of X (Beta) and Y (Alpha) cat ganglion cells wererecorded from the soma in current clamp using the whole cell recordingtechnique. Membrane potential was recorded with a DAGAN 3900Apatch-clamp amplifier (Dagan, Minneapolis, MN) and digitized at 18.5kHz using a VR10B data recorder (Instrutech, Mineola, NY); the datawere corrected for series resistance and junction potentials. Cells werestimulated with depolarizing current pulses in 50- or 100-pA steps passedthrough the recording pipette. The patch-pipette intracellular solutioncontained (in mM) K-methanesulfonate, 120; KCl, 4; MgCl2, 2; HEPES,5; CaCl2, 0.5, EGTA, 5; glutathione, 1.0, NaATP, 1.0, NaGTP, 0.5, andlucifer yellow 0.05% methoxycarbonyl salt (pH 7.2), and neurobiotin/biocytin (0.5%; Molecular Probes, Eugene, OR) for cell identification(for details, see Cohen 1998, 2000).
Morphological reconstruction of RGCs
Retinal ganglion cells (RGCs) were labeled in isolated retinas witheither neurobiotin or DiIC18(3) (for details, see Cohen 1998; Man-grum et al. 2002). The retinas were fixed in 4% paraformaldehyde and
FIG. 1. Impulse trains from a rat retinal ganglion cell (RGC)taken at 5 different temperatures show distinct differences intheir action potential (AP) kinetics. Insets at right show thedurations and waveforms of a single AP from each impulsetrain. The highest amplitude impulses and lowest thresholdcurrents occur in the temperature range 13–16°C. Spiking issomewhat noisy at mammalian temperatures (37.1°C), withsomewhat lower impulse amplitudes. The most regular spiking,with systematic adaptation, occurs for T �13°C (except for T�8°C, where the Na channels become “sleepy”; see the fol-lowing text and Fohlmeister 2009). Step stimulus currents werethe minimum multiples of 20 pA to yield repetitive firing ateach temperature (320, 120, 40, 40, and 20 pA, at 37.1, 23.5,13.9, 9.8, and 7.2°C, respectively).
1358 J. F. FOHLMEISTER, E. D. COHEN, AND E. A. NEWMAN
J Neurophysiol • VOL 103 • MARCH 2010 • www.jn.org
on March 26, 2010
jn.physiology.orgD
ownloaded from
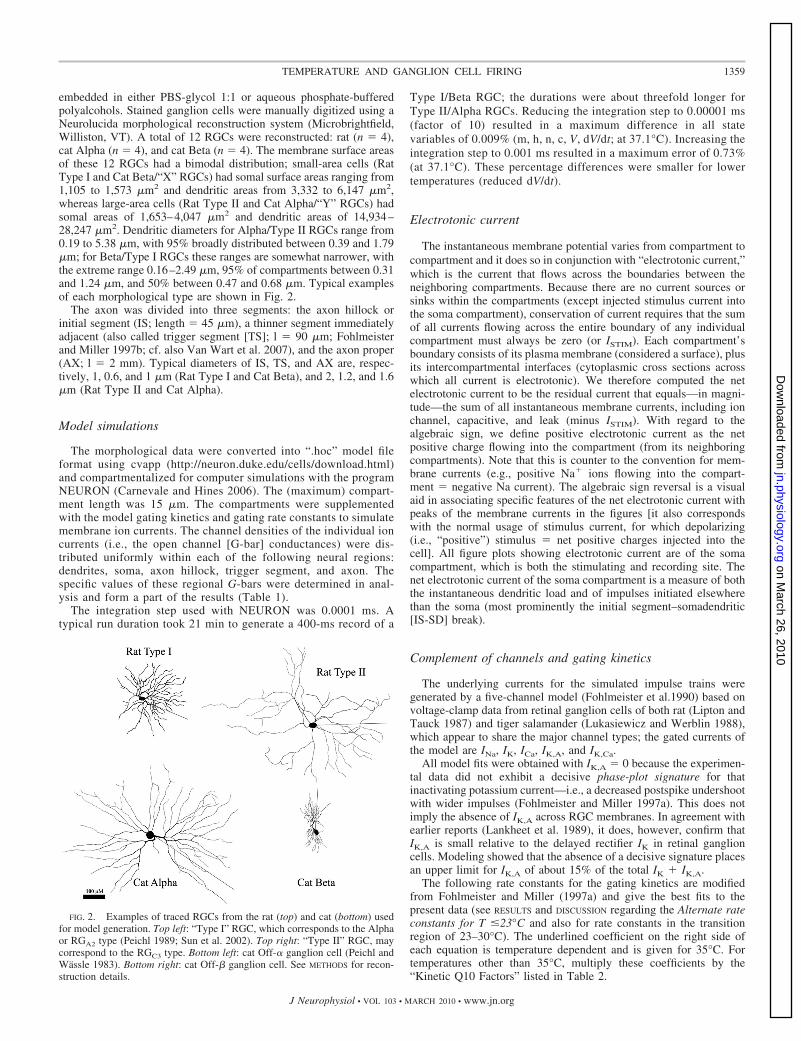
embedded in either PBS-glycol 1:1 or aqueous phosphate-bufferedpolyalcohols. Stained ganglion cells were manually digitized using aNeurolucida morphological reconstruction system (Microbrightfield,Williston, VT). A total of 12 RGCs were reconstructed: rat (n � 4),cat Alpha (n � 4), and cat Beta (n � 4). The membrane surface areasof these 12 RGCs had a bimodal distribution; small-area cells (RatType I and Cat Beta/“X” RGCs) had somal surface areas ranging from1,105 to 1,573 �m2 and dendritic areas from 3,332 to 6,147 �m2,whereas large-area cells (Rat Type II and Cat Alpha/“Y” RGCs) hadsomal areas of 1,653–4,047 �m2 and dendritic areas of 14,934–28,247 �m2. Dendritic diameters for Alpha/Type II RGCs range from0.19 to 5.38 �m, with 95% broadly distributed between 0.39 and 1.79�m; for Beta/Type I RGCs these ranges are somewhat narrower, withthe extreme range 0.16–2.49 �m, 95% of compartments between 0.31and 1.24 �m, and 50% between 0.47 and 0.68 �m. Typical examplesof each morphological type are shown in Fig. 2.
The axon was divided into three segments: the axon hillock orinitial segment (IS; length � 45 �m), a thinner segment immediatelyadjacent (also called trigger segment [TS]; l � 90 �m; Fohlmeisterand Miller 1997b; cf. also Van Wart et al. 2007), and the axon proper(AX; l � 2 mm). Typical diameters of IS, TS, and AX are, respec-tively, 1, 0.6, and 1 �m (Rat Type I and Cat Beta), and 2, 1.2, and 1.6�m (Rat Type II and Cat Alpha).
Model simulations
The morphological data were converted into “.hoc” model fileformat using cvapp (http://neuron.duke.edu/cells/download.html)and compartmentalized for computer simulations with the programNEURON (Carnevale and Hines 2006). The (maximum) compart-ment length was 15 �m. The compartments were supplementedwith the model gating kinetics and gating rate constants to simulatemembrane ion currents. The channel densities of the individual ioncurrents (i.e., the open channel [G-bar] conductances) were dis-tributed uniformly within each of the following neural regions:dendrites, soma, axon hillock, trigger segment, and axon. Thespecific values of these regional G-bars were determined in anal-ysis and form a part of the results (Table 1).
The integration step used with NEURON was 0.0001 ms. Atypical run duration took 21 min to generate a 400-ms record of a
Type I/Beta RGC; the durations were about threefold longer forType II/Alpha RGCs. Reducing the integration step to 0.00001 ms(factor of 10) resulted in a maximum difference in all statevariables of 0.009% (m, h, n, c, V, dV/dt; at 37.1°C). Increasing theintegration step to 0.001 ms resulted in a maximum error of 0.73%(at 37.1°C). These percentage differences were smaller for lowertemperatures (reduced dV/dt).
Electrotonic current
The instantaneous membrane potential varies from compartment tocompartment and it does so in conjunction with “electrotonic current,”which is the current that flows across the boundaries between theneighboring compartments. Because there are no current sources orsinks within the compartments (except injected stimulus current intothe soma compartment), conservation of current requires that the sumof all currents flowing across the entire boundary of any individualcompartment must always be zero (or ISTIM). Each compartment’sboundary consists of its plasma membrane (considered a surface), plusits intercompartmental interfaces (cytoplasmic cross sections acrosswhich all current is electrotonic). We therefore computed the netelectrotonic current to be the residual current that equals—in magni-tude—the sum of all instantaneous membrane currents, including ionchannel, capacitive, and leak (minus ISTIM). With regard to thealgebraic sign, we define positive electrotonic current as the netpositive charge flowing into the compartment (from its neighboringcompartments). Note that this is counter to the convention for mem-brane currents (e.g., positive Na� ions flowing into the compart-ment � negative Na current). The algebraic sign reversal is a visualaid in associating specific features of the net electrotonic current withpeaks of the membrane currents in the figures [it also correspondswith the normal usage of stimulus current, for which depolarizing(i.e., “positive”) stimulus � net positive charges injected into thecell]. All figure plots showing electrotonic current are of the somacompartment, which is both the stimulating and recording site. Thenet electrotonic current of the soma compartment is a measure of boththe instantaneous dendritic load and of impulses initiated elsewherethan the soma (most prominently the initial segment–somadendritic[IS-SD] break).
Complement of channels and gating kinetics
The underlying currents for the simulated impulse trains weregenerated by a five-channel model (Fohlmeister et al.1990) based onvoltage-clamp data from retinal ganglion cells of both rat (Lipton andTauck 1987) and tiger salamander (Lukasiewicz and Werblin 1988),which appear to share the major channel types; the gated currents ofthe model are INa, IK, ICa, IK,A, and IK,Ca.
All model fits were obtained with IK,A � 0 because the experimen-tal data did not exhibit a decisive phase-plot signature for thatinactivating potassium current—i.e., a decreased postspike undershootwith wider impulses (Fohlmeister and Miller 1997a). This does notimply the absence of IK,A across RGC membranes. In agreement withearlier reports (Lankheet et al. 1989), it does, however, confirm thatIK,A is small relative to the delayed rectifier IK in retinal ganglioncells. Modeling showed that the absence of a decisive signature placesan upper limit for IK,A of about 15% of the total IK � IK,A.
The following rate constants for the gating kinetics are modifiedfrom Fohlmeister and Miller (1997a) and give the best fits to thepresent data (see RESULTS and DISCUSSION regarding the Alternate rateconstants for T �23°C and also for rate constants in the transitionregion of 23–30°C). The underlined coefficient on the right side ofeach equation is temperature dependent and is given for 35°C. Fortemperatures other than 35°C, multiply these coefficients by the“Kinetic Q10 Factors” listed in Table 2.
FIG. 2. Examples of traced RGCs from the rat (top) and cat (bottom) usedfor model generation. Top left: “Type I” RGC, which corresponds to the Alphaor RGA2 type (Peichl 1989; Sun et al. 2002). Top right: “Type II” RGC, maycorrespond to the RGC3 type. Bottom left: cat Off-� ganglion cell (Peichl andWassle 1983). Bottom right: cat Off-� ganglion cell. See METHODS for recon-struction details.
1359TEMPERATURE AND GANGLION CELL FIRING
J Neurophysiol • VOL 103 • MARCH 2010 • www.jn.org
on March 26, 2010
jn.physiology.orgD
ownloaded from
1) Standard gating rate constants for T �30°CNa activation
�m�V� � �2.725�V � 35�/�exp[0.1(V � 35�] �1}
�m�V� � 90.83 exp[(V � 60)/20]
Na inactivation
�h�V� � 1.817 exp[(V � 52)/20]
�h�V� � 27.25/�1 � exp[0.1(V � 22�]}
K activation (delayed rectifier)
�n�V� � �0.09575�V � 37�/�exp[0.1(V � 37�] � 1}
�n�V� � 1.915 exp[(V � 47)/80]
Ca activation
�c�V� � �1.362�V � 13�/�exp[0.1(V � 13�] � 1}
�c�V� � 45.41 exp[(V � 38)/18]
2) Alternate rate constants for T �23°CNa activation
�m�V� � �2.804�V � 35�/�exp[0.1(V � 35�] � 1}
�m�V� � 93.46 exp[(V � 60)/18]
Na inactivation
�h�V� � 1.869 exp[(V � 55)/20]
�h�V� � 28.04/�1 � exp[0.1(V � 25�]}
K activation
�n�V� � �0.0984�V � 32.5�/�exp[0.1(V � 32.5�] � 1}
�n�V� � 1.969 exp[(V � 58.5)/76]
Ca activation
�c�V� � �1.4�V � 15�/�exp[0.1(V � 15�] � 1}
�c�V� � 46.68 exp[(V � 40)/18]
The kinetic structure is that of Hodgkin and Huxley (1952). Anoninactivating (H-type) Ca current is added with parameterizationsimilar to that of Na activation and with variable equilibrium (Nernst)potential dependent on intracellular calcium ion concentration([Ca2�]i). The Ca-activated K current IK,Ca is gated as follows
g(K,Ca) � G-bar(K,Ca)�Ca2��i/Cadiss�
2
1 � �Ca2��i/Cadiss�2
where Cadiss � 106 molar (dissociation constant) and, in the absence ofCa influx, [Ca2�]i � 107 molar (residual internal Ca concentration).
A leakage current (ILeak) was adjusted to match the input resistanceand time constant of RGCs. The five-channel model was originallyconstructed to yield the measured input resistance of about 1 G�(tiger salamander RGCs; cf. Fohlmeister and Miller 1997a,b). Mam-malian RGCs, in contrast, commonly show lower input resistance(35–150 M� for cat Alpha and Beta RGCs, respectively; Cohen 2001;O’Brien et al. 2002); the low value for Alpha RGCs is possibly due todendritic gap junctions (cf. Cook and Becker 1995; Hu and Bloom-field 2003; Xin and Bloomfield 1997; cf. also Ceelen et al. 2001). Amembrane conductance (leak) value of 10,000 �/cm2 was found to fitmost cells, and had a Q10 factor of 1.85. However, as with the
Ca-activated K current, the effect of leakage on the impulse waveformis negligible, even with the lowest input resistance (35 M�).
Cytoplasmic resistivity
The temperature dependence of cytoplasmic resistivity (Ri) wasbased on the analysis of Robinson and Stokes (1954) and the resultsof Trevelyan and Jack (2002). Specific intermediate values of Ri(listed in Table 2) were determined by logarithmic interpolation withQ10 � 0.8 applied to Ri � 140 � �cm at 36°C.
Temperature control in modeling
The following four elements were subjected to temperature controland analysis:
1) Gating-kinetic rate constants2) G-bar (open channel) conductance, magnitudes, and distribution3) Ion equilibrium (Nernst) potentials (given in Table 2)4) Cytoplasmic resistivity (given in Table 2).
Data analysis
Phase plots from digitized data. A phase plot of a tonic nerveimpulse train is the closed (cyclical) curve generated by plotting thetemporally advancing time rate of change, dV/dt, against the simul-taneously advancing membrane potential V as shown in Fig. 3B (thedV/dt variable is replaced by capacitive and ionic currents in this plotand some other plots). Only the shape of the phase plot is ofsignificance; the variable of time is typically not marked along the curve.The curve, for most of its length, expresses features of the actionpotential; the remaining short curve segment represents the interspikeinterval (ISI) (see Figs. 3B and 4A for more details). Phase plots of theexperimental action potential data were used as templates to be fit byphase plots of model-simulated impulse trains.
Digitized impulse train data provide sample points at equal timeincrements. Because dV/dt varies, these points are unequally spacedalong the phase-plot curve. However, cycling over multiple actionpotentials fills in the gaps between the plotted points (it also providedsignal averaging). This occurs because the digitization rate and im-pulse frequency are not synchronized.
It is critical that the two components (V, dV/dt) of the plotted pointsbe isochronic everywhere along the curve of the phase plot. However,because the computation of dV/dt involves (at least) two samplingtimes, time is ill-defined for dV/dt. This makes digitized results highlyprone to systematic phase-plot distortions, which increase with in-creasing sampling interval. This problem is largely eliminated byapplying a first-order “correction” to the raw data. The correctionassumes that the time of dV/dt is midway between the two consecutivesample times (used in its calculation) and shifts the plotted value of Vto that temporal midpoint by linear interpolation, thus
Abscissa
Vi� � �f i� � f i � 1��/2
Ordinate
dV/dti� � �f i � 1� � f i��/ �
where f [i] is the ith sample of membrane potential (raw data correctedfor junction potential) and � is the sampling interval. The phase plotconsists of the i sequence of (V[i], dV/dt [i]).
Removing the systematic time discrepancy of �/2 associated withdirect use of V[i] � f [i] eliminates a gross distortion in the phase plotduring the rising phase of the action potential (i.e., when dV/dt islarge) and increases the acceptable maximum sampling interval by afactor of about 10. Both experimental and model impulse train datawere digitized with the same � � 0.1 ms (for T �25°C) and � �
1360 J. F. FOHLMEISTER, E. D. COHEN, AND E. A. NEWMAN
J Neurophysiol • VOL 103 • MARCH 2010 • www.jn.org
on March 26, 2010
jn.physiology.orgD
ownloaded from
25 �s (T �25°C). Although this procedure yields accurate channel-density distributions, these noninfinitesimal digitization intervals �continue to somewhat underestimate the peak excursions of dV/dt inphase plots.
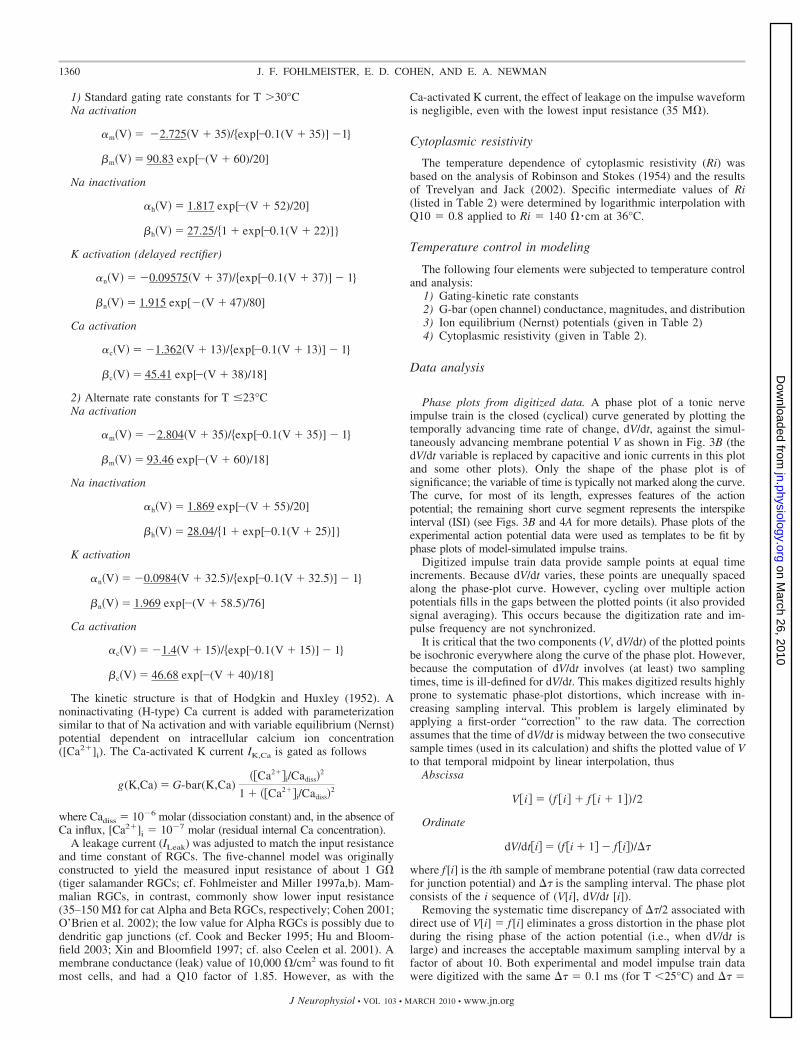
Membrane currents and their phase plots. In contrast to the exper-imental data, which consist exclusively of membrane potential V as afunction of time, the model data add the underlying membranecurrents. Relationships of these currents (INa, IK, ICa, ICapacitive) to thevoltage during one action potential are shown in Fig. 3 for a space-clamped spherical soma (single-compartment model). Figure 3Ashows the currents plotted linearly against time at 37.1°C. Note that,in contrast to the Hodgkin–Huxley model of the squid giant axon, the
optimal Na and K currents are sequentially active— i.e., nonoverlap-ping in time (Fohlmeister 2009).
Figure 3B shows the same membrane currents plotted cyclically inthe form of phase plots. Here, dV/dt is replaced by each of the ionicmembrane currents, so that these phase plots consist of instantaneouspairs [V(t) (abscissa), I(t) (ordinate)]. The arrows indicate the direc-tion of advancing time through the action potential waveform(s).Because the model is a single compartment, the absence of electro-tonic current renders Kirchoff’s law a zero-sum statement of themembrane currents: ICap � ¥i Ii � ISTIM. Thus the instantaneous sumof the three major ionic currents (INa, IK, ICa), plus capacitive current[IC � Cm(dV/dt)], nearly equals zero throughout the action potential(contributions from IK(Ca) and stimulus currents are negligible). Morespecifically, the Na and capacitive currents are nearly identicalthroughout the rising phase of the impulse because the K and Cacurrents are near zero during that phase (Fig. 3B). Near the peak andduring the falling phase of the action potential (negative capacitivecurrent), the difference between K and capacitive currents is balancedby Ca current, the Na channel being inactivated.
Equivalence of dV/dt and capacitive current. Phase plots of [V, IC
(capacitive current)] and of [V, dV/dt] are, point for point (i.e., inprinciple), numerically identical in both the space-clamped (Fig. 3B)and nonspace-clamped cases (Fig. 5, C and D). This is true because allmembrane currents (capacitive and ionic) are local at the soma, whichis also the recording site of the membrane potential V and therefore ofdV/dt. This equivalence allows one to detect and quantify the effectsof the nonspace-clamping (“electrotonic effects”) by comparing therecorded voltage waveform of the action potential with the underlyinglocal ionic currents, as determined in model fitting. To convertcapacitive current IC to dV/dt, simply replace the ordinate units[�Amp/cm2] with [mV/ms], the proportionality factor being CM � 1[�Farad/cm2] (i.e., unity).
Minimizing the residual error: uniqueness of the solutions. A“solution” is defined to be a set of regional GNa, GK, and GCa thatyields a model phase-plot congruency with the phase plot of experi-mental data at a given temperature; the ability to achieve congruencyproves the existence of a solution. The model fitting of phase plotswas done by hand, using the eye for signal averaging (e.g., Fig. 4A).The resulting solution was confirmed by computer minimization, in aprocess that also confirmed the uniqueness of the solution (seefollowing text). Minimized was the global deviation (i.e., equalweight at all points) of the model-generated phase plots along thecorresponding curves of experimental records. Varied were the re-gional GNa, GK, and GCa on the dendrites and soma (cf. Fig. 4, B andC) and on the initial segment (IS) and trigger segment (TS). At eachstep of the process the ion conductances were moved either singly, orin combinations, as required and suggested by the convergenceproperties observed in the earlier steps; the process was therefore oneof interpolation among the earlier approximate fits. Each cell was fitseparately at every temperature. Examples of phase-plot fits are givenin Figs. 4 (13.9°), 7 (33.5°, 36.1°), 8 (35°), and 10 (7.2°C).
Uniqueness of the hand-fitted results was confirmed by computerwith the minimization package SUBPLX—this package “uses thesubplex method [a generalization of the Nelder–Mead simplexmethod which requires no derivative approximations] to solve uncon-strained optimization problems. The method is well suited for opti-mizing objective functions that are noisy or discontinuous at thesolution” (computer code and quote by T. Rowan, Department ofComputer Sciences, Univ. of Texas, Austin). The minimization runfor each phase plot was repeated 2,500 times from different randominitial conditions (regional GNa, GK, and GCa). The initial conditionswere generated from the 30,000 pseudorandom numbers [uniformlydistributed on the interval (0, 1)], which are returned by the programRANDOM (Wichmann and Hill 1982). The 2,500 minimization runsfor each “solution” were submitted as one “batch job,” which typicallyrequired 10 days to complete.
FIG. 3. Demonstration of the method of analyzing the AP waveform usingphase-plot analysis, which allows estimation of the membrane currents under-lying the AP. A: model membrane currents associated with an AP at 37.1°C.B: phase plots of the ionic and capacitive currents [ordinate], plotted asfunctions of the membrane potential V [abscissa] throughout one impulsecycle. The ionic currents are �/ inverted (mirror-symmetrically flipped aboutthe abscissa) to facilitate comparison with the capacitive current, which isconventional. Arrows � direction of time; curve segments with right (left)pointing arrow-components occur during the rising (falling) phase of the AP.Vertical slices (constant V) across rising- or falling-phase segments occur atthe same time. Phase plots of the ionic currents do not cross the abscissa (i.e.,each ionic current flow remains in the same direction across the membranethroughout the AP).
1361TEMPERATURE AND GANGLION CELL FIRING
J Neurophysiol • VOL 103 • MARCH 2010 • www.jn.org
on March 26, 2010
jn.physiology.orgD
ownloaded from
The “curve” to be fitted was defined by the sequential points of thephase plot determined from the (digitized) data points of a singleexperimental action potential and this was repeated for several actionpotentials. The test phase plots were generated from model data withthe same digitization interval. The results were screened by increas-ingly limiting the acceptable residual norm, a process that stronglyconverged onto a unique solution for each cell. Specifically, thecomputer runs led to numerous local minima with large residualnorms and incongruent phase plots. All runs that terminated with asmall residual norm (and congruent phase plots; �2 to 4% of each“batch job”) also yielded channel densities near those listed in Table1. The gating-kinetic Q10s (Table 2) were also confirmed by adjustingthe underlined coefficients of the gating rate constants to minimizethose residual norms. The values listed in Tables 1 and 2, however,were determined from precision fits done by hand.
R E S U L T S
General analytical considerations
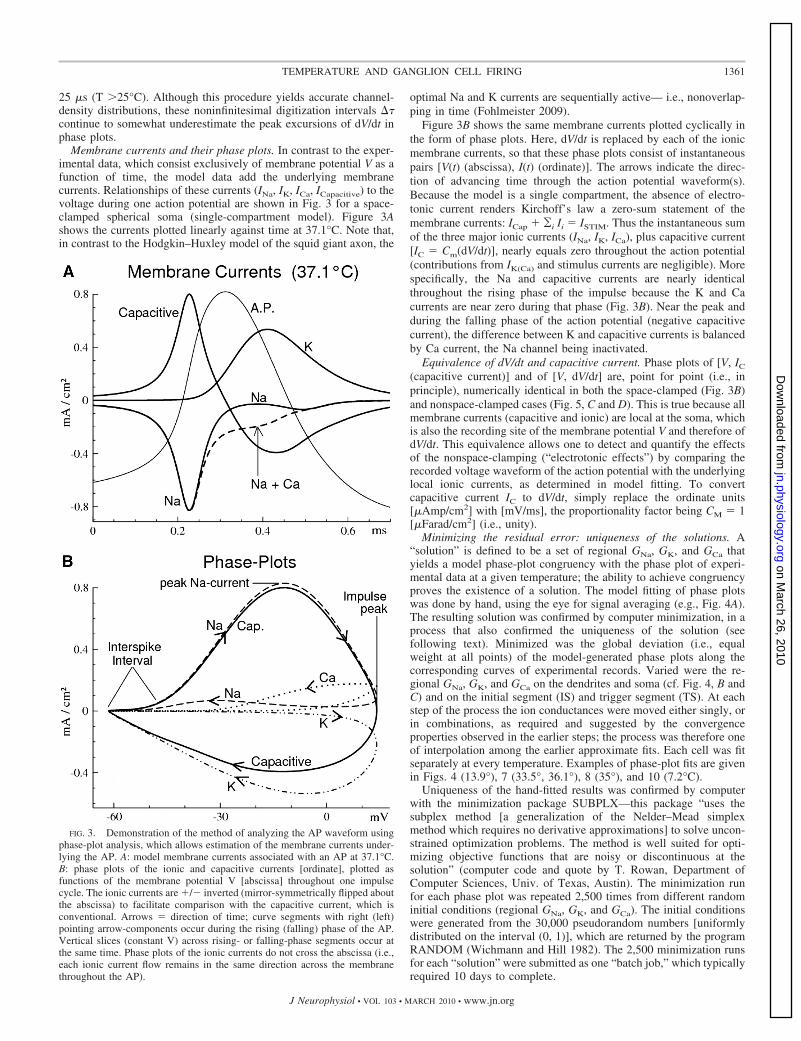
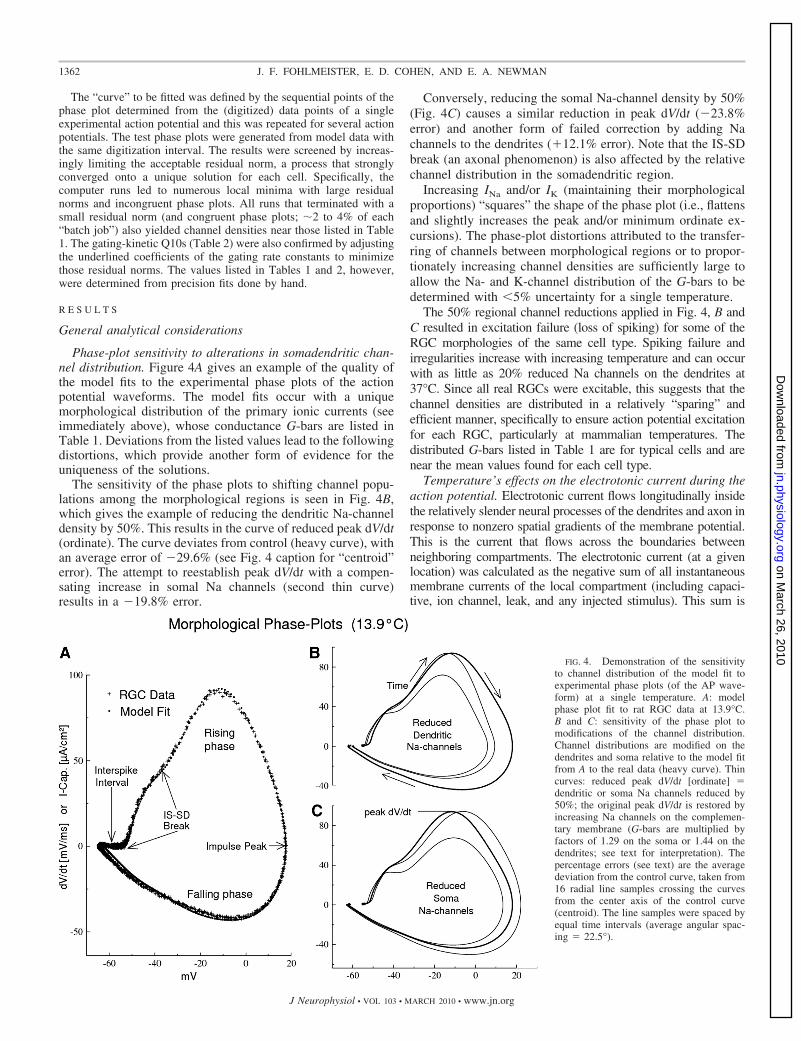
Phase-plot sensitivity to alterations in somadendritic chan-nel distribution. Figure 4A gives an example of the quality ofthe model fits to the experimental phase plots of the actionpotential waveforms. The model fits occur with a uniquemorphological distribution of the primary ionic currents (seeimmediately above), whose conductance G-bars are listed inTable 1. Deviations from the listed values lead to the followingdistortions, which provide another form of evidence for theuniqueness of the solutions.
The sensitivity of the phase plots to shifting channel popu-lations among the morphological regions is seen in Fig. 4B,which gives the example of reducing the dendritic Na-channeldensity by 50%. This results in the curve of reduced peak dV/dt(ordinate). The curve deviates from control (heavy curve), withan average error of 29.6% (see Fig. 4 caption for “centroid”error). The attempt to reestablish peak dV/dt with a compen-sating increase in somal Na channels (second thin curve)results in a 19.8% error.
Conversely, reducing the somal Na-channel density by 50%(Fig. 4C) causes a similar reduction in peak dV/dt (23.8%error) and another form of failed correction by adding Nachannels to the dendrites (�12.1% error). Note that the IS-SDbreak (an axonal phenomenon) is also affected by the relativechannel distribution in the somadendritic region.
Increasing INa and/or IK (maintaining their morphologicalproportions) “squares” the shape of the phase plot (i.e., flattensand slightly increases the peak and/or minimum ordinate ex-cursions). The phase-plot distortions attributed to the transfer-ring of channels between morphological regions or to propor-tionately increasing channel densities are sufficiently large toallow the Na- and K-channel distribution of the G-bars to bedetermined with �5% uncertainty for a single temperature.
The 50% regional channel reductions applied in Fig. 4, B andC resulted in excitation failure (loss of spiking) for some of theRGC morphologies of the same cell type. Spiking failure andirregularities increase with increasing temperature and can occurwith as little as 20% reduced Na channels on the dendrites at37°C. Since all real RGCs were excitable, this suggests that thechannel densities are distributed in a relatively “sparing” andefficient manner, specifically to ensure action potential excitationfor each RGC, particularly at mammalian temperatures. Thedistributed G-bars listed in Table 1 are for typical cells and arenear the mean values found for each cell type.
Temperature’s effects on the electrotonic current during theaction potential. Electrotonic current flows longitudinally insidethe relatively slender neural processes of the dendrites and axon inresponse to nonzero spatial gradients of the membrane potential.This is the current that flows across the boundaries betweenneighboring compartments. The electrotonic current (at a givenlocation) was calculated as the negative sum of all instantaneousmembrane currents of the local compartment (including capaci-tive, ion channel, leak, and any injected stimulus). This sum is
FIG. 4. Demonstration of the sensitivityto channel distribution of the model fit toexperimental phase plots (of the AP wave-form) at a single temperature. A: modelphase plot fit to rat RGC data at 13.9°C.B and C: sensitivity of the phase plot tomodifications of the channel distribution.Channel distributions are modified on thedendrites and soma relative to the model fitfrom A to the real data (heavy curve). Thincurves: reduced peak dV/dt [ordinate] �dendritic or soma Na channels reduced by50%; the original peak dV/dt is restored byincreasing Na channels on the complemen-tary membrane (G-bars are multiplied byfactors of 1.29 on the soma or 1.44 on thedendrites; see text for interpretation). Thepercentage errors (see text) are the averagedeviation from the control curve, taken from16 radial line samples crossing the curvesfrom the center axis of the control curve(centroid). The line samples were spaced byequal time intervals (average angular spac-ing � 22.5°).
1362 J. F. FOHLMEISTER, E. D. COHEN, AND E. A. NEWMAN
J Neurophysiol • VOL 103 • MARCH 2010 • www.jn.org
on March 26, 2010
jn.physiology.orgD
ownloaded from
balanced by the electrotonic current from the requirement ofcurrent conservation (see METHODS).
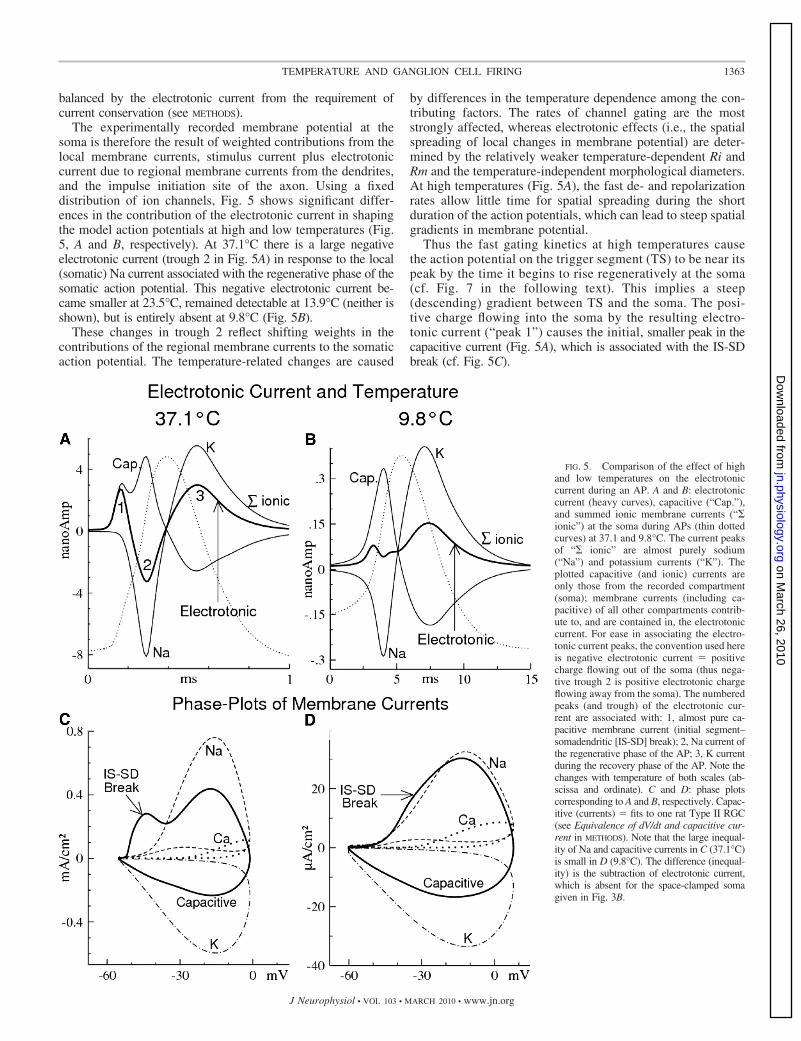
The experimentally recorded membrane potential at thesoma is therefore the result of weighted contributions from thelocal membrane currents, stimulus current plus electrotoniccurrent due to regional membrane currents from the dendrites,and the impulse initiation site of the axon. Using a fixeddistribution of ion channels, Fig. 5 shows significant differ-ences in the contribution of the electrotonic current in shapingthe model action potentials at high and low temperatures (Fig.5, A and B, respectively). At 37.1°C there is a large negativeelectrotonic current (trough 2 in Fig. 5A) in response to the local(somatic) Na current associated with the regenerative phase of thesomatic action potential. This negative electrotonic current be-came smaller at 23.5°C, remained detectable at 13.9°C (neither isshown), but is entirely absent at 9.8°C (Fig. 5B).
These changes in trough 2 reflect shifting weights in thecontributions of the regional membrane currents to the somaticaction potential. The temperature-related changes are caused
by differences in the temperature dependence among the con-tributing factors. The rates of channel gating are the moststrongly affected, whereas electrotonic effects (i.e., the spatialspreading of local changes in membrane potential) are deter-mined by the relatively weaker temperature-dependent Ri andRm and the temperature-independent morphological diameters.At high temperatures (Fig. 5A), the fast de- and repolarizationrates allow little time for spatial spreading during the shortduration of the action potentials, which can lead to steep spatialgradients in membrane potential.
Thus the fast gating kinetics at high temperatures causethe action potential on the trigger segment (TS) to be near itspeak by the time it begins to rise regeneratively at the soma(cf. Fig. 7 in the following text). This implies a steep(descending) gradient between TS and the soma. The posi-tive charge flowing into the soma by the resulting electro-tonic current (“peak 1”) causes the initial, smaller peak in thecapacitive current (Fig. 5A), which is associated with the IS-SDbreak (cf. Fig. 5C).
FIG. 5. Comparison of the effect of highand low temperatures on the electrotoniccurrent during an AP. A and B: electrotoniccurrent (heavy curves), capacitive (“Cap.”),and summed ionic membrane currents (“�ionic”) at the soma during APs (thin dottedcurves) at 37.1 and 9.8°C. The current peaksof “� ionic” are almost purely sodium(“Na”) and potassium currents (“K”). Theplotted capacitive (and ionic) currents areonly those from the recorded compartment(soma); membrane currents (including ca-pacitive) of all other compartments contrib-ute to, and are contained in, the electrotoniccurrent. For ease in associating the electro-tonic current peaks, the convention used hereis negative electrotonic current � positivecharge flowing out of the soma (thus nega-tive trough 2 is positive electrotonic chargeflowing away from the soma). The numberedpeaks (and trough) of the electrotonic cur-rent are associated with: 1, almost pure ca-pacitive membrane current (initial segment–somadendritic [IS-SD] break); 2, Na current ofthe regenerative phase of the AP; 3, K currentduring the recovery phase of the AP. Note thechanges with temperature of both scales (ab-scissa and ordinate). C and D: phase plotscorresponding to A and B, respectively. Capac-itive (currents) � fits to one rat Type II RGC(see Equivalence of dV/dt and capacitive cur-rent in METHODS). Note that the large inequal-ity of Na and capacitive currents in C (37.1°C)is small in D (9.8°C). The difference (inequal-ity) is the subtraction of electrotonic current,which is absent for the space-clamped somagiven in Fig. 3B.
1363TEMPERATURE AND GANGLION CELL FIRING
J Neurophysiol • VOL 103 • MARCH 2010 • www.jn.org
on March 26, 2010
jn.physiology.orgD
ownloaded from
Trough 2 of the electrotonic current occurs at the subsequenttime of maximum rate of depolarization at the soma. It occurs,in part, in response to the large spatial gradient (descending)from the depolarizing soma into the dendrites (which are stillsubthreshold) and, in part, to the similar gradient in the axonaldirection, where the fast gating kinetics have (nearly) repolar-ized TS. The peak rate of depolarization at the soma (peakcapacitive current) is associated with maximum regenerativeNa influx (Fig. 5A). Note that the electrotonic current at trough2 draws off about half of the positive charge introduced into thesoma by the regenerative Na current (Fig. 5C).
At lower temperatures, the relatively slower depolarizationrate allows more time for spatial equilibration. This expandsthe spatial reach (extent) of concurrent regenerative activity(Na current) that, at 9.8°C, comes to encompass TS, the soma,and well into the dendritic tree. Further, the various phases ofthe action potentials are instantaneously more nearly the sameacross these three regions (i.e., the action potentials overlap),which reduces the spatial gradients. Thus at 9.8°C, peak 1 ofthe electrotonic current is substantially reduced relative to themembrane currents and trough 2 is entirely eliminated (Fig.5B), even though at the time there is significant regenerativeNa influx.
Figure 5, C and D shows the corresponding changes in thephase plot between the two temperatures (37.1 and 9.8°C).The phase plots are of the type [V, Ix], as in Fig. 3B, exceptnonspace-clamped. In Fig. 5C (37.1°C), there are two peaks ofcapacitive current during the rising phase of the action poten-tial, due to the IS-SD break and the regenerative somatic actionpotential. Note that the phase plot for the Na current does notshow a corresponding peak associated with the IS-SD break inthe phase plot for capacitive current. Thus the IS-SD break (theinitial abrupt rate of rise in membrane potential that triggers thelocal soma action potential) is not associated with a local Nacurrent. Because only the sodium and electrotonic currents arepotentially capable of generating a rapid membrane depolar-ization, this absence of a corresponding Na-current peak in thephase plot confirms that the IS-SD break is a purely electro-tonic effect at the soma, due to a Na-current–induced depolar-ization elsewhere (i.e., on the axonal impulse trigger zone). InFig. 5A, the IS-SD break is the leftmost of the pair of peaks incapacitive current (associated with peak 1 of the electrotoniccurrent).
Except for the IS-SD break (absent in the single-compartmentsimulation of Fig. 3), the capacitive current in multicompartmentsimulation is significantly reduced relative to that of the singlecompartment (about halved at 37.1°C, both � ordinate excursionsrelative to zero; compare Figs. 5C and 3B), and this is due to theelectrotonic load (trough 2 in Fig. 5A). The peak Na current is alsosomewhat lower than that in single-compartment simulations(related to the same cause); the peak K currents, however, arenearly the same.
In contrast to 37.1°C, the membrane currents INa, IK, and ICare significantly smaller at 9.8°C and INa matches IC moreclosely during the rising phase of the action potential (compareFig. 5, C and D). Note also that ICa is larger relative to INa andIK, which is due to the greater impulse amplitude at 9.8°C.Further, IC is much greater at 37.1°C because of the muchfaster kinetics, the much shorter action potential width, andthus much higher dV/dt (see van Rossum et al. 2003). Never-theless, despite these large electrotonic and temperature differ-
ences, the optimally fitted Na-, K-, and Ca-channel distribu-tions (G-bars) are nearly identical for 9.8 and 37.1°C. Thisconfirms the uniqueness of the model-determined channeldistribution for a given RGC and these are the G-bar conduc-tances listed in Table 1.
Morphological distribution of membrane currents byRGC type
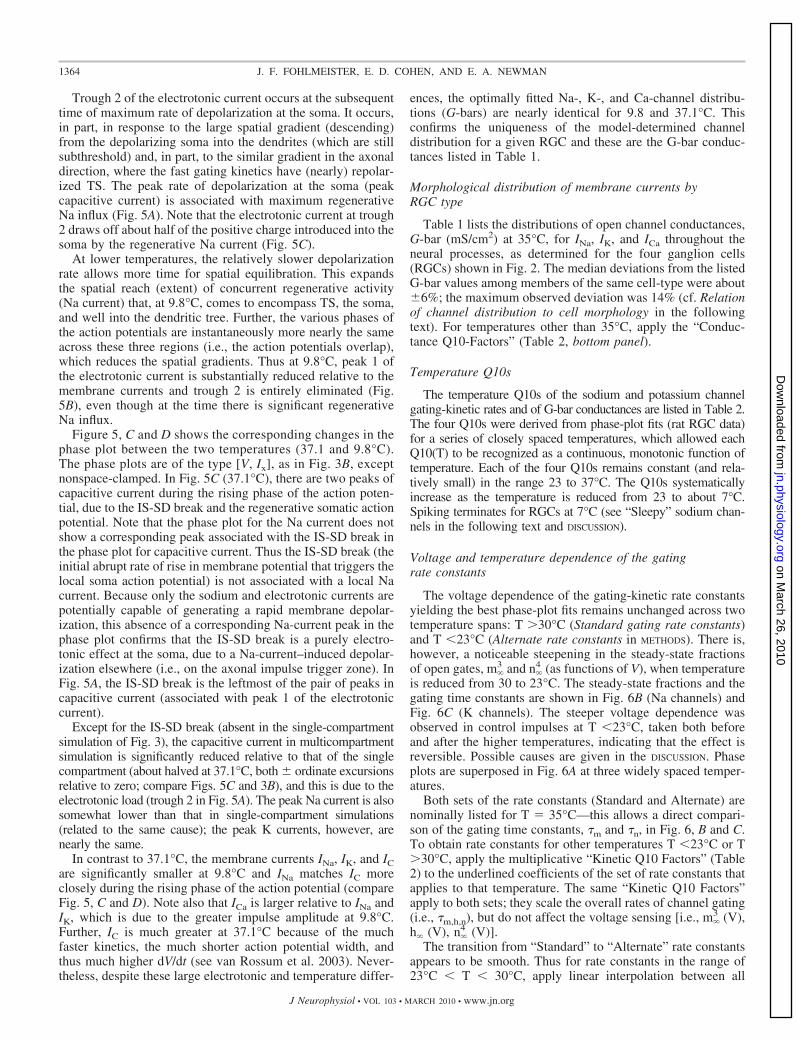
Table 1 lists the distributions of open channel conductances,G-bar (mS/cm2) at 35°C, for INa, IK, and ICa throughout theneural processes, as determined for the four ganglion cells(RGCs) shown in Fig. 2. The median deviations from the listedG-bar values among members of the same cell-type were about�6%; the maximum observed deviation was 14% (cf. Relationof channel distribution to cell morphology in the followingtext). For temperatures other than 35°C, apply the “Conduc-tance Q10-Factors” (Table 2, bottom panel).
Temperature Q10s
The temperature Q10s of the sodium and potassium channelgating-kinetic rates and of G-bar conductances are listed in Table 2.The four Q10s were derived from phase-plot fits (rat RGC data)for a series of closely spaced temperatures, which allowed eachQ10(T) to be recognized as a continuous, monotonic function oftemperature. Each of the four Q10s remains constant (and rela-tively small) in the range 23 to 37°C. The Q10s systematicallyincrease as the temperature is reduced from 23 to about 7°C.Spiking terminates for RGCs at 7°C (see “Sleepy” sodium chan-nels in the following text and DISCUSSION).
Voltage and temperature dependence of the gatingrate constants
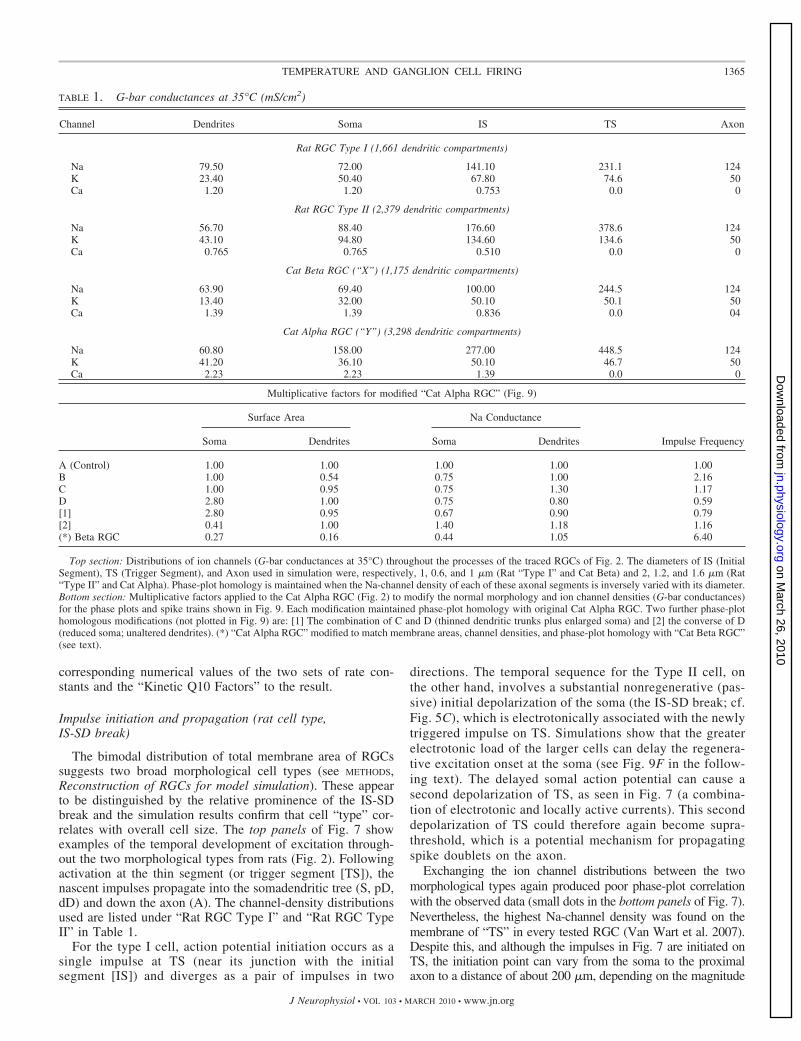
The voltage dependence of the gating-kinetic rate constantsyielding the best phase-plot fits remains unchanged across twotemperature spans: T �30°C (Standard gating rate constants)and T �23°C (Alternate rate constants in METHODS). There is,however, a noticeable steepening in the steady-state fractionsof open gates, m�
3 and n�4 (as functions of V), when temperature
is reduced from 30 to 23°C. The steady-state fractions and thegating time constants are shown in Fig. 6B (Na channels) andFig. 6C (K channels). The steeper voltage dependence wasobserved in control impulses at T �23°C, taken both beforeand after the higher temperatures, indicating that the effect isreversible. Possible causes are given in the DISCUSSION. Phaseplots are superposed in Fig. 6A at three widely spaced temper-atures.
Both sets of the rate constants (Standard and Alternate) arenominally listed for T � 35°C—this allows a direct compari-son of the gating time constants, �m and �n, in Fig. 6, B and C.To obtain rate constants for other temperatures T �23°C or T�30°C, apply the multiplicative “Kinetic Q10 Factors” (Table2) to the underlined coefficients of the set of rate constants thatapplies to that temperature. The same “Kinetic Q10 Factors”apply to both sets; they scale the overall rates of channel gating(i.e., �m,h,n), but do not affect the voltage sensing [i.e., m�
3 (V),h� (V), n�
4 (V)].The transition from “Standard” to “Alternate” rate constants
appears to be smooth. Thus for rate constants in the range of23°C � T � 30°C, apply linear interpolation between all
1364 J. F. FOHLMEISTER, E. D. COHEN, AND E. A. NEWMAN
J Neurophysiol • VOL 103 • MARCH 2010 • www.jn.org
on March 26, 2010
jn.physiology.orgD
ownloaded from
corresponding numerical values of the two sets of rate con-stants and the “Kinetic Q10 Factors” to the result.
Impulse initiation and propagation (rat cell type,IS-SD break)
The bimodal distribution of total membrane area of RGCssuggests two broad morphological cell types (see METHODS,Reconstruction of RGCs for model simulation). These appearto be distinguished by the relative prominence of the IS-SDbreak and the simulation results confirm that cell “type” cor-relates with overall cell size. The top panels of Fig. 7 showexamples of the temporal development of excitation through-out the two morphological types from rats (Fig. 2). Followingactivation at the thin segment (or trigger segment [TS]), thenascent impulses propagate into the somadendritic tree (S, pD,dD) and down the axon (A). The channel-density distributionsused are listed under “Rat RGC Type I” and “Rat RGC TypeII” in Table 1.
For the type I cell, action potential initiation occurs as asingle impulse at TS (near its junction with the initialsegment [IS]) and diverges as a pair of impulses in two
directions. The temporal sequence for the Type II cell, onthe other hand, involves a substantial nonregenerative (pas-sive) initial depolarization of the soma (the IS-SD break; cf.Fig. 5C), which is electrotonically associated with the newlytriggered impulse on TS. Simulations show that the greaterelectrotonic load of the larger cells can delay the regenera-tive excitation onset at the soma (see Fig. 9F in the follow-ing text). The delayed somal action potential can cause asecond depolarization of TS, as seen in Fig. 7 (a combina-tion of electrotonic and locally active currents). This seconddepolarization of TS could therefore again become supra-threshold, which is a potential mechanism for propagatingspike doublets on the axon.
Exchanging the ion channel distributions between the twomorphological types again produced poor phase-plot correlationwith the observed data (small dots in the bottom panels of Fig. 7).Nevertheless, the highest Na-channel density was found on themembrane of “TS” in every tested RGC (Van Wart et al. 2007).Despite this, and although the impulses in Fig. 7 are initiated onTS, the initiation point can vary from the soma to the proximalaxon to a distance of about 200 �m, depending on the magnitude
TABLE 1. G-bar conductances at 35°C (mS/cm2)
Channel Dendrites Soma IS TS Axon
Rat RGC Type I (1,661 dendritic compartments)
Na 79.50 72.00 141.10 231.1 124K 23.40 50.40 67.80 74.6 50Ca 1.20 1.20 0.753 0.0 0
Rat RGC Type II (2,379 dendritic compartments)
Na 56.70 88.40 176.60 378.6 124K 43.10 94.80 134.60 134.6 50Ca 0.765 0.765 0.510 0.0 0
Cat Beta RGC (“X”) (1,175 dendritic compartments)
Na 63.90 69.40 100.00 244.5 124K 13.40 32.00 50.10 50.1 50Ca 1.39 1.39 0.836 0.0 04
Cat Alpha RGC (“Y”) (3,298 dendritic compartments)
Na 60.80 158.00 277.00 448.5 124K 41.20 36.10 50.10 46.7 50Ca 2.23 2.23 1.39 0.0 0
Multiplicative factors for modified “Cat Alpha RGC” (Fig. 9)
Surface Area Na Conductance
Impulse FrequencySoma Dendrites Soma Dendrites
A (Control) 1.00 1.00 1.00 1.00 1.00B 1.00 0.54 0.75 1.00 2.16C 1.00 0.95 0.75 1.30 1.17D 2.80 1.00 0.75 0.80 0.59[1] 2.80 0.95 0.67 0.90 0.79[2] 0.41 1.00 1.40 1.18 1.16(*) Beta RGC 0.27 0.16 0.44 1.05 6.40
Top section: Distributions of ion channels (G-bar conductances at 35°C) throughout the processes of the traced RGCs of Fig. 2. The diameters of IS (InitialSegment), TS (Trigger Segment), and Axon used in simulation were, respectively, 1, 0.6, and 1 �m (Rat “Type I” and Cat Beta) and 2, 1.2, and 1.6 �m (Rat“Type II” and Cat Alpha). Phase-plot homology is maintained when the Na-channel density of each of these axonal segments is inversely varied with its diameter.Bottom section: Multiplicative factors applied to the Cat Alpha RGC (Fig. 2) to modify the normal morphology and ion channel densities (G-bar conductances)for the phase plots and spike trains shown in Fig. 9. Each modification maintained phase-plot homology with original Cat Alpha RGC. Two further phase-plothomologous modifications (not plotted in Fig. 9) are: [1] The combination of C and D (thinned dendritic trunks plus enlarged soma) and [2] the converse of D(reduced soma; unaltered dendrites). (*) “Cat Alpha RGC” modified to match membrane areas, channel densities, and phase-plot homology with “Cat Beta RGC”(see text).
1365TEMPERATURE AND GANGLION CELL FIRING
J Neurophysiol • VOL 103 • MARCH 2010 • www.jn.org
on March 26, 2010
jn.physiology.orgD
ownloaded from

of stimulus and on spiking history (cf. Fohlmeister and Miller1997b; Sheasby and Fohlmeister 1999).
Phase plots of cat RGCs
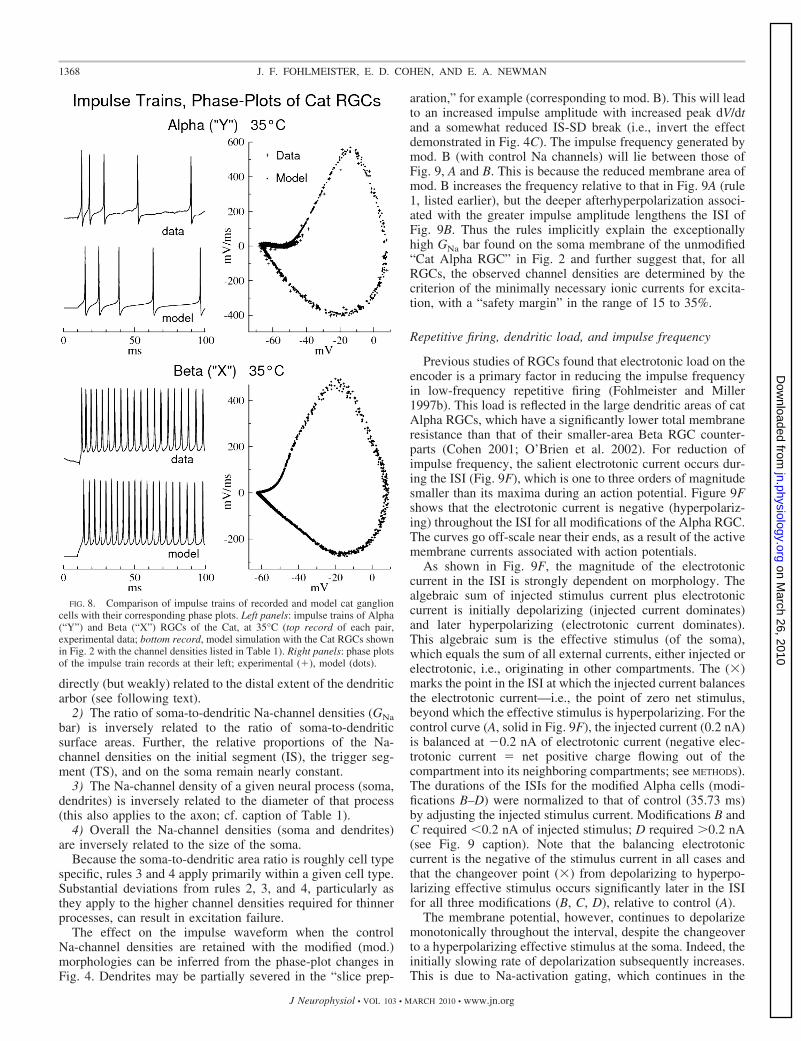
Impulse train records and phase plots from cat Alpha (“Y”)and Beta (“X”) RGCs at 35°C were fitted to the RGC model,as shown in Fig. 8. The best cat RGC model fits occurred withthe same rate constants used for the rat RGC simulations. Thetwo species thus appear to share similar gating kinetics. Dif-ferences in the phase plots (action potentials) are due tomorphological effects (see following text and Fig. 7). Althoughboth X and Y cells show high Na-channel densities on theirtrigger segments TS, similar to those of rat “Type I” and “TypeII” cells (Table 1), the cat RGCs show little IS-SD break intheir phase plots.
Relation of channel distribution to cell morphology
Despite the geometric complexity of individual RGCs, gen-eral rules exist for maintaining phase-plot homology withcell-type–specific channel distributions. To generate theserules, two initial observations are helpful. 1) As shown in Table1, the somadendritic distribution of Na channels is relativelyuniform across most RGCs (70 � 10 mS/cm2), except that thelarger cells show a higher GNa bar on the soma (particularly the
158 mS/cm2 of the large cat Alpha RGC), and 2) the soma-to-dendritic ratios of membrane area are significantly higher forthe small-area Type I cells (mean ratio � 0.289 among ourtraced RGCs) than they are for the large-area Type II cells(mean ratio � 0.125; see METHODS, Reconstruction of RGCs formodel simulation).
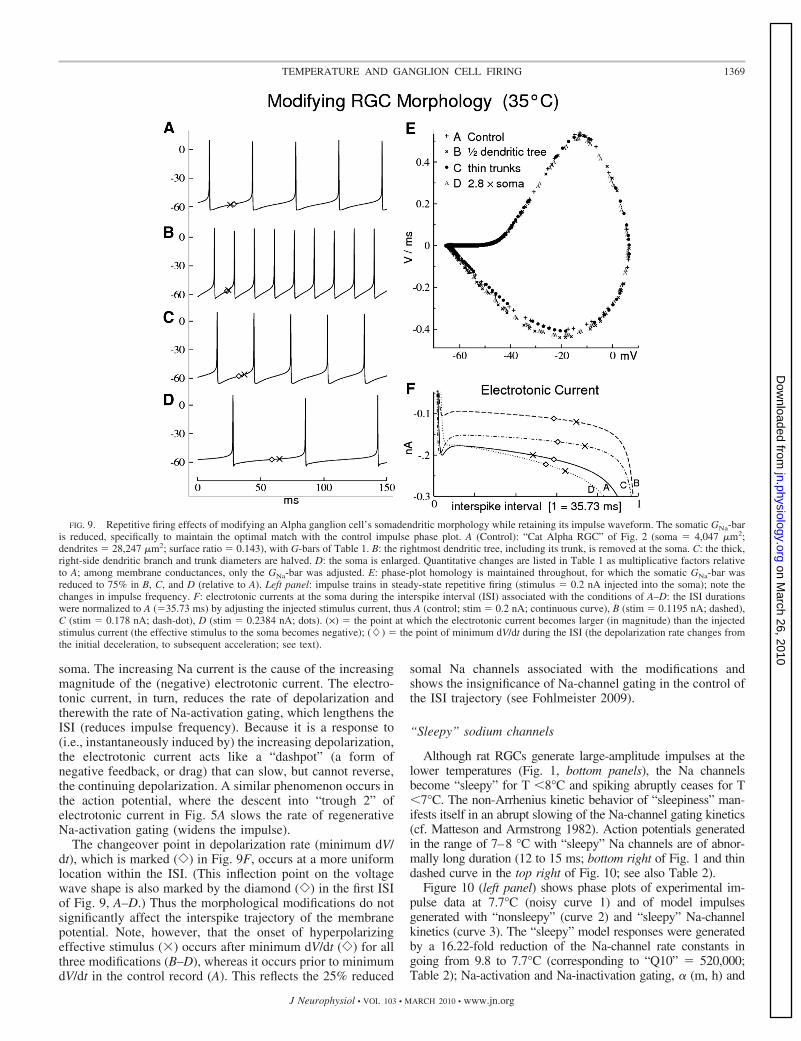
The relationship between Na-channel distribution and areaparameters was explored by systematically modifying the so-madendritic morphology of the most exceptional cell in Table1, i.e., “Cat Alpha RGC” of Fig. 2. Figure 9 shows the control(A) and the results of modifications that include removing alarge dendritic tree (B), thinning dendrites (C), and enlargingthe soma (D). These modifications all loosely retain the orig-inal action potential waveform (i.e., a similarly shaped phaseplot; Fig. 9E), while reducing the somatic GNa-bar to 75% ofthe original Cat Alpha RGC value given in Table 1. Eachmodification also increases the cell’s soma-to-dendritic arearatio (the control area ratio � 0.143). All changes in membraneparameters are listed in the bottom panel of Table 1, in theform of fractions relative to control.
The effects of these modifications on impulse frequency(constant stimulus current) are seen in the model spike trainrecords in the left panel of Fig. 9. The frequency changessignificantly (Fig. 9, B–D), whereas the action potentials re-main of similar shape (Fig. 9E). Furthermore, these results
TABLE 2. Q10s and neural parameters as functions of temperature
Temperature, °C
Q10
Stimulus, pAmp
Gating Kinetic Conductance Action Potential*
Na K Na K Amplitude, mV Width, ms
37.1 1.95 1.9 1.64 1.61 49.8 0.30 44034.9 1.95 1.9 1.64 1.61 53.1 0.34 32029.9 1.95 1.9 1.59 1.52 63.5 0.50 12023.5 1.95 1.9 1.64 1.49 71.1 0.71 12016.7 3.00 3.0 2.97 3.10 72.5 1.60 8014.1 3.70 3.7 3.08 3.60 79.4 2.16 4013.9 3.70 3.7 2.85 3.60 81.6 2.10 4013.0 4.30 4.3 2.95 3.30 82.5 2.09 409.8 8.00 8.0 11.70 4.60 72.6 4.35 407.7** 520,000† 9.0 3,300 270 62.0 10.44 160
Temperature, °C
Q10 Factors
Ri, � � cm
Gating Kinetic Conductance Equilibrium Potentials, mV
Na, Ca K Na, Ca K Na K Leak
37.1 1.151 1.144 1.109 1.105 61.02 102.03 65.02 136.635.0 1.000 1.000 1.000 1.000 60.60 101.34 64.58 143.234.9 0.993 0.994 0.995 0.995 60.58 101.31 64.56 143.529.9 0.711 0.720 0.777 0.791 59.60 99.67 63.51 160.423.5 0.463 0.478 0.566 0.610 58.34 97.56 62.17 185.013.9 0.132 0.136 0.219 0.165 56.45 94.40 60.16 234.99.8 0.0563 0.0580 0.0845 0.0988 55.65 93.05 59.30 251.27.7 0.00347† 0.0358 0.00670 0.0441 55.23 92.36 58.86 263.3
Top section: Gating Kinetic and Conductance Q10s for a series of closely spaced temperatures as determined by model fits to experimental phase plots fromRat RGCs. “Stimulus” was the minimum multiple of 20 picoamperes (injected into the soma) to yield sustained repetitive firing. (*) Amplitude, the impulse peakthrough afterhyperpolarization; Width, measured at the midpoint of the voltage extremes. (**) Q10 (7.7°C) computed as: exp{[ln x(7.7°C) ln x(9.8°C)]/[7.7 9.8)/10]}; x � coefficient of rate constant (voltage-independent) and/or G-bar conductance, except (†). (†) This “Q10” is equivalent to applying Q10 � 9 to therate constants for 9.8°C, followed by an additional reduction of a factor of 10, resulting in “sleepy” Na channels at 7.7°C. Bottom section: Multiplicative “Q10Factors” to be applied to the gating kinetic Rate Constants and G-bar Conductances, for other than 35°C (these correspond to the temperatures of Q10s in thetop section). Equilibrium Potentials (mV) were computed by applying the factor (T � 273°)/(37° � 273°) to 37°C values (Woodbury 1965). See METHODS forcomputation of Ri (cytoplasmic resistivity). (†) “Sleepy” Na channels at 7.7°C (“Q10 Factor” for Ca � 0.0347).
1366 J. F. FOHLMEISTER, E. D. COHEN, AND E. A. NEWMAN
J Neurophysiol • VOL 103 • MARCH 2010 • www.jn.org
on March 26, 2010
jn.physiology.orgD
ownloaded from
exemplify the following generally observed rules. Rules 1 and2 apply to RGCs in general, with rule 2 establishing the overallsoma-to-dendritic Na-channel density ratio based on mem-brane area. Additional rules 3 and 4 serve to modulate regional
Na-channel densities based on the diameters of the soma anddendritic processes.
1) The impulse frequency (for given stimulus current) isinversely related to the total somadendritic surface area and is
FIG. 6. Temperature’s effects on rate con-stants. A: phase plots as a function of temper-ature (rat Type I RGC). B and C: steady statesof gating and time constants of the “Standard”rate constants for T �30°C (continuouscurves) and “Alternate” rate constants for T�23°C (dashed curves) for Na- and K-channelgating, respectively. The steady-state fractionsof open gates, m�
3 (V), h�(V), n�4 (V), are com-
puted as: x�(V) � �x(V)/[�x(V) � �x(V)],(x � m, h, n), and vary on the ordinate interval(0, 1). The dashed and solid curves of m�
3 andof n�
4 intersect at 61.09 and at 19.24 mV,respectively (see text for interpretation). Timeconstants are computed as: �x(V) �1/[�x(V) � �x(V)], with ordinate scales spec-ified for T � 35°C.
FIG. 7. Comparison of AP initiation andpropagation throughout 2 rat ganglion cellmorphological models. Top panels: plots ofAP initiation, shape, and time of occurrence atdifferent RGC locations. Each set of recordsare of a 3-ms segment taken from the steady-state phase of model impulse trains. TS, triggersegment (site of impulse initiation); S, soma;pD, proximal dendrite (�25% into the den-dritic tree); dD, distal dendrite (near the den-dritic tips); A, axon (900 �m distal to TS).Note the 2 depolarizations in the record for TSof RGC Type II (see text for interpretation).Bottom panels: phase plots of experimentalimpulse trains (�) of the 2 RGCs are indepen-dently fit by the model (heavier dots). Thestrong sensitivities to cell geometry becomeapparent when the distributed ion channels(model fits) are applied to the complementaryRGC morphologies (small dots).
1367TEMPERATURE AND GANGLION CELL FIRING
J Neurophysiol • VOL 103 • MARCH 2010 • www.jn.org
on March 26, 2010
jn.physiology.orgD
ownloaded from
directly (but weakly) related to the distal extent of the dendriticarbor (see following text).
2) The ratio of soma-to-dendritic Na-channel densities (GNabar) is inversely related to the ratio of soma-to-dendriticsurface areas. Further, the relative proportions of the Na-channel densities on the initial segment (IS), the trigger seg-ment (TS), and on the soma remain nearly constant.
3) The Na-channel density of a given neural process (soma,dendrites) is inversely related to the diameter of that process(this also applies to the axon; cf. caption of Table 1).
4) Overall the Na-channel densities (soma and dendrites)are inversely related to the size of the soma.
Because the soma-to-dendritic area ratio is roughly cell typespecific, rules 3 and 4 apply primarily within a given cell type.Substantial deviations from rules 2, 3, and 4, particularly asthey apply to the higher channel densities required for thinnerprocesses, can result in excitation failure.
The effect on the impulse waveform when the controlNa-channel densities are retained with the modified (mod.)morphologies can be inferred from the phase-plot changes inFig. 4. Dendrites may be partially severed in the “slice prep-
aration,” for example (corresponding to mod. B). This will leadto an increased impulse amplitude with increased peak dV/dtand a somewhat reduced IS-SD break (i.e., invert the effectdemonstrated in Fig. 4C). The impulse frequency generated bymod. B (with control Na channels) will lie between those ofFig. 9, A and B. This is because the reduced membrane area ofmod. B increases the frequency relative to that in Fig. 9A (rule1, listed earlier), but the deeper afterhyperpolarization associ-ated with the greater impulse amplitude lengthens the ISI ofFig. 9B. Thus the rules implicitly explain the exceptionallyhigh GNa bar found on the soma membrane of the unmodified“Cat Alpha RGC” in Fig. 2 and further suggest that, for allRGCs, the observed channel densities are determined by thecriterion of the minimally necessary ionic currents for excita-tion, with a “safety margin” in the range of 15 to 35%.
Repetitive firing, dendritic load, and impulse frequency
Previous studies of RGCs found that electrotonic load on theencoder is a primary factor in reducing the impulse frequencyin low-frequency repetitive firing (Fohlmeister and Miller1997b). This load is reflected in the large dendritic areas of catAlpha RGCs, which have a significantly lower total membraneresistance than that of their smaller-area Beta RGC counter-parts (Cohen 2001; O’Brien et al. 2002). For reduction ofimpulse frequency, the salient electrotonic current occurs dur-ing the ISI (Fig. 9F), which is one to three orders of magnitudesmaller than its maxima during an action potential. Figure 9Fshows that the electrotonic current is negative (hyperpolariz-ing) throughout the ISI for all modifications of the Alpha RGC.The curves go off-scale near their ends, as a result of the activemembrane currents associated with action potentials.
As shown in Fig. 9F, the magnitude of the electrotoniccurrent in the ISI is strongly dependent on morphology. Thealgebraic sum of injected stimulus current plus electrotoniccurrent is initially depolarizing (injected current dominates)and later hyperpolarizing (electrotonic current dominates).This algebraic sum is the effective stimulus (of the soma),which equals the sum of all external currents, either injected orelectrotonic, i.e., originating in other compartments. The (�)marks the point in the ISI at which the injected current balancesthe electrotonic current—i.e., the point of zero net stimulus,beyond which the effective stimulus is hyperpolarizing. For thecontrol curve (A, solid in Fig. 9F), the injected current (0.2 nA)is balanced at 0.2 nA of electrotonic current (negative elec-trotonic current � net positive charge flowing out of thecompartment into its neighboring compartments; see METHODS).The durations of the ISIs for the modified Alpha cells (modi-fications B–D) were normalized to that of control (35.73 ms)by adjusting the injected stimulus current. Modifications B andC required �0.2 nA of injected stimulus; D required �0.2 nA(see Fig. 9 caption). Note that the balancing electrotoniccurrent is the negative of the stimulus current in all cases andthat the changeover point (�) from depolarizing to hyperpo-larizing effective stimulus occurs significantly later in the ISIfor all three modifications (B, C, D), relative to control (A).
The membrane potential, however, continues to depolarizemonotonically throughout the interval, despite the changeoverto a hyperpolarizing effective stimulus at the soma. Indeed, theinitially slowing rate of depolarization subsequently increases.This is due to Na-activation gating, which continues in the
FIG. 8. Comparison of impulse trains of recorded and model cat ganglioncells with their corresponding phase plots. Left panels: impulse trains of Alpha(“Y”) and Beta (“X”) RGCs of the Cat, at 35°C (top record of each pair,experimental data; bottom record, model simulation with the Cat RGCs shownin Fig. 2 with the channel densities listed in Table 1). Right panels: phase plotsof the impulse train records at their left; experimental (�), model (dots).
1368 J. F. FOHLMEISTER, E. D. COHEN, AND E. A. NEWMAN
J Neurophysiol • VOL 103 • MARCH 2010 • www.jn.org
on March 26, 2010
jn.physiology.orgD
ownloaded from
soma. The increasing Na current is the cause of the increasingmagnitude of the (negative) electrotonic current. The electro-tonic current, in turn, reduces the rate of depolarization andtherewith the rate of Na-activation gating, which lengthens theISI (reduces impulse frequency). Because it is a response to(i.e., instantaneously induced by) the increasing depolarization,the electrotonic current acts like a “dashpot” (a form ofnegative feedback, or drag) that can slow, but cannot reverse,the continuing depolarization. A similar phenomenon occurs inthe action potential, where the descent into “trough 2” ofelectrotonic current in Fig. 5A slows the rate of regenerativeNa-activation gating (widens the impulse).
The changeover point in depolarization rate (minimum dV/dt), which is marked (�) in Fig. 9F, occurs at a more uniformlocation within the ISI. (This inflection point on the voltagewave shape is also marked by the diamond (�) in the first ISIof Fig. 9, A–D.) Thus the morphological modifications do notsignificantly affect the interspike trajectory of the membranepotential. Note, however, that the onset of hyperpolarizingeffective stimulus (�) occurs after minimum dV/dt (�) for allthree modifications (B–D), whereas it occurs prior to minimumdV/dt in the control record (A). This reflects the 25% reduced
somal Na channels associated with the modifications andshows the insignificance of Na-channel gating in the control ofthe ISI trajectory (see Fohlmeister 2009).
“Sleepy” sodium channels
Although rat RGCs generate large-amplitude impulses at thelower temperatures (Fig. 1, bottom panels), the Na channelsbecome “sleepy” for T �8°C and spiking abruptly ceases for T�7°C. The non-Arrhenius kinetic behavior of “sleepiness” man-ifests itself in an abrupt slowing of the Na-channel gating kinetics(cf. Matteson and Armstrong 1982). Action potentials generatedin the range of 7–8 °C with “sleepy” Na channels are of abnor-mally long duration (12 to 15 ms; bottom right of Fig. 1 and thindashed curve in the top right of Fig. 10; see also Table 2).
Figure 10 (left panel) shows phase plots of experimental im-pulse data at 7.7°C (noisy curve 1) and of model impulsesgenerated with “nonsleepy” (curve 2) and “sleepy” Na-channelkinetics (curve 3). The “sleepy” model responses were generatedby a 16.22-fold reduction of the Na-channel rate constants ingoing from 9.8 to 7.7°C (corresponding to “Q10” � 520,000;Table 2); Na-activation and Na-inactivation gating, � (m, h) and
FIG. 9. Repetitive firing effects of modifying an Alpha ganglion cell’s somadendritic morphology while retaining its impulse waveform. The somatic GNa-baris reduced, specifically to maintain the optimal match with the control impulse phase plot. A (Control): “Cat Alpha RGC” of Fig. 2 (soma � 4,047 �m2;dendrites � 28,247 �m2; surface ratio � 0.143), with G-bars of Table 1. B: the rightmost dendritic tree, including its trunk, is removed at the soma. C: the thick,right-side dendritic branch and trunk diameters are halved. D: the soma is enlarged. Quantitative changes are listed in Table 1 as multiplicative factors relativeto A; among membrane conductances, only the GNa-bar was adjusted. E: phase-plot homology is maintained throughout, for which the somatic GNa-bar wasreduced to 75% in B, C, and D (relative to A). Left panel: impulse trains in steady-state repetitive firing (stimulus � 0.2 nA injected into the soma); note thechanges in impulse frequency. F: electrotonic currents at the soma during the interspike interval (ISI) associated with the conditions of A–D: the ISI durationswere normalized to A (�35.73 ms) by adjusting the injected stimulus current, thus A (control; stim � 0.2 nA; continuous curve), B (stim � 0.1195 nA; dashed),C (stim � 0.178 nA; dash-dot), D (stim � 0.2384 nA; dots). (✕) � the point at which the electrotonic current becomes larger (in magnitude) than the injectedstimulus current (the effective stimulus to the soma becomes negative); (�) � the point of minimum dV/dt during the ISI (the depolarization rate changes fromthe initial deceleration, to subsequent acceleration; see text).
1369TEMPERATURE AND GANGLION CELL FIRING
J Neurophysiol • VOL 103 • MARCH 2010 • www.jn.org
on March 26, 2010
jn.physiology.orgD
ownloaded from
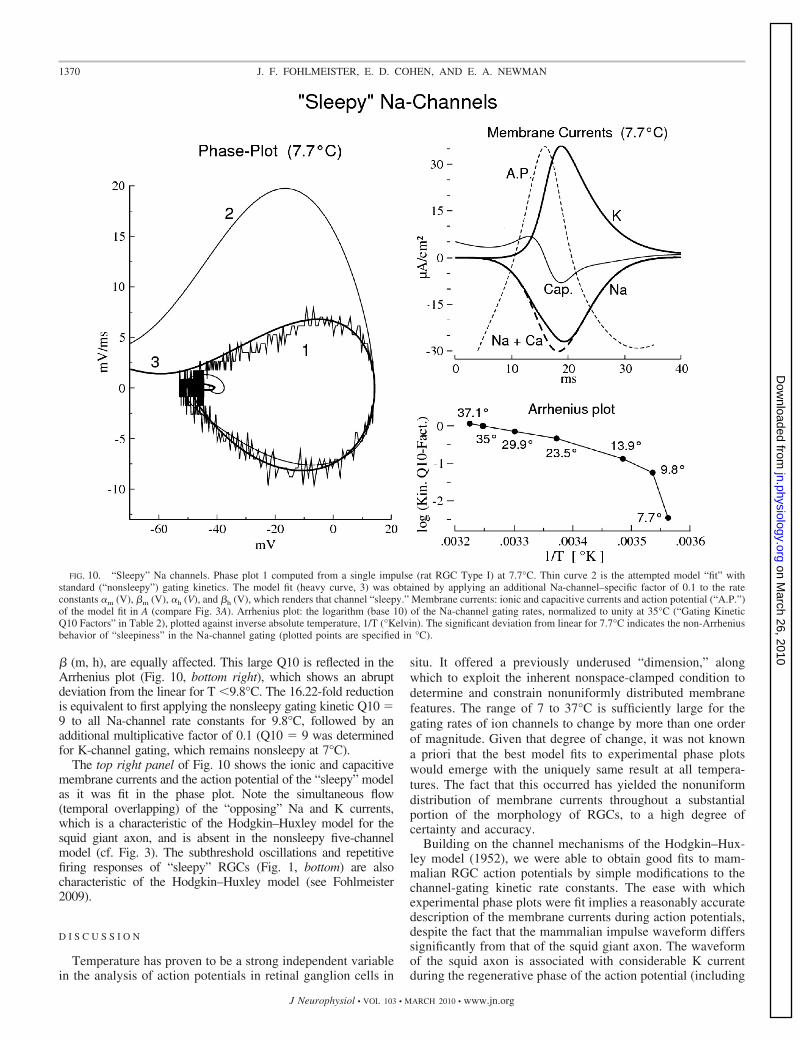
� (m, h), are equally affected. This large Q10 is reflected in theArrhenius plot (Fig. 10, bottom right), which shows an abruptdeviation from the linear for T �9.8°C. The 16.22-fold reductionis equivalent to first applying the nonsleepy gating kinetic Q10 �9 to all Na-channel rate constants for 9.8°C, followed by anadditional multiplicative factor of 0.1 (Q10 � 9 was determinedfor K-channel gating, which remains nonsleepy at 7°C).
The top right panel of Fig. 10 shows the ionic and capacitivemembrane currents and the action potential of the “sleepy” modelas it was fit in the phase plot. Note the simultaneous flow(temporal overlapping) of the “opposing” Na and K currents,which is a characteristic of the Hodgkin–Huxley model for thesquid giant axon, and is absent in the nonsleepy five-channelmodel (cf. Fig. 3). The subthreshold oscillations and repetitivefiring responses of “sleepy” RGCs (Fig. 1, bottom) are alsocharacteristic of the Hodgkin–Huxley model (see Fohlmeister2009).
D I S C U S S I O N
Temperature has proven to be a strong independent variablein the analysis of action potentials in retinal ganglion cells in
situ. It offered a previously underused “dimension,” alongwhich to exploit the inherent nonspace-clamped condition todetermine and constrain nonuniformly distributed membranefeatures. The range of 7 to 37°C is sufficiently large for thegating rates of ion channels to change by more than one orderof magnitude. Given that degree of change, it was not knowna priori that the best model fits to experimental phase plotswould emerge with the uniquely same result at all tempera-tures. The fact that this occurred has yielded the nonuniformdistribution of membrane currents throughout a substantialportion of the morphology of RGCs, to a high degree ofcertainty and accuracy.
Building on the channel mechanisms of the Hodgkin–Hux-ley model (1952), we were able to obtain good fits to mam-malian RGC action potentials by simple modifications to thechannel-gating kinetic rate constants. The ease with whichexperimental phase plots were fit implies a reasonably accuratedescription of the membrane currents during action potentials,despite the fact that the mammalian impulse waveform differssignificantly from that of the squid giant axon. The waveformof the squid axon is associated with considerable K currentduring the regenerative phase of the action potential (including
FIG. 10. “Sleepy” Na channels. Phase plot 1 computed from a single impulse (rat RGC Type I) at 7.7°C. Thin curve 2 is the attempted model “fit” withstandard (“nonsleepy”) gating kinetics. The model fit (heavy curve, 3) was obtained by applying an additional Na-channel–specific factor of 0.1 to the rateconstants �m (V), �m (V), �h (V), and �h (V), which renders that channel “sleepy.” Membrane currents: ionic and capacitive currents and action potential (“A.P.”)of the model fit in A (compare Fig. 3A). Arrhenius plot: the logarithm (base 10) of the Na-channel gating rates, normalized to unity at 35°C (“Gating KineticQ10 Factors” in Table 2), plotted against inverse absolute temperature, 1/T (°Kelvin). The significant deviation from linear for 7.7°C indicates the non-Arrheniusbehavior of “sleepiness” in the Na-channel gating (plotted points are specified in °C).
1370 J. F. FOHLMEISTER, E. D. COHEN, AND E. A. NEWMAN
J Neurophysiol • VOL 103 • MARCH 2010 • www.jn.org
on March 26, 2010
jn.physiology.orgD
ownloaded from
at impulse threshold) and, further, a large majority of the Nacurrent (85% at 6.3°C) occurs during the falling phase of theaction potential. With the rate constants of mammalian RGCs,in contrast, there is almost no temporal overlap of thesecurrents throughout the action potential (see Fig. 3A). Thisabsence of competition between the major ionic currents rep-resents a metabolic optimization of the Hodgkin–Huxley ki-netic framework (Fohlmeister 2009).
Model simulations show optimally concerted ionic currentsduring action potentials at all temperatures. Thus the curves ofthe membrane currents shown in Fig. 3A retain their character,with only the scales of current magnitude (ordinate) and time(abscissa) changing with temperature. These results reflect thefinding that, first, the voltage dependence of the channel gating(rate constants) remains unchanged throughout a large temper-ature range (7 to �23°C). The voltage dependence changessomewhat in the mammalian temperature range, particularlyfor T �30°C, but remains functionally the same, in that the ioniccurrents remain optimally concerted throughout the action poten-tials. Second, at each temperature the Q10s are nearly the sameacross the gating processes (Table 2). The readily detected ex-ception is the abrupt change in the Q10 of Na-channel gating(“sleepy channels”) at low temperatures (7– 8°C). The slow-ing of Na-channel gating associated with “sleepiness”causes the Na and K currents to overlap competitivelyduring the action potential at these low temperatures, thusmaking the “sleepy” RGCs somewhat similar to the originalHodgkin–Huxley model (Fohlmeister 2009).
Complement of ion channels: voltage-gated ion channelsubtypes found in RGCs
To form a perhaps more definitive model, one wouldideally prefer to use the specific isotypes of sodium andpotassium channel reported in retinal ganglion cells. How-ever, considerable controversy exists over which ion chan-nel types are present in mammalian retinal ganglion cellsand in what location and proportions. At present there arebetween 13 and 17 ganglion cell types found in mostvertebrate retinas.
Kaneda and Kaneko (1991) found that sluggish or W-cells inthe cat had sodium currents with slower rates of recovery thanthose of brisk X-type ganglion cells. Studies using antibodiesor in situ hybridization of sodium channels have reported theexistence of sodium channel types NaV1.1, 1.2, 1.3, and 1.6 inthe retinal ganglion cell layer (Boiko et al. 2001; Caldwell et al.2000; Craner et al. 2003; Khaliq et al. 2003). However, studiesdisagree on the RGC locations of these ion channel subtypesand whether they are expressed in all ganglion cell types. Forexample, NaV1.6 was reported by Caldwell et al. (2000) andBoiko et al. (2001) to be located exclusively in the innersegment of the axon, whereas Craner et al. (2003) and Kanekoet al. (2007) reported hybridization in the ganglion cell bodyand axon as well. Finally, virtually nothing is known about thephosphorylation state of the sodium channels in RGCs (Hidakaand Ishida 1998).
The distribution of voltage-gated potassium channels inRGCs is also poorly understood. The potassium channel sub-units Kv1.1–1.6 have been reported to hybridize to ganglioncells (Henne et al. 2000; Holtje et al. 2007; Pollock et al. 2002).Lasater and Witkovsky (1990) found differences in ganglion
cell spiking properties reflected in the kinetics of inactivationof outward currents (presumably due to potassium channels; cf.also Lukasciewicz and Weblin 1988).
The ability of the five-channel model to accurately simulateaction potentials does not exclude other ion channels. Smallcurrents (including Ca-activated K currents, low-threshold T-type Ca currents: Henderson and Miller 2003; Lee et al. 2003;Ih currents: Pape 1996; Tabata and Ishida 1996; etc.), some ofwhich may be involved in the precise timing of the occurrenceof impulses, remain undetected (effectively masked) in phaseplots by the dominance of the large currents of the actionpotential. The A current appeared small in our model be-cause the experimental data did not exhibit a decisive“phase-plot signature” for the inactivating IK(A) in the actionpotential. Although other models of cat RGC spiking haveused estimated channel kinetics (e.g., van Rossum et al.2003) and have examined the ISI, our study has focusedprincipally on the mechanism of the nerve impulse.
Temperature Q10s
Previously reported Q10s of gating kinetics vary by channeltype, among the gates of a given channel, the direction of thegating-kinetic step (i.e., opening or closing the channel), thetemperature range under consideration, and also with the ex-perimental method. Thus Q10s for K-channel gating rangefrom Q10 � 1.5 (Tiwari and Sidkar 1999) to 3.63 (Clay andShrier 2002). Frankenhaeuser and Moore (1963) found in thefrog node of Ranvier (5–20°C): Q10 � 3.2 for �n, 2.8 for �n,and differential Q10s � 1.76 and 2.87 for Na-channel activa-tion (m) and inactivation (h) gating, whereas Collins and Rojas(1982) found Q10s � 2.34 and 2.9, respectively, for the latter.
Larger Q10s have also been determined, particularly inmammalian preparations at lower temperatures. Thus Q10s �4are reported for both ionic and gating (asymmetric displace-ment) currents of Shaker K� channels in the range 2–22°C(Rodriguez et al. 1998). A Q10 as high as 7.31 is reported fora slow, external K�-activated K current [“I(deltaK)”] in cor-tical and hippocampal neurons (Filippov and Krishtal 1999).Beam and Donaldson (1983) reported Q10 � 6 for K-channelactivation in rat skeletal muscle in the range 1–10°C; thisreduced to Q10 � 2 for the range 30–38°C. Our Q10s fall intothe general pattern of these reports, but are more highlyconstrained because of the sensitivity of phase-plot analysis.
In mammalian RGCs, we find that nearly the same gating-kinetic Q10 applies to all rate constants of the spiking Na andK currents. Different Q10s among the channel types, or amongthe rate constants of a given channel, result in phase-plotdistortions or spiking failure (cf. Klockner et al. 1990). Thisfinding is one of the major conclusions that follows from theRGCs’ ability to generate action potentials throughout atemperature range that is sufficiently large to change thekinetic rates by more than one order of magnitude. A smalldifference of Q10 � 1.95 and 1.9 between Na- and K-channel gating, respectively, is seen throughout the range of23–37°C. As is commonly observed in mammalian prepa-rations, the gating-kinetic Q10s increase as temperature islowered below T �23°C (Table 2) and our values areremarkably consistent with those of Beam and Donaldson(1983). The large Q10s at low temperature may indicate adeparture from the enzyme kinetics of conformational
1371TEMPERATURE AND GANGLION CELL FIRING
J Neurophysiol • VOL 103 • MARCH 2010 • www.jn.org
on March 26, 2010
jn.physiology.orgD
ownloaded from

changes in a single protein molecule and may suggest amore complex gating mechanism involving channel subunits(Catterall 1995; Hanlon and Wallace 2002).
Effect of temperature on channel gating
One of the aims of the present study was to extend rateconstants obtained for tiger salamander RGCs at 22°C(Fohlmeister and Miller 1997a,b) to mammalian preparationsand temperatures. It was found that the rate constants of themammalian preparations undergo a noticeable change in rangeof 23–30°C (dashed to solid curves in Fig. 6, B and C). Theeffect is benign to the normal signaling function of the neuron(i.e., its encoding flexibility; cf. Fohlmeister 2009). It doeshave a potential metabolic advantage (Na-K-ATPase pumping)in that, at the highest temperatures (T �35°C), the “standard”rate constants are capable of maintaining spiking with about10% lower channel densities. This capability, however, ap-pears to be in the nature of an additional “safety factor”because the fitting of phase-plot data (i.e., phase-plot congru-ency) occurs with the same (i.e., unchanged) morphologicaldistribution of ion channel densities at all temperatures.
Among the temperature-dependent differences in the rateconstants is a reduced steepness in the voltage dependence ofm�
3 (V) and n�4 (V) for T �30°C relative to that for T �23°C
(see Fig. 6, B and C) and this may be a capacitive effect. Earlierwork has shown that membrane capacitance decreases withincreasing temperature (e.g., Robinson and Stokes 1954; White1975) and this may indicate an increased thickness in thehydrophobic portion of the bilayer membrane, possiblyassociated with thermodynamic phase transitions (e.g., Bo-heim et al. 1980). An increased thickness implies a lowertransmembrane electric field, dV/dx, for a given membranepotential (x � transmembrane direction). Because the “volt-age sensor” of channel gating responds directly to theelectric field (not to the membrane potential), a thickermembrane will reduce the steepness in voltage dependenceof channel gating.
The dashed and solid curves of m�3 (V) and n�
4 (V) in Fig. 6,B and C intersect at different membrane potentials (equal m�
3
occurs at 61.09 mV; equal n�4 at 19.24 mV). The offsets
from zero may partially be explained by differential surfacecharges (e.g., Gilbert and Ehrenstein 1969; McLaughlin andHarary 1974). Note also that the h� curve simply shifts on thevoltage axis and does not intersect. This may be an indicationthat Na-inactivation gating is linked to Na-activation gatingwithout an independent voltage sensitivity. There are, how-ever, differences in the voltage dependence between the“standard” and “alternate” rate constants that cannot beattributed to these biophysical effects alone, such as differ-ential gating effects between a given transition and itsinverse (e.g., �n and �n).
These gating effects may be associated with the same causeas is the Q10s’ behavior change as a function of temperature.Note that the changes from “alternate” to “standard” rateconstants begin to arise at about the same temperature as doesthe onset of constant and low gating-kinetic Q10s (�1.9, 1.95),i.e., about T �23.5°C—thus consider that mammalian channelgating may involve two simultaneous processes of widelydifferent temperature Q10s and with distinct voltage depen-dencies. The overall voltage response of gating may combine
the two voltage dependencies in such a way that the voltagedependence of the rate-limiting process is dominantly ex-pressed and “masks” that of the other (faster) process. Thus thehigh-Q10 process (Q10 � 8) will be considerably slower andtherefore rate limiting at sufficiently low temperatures (ex-pressing “alternate” rate constants), but will speed up rapidly athigh temperatures where the low-Q10 process (Q10 � 2) thenbecomes rate-limiting (and “standard” rate constants are ex-pressed).
The concept of two simultaneous and complementary activeprocesses in mammalian channel gating is supported by acomparative analysis with the squid giant axon (Fohlmeister2009). The high-Q10 component of channel gating appears tobe missing in the squid axon. The action potential of the squidaxon has a duration of only 2.5 ms at 6.3°C (the primarytemperature of the Hodgkin–Huxley model) and a comparisonwith the mammalian RGC action potentials shows that thegating-kinetic Q10 of the squid axon remains constant (Q10 �2) down to 6.3°C. This Q10 � 2 is very near to the Q10s � 1.9to 1.95, which remain constant in RGCs in the partial temper-ature range of T �23.5°C. It is possible that these relativelylow Q10s (�1.9 to 2) are associated with the irreducibleminimum mechanism necessary for channel function and aretherefore conserved across species (possibly related to the�-subunit of the channel) and that the mammalian channelgating is more complex and involves secondary processes ofhigh Q10 that do not occur in the squid axon (possibly associatedwith the channel �-subunits). These secondary processes may alsopossibly be associated with the functional differences of thevarious mammalian channel subtypes NaV1.1–1.6 and Kv1.1–1.6.
SUMMARY. Varying the temperature of the action potential ki-netics has allowed us to estimate the regional distributions of ionchannels on the dendrites, soma, and proximal axon of retinalganglion cells. We were able to use relationships of these channelswith temperature to detect and to quantify details of their gatingkinetics and their Q10s. The same (five-channel) model couldbe applied to anatomically reconstructed RGCs in two species.The voltage dependence of channel-gating changes between 23and 30°C, but remains invariant outside this transition range.The gating-kinetic Q10s and ion-permeability Q10s remainconstant for all T �23°C and both systematically (but inde-pendently) increase for T �23°C. These features maintainan “optimum” relationship between the Na and K currents,which is broken only by “sleepy” Na channels for T �8°C.The high degree of coherence in these results may beapplicable to impulse-encoding mechanisms in other mam-malian neurons.
A C K N O W L E D G M E N T S
We thank the Minnesota Supercomputer Institute for access to computingfacilities for this study. We thank Drs. Chris McBain (National Institute ofChild Health and Human Development) and Richard Borne (Harvard Univer-sity) for use of their Neurolucida reconstruction systems, Drs. Stephen Ikeda(National Institute on Alcohol Abuse and Alcoholism) and Ron Brown (Centerfor Devices and Radiological Health/U.S. Food and Drug Administration) forrat tissue, and D. Chan for assistance with the reconstruction of some of the catganglion cells. The mention of commercial products, their sources, or their usein connection with material reported herein is not to be construed as either anactual or implied endorsement of such products by the Department of Healthand Human Services.
1372 J. F. FOHLMEISTER, E. D. COHEN, AND E. A. NEWMAN
J Neurophysiol • VOL 103 • MARCH 2010 • www.jn.org
on March 26, 2010
jn.physiology.orgD
ownloaded from
G R A N T S
This research was supported in part by National Eye Institute GrantR01EY-012833 to R. F. Miller.
R E F E R E N C E S
Aho AC, Donner K, Reuter T. Retinal origins of the temperature effect onabsolute visual sensitivity in frogs. J Physiol 463: 501–521, 1993.
Ames A, Nesbett FB. In vitro retina as an experimental model of the centralnervous system. J Neurochem 37: 867–877, 1981.
Baylor DA, Matthews G, Yau KW. Temperature effects on the membranecurrent of retinal rods of the toad. J Physiol 337: 723–734, 1983.
Beam KG, Donaldson PL. A quantitative study of potassium channel kineticsin rat skeletal muscle from 1 to 37 degrees C. J Gen Physiol 81: 485–512,1983.
Boheim G, Hanke W, Eibl H. Lipid phase transition in planar bilayermembrane and its effect on carrier- and pore-mediated ion transport. ProcNatl Acad Sci USA 77: 3403–3407, 1980.
Boiko T, Rasband MN, Levinson SR, Caldwell JH, Mandel G, TrimmerJS, Matthews G. Compact myelin dictates the differential targeting oftwo sodium channel isoforms in the same axon. Neuron 30: 91–104,2001.
Caldwell JH, Schaller KL, Lasher RS, Peles E, Levinson SR. Sodiumchannel Na(v)1.6 is localized at nodes of Ranvier, dendrites, and synapses.Proc Natl Acad Sci 97: 5616–5620, 2000.
Carnevale NT, Hines ML. The NEURON Book. New York: Cambridge Univ.Press, 2006.
Catterall WA. Structure and function of voltage-gated ion channels. Ann RevBiochem 64: 493–531, 1995.
Ceelen PW, Lockridge A, Newman EA. Electrical coupling between glialcells in the rat retina. Glia 35: 1–13, 2001.
Clay JR, Shrier A. Temperature dependence of bistability in squid giantaxons with alkaline intracellular pH. J Membr Biol 187: 213–223, 2002.
Cohen ED. Interactions of inhibition and excitation in the light-evokedcurrents of X-type retinal ganglion cells. J Neurophysiol 80: 2975–2990,1998.
Cohen ED. Light-evoked excitatory synaptic currents of X-type retinal gan-glion cells. J Neurophysiol 83: 3217–3229, 2000.
Cohen ED. Synaptic mechanisms shaping the light-response in retinal gan-glion cells. Prog Brain Res 131: 215–228, 2001.
Collins CA, Rojas E. Temperature dependence of the sodium channel gatingkinetics in the node of Ranvier. Q J Exp Physiol 67: 41–55, 1982.
Cook JE, Becker DL. Gap junctions in the vertebrate retina. Microsc Res Tech31: 408–419, 1995.
Craner M, Lo A, Black J, Waxman S. Abnormal sodium channel distributionin optic nerve axons in a model of inflammatory demyelination. Brain 126:1552–1561, 2003.
Dhingra N, Kao Y, Sterling P, Smith R. Contrast threshold of a brisk-transient ganglion cell in vitro. J Neurophysiol 89: 2360–2369, 2003.
Donner K, Hemila S, Koskelainen A. Temperature-dependence of rodphotoresponses from the aspartate-treated retina of the frog (Rana tempo-raria). Acta Physiol Scand 134: 535–541, 1988.
Filippov V, Krishtal O. The mechanism gated by external potassium andsodium controls the resting conductance in hippocampal and cortical neu-rons. Neuroscience 92: 1231–1242, 1999.
Fohlmeister JF. A nerve model of greatly increased energy-efficiency andencoding flexibility over the Hodgkin–Huxley model. Brain Res 1296:225–233, 2009.
Fohlmeister JF, Coleman PA, Miller RF. Modeling the repetitive firing ofretinal ganglion cells. Brain Res 510: 343–345, 1990.
Fohlmeister JF, Miller RF. Impulse encoding mechanisms of ganglion cellsin the tiger salamander retina. J Neurophysiol 78: 1935–1947, 1997a.
Fohlmeister JF, Miller RF. Mechanisms by which cell geometry controlsrepetitive impulse firing in retinal ganglion cells. J Neurophysiol 78:1948–1964, 1997b.
Frankenhaeuser B, Moore LE. The effect of temperature on the sodium andpotassium permeability changes in myelinated nerve fibres of Xenopuslaevis. J Physiol 169: 431–437, 1963.
Gilbert DL, Ehrenstein G. Effect of divalent cations on potassium conduc-tance of squid axon: determination of surface charge. Biophys J 9: 447–463,1969.
Hanlon MR, Wallace BA. Structure and function of voltage-dependent ionchannel regulatory beta subunits. Biochemistry 41: 2886–2894, 2002.
Henderson D, Miller RF. Low-voltage activated calcium currents in ganglioncells of the tiger salamander retina: experiment and simulation. Vis Neurosci24: 37–51, 2003.
Henne J, Pottering S, Jeserich G. Voltage-gated potassium channels inretinal ganglion cells of trout: a combined biophysical, pharmacological, andsingle-cell RT-PCR approach. J Neurosci Res 62: 629–637, 2000.
Hidaka S, Ishida AT. Voltage-gated Na� current availability after step- andspike-shaped conditioning depolarizations of retinal ganglion cells. PflugersArch 436: 497–508, 1998.
Hodgkin AL, Huxley AF. A quantitative description of membrane current andits application to conduction and excitation in nerve. J Physiol 117: 500–544, 1952.
Holtje M, Brunk I, Grosse J, Beyer E, Veh RW, Bergmann M, Grosse G,Ahnert-Hilger G. Differential distribution of voltage-gated potassium chan-nels Kv 1.1-Kv1.6 in the rat retina during development. J Neurosci Res 85:19–33, 2007.
Hu EH, Bloomfield SA. Gap junctional coupling underlies the short-latencyspike synchrony of retinal alpha ganglion cells. J Neurosci 23: 6768–6777,2003.
Kaneda M, Kaneko A. Voltage-gated sodium currents in isolated retinalganglion cells of the cat: relation between the inactivation kinetics and thecell type. Neurosci Res 11: 261–275, 1991.
Kaneko Y, Watanabe S. Expression of Nav1.1 in rat retinal AII amacrinecells. Neurosci Lett 424: 83–88, 2007.
Khaliq ZM, Gouwens NW, Raman IM. The contribution of resurgentsodium current to high-frequency firing in Purkinje neurons: an experimen-tal and modeling study. J Neurosci 23: 4899–4912, 2003.
Klockner U, Schiefer A, Isenberg G. L-type Ca-channels: similar Q10 ofCa-, Ba- and Na-conductance points to the importance of ion-channelinteraction. Pflugers Arch 415: 638–641, 1990.
Lankheet MJ, Molenaar J, van de Grind WA. The spike generatingmechanism of cat retinal ganglion cells. Vision Res 29: 505–517, 1989.
Lasater E, Witkovsky P. Membrane currents of spiking cells isolated fromturtle retina. J Comp Physiol A Sens Neural Behav Physiol 167: 11–21,1990.
Lee SC, Hayashida Y, Ishida AT. Availability of low-threshold Ca2� currentin retinal ganglion cells. J Neurophysiol 90: 3888–3901, 2003.
Lipton SA, Tauck DL. Voltage-dependent conductances of solitary ganglioncells dissociated from the rat retina. J Physiol 385: 361–391, 1987.
Lukasiewicz P, Werblin F. A slowly inactivating potassium current truncatesspike activity in ganglion cells of the tiger salamander retina. J Neurosci 8:4470–4481, 1988.
Mangrum WI, Dowling JE, Cohen ED. A morphological classification ofganglion cells in the zebrafish retina. Vis Neurosci 19: 767–779, 2002.
Matteson DR, Armstrong CM. Evidence for a population of sleepy sodiumchannels in squid axon at low temperature. J Gen Physiol 79: 739–758,1982.
McLaughlin S, Harary H. Phospholipid flip-flop and the distribution ofsurface charges in excitable membranes. Biophys J 14: 200–208, 1974.
Newman EA. Glial cell inhibition of neurons by release of ATP. J Neurosci23: 1659–1666, 2003.
O’Brien BJ, IsayamaT, Richardson R, Berson DM. Intrinsic physiologicalproperties of cat retinal ganglion cells. J Physiol 538: 787–802, 2002.
Pape HC. Queer current and pacemaker: the hyperpolarization-activatedcation current in neurons. Annu Rev Physiol 58: 299–327, 1996.
Peichl L. Alpha and delta ganglion cells in the rat retina. J Comp Neurol 286:120–139, 1989.
Peichl L, Wassle H. The structural correlate of the receptive field centre ofalpha ganglion cells in the cat retina. J Physiol 341: 309–324, 1983.
Pollock NS, Ferguson SC, McFarlane S. Expression of voltage-dependentpotassium channels in the developing visual system of Xenopus laevis.J Comp Neurol 452: 381–391, 2002.
Robinson RA, Stokes RH. The variation of equivalent conductance withconcentration and temperature. J Am Chem Soc 76: 1991–1994, 1954.
Rodriguez BM, Sigg D, Bezanilla F. Voltage gating of Shaker K� channels.The effect of temperature on ionic and gating currents. J Gen Physiol 112:223–242, 1998.
Schellart NAM, Spekreijse H, van den Berg TJTP. Influence of temperatureon retinal ganglion cell response and e.r.g. of goldfish. J Physiol 238:251–267, 1974.
Sheasby BW, Fohlmeister JF. Impulse encoding across the dendritic mor-phologies of retinal ganglion cells. J Neurophysiol 81: 1685–1698, 1999.
Sun W, Li N, He S. Large-scale morophological survey of rat retinal ganglioncells. Vis Neurosci 19: 483–493, 2002.
1373TEMPERATURE AND GANGLION CELL FIRING
J Neurophysiol • VOL 103 • MARCH 2010 • www.jn.org
on March 26, 2010
jn.physiology.orgD
ownloaded from
Tabata T, Ishida AT. Transient and sustained depolarization of retinalganglion cells by Ih. J Neurophysiol 75: 1932–1943, 1996.
Tiwari JK, Sikdar SK. Temperature-dependent conformational changes in avoltage-gated potassium channel. Eur Biophys J 28: 338–345, 1999.
Trevelyan AJ, Jack J. Detailed passive cable models of layer 2/3 pyramidalcells in the rat visual cortex at different temperatures. J Physiol 539:623–636, 2002.
van Rossum MC, O’Brien BJ, Smith RG. Effects of noise on the spike timingprecision of retinal ganglion cells. J Neurophysiol 89: 2406–2419, 2003.
Van Wart A, Trimmer JS, Matthews G. Polarized distribution of ionchannels within microdomains of the axon initial segment. J Comp Neurol500: 339–352, 2007.
Veruki ML, Mørkve SH, Hartveit E. Functional properties of spontaneousEPSCs and non-NMDA receptors in rod amacrine (AII) cells in the ratretina. J Physiol 549: 759–774, 2003.
White SH. Phase transitions in planar bilayer membranes. Biophys J 15:95–117, 1975.
Wichmann BA, Hill ID. An efficient and portable pseudo-random numbergenerator. Appl Stat 31: 188–190, 1982.
Woodbury JW. The cell membrane: ionic and potential gradients and activetransport. In: Physiology and Biophysics, edited by Ruch TC, Patton HD.Philadelphia, PA: Saunders, 1965, p. 1–25.
Xin D, Bloomfield SA. Tracer coupling pattern of amacrine and ganglion cellsin the rabbit retina. J Comp Neurol 383: 512–528, 1997.
1374 J. F. FOHLMEISTER, E. D. COHEN, AND E. A. NEWMAN
J Neurophysiol • VOL 103 • MARCH 2010 • www.jn.org
on March 26, 2010
jn.physiology.orgD
ownloaded from