Embed Size (px)
Citation preview
Mechanisms for Tropical Tropospheric Circulation Changein Response to Global Warming*
JIAN MA
Department of Meteorology, University of Hawaii at Manoa, Honolulu, Hawaii
SHANG-PING XIE
Department of Meteorology, and International Pacific Research Center, School of Ocean and Earth Science and Technology,
University of Hawaii at Manoa, Honolulu, Hawaii
YU KOSAKA
International Pacific Research Center, School of Ocean and Earth Science and Technology,
University of Hawaii at Manoa, Honolulu, Hawaii
(Manuscript received 21 January 2011, in final form 3 August 2011)
ABSTRACT
The annual-mean tropospheric circulation change in global warming is studied by comparing the response
of an atmospheric general circulation model (GCM) to a spatial-uniform sea surface temperature (SST)
increase (SUSI) with the response of a coupled ocean–atmosphere GCM to increased greenhouse gas con-
centrations following the A1B scenario. In both simulations, tropospheric warming follows the moist adiabat
in the tropics, and static stability increases globally in response to SST warming. A diagnostic framework is
developed based on a linear baroclinic model (LBM) of the atmosphere. The mean advection of stratification
change (MASC) by climatological vertical motion, often neglected in interannual variability, is an important
thermodynamic term for global warming. Once MASC effect is included, LBM shows skills in reproducing
GCM results by prescribing latent heating diagnosed from the GCMs.
MASC acts to slow down the tropical circulation. This is most clear in the SUSI run where the Walker cir-
culation slows down over the Pacific without any change in SST gradient. MASC is used to decelerate the Hadley
circulation, but spatial patterns of SST warming play an important role. Specifically, the SST warming is greater in
the Northern than Southern Hemisphere, an interhemispheric asymmetry that decelerates the Hadley cell north,
but accelerates it south of the equator. The MASC and SST-pattern effects are on the same order of magnitude in
our LBM simulations. The former is presumably comparable across GCMs, while SST warming patterns show
variations among models in both shape and magnitude. Uncertainties in SST patterns account for intermodel
variability in Hadley circulation response to global warming (especially on and south of the equator).
1. Introduction
Large-scale atmospheric circulation is important for
moisture and energy transport, precipitation, tropical
cyclone (TC) development, and ocean–land–atmosphere
interactions. In the tropics, where the synoptic eddy
effects are weak, tropospheric circulation is primar-
ily generated by the uneven distribution of diabatic
heating/cooling (e.g., convective latent heating in con-
vergence zones). Climatologically, these forcing terms
are nearly in balance with vertical advection (e.g.,
Rodwell and Hoskins 1996). In global warming, verti-
cal advection and diabatic forcing would change, and
large-scale circulation has to alter accordingly to regain
the thermodynamic balance.
Reduction of tropical convective mass flux (Held and
Soden 2006) and weakening of the Walker circulation
* International Pacific Research Center Publication Number 830
and School of Ocean and Earth Science and Technology Publica-
tion Number 8519.
Corresponding author address: Jian Ma, Department of Meteo-
rology, SOEST, University of Hawaii at Manoa, Honolulu, HI
96822.
E-mail: [email protected]
15 APRIL 2012 M A E T A L . 2979
DOI: 10.1175/JCLI-D-11-00048.1
� 2012 American Meteorological Society
(Vecchi et al. 2006; Vecchi and Soden 2007a) are found
in the World Climate Research Programme’s (WCRP’s)
Coupled Model Intercomparison Project phase 3 (CMIP3)
multimodel dataset. Two complementary thermodynamic
constraints were proposed to explain the weakening of the
tropical circulation. One argument is based on the faster
increase in dry static stability than in subtropical radiative
cooling (Knutson and Manabe 1995), and the other on the
slower increase of global-mean precipitation than atmo-
spheric specific humidity (Held and Soden 2006), though
satellite-based microwave measurements question this
model result on change of the hydrological cycle (Wentz
et al. 2007). Neither constraint explains why the Walker
cell is preferably weakened rather than the Hadley cell.
Observations (Hu and Fu 2007) and general circulation
model (GCM) simulations (Lu et al. 2007; Frierson et al.
2007; Johanson and Fu 2009) show a robust poleward
expansion of the Hadley circulation. The intensity change
of the Hadley circulation, however, is not as robust as that
of the Walker cell (Vecchi and Soden 2007a). The dif-
ference in these two circulation responses has not been
thoroughly examined in the literature.
Currently, two paradigms exist for explaining tropical
rainfall change in global warming. One implicitly as-
sumes a spatially uniform sea surface temperature (SST)
increase (SUSI) and predicts rainfall to increase in the
core of existing rainy regions (‘‘wet get wetter’’), and to
decrease on their margins (called ‘‘upped ante’’) and in
current dry areas, based on an argument of intensified
moisture advection due to atmospheric warming (Chou
and Neelin 2004; Chou et al. 2009). The destabilizing
effects of increased low-level moisture were once sug-
gested to enhance tropical convection (Lindzen 1990),
but not supported by simulations with one-dimensional
radiative convective models (Betts and Ridgway 1989;
Betts 1998) and GCMs (Knutson and Manabe 1995;
Held and Soden 2006).
The other paradigm for rainfall change emphasizes
the effects of tropical SST patterns on convective re-
organization, as are apparent in instrumental observa-
tions, in particular in El Nino–Southern Oscillation
(ENSO; Alexander et al. 2002). Deviations of SST
warming from its tropical mean are suggested to play
the leading role for changes in TC activity (Vecchi and
Soden 2007b; Vecchi et al. 2008; Knutson et al. 2008),
precipitation (Xie et al. 2010; Johnson and Xie 2010),
and the Hadley circulation (Gastineau et al. 2009). This
‘‘warmer-get-wetter’’ view is based on the argument that
the upper-tropospheric warming is nearly spatially uni-
form in the tropics because of fast waves, so convective
instability is largely determined by spatial variations in
SST warming (Vecchi and Soden 2007b; Xie et al. 2010;
Johnson and Xie 2010).
The SST warming in CMIP3 simulations features an
equatorial peak (Liu et al. 2005; Xie et al. 2010), which is
often characterized as El Nino–like. However, the zonal
mean tropospheric warming patterns, changes in zonal
wind shear, and Hadley cell are all quite different from
El Nino (Lu et al. 2008). This appears to be due to the
difference in the tropical mean SST warming relative to
the spatial patterns between El Nino and global warm-
ing. In a 10-member ensemble simulation with the Na-
tional Oceanic and Atmospheric Administration (NOAA)
Geophysical Fluid Dynamics Laboratory (GFDL) Cli-
mate Model, version 2.1 (CM2.1) for 1996–2050 under
the Special Report on Emissions Scenarios (SRES) A1B
(Xie et al. 2010), the tropical (208S–208N) mean SST
warming is 1.12 K with a spatial standard deviation of
0.21 K (19% of the tropical mean). By contrast, El Nino
events in the same model feature an SST standard deviation
of 0.76 K, 140% of the tropical mean warming of 0.55 K
(not shown). Thus, ENSO is dominated by SST patterns,
while global warming is dominated by the tropical mean.
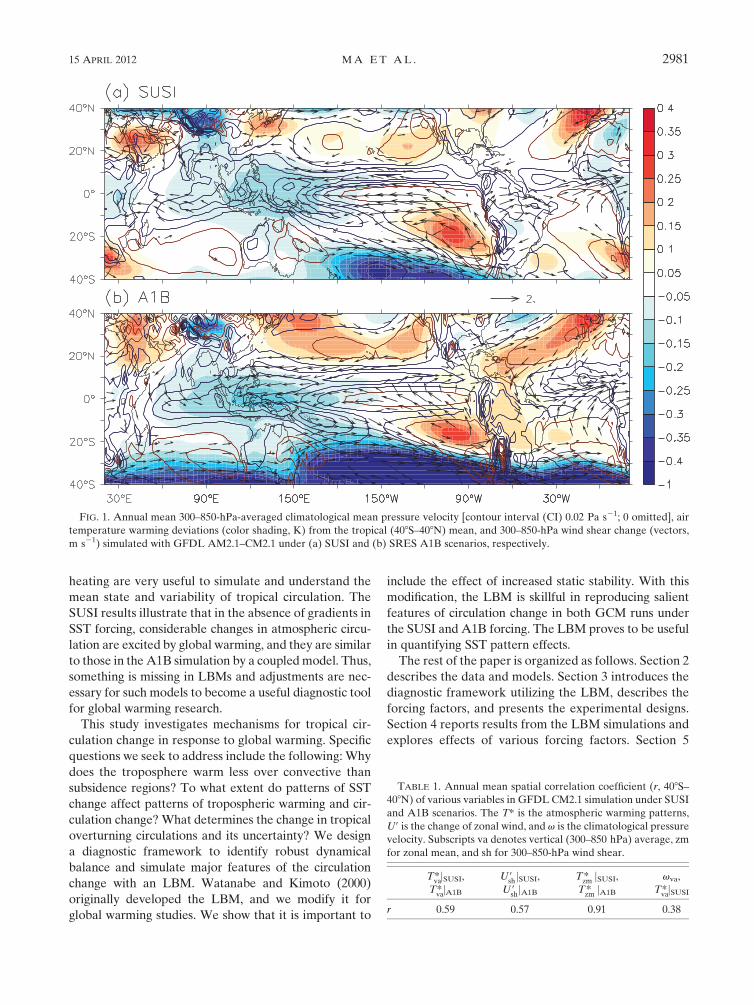
Figure 1 illustrates the relative importance of tropical
mean SST warming versus its patterns for tropospheric
circulation change by comparing the annual mean re-
sults of the GFDL CM2.1 A1B simulation with its At-
mospheric Model, version 2.1 (AM2.1) forced by a SUSI
of 2 K. Tropospheric warming patterns, defined as de-
viations from the tropical mean, are similar between
two runs, with a spatial correlation coefficient (r) of 0.59
(Table 1). Both cases feature maxima in the subtropics
and a minimum in the Indo-Pacific warm pool that ex-
tends to the intertropical convergence zone (ITCZ) and
the South Pacific convergence zone (SPCZ). Fu et al.
(2006) showed the enhanced subtropical warming from
satellite observations and suggested that it pushes the
tropospheric jet streams poleward, contributing to the
Hadley cell expansion. The zonal mean warming patterns
(Fig. 2) are very similar between SUSI and A1B (r 5
0.91), both featuring an elevated maximum warming at
300 hPa, a result of moist adiabatic adjustment (Knutson
and Manabe 1995). In thermal-wind balance with tem-
perature, the 300–850-hPa wind shear decreases with
anomalous easterly shear in the tropical Pacific (Fig. 1).
The shear response is similar between SUSI and A1B
(r 5 0.57 for zonal wind shear).
Apparent differences from the SUSI run include the
development of meridional asymmetry in the A1B run
over the eastern tropical Pacific (Figs. 1b and 2b), with
southerly cross-equatorial wind shear. Besides, wind
shear changes in the tropical Indian Ocean are opposite
between the two runs. These differences are primarily
induced by SST patterns.
Linear baroclinic models (LBMs) of Matsuno (1966)
and Gill (1980) forced with SST-induced diabatic
2980 J O U R N A L O F C L I M A T E VOLUME 25
heating are very useful to simulate and understand the
mean state and variability of tropical circulation. The
SUSI results illustrate that in the absence of gradients in
SST forcing, considerable changes in atmospheric circu-
lation are excited by global warming, and they are similar
to those in the A1B simulation by a coupled model. Thus,
something is missing in LBMs and adjustments are nec-
essary for such models to become a useful diagnostic tool
for global warming research.
This study investigates mechanisms for tropical cir-
culation change in response to global warming. Specific
questions we seek to address include the following: Why
does the troposphere warm less over convective than
subsidence regions? To what extent do patterns of SST
change affect patterns of tropospheric warming and cir-
culation change? What determines the change in tropical
overturning circulations and its uncertainty? We design
a diagnostic framework to identify robust dynamical
balance and simulate major features of the circulation
change with an LBM. Watanabe and Kimoto (2000)
originally developed the LBM, and we modify it for
global warming studies. We show that it is important to
include the effect of increased static stability. With this
modification, the LBM is skillful in reproducing salient
features of circulation change in both GCM runs under
the SUSI and A1B forcing. The LBM proves to be useful
in quantifying SST pattern effects.
The rest of the paper is organized as follows. Section 2
describes the data and models. Section 3 introduces the
diagnostic framework utilizing the LBM, describes the
forcing factors, and presents the experimental designs.
Section 4 reports results from the LBM simulations and
explores effects of various forcing factors. Section 5
TABLE 1. Annual mean spatial correlation coefficient (r, 408S–
408N) of various variables in GFDL CM2.1 simulation under SUSI
and A1B scenarios. The T* is the atmospheric warming patterns,
U9 is the change of zonal wind, and v is the climatological pressure
velocity. Subscripts va denotes vertical (300–850 hPa) average, zm
for zonal mean, and sh for 300–850-hPa wind shear.
Tva*jSUSI,
Tva*jA1B
U9shjSUSI,
U9shjA1B
Tzm* jSUSI,
Tzm* jA1B
vva,
Tva*jSUSI
r 0.59 0.57 0.91 0.38
FIG. 1. Annual mean 300–850-hPa-averaged climatological mean pressure velocity [contour interval (CI) 0.02 Pa s21; 0 omitted], air
temperature warming deviations (color shading, K) from the tropical (408S–408N) mean, and 300–850-hPa wind shear change (vectors,
m s21) simulated with GFDL AM2.1–CM2.1 under (a) SUSI and (b) SRES A1B scenarios, respectively.
15 APRIL 2012 M A E T A L . 2981
focuses on the overturning circulations and section 6
presents the conclusions with a discussion.
2. Data and models
a. GCMs
We diagnose the forcing terms from global warming
simulations by NOAA GFDL models under SUSI and
A1B scenarios. The CM2.1 uses the Flexible Modeling
System to couple the GFDL AM2.1 with the Modular
Ocean Model version 4. The AM2.1 builds on a finite-
volume atmospheric dynamical core and includes at-
mospheric physical packages and a land surface model.
Its resolution is 28 latitude 3 2.58 longitude with 24
vertical levels, 9 of which are located in the lowest
1.5 km to represent the planetary boundary layer. The
ocean model uses a finite-difference approach to solve
the primitive equations. The resolution is 18 longitude by
18 latitude, with meridional grid spacing decreasing
to 1/38 toward the equator. The model has 50 vertical
levels, 22 of which are in the upper 220 m. A detailed
description of CM2.1 can be found in GFDL Global
Atmospheric Model Development Team (2004) and
Delworth et al. (2006). Long integrations (;2000 yr)
have been performed under current climate forcing with-
out flux correction, reaching statistically steady states
similar to observations, including the annual-mean state,
seasonal cycle, and major modes of interannual vari-
ability (Wittenberg et al. 2006).
The SUSI experiment was performed with AM2.1 for
the period of 1983–91, by adding a uniform SST increase
of 2 K. Another set of doubling CO2 experiments by
AM2.1 during 1981–2000 is also used to isolate the atmo-
spheric response to radiative forcing (noted as RAD). Both
of the SUSI and RAD experiments employ interannual-
variable monthly mean observed SST.
The SRES A1B scenario for the emission of climati-
cally important trace gases (e.g., carbon dioxide and
ozone) is based on certain socioeconomic development
paths for the twenty-first century. It roughly projects
a doubling of atmospheric CO2 in 2100 from the pre-
industrial level, with a recovery of the Southern Hemi-
sphere ‘‘ozone hole’’ approximately by 2050. For this
scenario, a 10-member ensemble simulation has been
completed at GFDL with CM2.1 from 1996 to 2050,
during which CO2 concentration increases from 369
to 532 ppm. We analyze ensemble-mean, 50-yr dif-
ference fields: 2046–50 minus 1996–2000. The use of
ensemble means helps reduce natural variability and
isolate the response to the greenhouse gas (GHG) in-
crease. The annual-mean SST rise averaged in the tropics
(208S–208N) is 1.12 K in CM2.1.
To explore the differences among models, in partic-
ular those in the Hadley circulation change influenced
by SST patterns, we perform intermodel singular value
decomposition (SVD) analyses with 23 CMIP3 GCMs
under the A1B scenario, except the Meteorological In-
stitute of the University of Bonn, ECHO-G Model
(MIUB ECHOG) for which tropospheric wind data are
unavailable. (Details of the models can be found at http://
www-pcmdi.llnl.gov/ipcc/model_documentation/ipcc_
model_documentation.php, and the output at https://
esg.llnl.gov:8443/index.jsp.) Only one realization is used
for each model (including the GFDL CM2.1). Because
internal variability could be strong in each realization,
changes are computed for the twenty-first century be-
tween two 10-yr periods: 2001–10 and 2091–2100, to ex-
tract robust anthropogenic global warming signals.
All changes in this study are normalized by the trop-
ical mean SST warming (208S–208N) in each model
before the computation of ensemble means or SVD
analyses, except for the RAD run whose results are scaled
by dlnCO2j2100/dlnCO2j2050 5 1:91, since CO2 radiative forc-
ing is proportional to the logarithm of its concentration,
and then by the tropical mean SST warming of CM A1B
(1.12 K).
b. LBM
This study adopts an LBM to study mechanisms for
circulation change. It is the dry version of a global,
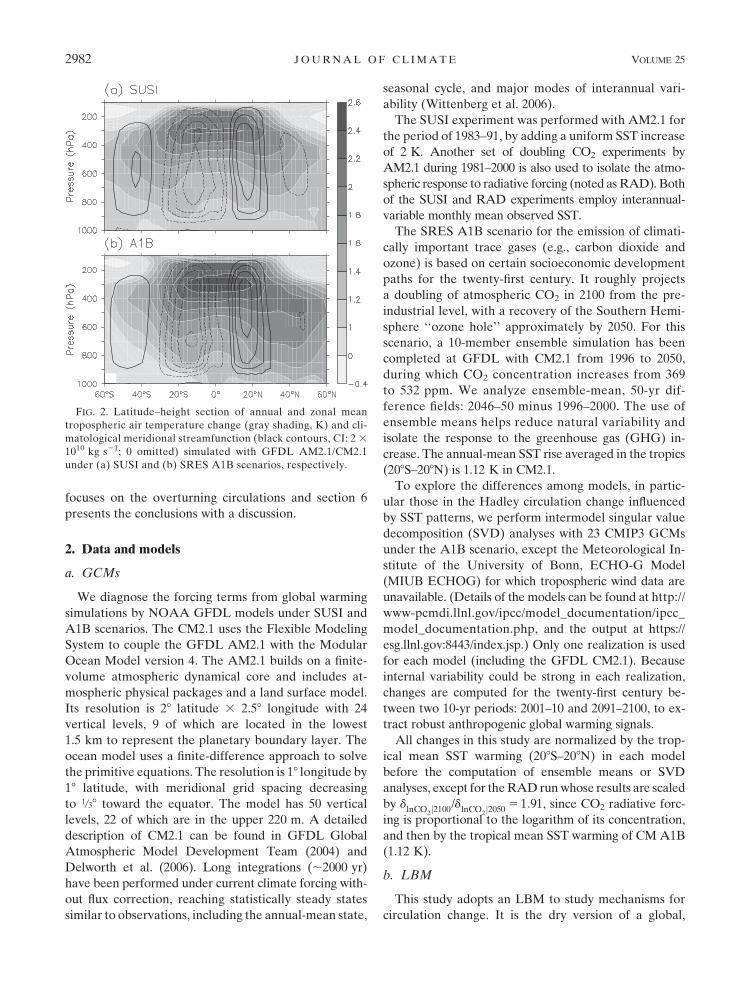
FIG. 2. Latitude–height section of annual and zonal mean
tropospheric air temperature change (gray shading, K) and cli-
matological meridional streamfunction (black contours, CI: 2 3
1010 kg s21; 0 omitted) simulated with GFDL AM2.1/CM2.1
under (a) SUSI and (b) SRES A1B scenarios, respectively.
2982 J O U R N A L O F C L I M A T E VOLUME 25
time-dependent, primitive equation atmospheric model
based on a set of linearized equations for vorticity, di-
vergence, temperature, and the logarithm of surface
pressure (Watanabe and Kimoto 2000; Watanabe and
Jin 2004). The model variables are expressed horizon-
tally in the spherical harmonics at T42 while finite dif-
ference is used for the vertical discretization with 20s
levels. The model includes biharmonic horizontal dif-
fusion with an e-folding time of 3 h for the highest
wavenumber. It also employs Rayleigh friction and
Newtonian cooling, whose e-folding time scales are set
to be 20 days in most of the free troposphere, but 0.5 and
1 day for the 3 lowest (s . 0.9) and 2 uppermost (s ,
0.03) levels, respectively.
LBM is widely used to study atmospheric variability,
but its utility for global warming research has not been
investigated. We adapt the LBM for the latter purpose
by a reformulation that accounts for the effect of global
increase in static stability (Fig. 2).
3. Diagnostic framework with LBM
a. LBM for global warming studies
LBM is a powerful tool to relate circulation change to
the geographical distribution of diabatic heating. In this
section, we develop a diagnostic framework that em-
ploys the LBM with necessary modifications, to identify
robust dynamical balance and simulate major features of
circulation change. An equation for global warming pat-
tern formation is derived from the approximate ther-
modynamic equation of the atmospheric temperature
change:
›T9
›t1 Bv9
›u
›p1 Bv
›u9
›p5 LH 1 SH 1 QR
QR 5 SW 1 LWC 1 LWF 2 LWR(T9)
,
8<: (1)
where the overbar and prime denote the mean and
change terms, respectively. Here T is air temperature,
u is potential temperature, p is pressure, B 5 T/u 5
(p/pS)R/c
p , where pS is surface pressure, R is the gas
constant for air, and cp is the specific heat at constant
pressure. As we are interested in changes in time mean
fields, ›T9/›t may be omitted. The diabatic forcing in-
cludes latent heating (LH), sensible heating (SH) from
vertical diffusion, and radiation (QR). The QR is com-
posed of forcing in short wave (SW), long wave (LW)
from cloud (LWC) and clear-sky GHG (LWF), and
feedback [LWR(T9)]. LWR(T9) is largely due to clear-
sky LW change in direct response to atmospheric warm-
ing, and is parameterized as the Newtonian damping
(«T9) in the LBM.
We denote the global average as hxi, the spatial pat-
terns as x* 5 x 2 hxi and x* 5 x9 2 hx9i for the mean and
change fields, respectively. After the global average,
Eq. (1) becomes
B v9›u
›p
� �1 B v
›u9
›p
� �5 hLHi1 hSHi1 hQRi.
Because of the global mass conservation, that is, hvi5 0
and hv9i5 0,
v9›u
›p
� �5
�v9
›u*
›p
�, and v
›u9
›p
� �5 v
›u*
›p
� �.
Hence,
B v9›u*
›p
� �1 B v
›u*
›p
� �5 hLHi 1 hSHi 1 hQRi, (2)
where the last two terms on the left-hand side represent
the contributions of spatial patterns to the global-mean
change.
By subtracting Eq. (2) from Eq. (1), one can derive the
equation for pattern formation:
B v9›u
›p2 v9
›u*
›p
� ��1Bv
›u*
›p1 B v
›hu9i›p
2 v›u*
›p
� ��� �
5 LH* 1 SH* 1 QR*.
Consistent with the ‘‘weak temperature gradient’’ ap-
proximation (Bretherton and Sobel 2003), the horizontal
variations of potential temperature are much less than the
tropical mean (Fig. 2): ›u*/›p� ›u/›p and ›u*/›p�›hu9i/›p. Therefore, one can simplify the above equation
into
Bv›u*
›p1 Bv9
›u
›p5 2Bv
›hu9i›p
1 LH* 1 SH* 1 QR*.
(3)
Equation (3) forms a diagnostic framework that solves
the regional response to imposed heating patterns in
global warming. This framework defines terms solvable
with the LBM as the response and places them on the
left-hand side. They include the warming patterns (u*)
and circulation change (vertical motion, v9). The im-
posed forcing terms are arranged on the right-hand side.
Our major modification of the LBM is to treat
2Bv(›hu9i/›p) as a forcing term. As an effect of the
global-mean warming on pattern formation, it represents
the mean advection of stratification change (MASC). It is
part of atmospheric response in full GCMs. The MASC
15 APRIL 2012 M A E T A L . 2983
effect is important for circulation change, as illustrated in
Fig. 3 and the following sections.
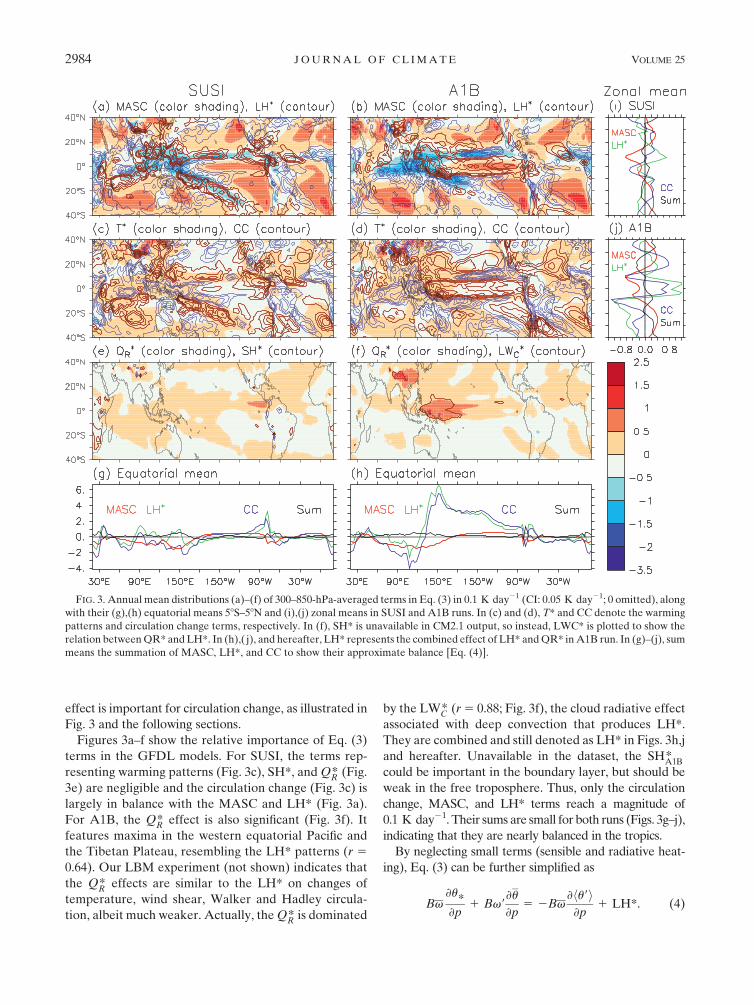
Figures 3a–f show the relative importance of Eq. (3)
terms in the GFDL models. For SUSI, the terms rep-
resenting warming patterns (Fig. 3c), SH*, and QR* (Fig.
3e) are negligible and the circulation change (Fig. 3c) is
largely in balance with the MASC and LH* (Fig. 3a).
For A1B, the QR* effect is also significant (Fig. 3f). It
features maxima in the western equatorial Pacific and
the Tibetan Plateau, resembling the LH* patterns (r 5
0.64). Our LBM experiment (not shown) indicates that
the QR* effects are similar to the LH* on changes of
temperature, wind shear, Walker and Hadley circula-
tion, albeit much weaker. Actually, the QR* is dominated
by the LWC* (r 5 0.88; Fig. 3f), the cloud radiative effect
associated with deep convection that produces LH*.
They are combined and still denoted as LH* in Figs. 3h,j
and hereafter. Unavailable in the dataset, the SHA1B*
could be important in the boundary layer, but should be
weak in the free troposphere. Thus, only the circulation
change, MASC, and LH* terms reach a magnitude of
0.1 K day21. Their sums are small for both runs (Figs. 3g–j),
indicating that they are nearly balanced in the tropics.
By neglecting small terms (sensible and radiative heat-
ing), Eq. (3) can be further simplified as
Bv›u*›p
1 Bv9›u
›p5 2Bv
›hu9i›p
1 LH*. (4)
FIG. 3. Annual mean distributions (a)–(f) of 300–850-hPa-averaged terms in Eq. (3) in 0.1 K day21 (CI: 0.05 K day21; 0 omitted), along
with their (g),(h) equatorial means 58S–58N and (i),(j) zonal means in SUSI and A1B runs. In (c) and (d), T* and CC denote the warming
patterns and circulation change terms, respectively. In (f), SH* is unavailable in CM2.1 output, so instead, LWC* is plotted to show the
relation between QR* and LH*. In (h),( j), and hereafter, LH* represents the combined effect of LH* and QR* in A1B run. In (g)–(j), sum
means the summation of MASC, LH*, and CC to show their approximate balance [Eq. (4)].
2984 J O U R N A L O F C L I M A T E VOLUME 25
By imposing MASC and LH* diagnosed from the GCM
output, LBM solves for both temperature patterns and
circulation change including vertical motion.
b. MASC mechanism
Model simulations suggest that tropical tropospheric
warming follows the moist adiabat in the vertical (Fig. 2),
resulting in an increase in dry static stability 2›hui/›p.
With this upward-increasing atmospheric warming, the
MASC mechanism refers to the cold/warm advection in
climatological convective/subsidence regions. It is much
smaller than Bv(›u*/›p) [Eq. (3)] for interannual vari-
ability, but is of great importance for global warming.
This difference is caused by the fact that O(SST*/
hSST9i)� 1 for the former but O(SST*/hSST9i) , 1 for
the latter.
The meridional structure of tropospheric warming in
Fig. 2 suggests the importance of the MASC effect.
In the midtroposphere (e.g., 600 hPa) in the subtropics
(208–308), the enhanced warming is anchored by the cli-
matological subsidence, while the reduced warming over
the equator by the mean upward motion. This feature is
quite robust among CMIP3 models (see Fig. S2 of Lu
et al. 2007). Similar collocations of the minimum in mid-
tropospheric warming with convection and the maxi-
mum with subsidence centers can also be found in Fig. 1.
Correlations between the annual mean warming patterns
and climatological pressure velocity are 0.38 (Table 1).
This correlation is moderate since the LH* also affects
the tropospheric warming patterns.
c. Forcing distributions
Besides LH*, MASC is a major forcing mechanism for
the circulation response to global warming in the LBM
[Eq. (4)]. Here we discuss the annual-mean tropical
distributions of both terms in SUSI (Fig. 3a) and A1B
(Fig. 3b) runs. The MASC follows the patterns of cli-
matological vertical motion, which is similar but slightly
different between the two runs, due to SST biases of the
coupled model (A1B) compared to observations (SUSI;
e.g., the double ITCZ bias; de Szoeke and Xie 2008). In
both SUSI and A1B, T* features negative centers in the
Indo-Pacific warm pool that extend to the ITCZ and
SPCZ, and positive centers over subsidence regions
(Fig. 1).
The LH* distributions resemble the precipitation
patterns and are quite different between the SUSI and
A1B because of SST patterns in A1B (Xie et al. 2010).
In the SUSI case, it is roughly opposite to the MASC
(r 5 20.39). This is not coincident since the LHSUSI* warms
the convective region, representing the wet-get-wetter
pattern of rainfall change, while the MASC cools the
convective region by definition. The so-called upped-ante
mechanism calls for reduced rainfall on the boundary
between the warm pool and the equatorial cold tongue
(Chou and Neelin 2004; Chou et al. 2009), reinforcing
the MASC effect. Following rainfall patterns (Xie et al.
2010), the LHA1B* distribution features a maximum on
the equator with a peak in the western Pacific. The
heating is greater in the Northern than the Southern
Hemisphere. It is worth mentioning that with SST pat-
terns, spatial variability in LH* (precipitation) is greater
in magnitude than in SUSI, especially clear in the equa-
torial and zonal means (Figs. 3g–j).
The equatorial forcing (Figs. 3g,h) is important for the
Walker circulation change. Both the MASC and LHSUSI*
(Fig. 3g) weaken the Pacific Walker cell, the latter due to
the above-mentioned upped-ante mechanism. However,
LHA1B* (Fig. 3h) tends to accelerate the circulation, es-
pecially in the eastern Pacific, with a maximum effect at
1408W.
The zonal mean forcing is important for the Hadley
circulation changes. The MASC tends to weaken the
Hadley circulation (Fig. 3i) by definition, cooling/
warming for upward/downward motions. By contrast,
LHSUSI* accelerates the Hadley cell, consistent with the
theory of Lindzen (1990). The MASC and LHSUSI* al-
most balance each other in the deep tropics (r 5 20.77),
but the MASC is slightly greater in the subtropics. The
zonal mean LHA1B* (Fig. 3j) is strongly influenced by SST
patterns, especially the equatorial warming peak and the
interhemispheric asymmetry with a greater SST increase
north than south of the equator. The LHA1B* has a neg-
ative correlation (r 5 20.55) with the MASC effect, but
it is weaker than LHSUSI* .
d. Experimental designs
In Eq. (4), MASC and LH* are prescribed in the LBM
as follows:
SUSI: MASC 1 LHSUSI* , and (5)
A1B: MASC 1 LHA1B* 5 MASC 1 LHSUSI
*
1 LHRAD* 1 LHSST
* . (6)
Annual-mean MASC and LH* are diagnosed from the
SUSI and A1B runs. For the A1B run, LH* is further
decomposed into components due to radiative forcing,
SUSI, and SST patterns, as detailed in Table 2. By def-
inition, MASC is likely to be similar among different
models with some variations in model climatology. The
latent heating term, and its subcomponents may differ
substantially among models. See Xie et al. (2010) for
a comparison between models developed at GFDL and
the National Center of Atmospheric Research (NCAR).
15 APRIL 2012 M A E T A L . 2985
We linearize the LBM around the annual mean cli-
matology of AM2.1 during 1983–91 for the SUSI-related
experiments, and that of CM2.1 during 1996–2005 for
the A1B ones. We integrate the model for 60 days to
equilibrium. Since the LBM does not represent the
synoptic eddy–mean flow interaction properly, we re-
strict the thermodynamic forcing in 408S–408N.
4. General survey of tropospheric temperature andwind shear changes
This section presents the LBM response to individual
and combined forcing factors in Eqs. (5) and (6) and
compares the results with the GCMs. Besides the tro-
pospheric warming patterns, the vertical wind shear
changes are examined in both vector and magnitude of
absolute zonal wind shear (jU300 2 U850j) change.
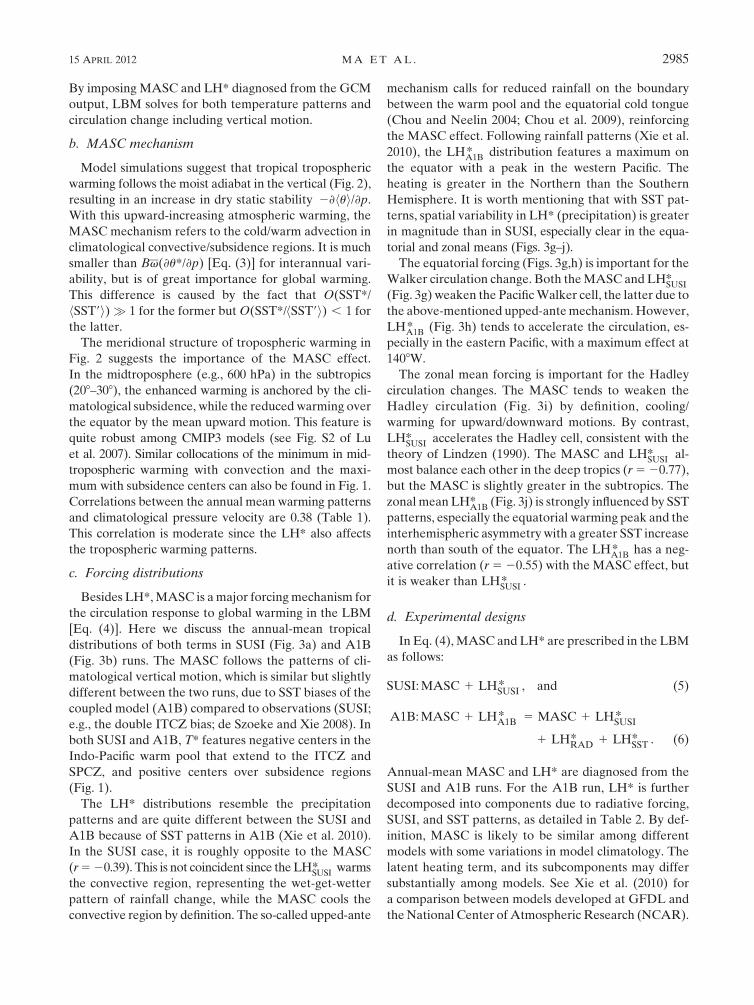
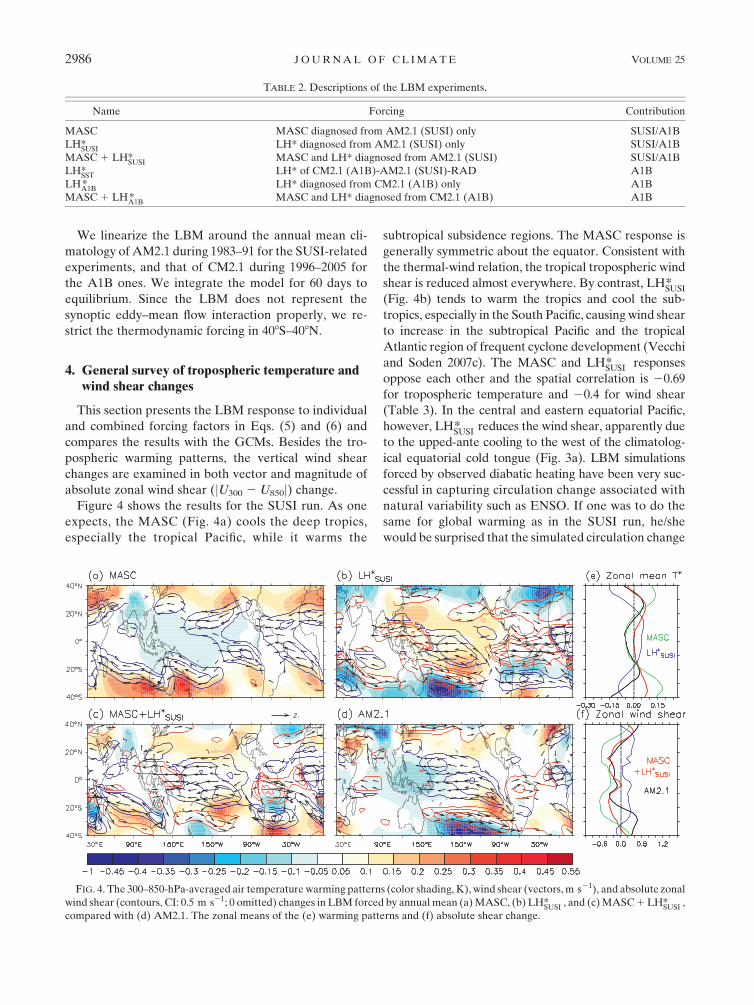
Figure 4 shows the results for the SUSI run. As one
expects, the MASC (Fig. 4a) cools the deep tropics,
especially the tropical Pacific, while it warms the
subtropical subsidence regions. The MASC response is
generally symmetric about the equator. Consistent with
the thermal-wind relation, the tropical tropospheric wind
shear is reduced almost everywhere. By contrast, LHSUSI*
(Fig. 4b) tends to warm the tropics and cool the sub-
tropics, especially in the South Pacific, causing wind shear
to increase in the subtropical Pacific and the tropical
Atlantic region of frequent cyclone development (Vecchi
and Soden 2007c). The MASC and LHSUSI* responses
oppose each other and the spatial correlation is 20.69
for tropospheric temperature and 20.4 for wind shear
(Table 3). In the central and eastern equatorial Pacific,
however, LHSUSI* reduces the wind shear, apparently due
to the upped-ante cooling to the west of the climatolog-
ical equatorial cold tongue (Fig. 3a). LBM simulations
forced by observed diabatic heating have been very suc-
cessful in capturing circulation change associated with
natural variability such as ENSO. If one was to do the
same for global warming as in the SUSI run, he/she
would be surprised that the simulated circulation change
TABLE 2. Descriptions of the LBM experiments.
Name Forcing Contribution
MASC MASC diagnosed from AM2.1 (SUSI) only SUSI/A1B
LHSUSI* LH* diagnosed from AM2.1 (SUSI) only SUSI/A1B
MASC 1 LHSUSI* MASC and LH* diagnosed from AM2.1 (SUSI) SUSI/A1B
LHSST* LH* of CM2.1 (A1B)-AM2.1 (SUSI)-RAD A1B
LHA1B* LH* diagnosed from CM2.1 (A1B) only A1B
MASC 1 LHA1B* MASC and LH* diagnosed from CM2.1 (A1B) A1B
FIG. 4. The 300–850-hPa-averaged air temperature warming patterns (color shading, K), wind shear (vectors, m s21), and absolute zonal
wind shear (contours, CI: 0.5 m s21; 0 omitted) changes in LBM forced by annual mean (a) MASC, (b) LHSUSI* , and (c) MASC 1 LH
SUSI* ,
compared with (d) AM2.1. The zonal means of the (e) warming patterns and (f) absolute shear change.
2986 J O U R N A L O F C L I M A T E VOLUME 25
is almost opposite to the GCM results. This illustrates
the importance of MASC.
The combined MASC and LHSUSI* response (Fig. 4c)
resembles the AM2.1 (SUSI) results (Fig. 4d), with spa-
tial correlation for tropospheric temperature/wind shear
changes at r 5 0.34–0.64. This illustrates the skills of LBM
in simulating the circulation response to global warming.
The magnitude of LBM results is slightly weaker than
that of AM2.1, possibly due to the arbitrarily set damping
and horizontal diffusion. The tropospheric cooling in the
midlatitude South Pacific is not strong enough in the
LBM, possibly related to eddy effects. The peaks of
subtropical warming by LHSUSI* (Fig. 4b) are slightly
shifted to lower latitudes than in AM2.1 (Fig. 4d), and the
MASC (Fig. 4a) helps to adjust them to the right positions
(Fig. 4c). The cooling over the Tibetan Plateau is due to
the MASC (Figs. 4a,c,d) associated with orographic
convection anchored by the Himalayas and advected by
the westerly jet stream. The tropical Pacific wind shear is
generally reduced (Figs. 4c,d), with the contributions
from LHSUSI* in the central Pacific basin (Fig. 4b) and
from MASC effect in the subtropics (Fig. 4a).
The zonal means better illustrate the importance of
MASC. The MASC and LHSUSI* effects (Fig. 4e) are
both symmetric about the equator, and oppose each
other (r 5 20.85). Their combined (MASC 1 LHSUSI* )
effect follows the MASC response, and resembles the
AM2.1 results (r 5 0.53) to the north of 208S. For the
wind shear change (Fig. 4f), the MASC effect again
opposes the LHSUSI* effect, with r 5 20.66 (Table 3).
Primarily following the shape of MASC, the total effect
weakens the tropical wind shear, resembling the AM2.1
results (r 5 0.69). It is noteworthy that the MASC ef-
fects flip sign at around 308S and 308N (Fig. 4f), where
the climatological wind shear/meridional temperature
gradients are strongest. This is equivalent to a poleward
shift of the jet streams–expansion of the Hadley cell,
consistent with the argument of Fu et al. (2006).
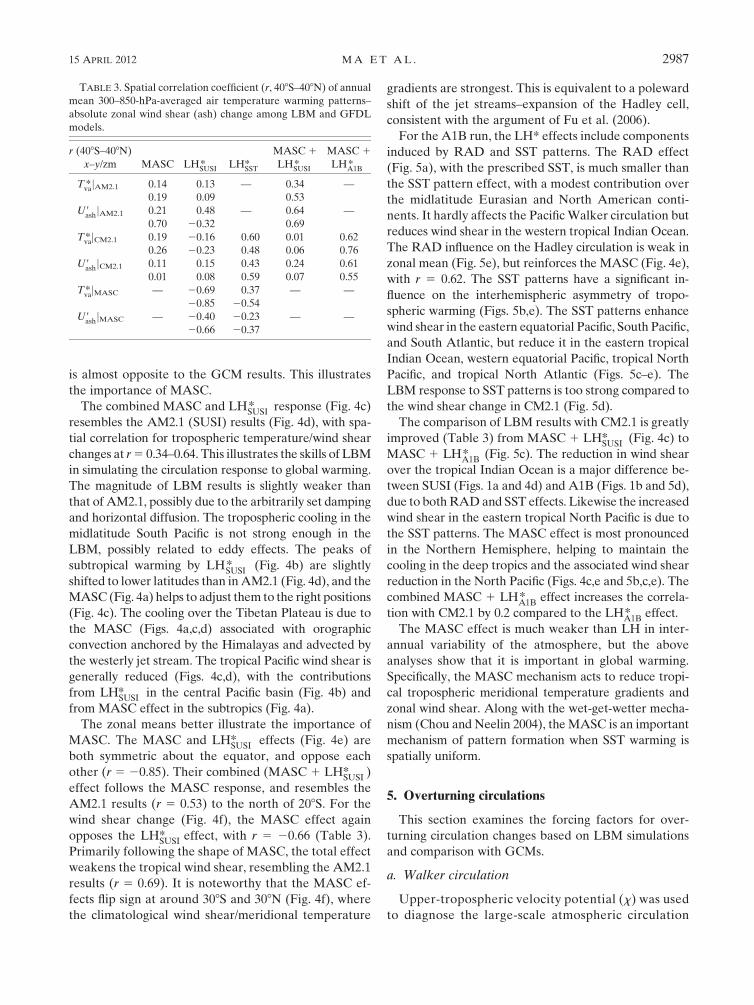
For the A1B run, the LH* effects include components
induced by RAD and SST patterns. The RAD effect
(Fig. 5a), with the prescribed SST, is much smaller than
the SST pattern effect, with a modest contribution over
the midlatitude Eurasian and North American conti-
nents. It hardly affects the Pacific Walker circulation but
reduces wind shear in the western tropical Indian Ocean.
The RAD influence on the Hadley circulation is weak in
zonal mean (Fig. 5e), but reinforces the MASC (Fig. 4e),
with r 5 0.62. The SST patterns have a significant in-
fluence on the interhemispheric asymmetry of tropo-
spheric warming (Figs. 5b,e). The SST patterns enhance
wind shear in the eastern equatorial Pacific, South Pacific,
and South Atlantic, but reduce it in the eastern tropical
Indian Ocean, western equatorial Pacific, tropical North
Pacific, and tropical North Atlantic (Figs. 5c–e). The
LBM response to SST patterns is too strong compared to
the wind shear change in CM2.1 (Fig. 5d).
The comparison of LBM results with CM2.1 is greatly
improved (Table 3) from MASC 1 LHSUSI* (Fig. 4c) to
MASC 1 LHA1B* (Fig. 5c). The reduction in wind shear
over the tropical Indian Ocean is a major difference be-
tween SUSI (Figs. 1a and 4d) and A1B (Figs. 1b and 5d),
due to both RAD and SST effects. Likewise the increased
wind shear in the eastern tropical North Pacific is due to
the SST patterns. The MASC effect is most pronounced
in the Northern Hemisphere, helping to maintain the
cooling in the deep tropics and the associated wind shear
reduction in the North Pacific (Figs. 4c,e and 5b,c,e). The
combined MASC 1 LHA1B* effect increases the correla-
tion with CM2.1 by 0.2 compared to the LHA1B* effect.
The MASC effect is much weaker than LH in inter-
annual variability of the atmosphere, but the above
analyses show that it is important in global warming.
Specifically, the MASC mechanism acts to reduce tropi-
cal tropospheric meridional temperature gradients and
zonal wind shear. Along with the wet-get-wetter mecha-
nism (Chou and Neelin 2004), the MASC is an important
mechanism of pattern formation when SST warming is
spatially uniform.
5. Overturning circulations
This section examines the forcing factors for over-
turning circulation changes based on LBM simulations
and comparison with GCMs.
a. Walker circulation
Upper-tropospheric velocity potential (x) was used
to diagnose the large-scale atmospheric circulation
TABLE 3. Spatial correlation coefficient (r, 408S–408N) of annual
mean 300–850-hPa-averaged air temperature warming patterns–
absolute zonal wind shear (ash) change among LBM and GFDL
models.
r (408S–408N)
x–y/zm MASC LHSUSI* LHSST
*MASC 1
LHSUSI*
MASC 1
LHA1B*
Tva*jAM2.1 0.14 0.13 — 0.34 —
0.19 0.09 0.53
U9ashjAM2.1 0.21 0.48 — 0.64 —
0.70 20.32 0.69
Tva*jCM2.1 0.19 20.16 0.60 0.01 0.62
0.26 20.23 0.48 0.06 0.76
U9ashjCM2.1 0.11 0.15 0.43 0.24 0.61
0.01 0.08 0.59 0.07 0.55
Tva*jMASC — 20.69 0.37 — —
20.85 20.54
U9ashjMASC — 20.40 20.23 — —
20.66 20.37
15 APRIL 2012 M A E T A L . 2987
(Gastineau et al. 2009). We calculate x at the 250-hPa
level to characterize the change of the Walker circulation,
by solving the following Poisson equation on the globe
(Tanaka et al. 2004):
$ �V 5 2Dx,
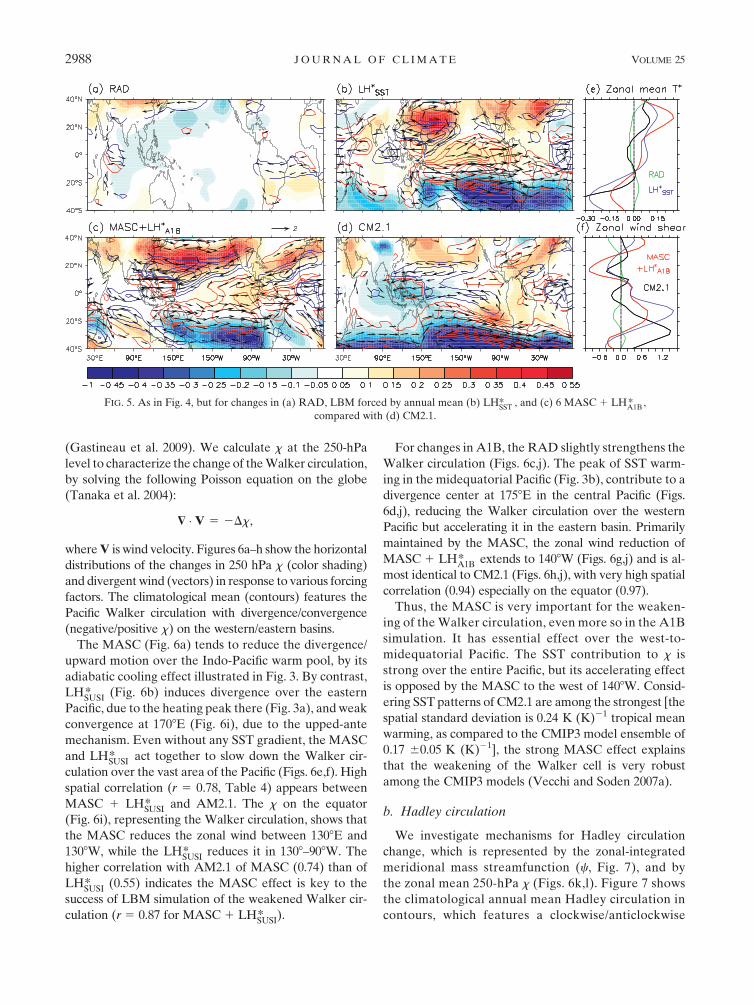
where V is wind velocity. Figures 6a–h show the horizontal
distributions of the changes in 250 hPa x (color shading)
and divergent wind (vectors) in response to various forcing
factors. The climatological mean (contours) features the
Pacific Walker circulation with divergence/convergence
(negative/positive x) on the western/eastern basins.
The MASC (Fig. 6a) tends to reduce the divergence/
upward motion over the Indo-Pacific warm pool, by its
adiabatic cooling effect illustrated in Fig. 3. By contrast,
LHSUSI* (Fig. 6b) induces divergence over the eastern
Pacific, due to the heating peak there (Fig. 3a), and weak
convergence at 1708E (Fig. 6i), due to the upped-ante
mechanism. Even without any SST gradient, the MASC
and LHSUSI* act together to slow down the Walker cir-
culation over the vast area of the Pacific (Figs. 6e,f). High
spatial correlation (r 5 0.78, Table 4) appears between
MASC 1 LHSUSI* and AM2.1. The x on the equator
(Fig. 6i), representing the Walker circulation, shows that
the MASC reduces the zonal wind between 1308E and
1308W, while the LHSUSI* reduces it in 1308–908W. The
higher correlation with AM2.1 of MASC (0.74) than of
LHSUSI* (0.55) indicates the MASC effect is key to the
success of LBM simulation of the weakened Walker cir-
culation (r 5 0.87 for MASC 1 LHSUSI* ).
For changes in A1B, the RAD slightly strengthens the
Walker circulation (Figs. 6c,j). The peak of SST warm-
ing in the midequatorial Pacific (Fig. 3b), contribute to a
divergence center at 1758E in the central Pacific (Figs.
6d,j), reducing the Walker circulation over the western
Pacific but accelerating it in the eastern basin. Primarily
maintained by the MASC, the zonal wind reduction of
MASC 1 LHA1B* extends to 1408W (Figs. 6g,j) and is al-
most identical to CM2.1 (Figs. 6h,j), with very high spatial
correlation (0.94) especially on the equator (0.97).
Thus, the MASC is very important for the weaken-
ing of the Walker circulation, even more so in the A1B
simulation. It has essential effect over the west-to-
midequatorial Pacific. The SST contribution to x is
strong over the entire Pacific, but its accelerating effect
is opposed by the MASC to the west of 1408W. Consid-
ering SST patterns of CM2.1 are among the strongest [the
spatial standard deviation is 0.24 K (K)21 tropical mean
warming, as compared to the CMIP3 model ensemble of
0.17 60.05 K (K)21], the strong MASC effect explains
that the weakening of the Walker cell is very robust
among the CMIP3 models (Vecchi and Soden 2007a).
b. Hadley circulation
We investigate mechanisms for Hadley circulation
change, which is represented by the zonal-integrated
meridional mass streamfunction (c, Fig. 7), and by
the zonal mean 250-hPa x (Figs. 6k,l). Figure 7 shows
the climatological annual mean Hadley circulation in
contours, which features a clockwise/anticlockwise
FIG. 5. As in Fig. 4, but for changes in (a) RAD, LBM forced by annual mean (b) LHSST* , and (c) 6 MASC 1 LH
A1B* ,
compared with (d) CM2.1.
2988 J O U R N A L O F C L I M A T E VOLUME 25
tropical cell (positive/negative values of c) in the
Northern/Southern Hemisphere, with upward motion
over the ITCZ (;58N) and subsidence in the sub-
tropics (208–408).
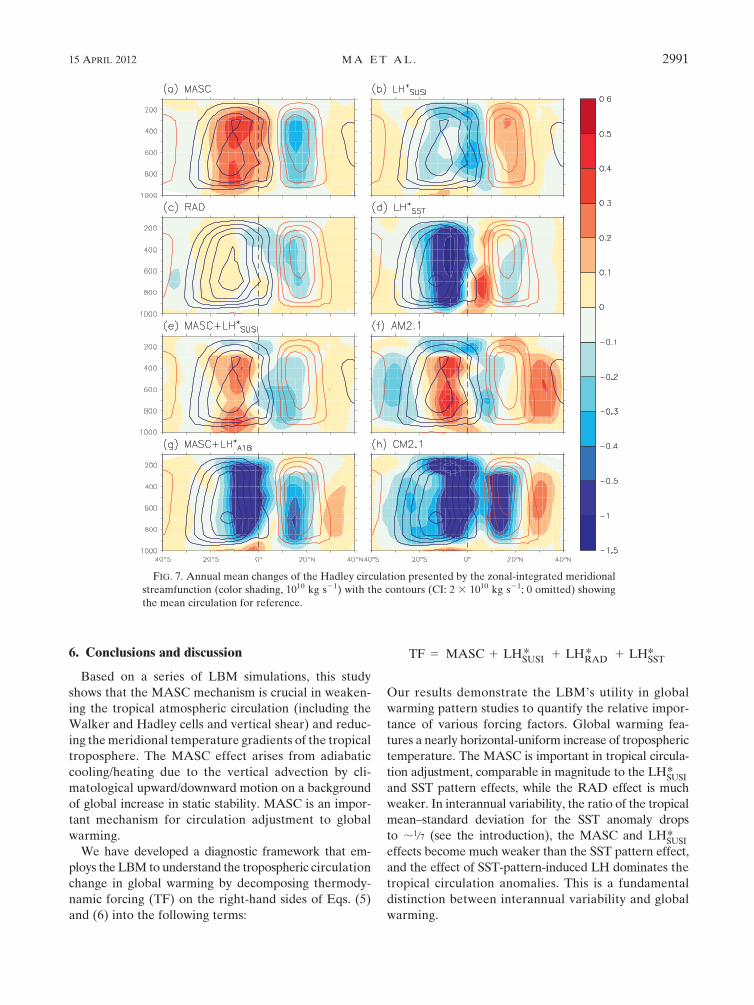
The MASC forces a significant weakening of the
Hadley circulation (Figs. 7a and 6k), while LHSUSI* ac-
celerates it (Figs. 7b and 6k) at a reduced magnitude. The
combined effect follows the MASC patterns (r 5 0.43
for c and 0.66 for x) and is quite similar (r $ 0.67)
between the LBM (Figs. 7e and 6k) and AM2.1 (Figs. 7f
and 6k). Thus, the MASC is the major driver for the
Hadley circulation reduction in the AM2.1 SUSI ex-
periment. Although the LHSUSI* effect is weak here, its
sign is always opposite to the MASC.
In response to GHG increase, the RAD effect causes
a weak reduction in the Hadley cell in the Northern
FIG. 6. (a)–(h) Annual mean changes of 250-hPa velocity potential (105 m2 s21) distribution (color shading) with the (i),(j) equatorial
means and (k),(l) zonal means. In (a)–(h), vectors are the changes of divergent wind (m s21), and contours (CI: 20 3 105 m2 s21;
0 omitted) show the mean velocity potential for reference.
15 APRIL 2012 M A E T A L . 2989
Hemisphere (Figs. 7c and 6l), with the same sign as the
MASC. The SST patterns (specifically the equatorial
peak, Fig. 3b) induce an anomalous cell on either side
of the equator (Fig. 7d), with a meridional scale of the
equatorial Rossby radius of deformation (;158). This
corresponds to an acceleration of the Hadley cell near
the equator in response to the equatorial peak in SST
warming (Liu et al. 2005; Xie et al. 2010). Because the
SST warming is greater in the Northern than the
Southern Hemisphere (Fig. 3b), the Northern SST-
induced equatorial cell is weak, especially above
500 hPa and the Hadley cell is reduced in the northern
off-equatorial region. As a result, only the southern cell
intensification is visible in the upper troposphere (Fig. 6l).
The total effect of the four factors (MASC 1 LHA1B* ,
Fig. 7g) explains the CM2.1 changes (Fig. 7h) quite well
(r 5 0.88). The Hadley cell weakens in the Northern
Hemisphere and accelerates in the Southern Hemi-
sphere. For the Northern Hemispheric cell, the SST-
induced acceleration is offset by the LHSUSI* , while both
the MASC and RAD effects contribute to the reduction.
In the Southern Hemisphere, the SST-induced cell do-
minates over the MASC 1 LHSUSI* effect, accelerating
the Hadley cell.
The LBM experiments indicate that the SST-pattern-
induced LH effect explains the difference in the Hadley
cell changes between AM2.1 and CM2.1, shedding light
on the intermodel variations in CMIP3 models (Fig. 8).
The CMIP3 ensemble-mean change in the 500-hPa c
shows a general reduction of the Hadley circulation in-
tensity in off-equatorial regions. Large intermodel var-
iability appears in 158S–158N due to difference in SST
patterns. This uncertainty can alter the sign of the
Hadley circulation change in the Southern Hemisphere,
but not in the Northern Hemisphere, because of stronger
ensemble-mean reduction of the Hadley cell in the
Northern than in the Southern Hemisphere. This is due
to the south–north gradient in ensemble mean SST
warming (Lu et al. 2008; Vecchi and Soden 2007a). Near
the equator, the ensemble mean c change appears flat
relative to the AM2.1 SUSI result, due to the equatorial
peak in ensemble-mean SST warming (Liu et al. 2005; Lu
et al. 2008). Thus, although much weaker than the CM2.1
A1B, which is apparently an outlier among the CMIP3
models, the meridional variation in ensemble mean SST
change affects the ensemble mean c change, dragging it
from AM2.1 SUSI-like toward CM2.1 A1B-like patterns.
We examine the relationship between the SST pat-
terns and Hadley cell strength change among the CMIP3
models by performing two sets of intermodel SVD anal-
ysis. One is between the zonal mean SST and the 500-hPa
c, and the other is between the zonal mean precipitation
(representing LH) and the 500-hPa c. Specifically,
a conventional SVD analysis is applied to 23 pairs of the
variables simulated by the 23 CMPI3 models. Since the
primary modes of c are nearly identical in the two anal-
yses, their mean is presented in Fig. 9.
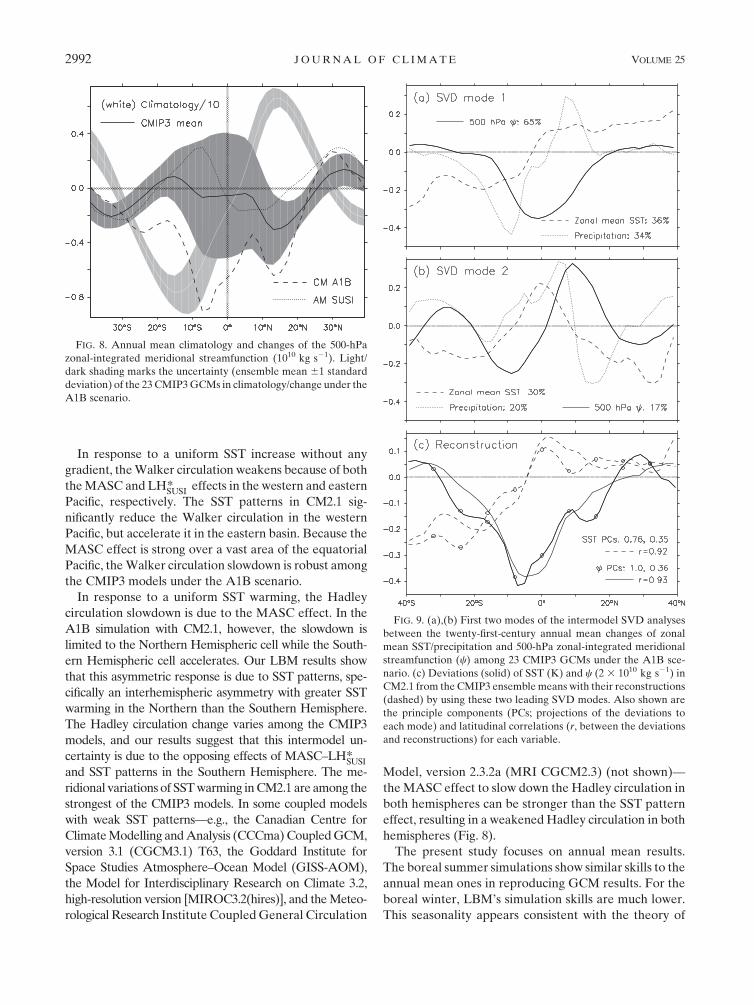
The first SVD mode (Fig. 9a) is antisymmetric with
positive/negative anomalous SST and precipitation in
the Northern/Southern Hemisphere. The intermodel
variability in meridional SST gradient is accompanied
by a cross-equatorial anticlockwise circulation between
158S and 158N that represents a strengthened/weakened
Hadley cell to the south–north of the equator. The sec-
ond mode (Fig. 9b) is symmetric and features a double-
cell circulation within 208S–208N that is driven by the
equatorial peak of SST and represents strengthened
Hadley circulation at either side of the equator. Although
not participating in the SVD analysis, the 10-member
ensemble mean change in the CM2.1 can be reconstructed
quite well by a linear combination of these two leading
covariant components. Figure 9c shows that the recon-
structions capture the large-scale latitudinal variations of
the deviations of the CM2.1 results from the CMIP3 en-
semble means, with r 5 0.92 and 0.93 for SST and c, re-
spectively. This cross validation supports our LBM result
that the SST pattern effect is important for Hadley cir-
culation change.
The above analyses show that the MASC is a funda-
mental mechanism for the slowdown of both the Walker
and Hadley circulations even without any SST gradient
change (SUSI). For the Hadley cell, it is the only weak-
ening mechanism. Since the meridional variations of SST
warming in CM2.1 are among the strongest of the CMIP3
models, especially between the equator and the Southern
Hemisphere, they dominate the southern Hadley cell
change. The Northern Hadley cell decelerates mostly due
to the MASC.
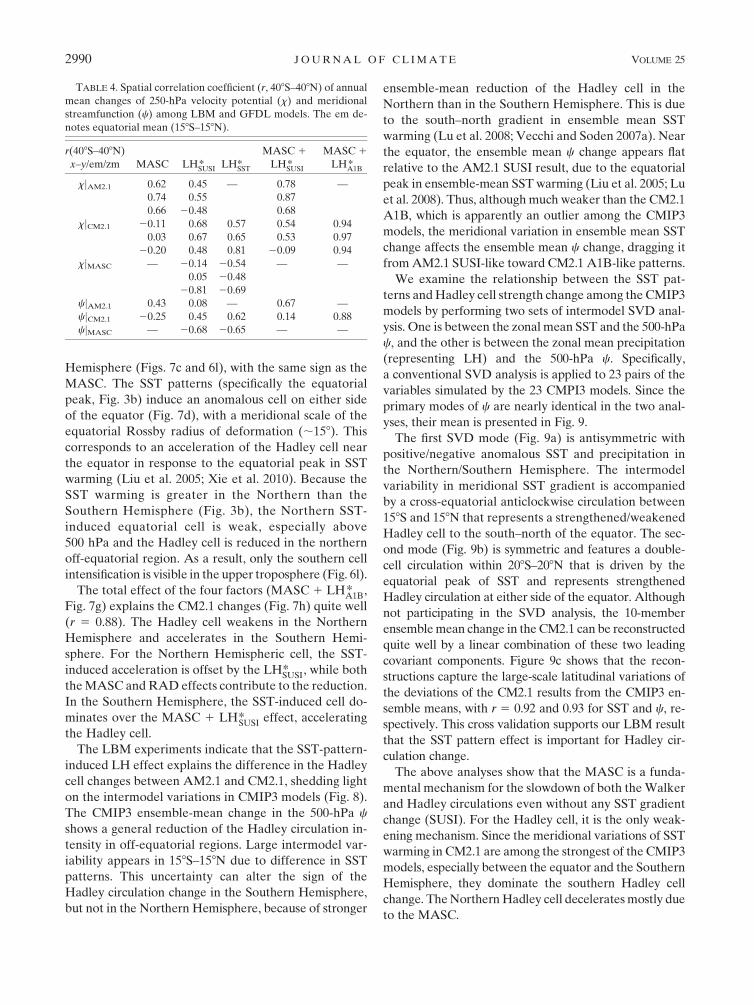
TABLE 4. Spatial correlation coefficient (r, 408S–408N) of annual
mean changes of 250-hPa velocity potential (x) and meridional
streamfunction (c) among LBM and GFDL models. The em de-
notes equatorial mean (158S–158N).
r(408S–408N)
x–y/em/zm MASC LHSUSI* LHSST
*MASC 1
LHSUSI*
MASC 1
LHA1B*
xjAM2.1 0.62 0.45 — 0.78 —
0.74 0.55 0.87
0.66 20.48 0.68
xjCM2.1 20.11 0.68 0.57 0.54 0.94
0.03 0.67 0.65 0.53 0.97
20.20 0.48 0.81 20.09 0.94
xjMASC — 20.14 20.54 — —
0.05 20.48
20.81 20.69
cjAM2.1 0.43 0.08 — 0.67 —
cjCM2.1 20.25 0.45 0.62 0.14 0.88
cjMASC — 20.68 20.65 — —
2990 J O U R N A L O F C L I M A T E VOLUME 25
6. Conclusions and discussion
Based on a series of LBM simulations, this study
shows that the MASC mechanism is crucial in weaken-
ing the tropical atmospheric circulation (including the
Walker and Hadley cells and vertical shear) and reduc-
ing the meridional temperature gradients of the tropical
troposphere. The MASC effect arises from adiabatic
cooling/heating due to the vertical advection by cli-
matological upward/downward motion on a background
of global increase in static stability. MASC is an impor-
tant mechanism for circulation adjustment to global
warming.
We have developed a diagnostic framework that em-
ploys the LBM to understand the tropospheric circulation
change in global warming by decomposing thermody-
namic forcing (TF) on the right-hand sides of Eqs. (5)
and (6) into the following terms:
TF 5 MASC 1 LHSUSI* 1 LHRAD
* 1 LHSST*
Our results demonstrate the LBM’s utility in global
warming pattern studies to quantify the relative impor-
tance of various forcing factors. Global warming fea-
tures a nearly horizontal-uniform increase of tropospheric
temperature. The MASC is important in tropical circula-
tion adjustment, comparable in magnitude to the LHSUSI*
and SST pattern effects, while the RAD effect is much
weaker. In interannual variability, the ratio of the tropical
mean–standard deviation for the SST anomaly drops
to ;1/7 (see the introduction), the MASC and LHSUSI*
effects become much weaker than the SST pattern effect,
and the effect of SST-pattern-induced LH dominates the
tropical circulation anomalies. This is a fundamental
distinction between interannual variability and global
warming.
FIG. 7. Annual mean changes of the Hadley circulation presented by the zonal-integrated meridional
streamfunction (color shading, 1010 kg s21) with the contours (CI: 2 3 1010 kg s21; 0 omitted) showing
the mean circulation for reference.
15 APRIL 2012 M A E T A L . 2991
In response to a uniform SST increase without any
gradient, the Walker circulation weakens because of both
the MASC and LHSUSI* effects in the western and eastern
Pacific, respectively. The SST patterns in CM2.1 sig-
nificantly reduce the Walker circulation in the western
Pacific, but accelerate it in the eastern basin. Because the
MASC effect is strong over a vast area of the equatorial
Pacific, the Walker circulation slowdown is robust among
the CMIP3 models under the A1B scenario.
In response to a uniform SST warming, the Hadley
circulation slowdown is due to the MASC effect. In the
A1B simulation with CM2.1, however, the slowdown is
limited to the Northern Hemispheric cell while the South-
ern Hemispheric cell accelerates. Our LBM results show
that this asymmetric response is due to SST patterns, spe-
cifically an interhemispheric asymmetry with greater SST
warming in the Northern than the Southern Hemisphere.
The Hadley circulation change varies among the CMIP3
models, and our results suggest that this intermodel un-
certainty is due to the opposing effects of MASC–LHSUSI*
and SST patterns in the Southern Hemisphere. The me-
ridional variations of SST warming in CM2.1 are among the
strongest of the CMIP3 models. In some coupled models
with weak SST patterns—e.g., the Canadian Centre for
Climate Modelling and Analysis (CCCma) Coupled GCM,
version 3.1 (CGCM3.1) T63, the Goddard Institute for
Space Studies Atmosphere–Ocean Model (GISS-AOM),
the Model for Interdisciplinary Research on Climate 3.2,
high-resolution version [MIROC3.2(hires)], and the Meteo-
rological Research Institute Coupled General Circulation
Model, version 2.3.2a (MRI CGCM2.3) (not shown)—
the MASC effect to slow down the Hadley circulation in
both hemispheres can be stronger than the SST pattern
effect, resulting in a weakened Hadley circulation in both
hemispheres (Fig. 8).
The present study focuses on annual mean results.
The boreal summer simulations show similar skills to the
annual mean ones in reproducing GCM results. For the
boreal winter, LBM’s simulation skills are much lower.
This seasonality appears consistent with the theory of
FIG. 8. Annual mean climatology and changes of the 500-hPa
zonal-integrated meridional streamfunction (1010 kg s21). Light/
dark shading marks the uncertainty (ensemble mean 61 standard
deviation) of the 23 CMIP3 GCMs in climatology/change under the
A1B scenario.
FIG. 9. (a),(b) First two modes of the intermodel SVD analyses
between the twenty-first-century annual mean changes of zonal
mean SST/precipitation and 500-hPa zonal-integrated meridional
streamfunction (c) among 23 CMIP3 GCMs under the A1B sce-
nario. (c) Deviations (solid) of SST (K) and c (2 3 1010 kg s21) in
CM2.1 from the CMIP3 ensemble means with their reconstructions
(dashed) by using these two leading SVD modes. Also shown are
the principle components (PCs; projections of the deviations to
each mode) and latitudinal correlations (r, between the deviations
and reconstructions) for each variable.
2992 J O U R N A L O F C L I M A T E VOLUME 25
Schneider et al. (2010). An important parameter for this
theory is the local Rossby number:
Ro 5 2z/f ,
where z is relative vorticity and f is the Coriolis pa-
rameter. When Ro / 1, the angular momentum con-
servation degenerates and provides no constraint on the
mean meridional mass flux, and the tropical circulation
change responds directly to the thermal driving. When
Ro / 0, circulation is dynamically constrained and the
change in the eddy momentum flux divergence plays an
important role. Figure 5 of Schneider et al. (2010) shows
that only in boreal summer are the local Ro larger than
0.5 in much of the upper branch of the Hadley cell in
both hemispheres, while in boreal winter, the local Ro is
smallest. The eddy effects (Lu et al. 2007; Schneider
et al. 2010) are not considered in this study but worth in-
depth investigations.
From the energetic point of view, the increased ver-
tical gradients of potential temperature in global warming
enhance the efficiency of the Hadley cell in transporting
the dry static energy from the equator to the subtropics,
assuming the strength of the Hadley cell does not change.
This is equivalent to the MASC mechanism. Held and
Soden (2006) show that the increase of moisture con-
vergence (supplying the LH) is insufficient to overcome
the dry energy divergence. Therefore, more energy is
transported poleward, flattening the tropical tropospheric
meridional temperature gradients, reducing the tropical
wind shear, pushing the synoptic eddies poleward and
thus, expanding and weakening the Hadley circulation.
During the warm phase of the ENSO, enhanced poleward
energy transport is also found because of the wind change
associated with enhanced SST gradient (Lu et al. 2008). In
global warming, SST pattern effects on energy transport
need further investigation, but SST gradient change is
much weaker than global-mean warming. The MASC,
instead of being caused by circulation change, drives the
winds to respond differently from the ENSO with same
sign of energy transport change.
Note: At the time of peer review, it came to our atten-
tion that Muller and O’Gorman (2011) have indepen-
dently proposed a similar decomposition method. Their
analysis with CMIP3 simulations supports our energetic
view on the MASC effect. Our study goes beyond the
diagnostic scheme and shows that LBM is useful in this
framework to compute the dynamical component of dry
energy divergence.
Acknowledgments. We wish to thank various model-
ing groups for providing their outputs, the Program
for Climate Model Diagnostics and Intercomparison
(PCMDI) and the WCRP’s Working Group on Coupled
Modeling (WGCM) for collecting, archiving, and making
the WCRP CMIP3 multimodel dataset readily available,
and the Office of Science, U.S. Department of Energy for
supporting this dataset. We thank the GFDL for pro-
viding the outputs of their ensemble integrations, and
M. Watanabe for releasing the LBM codes. We wish to
acknowledge use of the Ferret program for analysis and
graphics. Comments from anonymous reviewers were
helpful in improving the paper. B. Xiang and X. Zheng
are appreciated for technical discussions. This work is
supported by NSF, NOAA, NASA, and JAMSTEC.
REFERENCES
Alexander, M. A., I. Blade, M. Newman, J. R. Lanzante, N. C. Lau,
and J. D. Scott, 2002: The atmospheric bridge: The influence of
ENSO teleconnections on air–sea interaction over the global
oceans. J. Climate, 15, 2205–2231.
Betts, A. K., 1998: Climate-convection feedbacks: Some further
issues. Climatic Change, 39, 35–38.
——, and W. Ridgway, 1989: Climatic equilibrium of the atmo-
spheric convective boundary layer over a tropical ocean.
J. Atmos. Sci., 46, 2621–2641.
Bretherton, C., and A. Sobel, 2003: The Gill model and the weak
temperature gradient approximation. J. Atmos. Sci., 60, 451–460.
Chou, C., and J. D. Neelin, 2004: Mechanisms of global warming
impacts on regional tropical precipitation. J. Climate, 17,2688–2701.
——, ——, C.-A. Chen, and J.-Y. Tu, 2009: Evaluating the ‘‘rich-
get-richer’’ mechanism in tropical precipitation change under
global warming. J. Climate, 22, 1982–2005.
Delworth, T. L., and Coauthors, 2006: GFDL’s CM2 global cou-
pled climate models. Part I: Formulation and simulation
characteristics. J. Climate, 19, 643–674.
de Szoeke, S. P., and S.-P. Xie, 2008: The tropical eastern Pacific
seasonal cycle: Assessment of errors and mechanisms in IPCC
AR4 coupled ocean–atmosphere general circulation models.
J. Climate, 21, 2573–2590.
Frierson, D. M. W., J. Lu, and G. Chen, 2007: Width of the Hadley
cell in simple and comprehensive general circulation models.
Geophys. Res. Lett., 34, L18804, doi:10.1029/2007GL031115.
Fu, Q., C. M. Johanson, J. M. Wallace, and T. Reichler, 2006:
Enhanced mid-latitude tropospheric warming in satellite
measurements. Science, 312, 1179.
Gastineau, G., L. Li, and H. Le Treut, 2009: The Hadley and
Walker circulation changes in global warming conditions de-
scribed by idealized atmospheric simulations. J. Climate, 22,
3993–4013.
GFDL Global Atmospheric Model Development Team, 2004: The
new GFDL global atmosphere and land model AM2/LM2:
Evaluation with prescribed SST simulations. J. Climate, 17,
4641–4673.
Gill, A. E., 1980: Some simple solutions for heat-induced tropical
circulation. Quart. J. Roy. Meteor. Soc., 106, 447–462.
Held, I. M., and B. J. Soden, 2006: Robust responses of the hydro-
logical cycle to global warming. J. Climate, 19, 5686–5699.
Hu, Y., and Q. Fu, 2007: Observed poleward expansion of the
Hadley circulation since 1979. Atmos. Chem. Phys., 7, 5229–
5236, doi:10.5194/acp-7-5229-2007.
15 APRIL 2012 M A E T A L . 2993
Johanson, C. M., and Q. Fu, 2009: Hadley cell widening: Model
simulations versus observations. J. Climate, 22, 2713–2725.
Johnson, N. C., and S.-P. Xie, 2010: Changes in the sea surface
temperature threshold for tropical convection. Nat. Geosci., 3,842–845, doi:10.1038/ngeo1008.
Knutson, T. R., and S. Manabe, 1995: Time-mean response over the
tropical Pacific to increased CO2 in a coupled ocean–atmosphere
model. J. Climate, 8, 2181–2199.
——, J. J. Sirutis, S. T. Garner, G. A. Vecchi, and I. M. Held, 2008:
Simulated reduction in Atlantic hurricane frequency under
twenty-first-century warming conditions. Nat. Geosci., 1,
359–364.
Lindzen, R. S., 1990: Some coolness concerning global warming.
Bull. Amer. Meteor. Soc., 71, 288–299.
Liu, Z., S. Vavrus, F. He, N. Wen, and Y. Zhong, 2005: Rethinking
tropical ocean response to global warming: The enhanced
equatorial warming. J. Climate, 18, 4684–4700.
Lu, J., G. A. Vecchi, and T. Reichler, 2007: Expansion of the
Hadley cell under global warming. Geophys. Res. Lett., 34,L06805, doi:10.1029/2006GL028443.
——, G. Chen, and D. M. W. Frierson, 2008: Response of the zonal
mean atmospheric circulation to El Nino versus global
warming. J. Climate, 21, 5835–5851.
Matsuno, T., 1966: Quasi-geostrophic motions in the equatorial
area. J. Meteor. Soc. Japan, 44, 25–42.
Muller, C. J., and P. A. O’Gorman, 2011: An energetic perspective
on the regional response of precipitation to climate change.
Nat. Climate Change, 1, 266–271, doi:10.1038/nclimate1169.
Rodwell, M. J., and B. J. Hoskins, 1996: Monsoons and the dy-
namics of deserts. Quart. J. Roy. Meteor. Soc., 122, 1385–1404,
doi:10.1002/qj.49712253408.
Schneider, T., P. A. O’Gorman, and X. J. Levine, 2010: Water
vapor and the dynamics of climate changes. Rev. Geophys., 48,
RG3001, doi:10.1029/2009RG000302.
Tanaka, H. L., N. Ishizaki, and A. Kitoh, 2004: Trend and inter-
annual variability of Walker, monsoon and Hadley circula-
tions defined by velocity potential in the upper troposphere.
Tellus, 56A, 250–269.
Vecchi, G. A., and B. J. Soden, 2007a: Global warming and the
weakening of the tropical circulation. J. Climate, 20, 4316–
4340.
——, and ——, 2007b: Effect of remote sea surface temperature
change on tropical cyclone potential intensity. Nature, 450,
1066–1070.
——, and ——, 2007c: Increased tropical Atlantic wind shear in
model projections of global warming. Geophys. Res. Lett., 34,L08702, doi:10.1029/2006GL028905.
——, ——, A. T. Wittenberg, I. M. Held, A. Leetmaa, and M. J.
Harrison, 2006: Weakening of tropical Pacific atmospheric
circulation due to anthropogenic forcing. Nature, 441, 73–76,
doi:10.1038/nature04744.
——, K. L. Swanson, and B. J. Soden, 2008: Whither hurricane
activity? Science, 322, 687–689.
Watanabe, M., and M. Kimoto, 2000: Atmosphere-ocean thermal
coupling in the North Atlantic: A positive feedback. Quart.
J. Roy. Meteor. Soc., 126, 3343–3369; Corrigendum, 127, 733–
734.
——, and F.-F. Jin, 2004: Dynamical prototype of the Arctic Os-
cillation as revealed by a neutral singular vector. J. Climate, 17,
2119–2138.
Wentz, F. J., L. Ricciardulli, K. Hilburn, and C. Mears, 2007: How
much more rain will global warming bring? Science, 317, 233–235.
Wittenberg, A. T., A. Rosati, N.-C. Lau, and J. J. Ploshay, 2006:
GFDL’s CM2 global coupled climate models. Part III: Trop-
ical Pacific climate and ENSO. J. Climate, 19, 698–722.
Xie, S.-P., C. Deser, G. A. Vecchi, J. Ma, H. Teng, and A. T.
Wittenberg, 2010: Global warming pattern formation: Sea
surface temperature and rainfall. J. Climate, 23, 966–986.
2994 J O U R N A L O F C L I M A T E VOLUME 25