Embed Size (px)
Citation preview

on July 14, 2018http://rsif.royalsocietypublishing.org/Downloaded from
rsif.royalsocietypublishing.org
ResearchCite this article: Reynolds RF, Osler CJ. 2014
Mechanisms of interpersonal sway synchrony
and stability. J. R. Soc. Interface 11: 20140751.
http://dx.doi.org/10.1098/rsif.2014.0751
Received: 11 July 2014
Accepted: 1 October 2014
Subject Areas:biomechanics
Keywords:posture, interpersonal, feedback model
Author for correspondence:Raymond F. Reynolds
e-mail: [email protected]
Electronic supplementary material is available
at http://dx.doi.org/10.1098/rsif.2014.0751 or
via http://rsif.royalsocietypublishing.org.
& 2014 The Authors. Published by the Royal Society under the terms of the Creative Commons AttributionLicense http://creativecommons.org/licenses/by/4.0/, which permits unrestricted use, provided the originalauthor and source are credited.
Mechanisms of interpersonal swaysynchrony and stability
Raymond F. Reynolds1 and Callum J. Osler2
1School of Sport, Exercise and Rehabilitation Sciences, University of Birmingham, Birmingham B15 2TT, UK2Department of Life Sciences, University of Derby, Kedleston Road, Derby DE22 1GB, UK
Here we explain the neural and mechanical mechanisms responsible for syn-
chronizing sway and improving postural control during physical contact
with another standing person. Postural control processes were modelled
using an inverted pendulum under continuous feedback control. Interpersonal
interactions were simulated either by coupling the sensory feedback loops or
by physically coupling the pendulums with a damped spring. These simu-
lations precisely recreated the timing and magnitude of sway interactions
observed empirically. Effects of firmly grasping another person’s shoulder
were explained entirely by the mechanical linkage. This contrasted with
light touch and/or visual contact, which were explained by a sensory weight-
ing phenomenon; each person’s estimate of upright was based on a weighted
combination of veridical sensory feedback combined with a small contribution
from their partner. Under these circumstances, the model predicted reductions
in sway even without the need to distinguish between self and partner motion.
Our findings explain the seemingly paradoxical observation that touching a
swaying person can improve postural control.
1. IntroductionCutaneous information has been shown to improve postural control [1–7]. Other
than the sensation of force underfoot [8], a major source of cutaneous feedback
arises from manual contact with our surroundings. Lightly touching an earth-
fixed object can reduce sway as much as vision [5]. This occurs in the absence
of mechanical stabilization, is abolished when the arm is anaesthetized [1] and
has a delay characteristic of a sensorimotor feedback process [6]. So just like
vision, proprioception and vestibular input, cutaneous information provides a
powerful source of sensory feedback of bodily movement during stance.
Contact with moving objects also influences postural sway. For example,
lightly touching a rhythmically oscillating surface induces body movement at
the same frequency [3]. Unsurprisingly, this increases sway when compared
with contact with a stationary reference point [9]. Perhaps more surprising is
the recent observation that lightly touching another standing person can
reduce sway, compared with no touch [10,11]. In this case, the moving
‘object’ is a human being, with the pseudorandom motion characteristics of
postural sway. How this could be beneficial for balance, rather than deleterious,
is open to question. Indeed, in a recent study which used a haptic robotic inter-
face to mimic human sway, postural control when touching the device was no
better than baseline sway, and was possibly worse [9].
This intriguing observation—that light touch with another standing person
can reduce sway—raises many questions. What are the sensorimotor and/or
mechanical mechanisms by which contact with another person can improve pos-
tural control? Is it necessary to differentiate self motion from partner motion to
derive any benefit from interpersonal touch? Can physical contact with some-
body less stable be beneficial? How is cutaneous information integrated with
other sensory inputs? Here we address these questions by comparing empirical
observations of interpersonal sway interactions with a postural control model.
Varying levels of physical contact are combined with different visual conditions,
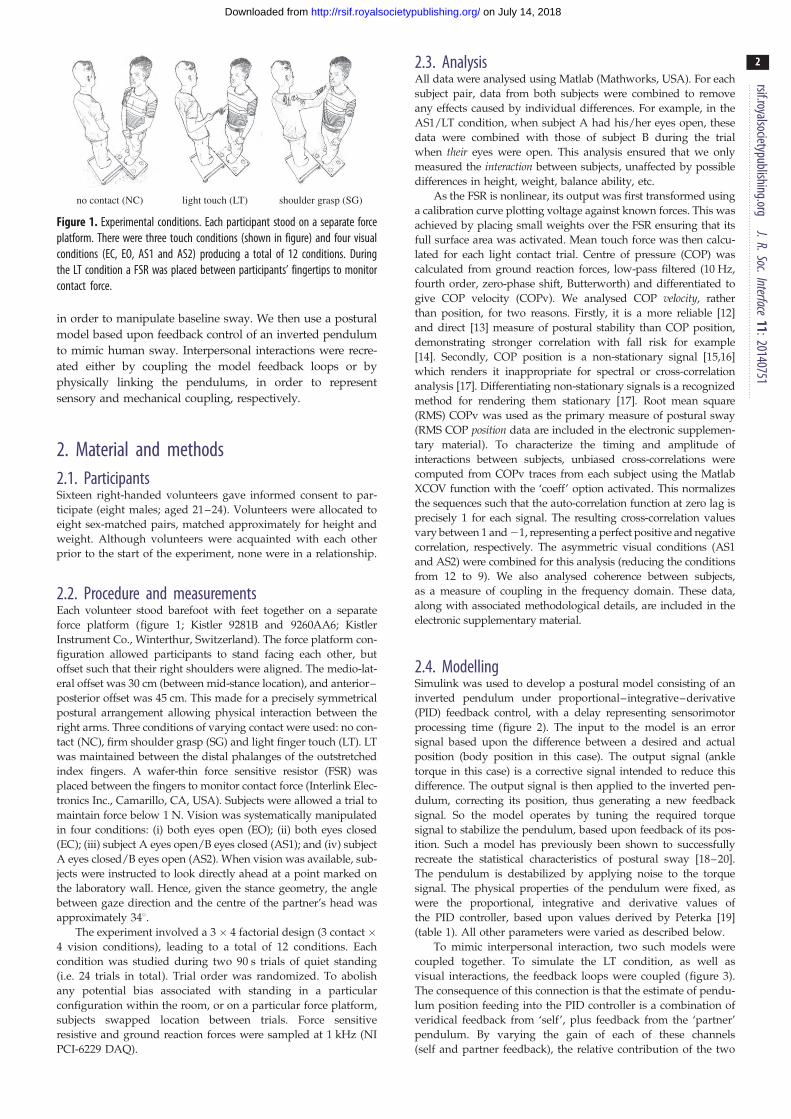
no contact (NC) light touch (LT) shoulder grasp (SG)
Figure 1. Experimental conditions. Each participant stood on a separate forceplatform. There were three touch conditions (shown in figure) and four visualconditions (EC, EO, AS1 and AS2) producing a total of 12 conditions. Duringthe LT condition a FSR was placed between participants’ fingertips to monitorcontact force.
rsif.royalsocietypublishing.orgJ.R.Soc.Interface
11:20140751
2
on July 14, 2018http://rsif.royalsocietypublishing.org/Downloaded from
in order to manipulate baseline sway. We then use a postural
model based upon feedback control of an inverted pendulum
to mimic human sway. Interpersonal interactions were recre-
ated either by coupling the model feedback loops or by
physically linking the pendulums, in order to represent
sensory and mechanical coupling, respectively.
2. Material and methods2.1. ParticipantsSixteen right-handed volunteers gave informed consent to par-
ticipate (eight males; aged 21–24). Volunteers were allocated to
eight sex-matched pairs, matched approximately for height and
weight. Although volunteers were acquainted with each other
prior to the start of the experiment, none were in a relationship.
2.2. Procedure and measurementsEach volunteer stood barefoot with feet together on a separate
force platform (figure 1; Kistler 9281B and 9260AA6; Kistler
Instrument Co., Winterthur, Switzerland). The force platform con-
figuration allowed participants to stand facing each other, but
offset such that their right shoulders were aligned. The medio-lat-
eral offset was 30 cm (between mid-stance location), and anterior–
posterior offset was 45 cm. This made for a precisely symmetrical
postural arrangement allowing physical interaction between the
right arms. Three conditions of varying contact were used: no con-
tact (NC), firm shoulder grasp (SG) and light finger touch (LT). LT
was maintained between the distal phalanges of the outstretched
index fingers. A wafer-thin force sensitive resistor (FSR) was
placed between the fingers to monitor contact force (Interlink Elec-
tronics Inc., Camarillo, CA, USA). Subjects were allowed a trial to
maintain force below 1 N. Vision was systematically manipulated
in four conditions: (i) both eyes open (EO); (ii) both eyes closed
(EC); (iii) subject A eyes open/B eyes closed (AS1); and (iv) subject
A eyes closed/B eyes open (AS2). When vision was available, sub-
jects were instructed to look directly ahead at a point marked on
the laboratory wall. Hence, given the stance geometry, the angle
between gaze direction and the centre of the partner’s head was
approximately 348.The experiment involved a 3 � 4 factorial design (3 contact �
4 vision conditions), leading to a total of 12 conditions. Each
condition was studied during two 90 s trials of quiet standing
(i.e. 24 trials in total). Trial order was randomized. To abolish
any potential bias associated with standing in a particular
configuration within the room, or on a particular force platform,
subjects swapped location between trials. Force sensitive
resistive and ground reaction forces were sampled at 1 kHz (NI
PCI-6229 DAQ).
2.3. AnalysisAll data were analysed using Matlab (Mathworks, USA). For each
subject pair, data from both subjects were combined to remove
any effects caused by individual differences. For example, in the
AS1/LT condition, when subject A had his/her eyes open, these
data were combined with those of subject B during the trial
when their eyes were open. This analysis ensured that we only
measured the interaction between subjects, unaffected by possible
differences in height, weight, balance ability, etc.
As the FSR is nonlinear, its output was first transformed using
a calibration curve plotting voltage against known forces. This was
achieved by placing small weights over the FSR ensuring that its
full surface area was activated. Mean touch force was then calcu-
lated for each light contact trial. Centre of pressure (COP) was
calculated from ground reaction forces, low-pass filtered (10 Hz,
fourth order, zero-phase shift, Butterworth) and differentiated to
give COP velocity (COPv). We analysed COP velocity, rather
than position, for two reasons. Firstly, it is a more reliable [12]
and direct [13] measure of postural stability than COP position,
demonstrating stronger correlation with fall risk for example
[14]. Secondly, COP position is a non-stationary signal [15,16]
which renders it inappropriate for spectral or cross-correlation
analysis [17]. Differentiating non-stationary signals is a recognized
method for rendering them stationary [17]. Root mean square
(RMS) COPv was used as the primary measure of postural sway
(RMS COP position data are included in the electronic supplemen-
tary material). To characterize the timing and amplitude of
interactions between subjects, unbiased cross-correlations were
computed from COPv traces from each subject using the Matlab
XCOV function with the ‘coeff’ option activated. This normalizes
the sequences such that the auto-correlation function at zero lag is
precisely 1 for each signal. The resulting cross-correlation values
vary between 1 and 21, representing a perfect positive and negative
correlation, respectively. The asymmetric visual conditions (AS1
and AS2) were combined for this analysis (reducing the conditions
from 12 to 9). We also analysed coherence between subjects,
as a measure of coupling in the frequency domain. These data,
along with associated methodological details, are included in the
electronic supplementary material.
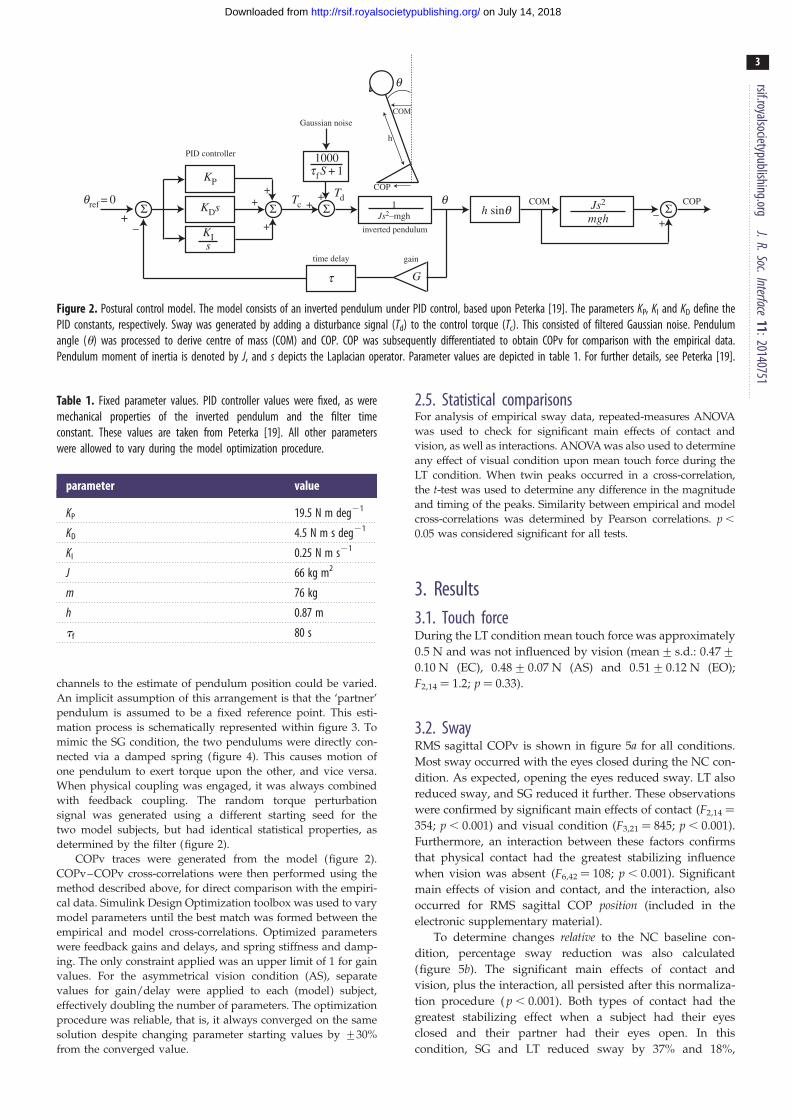
2.4. ModellingSimulink was used to develop a postural model consisting of an
inverted pendulum under proportional–integrative–derivative
(PID) feedback control, with a delay representing sensorimotor
processing time (figure 2). The input to the model is an error
signal based upon the difference between a desired and actual
position (body position in this case). The output signal (ankle
torque in this case) is a corrective signal intended to reduce this
difference. The output signal is then applied to the inverted pen-
dulum, correcting its position, thus generating a new feedback
signal. So the model operates by tuning the required torque
signal to stabilize the pendulum, based upon feedback of its pos-
ition. Such a model has previously been shown to successfully
recreate the statistical characteristics of postural sway [18–20].
The pendulum is destabilized by applying noise to the torque
signal. The physical properties of the pendulum were fixed, as
were the proportional, integrative and derivative values of
the PID controller, based upon values derived by Peterka [19]
(table 1). All other parameters were varied as described below.
To mimic interpersonal interaction, two such models were
coupled together. To simulate the LT condition, as well as
visual interactions, the feedback loops were coupled (figure 3).
The consequence of this connection is that the estimate of pendu-
lum position feeding into the PID controller is a combination of
veridical feedback from ‘self’, plus feedback from the ‘partner’
pendulum. By varying the gain of each of these channels
(self and partner feedback), the relative contribution of the two
KP
KDs
KIs
1 h sinq Js2
mgh
qref = 0 q
q
1000
Gaussian noise
PID controller
time delay
t
tfS + 1
inverted pendulum
Js2–mgh
COPCOM
h
COM
COP
TcTd
S SSS+
– +
++
++
+–
G
gain
Figure 2. Postural control model. The model consists of an inverted pendulum under PID control, based upon Peterka [19]. The parameters KP, KI and KD define thePID constants, respectively. Sway was generated by adding a disturbance signal (Td) to the control torque (Tc). This consisted of filtered Gaussian noise. Pendulumangle (u) was processed to derive centre of mass (COM) and COP. COP was subsequently differentiated to obtain COPv for comparison with the empirical data.Pendulum moment of inertia is denoted by J, and s depicts the Laplacian operator. Parameter values are depicted in table 1. For further details, see Peterka [19].
Table 1. Fixed parameter values. PID controller values were fixed, as weremechanical properties of the inverted pendulum and the filter timeconstant. These values are taken from Peterka [19]. All other parameterswere allowed to vary during the model optimization procedure.
parameter value
KP 19.5 N m deg21
KD 4.5 N m s deg21
KI 0.25 N m s21
J 66 kg m2
m 76 kg
h 0.87 m
tf 80 s
rsif.royalsocietypublishing.orgJ.R.Soc.Interface
11:20140751
3
on July 14, 2018http://rsif.royalsocietypublishing.org/Downloaded from
channels to the estimate of pendulum position could be varied.
An implicit assumption of this arrangement is that the ‘partner’
pendulum is assumed to be a fixed reference point. This esti-
mation process is schematically represented within figure 3. To
mimic the SG condition, the two pendulums were directly con-
nected via a damped spring (figure 4). This causes motion of
one pendulum to exert torque upon the other, and vice versa.
When physical coupling was engaged, it was always combined
with feedback coupling. The random torque perturbation
signal was generated using a different starting seed for the
two model subjects, but had identical statistical properties, as
determined by the filter (figure 2).
COPv traces were generated from the model (figure 2).
COPv–COPv cross-correlations were then performed using the
method described above, for direct comparison with the empiri-
cal data. Simulink Design Optimization toolbox was used to vary
model parameters until the best match was formed between the
empirical and model cross-correlations. Optimized parameters
were feedback gains and delays, and spring stiffness and damp-
ing. The only constraint applied was an upper limit of 1 for gain
values. For the asymmetrical vision condition (AS), separate
values for gain/delay were applied to each (model) subject,
effectively doubling the number of parameters. The optimization
procedure was reliable, that is, it always converged on the same
solution despite changing parameter starting values by +30%
from the converged value.
2.5. Statistical comparisonsFor analysis of empirical sway data, repeated-measures ANOVA
was used to check for significant main effects of contact and
vision, as well as interactions. ANOVA was also used to determine
any effect of visual condition upon mean touch force during the
LT condition. When twin peaks occurred in a cross-correlation,
the t-test was used to determine any difference in the magnitude
and timing of the peaks. Similarity between empirical and model
cross-correlations was determined by Pearson correlations. p ,
0.05 was considered significant for all tests.
3. Results3.1. Touch forceDuring the LT condition mean touch force was approximately
0.5 N and was not influenced by vision (mean+ s.d.: 0.47+0.10 N (EC), 0.48+ 0.07 N (AS) and 0.51+0.12 N (EO);
F2,14 ¼ 1.2; p ¼ 0.33).
3.2. SwayRMS sagittal COPv is shown in figure 5a for all conditions.
Most sway occurred with the eyes closed during the NC con-
dition. As expected, opening the eyes reduced sway. LT also
reduced sway, and SG reduced it further. These observations
were confirmed by significant main effects of contact (F2,14 ¼
354; p , 0.001) and visual condition (F3,21 ¼ 845; p , 0.001).
Furthermore, an interaction between these factors confirms
that physical contact had the greatest stabilizing influence
when vision was absent (F6,42 ¼ 108; p , 0.001). Significant
main effects of vision and contact, and the interaction, also
occurred for RMS sagittal COP position (included in the
electronic supplementary material).
To determine changes relative to the NC baseline con-
dition, percentage sway reduction was also calculated
(figure 5b). The significant main effects of contact and
vision, plus the interaction, all persisted after this normaliza-
tion procedure ( p , 0.001). Both types of contact had the
greatest stabilizing effect when a subject had their eyes
closed and their partner had their eyes open. In this
condition, SG and LT reduced sway by 37% and 18%,

controller inverted pendulum
noise
G+
+
+
controller inverted pendulum
person 1(a)
(b)
person 2
noise
qref = 0
qref = 0
q
q
Gc
Gc
G
+
20°
–20°
P1 P222°
G = 0.9Gc = 0.1
t
tc
tc
t
S
S
S
S S
S
Figure 3. Coupling the model feedback loops. (a) A simplified version of the model, adapted from figure 2, is duplicated above to represent two people interacting.Feedback loops are coupled together. The estimate of pendulum position which feeds into the PID controller is a weighted combination of ‘self ’ and ‘partner’. Theweightings are determined by the gain functions G and Gc. As Gc increases and G is reduced, the estimation becomes more reliant upon partner feedback. Thisprinciple is depicted in (b). Person 1’s estimate of body position (dotted figure) is a weighted combination of veridical feedback combined with a small contribution fromperson 2. Assuming gains of 0.9(G) and 0.1(Gc), this means that person 1’s estimate of body position is (0.9 � 20) þ (0.1 � 40) ¼ 228. An implicit assumption isthat each person assumes the other to be a fixed vertical reference point.
rsif.royalsocietypublishing.orgJ.R.Soc.Interface
11:20140751
4
on July 14, 2018http://rsif.royalsocietypublishing.org/Downloaded from
respectively. The only condition where physical contact did
not reduce sway was when a subject with eyes open grasped
the shoulder of a partner with eyes closed.
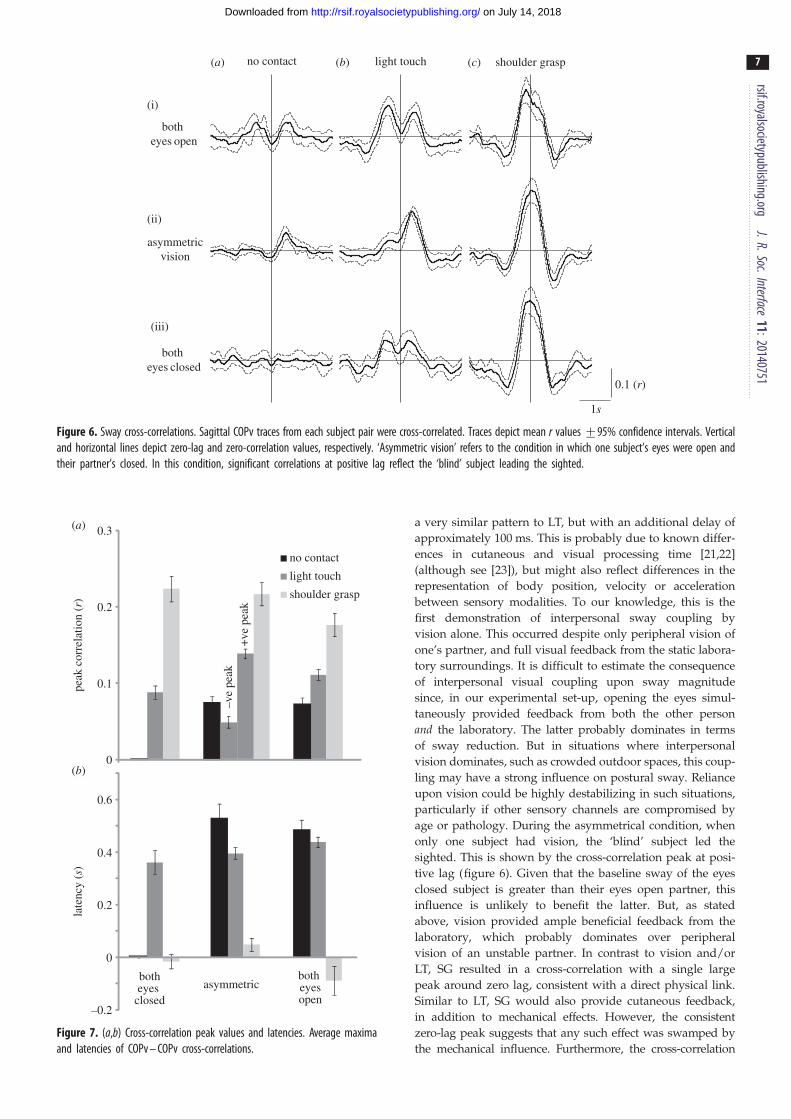
3.3. Cross-correlationsSignificant sway coupling was evident by deviation of the
cross-correlation 95% confidence limits from zero (figure 6).
This occurred for all conditions except EC/NC (figure
6a(iii)). In the EC/LT condition (figure 6b(iii)) two peaks
are visible either side of zero, indicating that each subject fol-
lowed the movement of their partner with a delay. When
both subjects opened their eyes, these peaks become more
prominent (figure 6b(i)). Vision alone also produced signifi-
cant correlations with a similar pattern, albeit of smaller
magnitude (figure 6a(i)). In the asymmetric visual conditions
(figure 6b(i)(ii)(iii)), a peak at positive lag indicates that the
‘blind’ subject leads their ‘sighted’ partner. However, a smal-
ler, but significant peak at negative lag was also identifiable
in the AS/LT condition. The SG condition produced a very
different pattern, with a large prominent peak around lag zero
regardless of visual condition (figure 6c(i)(ii)(iii)).
Magnitudes and latencies of cross-correlation peaks are
shown in figure 7. When twin peaks occurred, the data
from both peaks were combined unless there was a
significant difference between them (i.e. p , 0.05; t-test).
This only occurred for the magnitude of the LT/AS condition
(i.e. figure 6b(ii); t ¼ 16.8; p , 0.001). Hence both peaks (nega-
tive and positive) are represented separately in figure 7a for
this condition. SG consistently produced the largest corre-
lations (0.18–0.22), with latencies that were not significantly
different from zero (figure 7b; t � 1.89; p � 0.099). Vision
alone (EO/NC or AS/NC) produced significant correlation
magnitudes, but with longer latencies than seen during light
contact alone (485 and 361 ms for EO/NC and EC/LT con-
ditions, respectively; t¼ 2.55; p¼ 0.038).
3.4. Postural modelTo mimic LT and visual coupling, the model feedback loops
were coupled together (figure 3). For the SG condition, this
was combined with a damped spring coupling (figure 4).
Feedback gains and delays, and spring damping and stiffness
were varied until the best match was formed between the
empirical and model cross-correlations. The resulting com-
parison can be seen in figure 8. The model successfully
recreated the overall shape, magnitude and timing of the
cross-correlations for all conditions (correlation between
model and empirical cross-correlations; r2 ¼ 0.78–0.97;
p , 0.0001). The model parameter estimates for gain (G)

inverted pendulum
noise
G
controllerinverted
pendulum
person 2
person 1
noise
q
G
K
B dq/dt
+
–++
controller
damped spring
–
+
++
P1 P2
S
S
S S
S
SS
S
t
t
qref = 0
qref = 0
q
(a)
(b)
Figure 4. Physically coupling the pendulums. (a,b) The two model subjects are physically coupled together by a damped spring. This is depicted schematically in (b)by the torsional spring. As one pendulum moves, it will exert torque upon the other, and vice versa. The torque exerted by the spring is a function of the differencein pendulum positions. K and B represent stiffness and damping, respectively. Although omitted for clarity, when physical coupling was engaged it was alwayscombined with the feedback loop coupling depicted in figure 3.
rsif.royalsocietypublishing.orgJ.R.Soc.Interface
11:20140751
5
on July 14, 2018http://rsif.royalsocietypublishing.org/Downloaded from
varied between 0.77 and 1, while coupling gain (Gc) varied
between 0.044 and 0.181. For the SG condition, spring
stiffness varied between 5.5 and 15.3 Nm deg21, while
damping was 2.1–3.1 Nm deg21 s21. Sensorimotor delay
estimates were 68–181 ms (t) and 97–300 ms (tc). A compari-
son of the EO/NC versus EC/LT conditions shows that the
estimate of coupling delay (tc) was greater for vision alone
(238 ms) than for touch alone (97 ms).
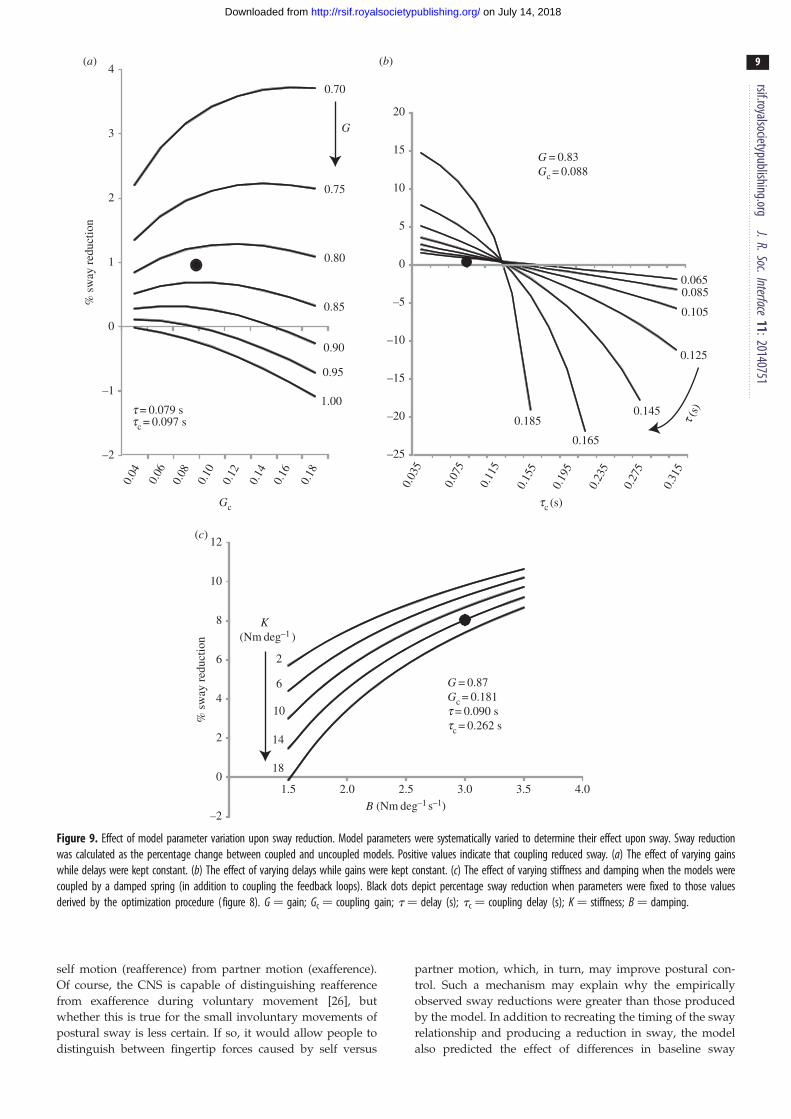
3.5. Effects of varying model parametersTo determine how model parameters affected sway we com-
pared coupled versus uncoupled sway while systematically
varying gains, delays, stiffness and damping. These par-
ameters were varied to span the range of values derived in
figure 8 and were varied in an identical way for both
model subjects, thus maintaining a symmetrical relationship
for the pair.
3.5.1. GainFigure 9a shows the influence of varying gains upon the
sway-reducing effect of coupling the feedback loops (i.e. the
coupling depicted in figure 3). Delays were fixed according
to parameters derived from the LT/EC condition (t ¼ 0.079 s
and tc ¼ 0.097 s). It can be seen that, with parameters set to
those values derived from the optimization procedure, the
model predicts a reduction in sway caused by coupling
(see inset black dot). As gain (G) was systematically increased
from 0.7 to 1, the sway-reducing benefit of coupling decreased.
At the highest value of gain (G ¼ 1), coupling actually caused
an increase in sway. Coupling gain (Gc) interacted with this
effect; there was an optimal Gc value for sway reduction at
each value of G. For example, at G ¼ 0.8 the greatest sway
reduction occurred at a Gc of 0.12.
3.5.2. DelayEffects of delay (t) and coupling delay (tc) are shown in
figure 9b (gains fixed at G ¼ 0.83 and Gc ¼ 0.088). There
was most to be gained from coupling when tc was low and
t was high (i.e. towards top left of figure 9b). As tc increases
beyond a critical point (approx. 125 ms), coupling becomes
deleterious (i.e. towards bottom right of figure 9b). Furthermore,
an interaction between t and tc is evident.
3.5.3. Stiffness and dampingFigure 9c shows the influence of stiffness (K ) and damping
(B) upon the sway-reducing effect of physical coupling via
the damped spring (depicted in figure 4). Gains and
delays were kept constant at those values derived for the
EC/SG condition. K and B were varied across a range of
values derived from the empirical matching process depicted
in figure 8. The introduction of the damped spring produced a
reduction in sway across almost all tested values,
with the largest reduction being 11% (K ¼ 2 Nm deg21;
B ¼ 3.5 Nm deg21 s21). K and B had opposing effects, i.e.
increasing B or decreasing K caused more sway reduction.
Changing K had a relatively small influence compared with
changing B, which may explain the fairly large range of stiffness

5
6
7
8
9
10
11
12
no contact
light touch
shoulder grasp
–10
0
10
20
30
40
botheyes
closed
botheyesopen
self closed
(partner open)
self open
(partner closed)
botheyes
closed
both eyesopen
self closed
(partner open)
self open
(partner closed)
RM
S C
OPv
(m
ms–1
)%
sw
ay r
educ
tion
(a)
(b)
light touch
shoulder grasp
Figure 5. Effects of interpersonal touch and vision upon sway. Sagital COPvis shown in (a) for all conditions. Percentage changes in sway relative to theNC condition are shown in (b). Bars show s.e.m.
rsif.royalsocietypublishing.orgJ.R.Soc.Interface
11:20140751
6
on July 14, 2018http://rsif.royalsocietypublishing.org/Downloaded from
values derived by the model optimization process (5.5–
15.3 Nm deg21 compared with 2.1–3.1 Nm deg21 s21 for
damping; see figure 8c(i)(ii)(iii)).
3.6. Effect of model asymmetryThe empirical data from figure 5 show that interpersonal con-
tact was not always beneficial when there were differences
between subjects in terms of their baseline (NC) sway. This
was particularly apparent during the AS/SG condition. To
determine if our model captures this effect, we induced
asymmetry in baseline sway between model subjects by alter-
ing the magnitude of Gaussian noise applied to the torque
signal (ordinarily fixed at 1000 in figure 2). Figure 10 shows
the effect of this asymmetry upon the beneficial effect of feed-
back and mechanical coupling. The figure demonstrates
greatest sway reduction when coupling with a more stable
person. However, there is a considerable region of difference
where both model subjects benefit from coupling, despite the
considerable differences in baseline sway. Once a threshold
is reached (235% to þ45% difference), coupling is only
beneficial for the less stable subject with no benefit for the
more stable subject, becoming detrimental to the latter
beyond this threshold. This compares favourably to the
empirical data in figure 5; the effect of vision was to reduce
sway by approximately 36% (11.45 versus 7.36 mm s21).
Under the asymmetric condition, SG produced considerable
benefit for the eyes closed subject, with no discernible benefit
for their more stable eyes open partner.
4. DiscussionOur results explain the basis of the recently observed
phenomenon in which physical contact with another swaying
person is beneficial for postural stability [10,11]. A relatively
simple postural control model accurately captured the inter-
actions between two standing persons. This allowed for
identification of the sensory and mechanical mechanisms
underlying these interactions. It also explains how physical
contact with another person can reduce sway even when
both persons have equal baseline sway, and without the
need for the nervous system to explicitly distinguish between
self and partner motion.
Our empirical observations confirm that physical contact
with another person improves postural control. SG and light
contact reduced sway by up to 37% and 18%, respectively,
which tallies well with previous findings (13% effect of LT
in 10, up to approximately 40% in 11 depending on stance).
Our results extend these observations. Firstly, the sway-
reducing effect of physical contact interacted with vision.
This interaction was due to the beneficial effect of contact
being greatest when closing the eyes reduced baseline stab-
ility. Secondly, individuals had the most to benefit when
making contact with somebody stabilized by vision. Greatest
sway reduction occurred when a person with their eyes
closed grasped the shoulder of their eyes open partner. This
complements the findings of Johanssen et al. [11], who
showed a similar effect caused by stance differences between
subjects. Nevertheless, we did observe small reductions in
sway for eyes open participants making LT with an eyes
closed partner. This indicates that interpersonal contact can
be beneficial even when making contact with a less stable
partner, albeit to a lesser extent. Presumably this benefit
disappears when the stability differential reaches some
threshold, as predicted by the model. In contrast to the
sway reductions we observed here, Wing et al. [9] noted an
increase in sway when touching a haptic interface replaying
recorded human sway. There may be a number of reasons
for this discrepancy. Firstly, in contrast to a real person, the
haptic interface produced a pre-programmed ballistic
motion, with no possibility of two-way interaction. Secondly,
the stiffness characteristics of the interface may differ from a
human arm. Lastly, there may be cognitive or psychological
factors when interacting with a known unstable object,
which could alter tactile weighting.
In addition to improving postural stability, physical con-
tact caused sway entrainment, as revealed by the COPv–
COPv cross-correlation. The precise timing of this coupling
varied according to contact type. LT alone produced twin
peaks with a delay around +380 ms. This delay suggests a
sensory feedback control mechanism, whereby each person
interprets changing fingertip force as self motion, and
produces a compensatory sway response. Vision alone produced
no contact light touch shoulder grasp
both eyes closed
both eyes open
asymmetricvision
1s
0.1 (r)
(a)
(i)
(ii)
(iii)
(b) (c)
Figure 6. Sway cross-correlations. Sagittal COPv traces from each subject pair were cross-correlated. Traces depict mean r values +95% confidence intervals. Verticaland horizontal lines depict zero-lag and zero-correlation values, respectively. ‘Asymmetric vision’ refers to the condition in which one subject’s eyes were open andtheir partner’s closed. In this condition, significant correlations at positive lag reflect the ‘blind’ subject leading the sighted.
no contact
light touch
shoulder grasp
0
0.1
0.3
0.2
0
0.2
0.4
0.6
–0.2
peak
cor
rela
tion
(r)
late
ncy
(s)
botheyes
closed
both eyesopen
asymmetric
–ve
peak
+ve
pea
k
(a)
(b)
Figure 7. (a,b) Cross-correlation peak values and latencies. Average maximaand latencies of COPv – COPv cross-correlations.
rsif.royalsocietypublishing.orgJ.R.Soc.Interface
11:20140751
7
on July 14, 2018http://rsif.royalsocietypublishing.org/Downloaded from
a very similar pattern to LT, but with an additional delay of
approximately 100 ms. This is probably due to known differ-
ences in cutaneous and visual processing time [21,22]
(although see [23]), but might also reflect differences in the
representation of body position, velocity or acceleration
between sensory modalities. To our knowledge, this is the
first demonstration of interpersonal sway coupling by
vision alone. This occurred despite only peripheral vision of
one’s partner, and full visual feedback from the static labora-
tory surroundings. It is difficult to estimate the consequence
of interpersonal visual coupling upon sway magnitude
since, in our experimental set-up, opening the eyes simul-
taneously provided feedback from both the other person
and the laboratory. The latter probably dominates in terms
of sway reduction. But in situations where interpersonal
vision dominates, such as crowded outdoor spaces, this coup-
ling may have a strong influence on postural sway. Reliance
upon vision could be highly destabilizing in such situations,
particularly if other sensory channels are compromised by
age or pathology. During the asymmetrical condition, when
only one subject had vision, the ‘blind’ subject led the
sighted. This is shown by the cross-correlation peak at posi-
tive lag (figure 6). Given that the baseline sway of the eyes
closed subject is greater than their eyes open partner, this
influence is unlikely to benefit the latter. But, as stated
above, vision provided ample beneficial feedback from the
laboratory, which probably dominates over peripheral
vision of an unstable partner. In contrast to vision and/or
LT, SG resulted in a cross-correlation with a single large
peak around zero lag, consistent with a direct physical link.
Similar to LT, SG would also provide cutaneous feedback,
in addition to mechanical effects. However, the consistent
zero-lag peak suggests that any such effect was swamped by
the mechanical influence. Furthermore, the cross-correlation
no contact light touch shoulder grasp
both eyes closed
both eyes open
asymmetricvision
1s
0.1 (r)
K = 15.3B = 3.1
G = 1.00
t = 0.112
G = 1.00
t = 0.111
K = 13.9B = 2.3
K = 5.5B = 2.1
G = 0.91Gc = 0.065t = 0.070tc = 0.238
G = 0.87Gc = 0.181t = 0.090tc = 0.262
G = 0.83Gc = 0.088t = 0.079tc = 0.097
G = 0.77Gc = 0.097t = 0.114tc = 0.118
G = 0.99Gc = 0.130t = 0.068tc = 0.119
G = 0.81Gc = 0.094t = 0.116tc = 0.094
G = 0.85Gc = 0.129t = 0.070tc = 0.115
G = 0.79Gc = 0.044t = 0.073tc = 0.186
G = 0.90Gc = 0.177t = 0.074tc = 0.300
G = 0.83Gc = 0.115t = 0.085tc = 0.131
(a)
(i)
(ii)
(iii)
(b) (c)
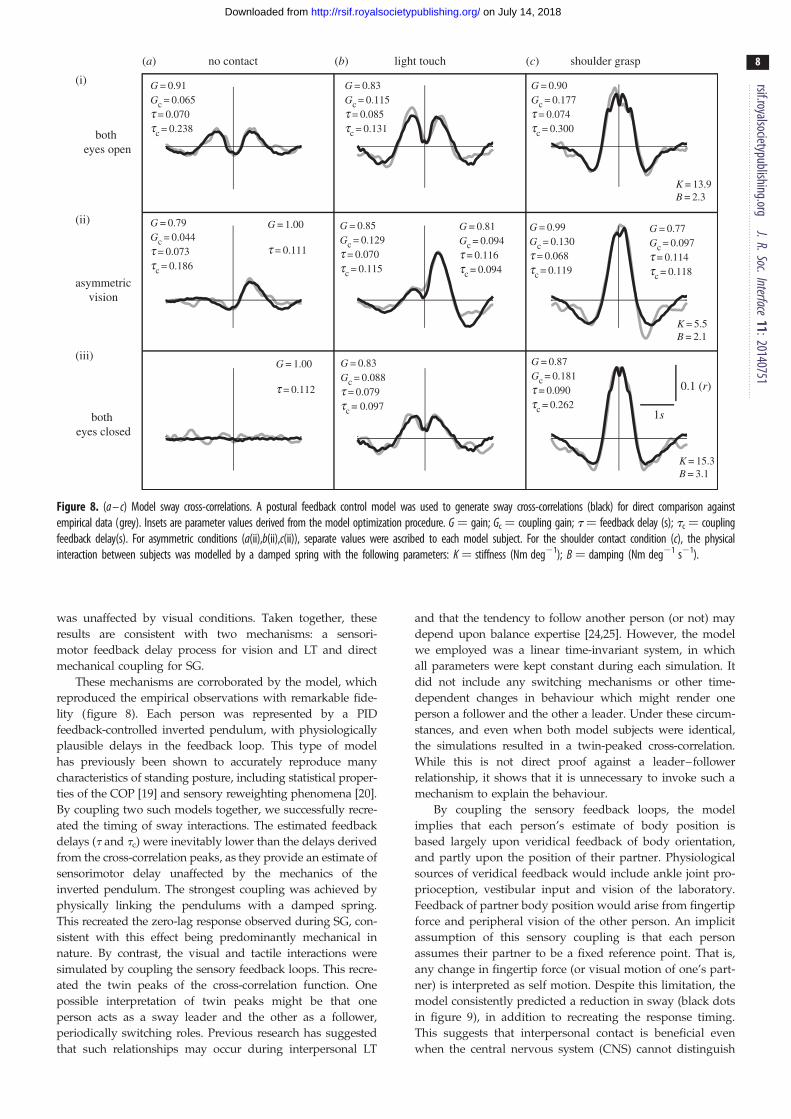
Figure 8. (a – c) Model sway cross-correlations. A postural feedback control model was used to generate sway cross-correlations (black) for direct comparison againstempirical data (grey). Insets are parameter values derived from the model optimization procedure. G ¼ gain; Gc ¼ coupling gain; t¼ feedback delay (s); tc ¼ couplingfeedback delay(s). For asymmetric conditions (a(ii),b(ii),c(ii)), separate values were ascribed to each model subject. For the shoulder contact condition (c), the physicalinteraction between subjects was modelled by a damped spring with the following parameters: K¼ stiffness (Nm deg21); B ¼ damping (Nm deg21 s21).
rsif.royalsocietypublishing.orgJ.R.Soc.Interface
11:20140751
8
on July 14, 2018http://rsif.royalsocietypublishing.org/Downloaded from
was unaffected by visual conditions. Taken together, these
results are consistent with two mechanisms: a sensori-
motor feedback delay process for vision and LT and direct
mechanical coupling for SG.
These mechanisms are corroborated by the model, which
reproduced the empirical observations with remarkable fide-
lity (figure 8). Each person was represented by a PID
feedback-controlled inverted pendulum, with physiologically
plausible delays in the feedback loop. This type of model
has previously been shown to accurately reproduce many
characteristics of standing posture, including statistical proper-
ties of the COP [19] and sensory reweighting phenomena [20].
By coupling two such models together, we successfully recre-
ated the timing of sway interactions. The estimated feedback
delays (t and tc) were inevitably lower than the delays derived
from the cross-correlation peaks, as they provide an estimate of
sensorimotor delay unaffected by the mechanics of the
inverted pendulum. The strongest coupling was achieved by
physically linking the pendulums with a damped spring.
This recreated the zero-lag response observed during SG, con-
sistent with this effect being predominantly mechanical in
nature. By contrast, the visual and tactile interactions were
simulated by coupling the sensory feedback loops. This recre-
ated the twin peaks of the cross-correlation function. One
possible interpretation of twin peaks might be that one
person acts as a sway leader and the other as a follower,
periodically switching roles. Previous research has suggested
that such relationships may occur during interpersonal LT
and that the tendency to follow another person (or not) may
depend upon balance expertise [24,25]. However, the model
we employed was a linear time-invariant system, in which
all parameters were kept constant during each simulation. It
did not include any switching mechanisms or other time-
dependent changes in behaviour which might render one
person a follower and the other a leader. Under these circum-
stances, and even when both model subjects were identical,
the simulations resulted in a twin-peaked cross-correlation.
While this is not direct proof against a leader–follower
relationship, it shows that it is unnecessary to invoke such a
mechanism to explain the behaviour.
By coupling the sensory feedback loops, the model
implies that each person’s estimate of body position is
based largely upon veridical feedback of body orientation,
and partly upon the position of their partner. Physiological
sources of veridical feedback would include ankle joint pro-
prioception, vestibular input and vision of the laboratory.
Feedback of partner body position would arise from fingertip
force and peripheral vision of the other person. An implicit
assumption of this sensory coupling is that each person
assumes their partner to be a fixed reference point. That is,
any change in fingertip force (or visual motion of one’s part-
ner) is interpreted as self motion. Despite this limitation, the
model consistently predicted a reduction in sway (black dots
in figure 9), in addition to recreating the response timing.
This suggests that interpersonal contact is beneficial even
when the central nervous system (CNS) cannot distinguish
–25
–20
–15
–10
–5
0
5
10
15
20
0.0650.085
0.105
0.125
0.145
0.165
0.185
tc (s)
0.03
5
0.07
5
0.31
5
0.11
5
0.15
5
0.19
5
0.23
5
0.27
5
–2
–1
0
1
2
3
4
0.70
0.75
0.80
0.85
0.90
0.95
1.00
0.04
0.06
0.08
0.10
0.12
0.14
0.16
0.18
Gc
% s
way
red
uctio
n
(a) (b)
G
G = 0.83Gc = 0.088
–2
0
2
4
6
8
10
12
1.5 2.0 2.5 3.0 3.5 4.0
(c)
% s
way
red
uctio
n
B (Nm deg–1 s–1)
2
6
18
14
10
K(Nm deg–1 )
G = 0.87Gc = 0.181t = 0.090 stc = 0.262 s
t = 0.079 stc = 0.097 s t (
s)
Figure 9. Effect of model parameter variation upon sway reduction. Model parameters were systematically varied to determine their effect upon sway. Sway reductionwas calculated as the percentage change between coupled and uncoupled models. Positive values indicate that coupling reduced sway. (a) The effect of varying gainswhile delays were kept constant. (b) The effect of varying delays while gains were kept constant. (c) The effect of varying stiffness and damping when the models werecoupled by a damped spring (in addition to coupling the feedback loops). Black dots depict percentage sway reduction when parameters were fixed to those valuesderived by the optimization procedure (figure 8). G ¼ gain; Gc ¼ coupling gain; t ¼ delay (s); tc ¼ coupling delay (s); K ¼ stiffness; B ¼ damping.
rsif.royalsocietypublishing.orgJ.R.Soc.Interface
11:20140751
9
on July 14, 2018http://rsif.royalsocietypublishing.org/Downloaded from
self motion (reafference) from partner motion (exafference).
Of course, the CNS is capable of distinguishing reafference
from exafference during voluntary movement [26], but
whether this is true for the small involuntary movements of
postural sway is less certain. If so, it would allow people to
distinguish between fingertip forces caused by self versus
partner motion, which, in turn, may improve postural con-
trol. Such a mechanism may explain why the empirically
observed sway reductions were greater than those produced
by the model. In addition to recreating the timing of the sway
relationship and producing a reduction in sway, the model
also predicted the effect of differences in baseline sway

−60 −40 −20 0 20 40 60 80 100−20
−15
−10
−5
0
5
10
15
% difference in baseline sway
% s
way
red
uctio
nregion of mutual
benefit
person 1person 2
person 1person 2
feedbackcoupling
mechanicalcoupling
person 1more stable
person 1less stable
Figure 10. Effect of different baseline sway upon benefits of coupling. The baseline(uncoupled) sway of person 1 was systematically modulated by changing their noisegain while person 2’s baseline sway was kept constant. The beneficial effect of coup-ling was then measured as the percentage change between coupled and uncoupledsway, for each model person. The region of mutual benefit refers to the area whereboth persons exhibit a reduction in sway, despite differences in baseline stability.
rsif.royalsocietypublishing.orgJ.R.Soc.Interface
11:20140751
10
on July 14, 2018http://rsif.royalsocietypublishing.org/Downloaded from
between participants. When one (model) person was suffi-
ciently more stable than another, coupling only benefited
the unstable person. However, there is a considerable
region of difference where the model predicted benefits for
both participants. This reflects the behavioural data which
demonstrated some reduction in sway even when contacting
a less stable partner.
Our model inevitably involved some assumptions and
simplifications. For example, we used a damped spring to
mimic the physical linkage produced by SG. This implies
that the arms were entirely passive, whereas it is possible
that some active forces were continuously generated by the
elbow flexors and extensors. Furthermore, we simplified the
postural control process with a linear system, in which sen-
sory feedback gains were constant over time. Responses to
sensory perturbations suggest that feedback gains change
with stimulus amplitude [27,28]. However, such nonlinearity
may be less relevant for the smaller range of sway seen
during natural unperturbed standing. Lastly, when coupling
the feedback loops our model did not explicitly represent the
form of sensory feedback available to each person, in terms of
fingertip force or visual input. Despite these simplifications,
the model explained the data with remarkable precision,
suggesting that our parsimonious approach captured the
essence of the underlying mechanisms.
Ethics statement. Approval was received from the local ethics committeeat the University of Birmingham and experiments were performed inaccordance with the Declaration of Helsinki.
Acknowledgements. Thanks to Paul Watts for help with subject recruit-ment, Steve Allen and Ken Dawkins for technical support, and TimOsborne for modelling advice.
Funding statement. This work was supported by two BBSRC grants (BB/100579X/1 and an Industry Interchange Award).
References
1. Kouzaki M, Masani K. 2008 Reduced postural swayduring quiet standing by light touch is due tofinger tactile feedback but not mechanical support.Exp. Brain Res. 188, 153 – 158. (doi:10.1007/s00221-008-1426-5)
2. Lackner JR, DiZio P, Jeka J, Horak F, Krebs D, Rabin E.1999 Precision contact of the fingertip reducespostural sway of individuals with bilateral vestibularloss. Exp. Brain Res. 126, 459 – 466. (doi:10.1007/s002210050753)
3. Jeka JJ, Schoner G, Dijkstra T, Ribeiro P, Lackner JR.1997 Coupling of fingertip somatosensoryinformation to head and body sway. Exp. Brain Res.113, 475 – 483. (doi:10.1007/PL00005600)
4. Jeka JJ, Lackner JR. 1995 The role of haptic cuesfrom rough and slippery surfaces in human posturalcontrol. Exp. Brain Res. 103, 267 – 276. (doi:10.1007/BF00231713)
5. Jeka JJ, Lackner JR. 1994 Fingertip contact influenceshuman postural control. Exp. Brain Res. 100,495 – 502. (doi:10.1007/BF02738408)
6. Clapp S, Wing AM. 1999 Light touch contribution tobalance in normal bipedal stance. Exp. Brain Res.125, 521 – 524. (doi:10.1007/s002210050711)
7. Holden M, Ventura J, Lackner JR. 1994 Stabilizationof posture by precision contact of the index finger.J. Vestib. Res. 4, 285 – 301.
8. Roll R, Kavounoudias A, Roll JP. 2002 Cutaneousafferents from human plantar sole contribute to
body posture awareness. Neuroreport 13, 1957 –1961. (doi:10.1097/00001756-200210280-00025)
9. Wing AM, Johannsen L, Endo S. 2011 Light touchfor balance: influence of a time-varying externaldriving signal. Phil. Trans. R. Soc. B 366, 3133 –3141. (doi:10.1098/rstb.2011.0169)
10. Johannsen L, Guzman-Garcia A, Wing AM. 2009Interpersonal light touch assists balance in theelderly. J. Mot. Behav. 41, 397 – 399. (doi:10.3200/35-09-001)
11. Johannsen L, Wing AM, Hatzitaki V. 2012Contrasting effects of finger and shoulderinterpersonal light touch on standing balance.J. Neurophysiol. 107, 216 – 225. (doi:10.1152/jn.00149.2011)
12. Lafond D, Corriveau H, Hebert R, Prince F. 2004Intrasession reliability of center of pressuremeasures of postural steadiness in healthy elderlypeople. Arch. Phys. Med. Rehabil. 85, 896 – 901.(doi:10.1016/j.apmr.2003.08.089)
13. Pai YC, Patton J. 1997 Center of mass velocity-position predictions for balance control. J. Biomech.30, 347 – 354. (doi:10.1016/S0021-9290(96)00165-0)
14. Melzer I, Benjuya N, Kaplanski J. 2004 Posturalstability in the elderly: a comparison betweenfallers and non-fallers. Age Ageing 33, 602 – 607.(doi:10.1093/ageing/afh218)
15. Newell KM, Slobounov SM, Slobounova BS,Molenaar PCM. 1997 Short-term non-stationarity
and the development of postural control. GaitPosture 6, 56 – 62. (doi:10.1016/S0966-6362(96)01103-4)
16. Loughlin PJ, Redfern MS, Furman JM. 2003Nonstationarities of postural sway. IEEE Eng. Med.Biol. Mag. 22, 69 – 75. (doi:10.1109/MEMB.2003.1195699)
17. Warner RM. 1998 Spectral analysis of time-seriesdata. New York, NY: The Guilford Press.
18. Peterka RJ. 2002 Sensorimotor integration in humanpostural control. J. Neurophysiol. 88, 1097 – 1118.
19. Peterka RJ. 2000 Postural control modelinterpretation of stabilogram diffusion analysis. Biol.Cybern. 82, 335 – 343. (doi:10.1007/s004220050587)
20. Peterka RJ, Loughlin PJ. 2004 Dynamic regulation ofsensorimotor integration in human postural control.J. Neurophysiol. 91, 410 – 423. (doi:10.1152/jn.00516.2003)
21. Forster B, Cavina-Pratesi C, Aglioti SM, Berlucchi G.2002 Redundant target effect and intersensoryfacilitation from visual-tactile interactions in simplereaction time. Exp. Brain Res. 143, 480 – 487.(doi:10.1007/s00221-002-1017-9)
22. Scott JJ, Gray R. 2008 A comparison of tactile,visual, and auditory warnings for rear-endcollision prevention in simulated driving. Hum.Factors 50, 264 – 275. (doi:10.1518/001872008X250674)

rsif.royalsocietypublishing
11
on July 14, 2018http://rsif.royalsocietypublishing.org/Downloaded from
23. Sozzi S, Do MC, Monti A, Schieppati M. 2012Sensorimotor integration during stance:processing time of active or passive addition orwithdrawal of visual or haptic information.Neuroscience 212, 59 – 76. (doi:10.1016/j.neuroscience.2012.03.044)
24. Sofianidis G, Elliott MT, Wing AM, Hatzitaki V. 2014Can dancers suppress the haptically mediatedinterpersonal entrainment during rhythmic sway?
Acta Psychol. (Amst.) 150, 106 – 113. (doi:10.1016/j.actpsy.2014.05.002)
25. Sofianidis G, Hatzitaki V, Grouios G, Johannsen L,Wing A. 2012 Somatosensory driven interpersonalsynchrony during rhythmic sway. Hum. Mov. Sci. 31,553 – 566. (doi:10.1016/j.humov.2011.07.007)
26. Wolpert DM, Miall RC. 1996 Forward models forphysiological motor control. Neural Netw. 9,1265 – 1279. (doi:10.1016/S0893-6080(96)00035-4)
27. Ravaioli E, Oie KS, Kiemel T, Chiari L, Jeka JJ. 2005Nonlinear postural control in response to visualtranslation. Exp. Brain Res. 160, 450 – 459. (doi:10.1007/s00221-004-2030-y)
28. Oie KS, Kiemel T, Jeka JJ. 2002 Multisensory fusion:simultaneous re-weighting of vision and touch forthe control of human posture. Brain Res. Cogn. BrainRes. 14, 164 – 176. (doi:10.1016/S0926-6410(02)00071-X)
.o rgJ.R.Soc.Interface11:20140751


![[GUIA RÁPIDO: OFFICE SWAY] - Projeto Nuvemprojetonuvem.asav.org.br/wp-content/uploads/2017/05/guia_rapido... · - [Office Sway] [GUIA RÁPIDO: OFFICE SWAY] O Sway é uma ferramenta](https://img.pdfslide.net/doc/110x75/5c5f5d7109d3f27c1d8b480c/guia-rapido-office-sway-projeto-office-sway-guia-rapido-office.jpg)


![1. Distinguish between Sway and Non sway type … IV 1. Distinguish between Sway and Non – sway type problems?[M/J-15] Because of sway, there will be rotations in the vertical members](https://img.pdfslide.net/doc/110x75/5af80c3b7f8b9a5f588c535c/1-distinguish-between-sway-and-non-sway-type-iv-1-distinguish-between-sway.jpg)