Embed Size (px)
Citation preview
ISCHEMIC ST DISPLACEMENT/Vincent, Abildskov, Burgess
R: Computer processing of exercise electrocardiograms. In Trends inComputer-Processed ECGs, edited by Van Bemmel JH, Willems JC.Amsterdam, North Holland Publ Cie, 1977, pp 383-406
27. Froelicher Jr VF, Yanowitz FG, Thompson AJ, Lancaster MC: The cor-relation of coronary angiography and the electrocardiographic responseto maximal treadmill testing in 76 asymptomatic men. Circulation 48:597, 1973
28. Erikssen J, Enge I, Furfang K, Storstein 0: False positive diagnostic testsand coronary arteriographic findings in 105 presumably healthy males.Circulation 54: 371, 1976
29. Cornfield J: Statistical classification methods. In Computer Diagnosis
Methods, edited by Jacques J. Springfield, Ill, CC Thomas, 197230. Pipberger HV, Schneiderman MA, Klingeman JD: The love-at-first-sight
effect in research. Circulation 38: 822, 196831. Redwood DR, Borer JS, Epstein SE: Whither the ST segment during ex-
ercise. Circulation 54: 703, 197632. Sheffield LT, Reeves TJ, Blackburn H, Ellestad MH, Froelicher VF,
Roitman D, Kansal S: The exercise test in perspective. Circulation 55:681, 1977
33. McHenry P: The actual prevalence of false positive ST segmentresponses to exercise in clinically normal subjects remains undefined. Cir-culation 55: 683, 1977
Mechanisms of Ischemic ST-Segment DisplacementEvaluation by Direct Current Recordings
G. MICHAEL VINCENT, M.D., J. A. ABILDSKOV, M.D.,AND MARY Jo BURGESS, M.D.
SUMMARY The electrophysiologic basis of ischemic ST-segmentdisplacement was investigated in 40 open chest dogs. Epicardial andsubendocardial electrograms were recorded with direct currentcoupled amplifiers during partial and complete coronary artery occlu-sion. The time course and magnitude of DC potential changes, andthe effects on the DC potentials of heart rate and subendocardialischemia were investigated.TQ segment depression, representing loss of resting membrane
potential, was found to be the consistent and most specific mechanismof "ST displacement" due to ischemia. True ST-segment displace-ment, due to alterations of phase 2 of the transmembrane actionpotential, occurred less frequently, and was not specific for ischemia.The DC potential changes were similar in both subendocardial and
ST-SEGMENT DISPLACEMENT, one of the most usefulsigns of acute ischemic heart disease, has at least two majorpossible physiologic mechanisms: localized loss of restingmembrane potential and alteration of the transmembraneaction potential waveform or time of onset of the actionpotentials.' Action potential waveform changes resulting inST displacement include alterations in the duration,amplitude, and slope of phase 2. The time of onset of the ac-tion potential may be altered by conduction abnormalitieswhich result in delayed activation and therefore delayedrepolarization. Previous studies investigating the relativefrequency anid magnitude of these two mechanisms haveproduced conflicting results."'' These variable results, plusthe increased interest in the use of ST-segment displacementbrought about by precordial ST-segment mapping, and bodysurface isopotential mapping, indicate that further elucida-tion of the underlying physiologic mechanisms is needed.
In the standard electrocardiogram, using capacitor
From the Cardiovascular Research and Training Institute and CardiologyDivisions, University of Utah School of Medicine and LDS Hospital, SaltLake City, Utah.Supported in part by Program Project Grant HL 13480 from the National
Institutes of Health, Award 73-710 from the American Heart Association,and a Research Award from the Utah Heart Association.
Address for reprints: G. Michael Vincent, M.D., Department of Medicine,LDS Hospital, Salt Lake City, Utah 84143.
Received June 7, 1976; revision accepted May 27, 1977.
epicardial tissue. Increased heart rate by atrial pacing increased themagnitude of TQ segment depression and produced subendocardialischemia during partial coronary flow reduction.The findings have importance in the clinical interpretation of ST-
segment displacement. Potential limitations in the use of precordialST-segment mapping to estimate infarct size or severity aredescribed. The results help explain the variable and conflicting find-ings of previous studies investigating the mechanisms of ST displace-ment, and may help explain the poor correlation between rapid atrialpacing-induced ST displacement and coronary artery disease definedby angiography. Electrocardiographic interpretation based onphysiologic data such as those presented in this study should improvethe usefulness and accuracy of the electrocardiographic examination.
coupled (A-C) amplifiers, both TQ segment and true ST-segment displacement appear as "ST-segment dis-placement," and the two cannot be differentiated. The tech-nique of recording cardiac potentials using direct currentcoupled amplifiers does, however, allow the identification ofthese two mechanisms individually. Using this technique,loss of resting membrane potential is manifest by a depres-sion of the TQ segment (baseline), while action potentialwaveform or timing changes are manifest by a shift of thetrue ST segment.' 6 These two separate mechanisms are il-lustrated in figure 1. Previous studies using this techniquehave reported variable results, some indicating only TQ seg-ment depression,9- " and others reporting both mechanismsto be present, but with variable relative importance.` Thisstudy describes the time course and magnitude of changes indirect current recorded epicardial and endocardial electro-grams from ischemic cardiac tissue in the experimentalanimal. Additional new information is reported on the effectof heart rate on the DC recorded electrogram. Through theuse of coronary artery flow probes to document themagnitude of coronary artery flow reduction, the effects ofpartial flow reduction and subendocardial ischemia aredescribed.
Methods
The mechanism of ST displacement produced by com-
559
by guest on June 7, 2018http://circ.ahajournals.org/
Dow
nloaded from
VOL 56, No 4, OCTOBER 1977
A.
90 mV
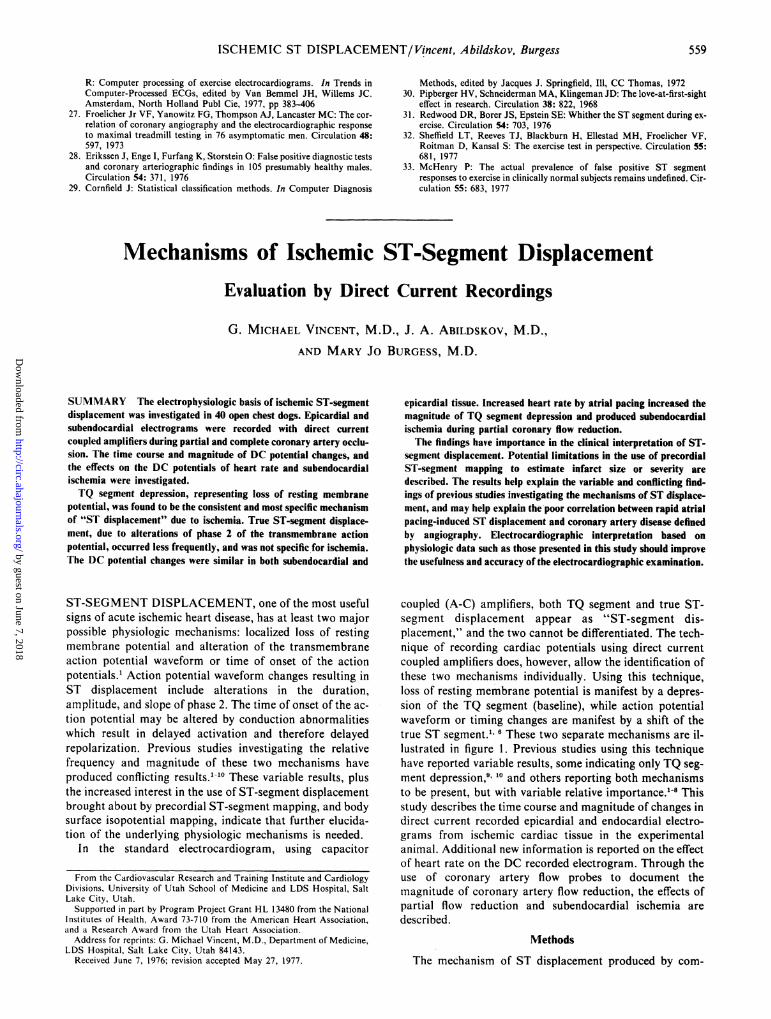
Baselineos lh eFIGURE 1. Diagrammatic representation initially described bySamson and Scher' of "ST segment displacement." Panel A showsshortening of the action potential and phase 2 slope changes. Thesurface DC electrocardiogram shows elevation of the true ST seg-
ment. Panel B shows loss ofresting membrane potential in the intra-cellular recording and depression of the baseline (TQ segment) inthe surface electrocardiogram. For simplicity, T waveform changeswhich would be expected with action potential changes in A are not
sho wn.
plete or partial occlusion of a coronary artery was studiedusing myocardial electrograms recorded with direct currentcoupled amplifiers. The studies were performed in openchest mongrel dogs, under pentobarbital or morphine andchloralose anesthesia, with mechanical ventilation withroom air. Several types of recording electrodes were used.Most frequently the electrode was an insulated silver wire,.005 inches in diameter, with the insulation scraped for 1-2mm, and this area was chloridized. Epicardial recordingswere obtained from wires sutured through the very
superficial epicardial tissue, as well as from saline moistenedcotton wick electrodes, saline-agar filled plastic cups of 0.25to 1.0 cm diameter, chloridized silver discs of 0.5 to 1.0 cmdiameter, and silver-silver chloride discs of 7 mm diameter.Subendocardial recordings were obtained from wiressutured through the ventricular wall and out again, so thatthe scraped area was placed in the subendocardium andanchored there by a previously placed knot adjacent to thescraped area. A chloridized silver wire inserted sub-cutaneously in the hind leg served as a reference electrode.The first occlusion was performed one hour after electrodeplacement to allow the injury currents due to electrodeplacement to disappear or stabilize. The amount of true ST-segment and TQ-segment change during each experimentwas determined by taking the difference between the controland the intervention states. Thus, while there was some "ST-segment" displacement in 20% of control recordings, themagnitude and relative amount of TQ and ST-segment dis-placement were not different in this circumstance fromrecordings where the control tracings showed no ST dis-placement. The electrodes were placed in the distribution ofthe isolated artery, at sites judged to be ischemic by visualobservation of color and wall motion changes during occlu-sion. An average of five unipolar electrograms was recordedin each experiment at a sensitivity of 10 or 20 mV/cm on a
multichannel Grass pen recorder or Dixon light beam os-
cillograph. The direct current differential preamplifiers usedin this study were specifically designed and fabricated in our
laboratory using techniques to maximize DC recordingcharacteristics. The input stage employs selected monolithic
dual field effect transistors and dual low drift operationalamplifiers physically configured for maximum thermal iner-tia. All active and passive components used were selected onthe basis of minimum temperature coefficient and noise.After a 10 minute warm-up period the long term DC voltagedrift was <10 tV/hr. The input impedance was 1011 ohms.This differential electrometer type input minimized drift dueto the large dynamic range of source impedances en-countered in the electrocardiographic recording. Thepreamplifiers had a frequency response of DC to 10 KHzand a voltage gain of 10. Noncardiac potential shifts due toamplifier drift, electrode polarization or skin potentialchanges around the reference electrode were not uncommon.To prevent this artifact from being mistaken for cardiacpotential changes due to ischemia, data were taken onlyfrom those recordings in which the baseline potential follow-ing release of the occlusion returned to the control value.The polarity of the recording system was such that a positivewave was inscribed when the exploring electrode becamepositive with respect to the reference electrode. The TQ-segment level was measured just prior to the QRS complex.True ST-segment level was measured immediately after theJ point.
Complete coronary occlusion of either the left anteriordescending artery or the circumflex artery was performed in30 animals by applying traction on a piece of umbilical tapepassed underneath the vessel. Ischemic areas of variable sizewere obtained in different animals by varying the location ofthe occlusion. Approximately 120 occlusions were per-formed, and 600 electrograms recorded. Control recordingsof epicardial and subendocardial electrograms, and a Y leadbody surface electrocardiogram were made prior to eachocclusion and continuous recordings were made during cor-onary occlusion of 5 to 20 minutes duration, and for 4 to 6minutes following release of the occlusion. In those ex-periments with 10 to 20 minute occlusions, the pericardiumwas loosely closed over the electrodes, warm saline padswere placed on the heart, and the chest wall was closed priorto obtaining control and occlusion records.The effect of partial coronary artery occlusion, producing
variable degrees of coronary flow reduction, was in-vestigated in 10 additional dogs. The animals were preparedas previously described. A Statham coronary flow probe wasplaced on the proximal left anterior descending artery or cir-cumflex artery, and connected to a Statham SP 2202flowmeter, from which mean coronary flow could be readdirectly. Coronary flow reduction of the desired amount wasobtained using an inflatable silastic cuff placed around theartery distal to the flow probe, making sure no significantbranches exited between the probe and the occlusion cuff.Several occlusions of variable degree were performed ineach animal, with randomly selected reductions in mean cor-onary flow of 10-100%. Control recordings were made priorto each occlusion, and continuous recordings made during 5minutes of flow reduction, and for 5 minutes followingrelease.
Results
TQ and ST-Segment Changes
In all experiments, depression of the TQ segment oc-curred and was the major cause of "ST-segment dis-
560 CIRCULATION
by guest on June 7, 2018http://circ.ahajournals.org/
Dow
nloaded from
ISCHEMIC ST DISPLACEMENT/Vincent, Abildskov, Burgess
I MEN 2 MU MIN 1AFTE 2IMAFTERCONTROL OCCLUSI OCCLUSION RELEASE RELEASE
20mvI
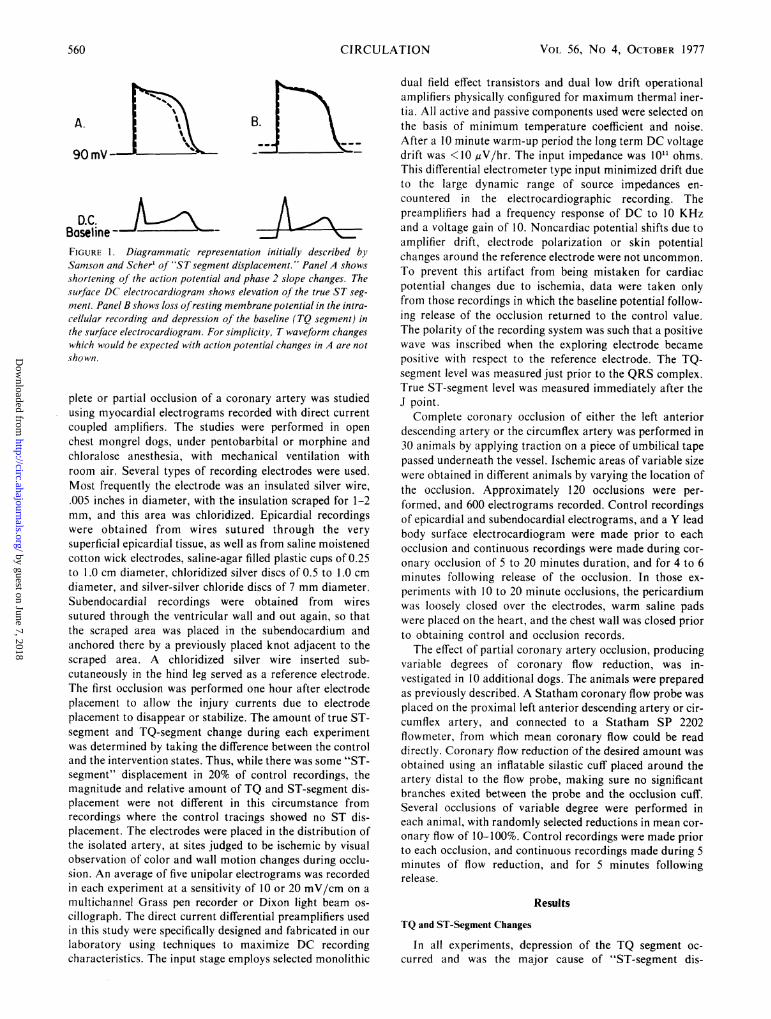
FIGURE 2. Simultaneous epicardial electrograms recorded from four electrodes. The electrodes were distributed ran-domly in the ischemic area, with some more toward the center of the ischemic area than others. A t one minute of occlu-sion TQ depression is apparent in all recordings. After two minutes ofocclusion the TQ depression has increased. The ST-segment take-off is slightly elevated or isoelectric in all recordings. The marked change in T waveform is apparent, andthis figure emphasizes that major changes in action potential downstroke shape and timing can occur without significantalteration of phase 2 and the true ST segment.
placement." True ST-segment shifts were of less magnitudeand variable, with both ST depression and elevation oc-curring. Four representative epicardial recordings are shownin figure 2. The mean TQ and ST-segment changes oc-curring with 15 minute occlusions are shown in figure 3. TheTQ depression began within 30 seconds, and increased inmagnitude during occlusions up to 20 minutes, but usuallyreached a near maximum degree by about 5 minutes. Therewere only small changes in the true ST-segment level. Theresults of shorter occlusions, 3 to 5 minutes in duration, in-volving 12 experiments and 53 electrograms showed asimilar time course and magnitude of TQ and true ST-segment change, with the TQ segment usually returning tothe control level within 60-90 seconds. The occlusions main-tained for 20 minutes or longer frequently led to changeswhich persisted following release of the occlusion. In thesecircumstances it was impossible to determine if the persis-tent changes were due to early infarction, or to artifact dueto electrode polarization or amplifier drift, and for thisreason occlusions longer than 15 minutes in duration werenot included in the analysis. The peak magnitude of TQdepression was as much as 12-14 mV and occurred in thecenter of the ischemic area. The amount of depressiondecreased toward the periphery of the lesion. TQ depressionoccasionally began several seconds earlier in subendo-cardial leads than in epicardial leads, but the peakmagnitude of depression was similar in both.T waveform was markedly altered with occlusion. The T
wave was usually inverted in both subendocardial and epi-cardial recordings in the control state, and became positivein both during ischemia.
Variable Coronary Flow Reduction and Subendocardial Ischemia
In the studies with variable coronary flow reduction, myo-cardial ischemia as evidenced by post release reactivehyperemia measured by flowmeter occurred with reductionsof flow of 5-10%. Usually no electrocardiographic changeswere present at that time. T wave changes occurred at
3RELEASE
2 *eST
I~~~~ ~^ *T
-I z
-2 ;;;
-3 I I
-6II;I IIIIl
-81 i 3s4 S 6 7 16 9 10 11 12 13 14 15 i 3 4 5
YIIMIE(1)
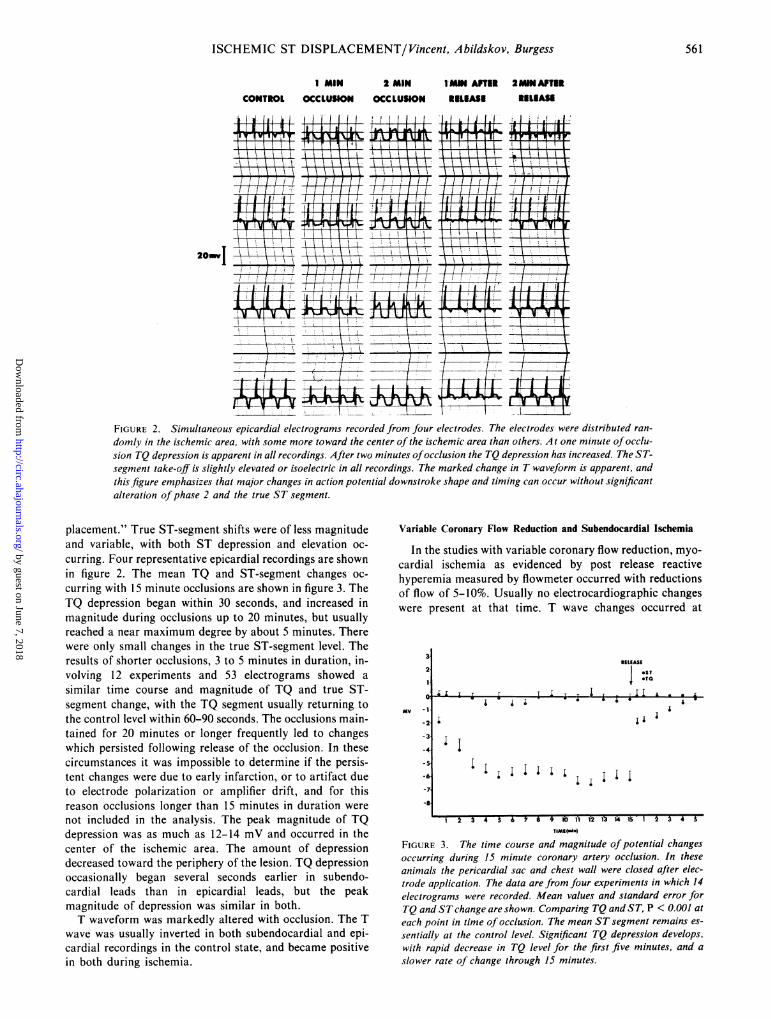
FIGURE 3. The time course and magnitude of potential changesoccurring during 15 minute coronary artery occlusion. In theseanimals the pericardial sac and chest wall were closed after elec-trode application. The data are from four experiments in which 14electrograms were recorded. Mean values and standard error forTQ and STchange are shown. Comparing TQ and ST, P < 0.001 at
each point in time of occlusion. The mean ST segment remains es-
sentially at the control level. Significant TQ depression develops,with rapid decrease in TQ level for the first five minutes, and aslower rate of change through 15 minutes.
561
mv
by guest on June 7, 2018http://circ.ahajournals.org/
Dow
nloaded from
VOL 56, No 4, OCTOBER 1977
CONTROL 3 MN MTIAL 1MIN AFTEL 3 MAN COWEL AFTER
OCCWSON KLEASE1 -I t 1 / I { / /
T- 1
T-!UtSW AW;WmH-1 A
It 1i4- In-] III ---W---4-1 _ J
3~~~~~~~~ 1-
7-
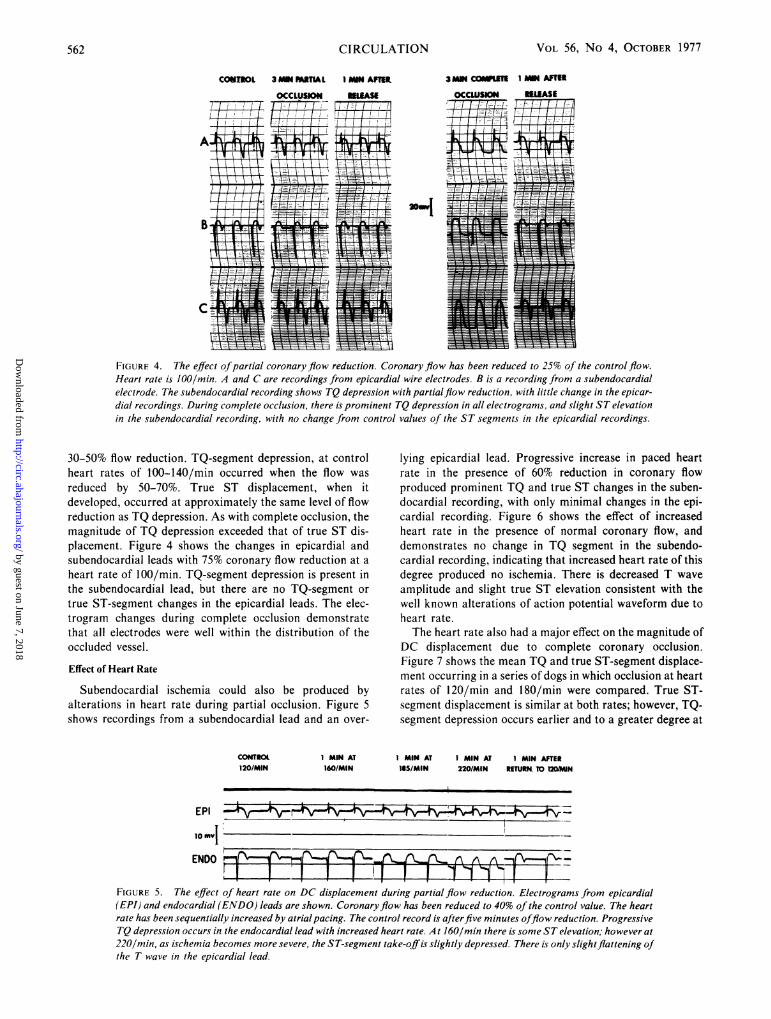
FIGURE 4. The effect ofpartial coronary flow reduction. Coronary flow has been reduced to 25% of the control flow.
Heart rate is 100/mmn A and C are recordings from epicardial wire electrodes. B is a recording from a subendocardial
electrode. The subendocardial recording shows TQ depression with partialflow reduction, with little change in the epicar-
dial recordings. During complete occlusion, there is prominent TQ depression in all electrograms, and slight ST elevation
in the subendocardial recording, with no change from control values of the ST segments in the epicardial recordings.
30-50% flow reduction. TQ-segment depression, at controlheart rates of 100-140/min occurred when the flow was
reduced by 50-70%. True ST displacement, when itdeveloped, occurred at approximately the same level of flowreduction as TQ depression. As with complete occlusion, themagnitude of TQ depression exceeded that of true ST dis-placement. Figure 4 shows the changes in epicardial andsubendocardial leads with 75% coronary flow reduction at a
heart rate of 100/min. TQ-segment depression is present inthe subendocardial lead, but there are no TQ-segment or
true ST-segment changes in the epicardial leads. The elec-trogram changes during complete occlusion demonstratethat all electrodes were well within the distribution of theoccluded vessel.
Effect of Heart Rate
Subendocardial ischemia could also be produced byalterations in heart rate during partial occlusion. Figure 5shows recordings from a subendocardial lead and an over-
CONITOL120/MIN
1 MIN AT160/MAN
lying epicardial lead. Progressive increase in paced heartrate in the presence of 60% reduction in coronary flowproduced prominent TQ and true ST changes in the suben-docardial recording, with only minimal changes in the epi-cardial recording. Figure 6 shows the effect of increasedheart rate in the presence of normal coronary flow, anddemonstrates no change in TQ segment in the subendo-cardial recording, indicating that increased heart rate of thisdegree produced no ischemia. There is decreased T wave
amplitude and slight true ST elevation consistent with thewell known alterations of action potential waveform due toheart rate.The heart rate also had a major effect on the magnitude of
DC displacement due to complete coronary occlusion.Figure 7 shows the mean TQ and true ST-segment displace-ment occurring in a series of dogs in which occlusion at heartrates of 120/min and 180/min were compared. True ST-segment displacement is similar at both rates; however, TQ-segment depression occurs earlier and to a greater degree at
I MIN AT IMIN AT IMIN AFTER135/MIN 220/MIN RETURN. TO I2DAN
EPI _ ______
10 u'!ENDO A A
FIGURE 5. The effect of heart rate on DC displacement during partial flow reduction. Electrograms from epicardial(EPI) and endocardial (ENDO) leads are shown. Coronaryflow has been reduced to 40% of the control value. The heartrate has been sequentially increased by atrialpacing. The control record is afterfive minutes offlow reduction. ProgressiveTQ depression occurs in the endocardial lead with increased heart rate. A t 160/min there is some ST elevation; however at220/min, as ischemia becomes more severe, the ST-segment take-offis slightly depressed. There is only slightflattening ofthe T wave in the epicardial lead.
CIRCULATION562
FALEASEi / --! I ;.I
"--I I II'' I 1.
by guest on June 7, 2018http://circ.ahajournals.org/
Dow
nloaded from
ISCHEMIC ST DISPLACEMENT/Vincent, Abildskov, Burgess
CONTROLRATE 120/MIN
EPI
PACING IMMEDIATELY AFTER
ENDO |! ,r1||r
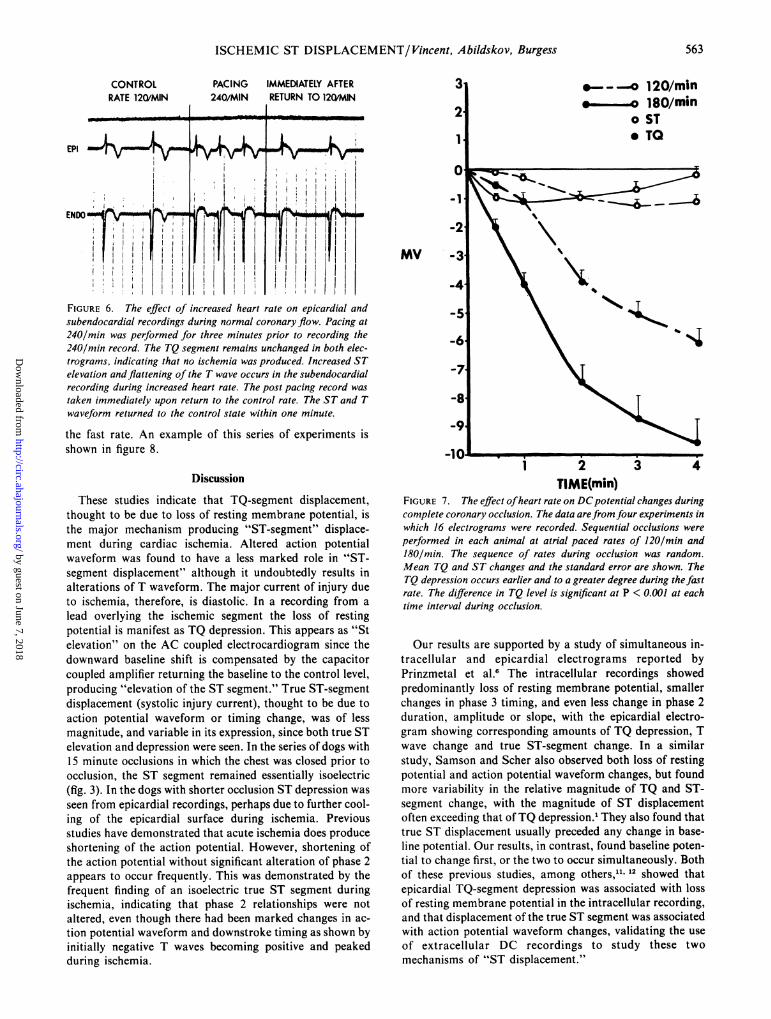
FIGURE 6. The effect of increased heart rate on epicardial andsubendocardial recordings during normal coronary flow. Pacing at240/min was performed for three minutes prior to recording the240/min record. The TQ segment remains unchanged in both elec-trograms, indicating that no ischemia was produced. Increased STelevation and flattening of the T wave occurs in the subendocardialrecording during increased heart rate. The post pacing record wastaken immediately upon return to the control rate. The ST and Twaveform returned to the control state within one minute.
the fast rate. An example of this series of experiments isshown in figure 8.
Discussion
These studies indicate that TQ-segment displacement,thought to be due to loss of resting membrane potential, isthe major mechanism producing "ST-segment" displace-ment during cardiac ischemia. Altered action potentialwaveform was found to have a less marked role in "ST-segment displacement" although it undoubtedly results inalterations of T waveform. The major current of injury dueto ischemia, therefore, is diastolic. In a recording from alead overlying the ischemic segment the loss of restingpotential is manifest as TQ depression. This appears as "Stelevation" on the AC coupled electrocardiogram since thedownward baseline shift is compensated by the capacitorcoupled amplifier returning the baseline to the control level,producing "elevation of the ST segment." True ST-segmentdisplacement (systolic injury current), thought to be due toaction potential waveform or timing change, was of lessmagnitude, and variable in its expression, since both true STelevation and depression were seen. In the series of dogs with15 minute occlusions in which the chest was closed prior toocclusion, the ST segment remained essentially isoelectric(fig. 3). In the dogs with shorter occlusion ST depression wasseen from epicardial recordings, perhaps due to further cool-ing of the epicardial surface during ischemia. Previousstudies have demonstrated that acute ischemia does produceshortening of the action potential. However, shortening ofthe action potential without significant alteration of phase 2appears to occur frequently. This was demonstrated by thefrequent finding of an isoelectric true ST segment duringischemia, indicating that phase 2 relationships were notaltered, even though there had been marked changes in ac-tion potential waveform and downstroke timing as shown byinitially negative T waves becoming positive and peakedduring ischemia.
MV -3
-4
-7
-8
-9
-101 2 3 4
TIME(min)FIGURE 7. The effect ofheart rate on DCpotential changes duringcomplete coronary occlusion. The data arefrom four experiments inwhich 16 electrograms were recorded. Sequential occlusions wereperformed in each animal at atrial paced rates of 120/min and180/min. The sequence of rates during occlusion was random.Mean TQ and ST changes and the standard error are shown. TheTQ depression occurs earlier and to a greater degree during thefastrate. The difference in TQ level is significant at P < 0.001 at eachtime interval during occlusion.
Our results are supported by a study of simultaneous in-tracellular and epicardial electrograms reported byPrinzmetal et al.6 The intracellular recordings showedpredominantly loss of resting membrane potential, smallerchanges in phase 3 timing, and even less change in phase 2duration, amplitude or slope, with the epicardial electro-gram showing corresponding amounts of TQ depression, Twave change and true ST-segment change. In a similarstudy, Samson and Scher also observed both loss of restingpotential and action potential waveform changes, but foundmore variability in the relative magnitude of TQ and ST-segment change, with the magnitude of ST displacementoften exceeding that ofTQ depression.' They also found thattrue ST displacement usually preceded any change in base-line potential. Our results, in contrast, found baseline poten-tial to change first, or the two to occur simultaneously. Bothof these previous studies, among others,'1 12 showed thatepicardial TQ-segment depression was associated with lossof resting membrane potential in the intracellular recording,and that displacement of the true ST segment was associatedwith action potential waveform changes, validating the useof extracellular DC recordings to study these twomechanisms of "ST displacement."
563
by guest on June 7, 2018http://circ.ahajournals.org/
Dow
nloaded from
VOL 56, No 4, OCTOBER 1977
2MIN IN SM5 MIN 6MINCONTROL OCCLUSION occwSN OCCLUSION OCCLUSION120/MIN 12WMIN 12QWN 120/MIN 1MINAT 190
1 MAN AFlTRELEASE
2 MIN 3MI B 5 MIN 6MIN
CONTROL OCCLUSION OCCLUSION OCCLSION OCCLUSI IMIN AFTER
120/MIN 120/MIN 1MN Al ISO 3 MAN AT 160 1 MIN AT 120 RELEAS1
AAAL k u 12 !.WEV~kIAA,< ;
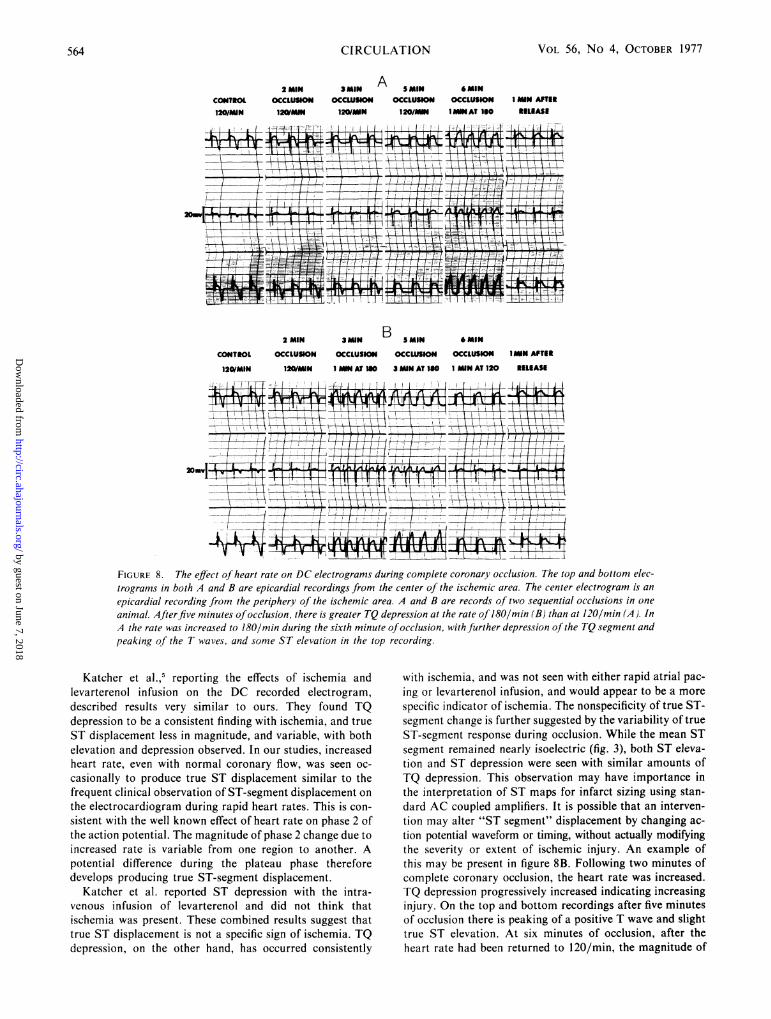
FIGURE 8. The effect of heart rate on DC electrograms during complete coronary occlusion. The top and bottom elec-trograms in both A and B are epicardial recordings from the center of the ischemic area. The center electrogram is anepicardial recording from the periphery of the ischemic area. A and B are records of two sequential occlusions in one
animal. Afterfive minutes ofocclusion, there is greater TQ depression at the rate of 180/min (B) than at 120/min (A). InA the rate was increased to 180/min during the sixth minute ofocclusion, with further depression of the TQ segment andpeaking of the T waves, and some ST elevation in the top recording.
Katcher et al.,5 reporting the effects of ischemia andlevarterenol infusion on the DC recorded electrogram,described results very similar to ours. They found TQdepression to be a consistent finding with ischemia, and trueST displacement less in magnitude, and variable, with bothelevation and depression observed. In our studies, increasedheart rate, even with normal coronary flow, was seen oc-
casionally to produce true ST displacement similar to thefrequent clinical observation of ST-segment displacement on
the electrocardiogram during rapid heart rates. This is con-
sistent with the well known effect of heart rate on phase 2 ofthe action potential. The magnitude of phase 2 change due to
increased rate is variable from one region to another. Apotential difference during the plateau phase thereforedevelops producing true ST-segment displacement.
Katcher et al. reported ST depression with the intra-venous infusion of levarterenol and did not think thatischemia was present. These combined results suggest thattrue ST displacement is not a specific sign of ischemia. TQdepression, on the other hand, has occurred consistently
with ischemia, and was not seen with either rapid atrial pac-ing or levarterenol infusion, and would appear to be a morespecific indicator of ischemia. The nonspecificity of true ST-segment change is further suggested by the variability of trueST-segment response during occlusion. While the mean STsegment remained nearly isoelectric (fig. 3), both ST eleva-tion and ST depression were seen with similar amounts ofTQ depression. This observation may have importance inthe interpretation of ST maps for infarct sizing using stan-dard AC coupled amplifiers. It is possible that an interven-tion may alter "ST segment" displacement by changing ac-tion potential waveform or timing, without actually modifyingthe severity or extent of ischemic injury. An example ofthis may be present in figure 8B. Following two minutes ofcomplete coronary occlusion, the heart rate was increased.TQ depression progressively increased indicating increasinginjury. On the top and bottom recordings after five minutesof occlusion there is peaking of a positive T wave and slighttrue ST elevation. At six minutes of occlusion, after theheart rate had been returned to 120/min, the magnitude of
564 CIRCULATION
by guest on June 7, 2018http://circ.ahajournals.org/
Dow
nloaded from
ISCHEMIC ST DISPLACEMENT/Vincent, Abildskov, Burgess
TQ depression remains the same, indicating, as would be ex-
pected, that the degree of ischemia remained the same.
However, the true ST segments have returned toward thebaseline, and the T waves are lower in amplitude, suggestingthat the true ST changes and some of the T changes duringthe fast rate were not due to increased ischemia but to theeffect of increased heart rate on phase 2 of the action poten-tials. An estimate of the severity of the ischemia based on
total "ST displacement" (TQ and ST) might therefore givemisleading results. In addition, during ischemia the T waves
become positive and often very peaked with rapid ascentfrom the J point into the T wave, giving the appearance ofST elevation. The ST-segment take-off, however, usuallyremains isoelectric and the apparent ST elevation is ar-
tificial. This, too, should be considered as a source of error
in ST-segment mapping. Holland and Brooks,'3 from ex-
perimental data and theoretical concepts using solid angletheorem analysis, have emphasized the very complex rela-tionships of TQ and ST-segment displacement, and thepotential difficulty of interpreting changes in TQ-ST dis-placement secondary to interventions.
Other studies using DC coupling to examine injury poten-tials have shown variable results. Most have suggested bothmechanisms, but of variable relative magnitude and timecourse,'-8 and two studies found only TQ depression.9' " Inthese two studies body surface leads rather than epicardialleads were employed, and injury was produced by topicalepicardial application of KCI rather than by ischemia.Whether these differences in technique account for thevariable results is not known. Alzamora-Castro et al.4 usedboth ischemia and topical KCI to produce injury and showedsimilar changes with both. Cohen et al.,'4 using magnetocar-diography to study the DC shifts with experimentalischemia, found a steady DC current, comparable to TQsegment depression and considered to reflect loss of restingmembrane potential, to account for "ST displacement."There were minor and variable changes in the true ST seg-
ment. They also demonstrated that TQ depression occurredfirst, or TQ and true ST displacement occurredsimultaneously. These results are essentially identical tothose reported in the present study, and the similar resultsobtained using a different technique substantiate the validityof our findings. Though the variable results of previousstudies are not completely explained, it is clear that allstudies have shown TQ-segment depression. The variabilityhas been in the amount and type of true ST displacement.Since action potential waveform can be altered by many fac-tors other than ischemia, it seems likely that differences inthese factors from one study to another account for thevariable results. If this is so, it further indicates the impor-tance of understanding which of the two basic mechanismsof "ST displacement" is really representative of myocardialischemia. As mentioned earlier, we believe the data suggestTQ depression is the more specific indicator of ischemia.The electrocardiographic changes during evolution of an
acute infarction would appear to support this suggestion.Early peaked T waves are seen, similar to these animalstudies, representing shortening of the action potential. "STelevation" then occurs. After approximately 24 hours T-wave inversion begins as the action potentials from the in-jured cells lengthen. The "ST segment" elevation, however,
often persists, even to a prominent degree, during this T-wave change. While it is possible that such prominent actionpotential shortening and lengthening could occur withoutsignificant concomitant change in an abnormal phase 2, itseems more likely that phase 2 was not prominently alteredto begin with, and that "ST displacement" is due to baselinedepression as seen in these animal studies.The studies with partial flow reduction showed subendo-
cardial tissue more vulnerable to develop ischemia in thepresence of coronary flow reduction than epicardial tissue,as has been frequently stated. There has been considerableprevious debate regarding the mechanism of "ST dis-placement" with subendocardial injury."5 16 Our results in-dicate an identical physiologic mechanism to that justdescribed for the ischemia produced by complete occlusion.In the case of subendocardial injury the diastolic injurycurrent would be manifest as TQ depression in a subendo-cardial lead, as was seen, and this would be represented onthe subendocardial AC electrocardiogram as "ST segment"elevation. In a surface lead overlying the injured area, TQelevation would be expected, and in an AC coupled systemthis would appear as "ST depression." The "ST depression"seen during an exercise test or an anginal episode, for exam-ple, would therefore appear to be due to loss of resting mem-brane potential in the subendocardial tissue. TQ elevationwas not seen in this study, however, and areas of "STdepression" at the periphery of the ischemic lesion were notobserved, in contrast to some other studies.8' 15, 16 Themagnitude of subendocardial injury currents which could beobtained in our study was small, and this may account forthe lack of epicardial "reciprocal ST depression." The find-ings with partial flow reduction and alteration of heart ratemay help explain the poor correlation between atrial pacing-induced ST depression and coronary artery disease asdefined by angiography.'7 Rapid atrial pacing, even withnormal flow and no reactive hyperemia following cessationof rapid pacing was seen to produce true ST displacementwithout TQ change. This would appear to be due to the rateeffect on the action potential waveform rather thanischemia. However, on the AC electrocardiogram this trueST change would be indistinguishable from ischemic "ST"change due to TQ displacement.
This study has helped elucidate the mechanisms responsi-ble for "ST displacement" due to early, acute myocardialischemia, and described the magnitude and time course ofthese changes. It must be remembered that in AC recordedelectrocardiograms "ST displacement" due to TQ-segmentchange cannot be differentiated from that due to alterationsof the true ST segment. The results of the present study con-tribute to understanding the mechanisms of "ST dis-placement" due to ischemia but do not themselvesdemonstrate how this can be directly applied in clinicalmedicine. DC recording of the electrocardiogram in patientspresents major technical difficulties and cannot be con-sidered practical at the present time. Further, in the case ofacute myocardial infarction, the baseline potential hasusually been altered prior to initial electrocardiographic ex-amination, and even DC recordings at that time would notestablish whether a baseline or true ST shift had occurred.Some of the clinical areas in which these data might beapplied, however, include the interpretation of ST-segment
565
by guest on June 7, 2018http://circ.ahajournals.org/
Dow
nloaded from
CIRCULATION
changes in acute infarction as a measure of extent andseverity of injury, the interpretation of ST changes duringexercise or rapid atrial pacing, and the relationship of heartrate and partial coronary flow reduction to subendocardialand epicardial ischemia.
Referencesl.Samson WE, Scher AM: Mechanism of ST segment alteration during
acute myocardial injury. Circ Res 8: 780, 19602. Eyster JAE, Meek WJ, Goldberg H, Gilson WE: Potential changes in an
injured region of cardiac muscle. Am J Physiol 124: 717, 19393. Hellerstein HK, Katz LN: The electrical effects of injury at various myo-
cardial locations. Am Heart J 36: 184, 19484. Alzamora-Castro V, Battilana G, Abugattas R: The electrical
manifestations observed in damaged or injured cardiac muscle. An ex-
perimental study. Am Heart J 54: 254, 1957S. Katcher AH, Peirce G, Sayen JJ: Effects of experimental regional
ischemia and Levarterenol on the RS-T segment and baseline of ven-
tricular surface electrocardiograms obtained by direct coupled amplifica-tion. Circ Res 8: 29, 1960
6. Prinzmetal M, Ischikawa K, Nakashima M, Oishi H, Ozkas E,Wakayama J, Baines J: Correlation between intracellular and surfaceelectrocardiograms in acute myocardial ischemia. J Electrocardiol 1:161, 1968
7. Taccardi B: Changes in cardiac electrogenesis following coronary occlu-sion. In International Symposium on the Coronary Circulation and
VOL 56, No 4, OCTOBER 1977
Energetics of the Myocardium, edited by Marchetti G, Taccardi B. Basil,Karger, 1967, p 259
8. Bruyneel KJJ: Use of moving epicardial electrodes in defining ST-segment changes after acute coronary occlusion in the baboon. Relationto primary ventricular fibrillation. Am Heart J 89: 731, 1975
9. Nahum LH, Hamilton WF, Hoff HE: The injury current in the electro-cardiogram. Am J Physiol 139: 202, 1943
10. Donoso E, Wachtel F, Grishman A: Polarity of the ST vector. Am JPhysiol 189: 219, 1957
11. Wallace AG: Effects of ischemia on the action potential. In: Effect ofAcute Ischemia on Myocardial Function, edited by Oliver M, Julian DG,Donald KW. Edinburgh, Livingstone, 1972, pp 129-141
12. Wittig JH, Williams EMV: Mechanism of decrease of ST elevation bypropranolol in ischemic myocardium. Circulation 54 (suppl II): II-15,1976
13. Holland RP, Brooks H: Precordial and epicardial surface potentials dur-ing myocardial ischemia in the pig. Circ Res 37: 471, 1975
14. Cohen D, Kaufman LA: Magnetic determination of the relationshipbetween the S-T segment shift and the injury current produced by cor-onary artery occlusion. Circ Res 36: 414, 1976
15. Kato K, Hitoshi F, Koyama S: Depression of the ST segment in epicar-dial electrocardiogram associated with experimental major coronaryartery occlusion. J Electrocardiol 1-2: 167, 1968
16. Ekmekci A, Toyoshima H, Kwoczynski JK, Nagaya T, Prinzmetal M:Angina Pectoris. IV. Clinical and experimental difference betweenischemia with ST elevation and ischemia with ST depression. Am J Car-diol 7: 412, 1961
17. Kelemen MH, Gillilan RE, Bouchard RJ, Heppner RL, Warbasse JR:Diagnosis of obstructive coronary disease by maximal exercise and atrialpacing. Circulation 48: 1227, 1973
Sudden Death after Repair ofTetralogy of Fallot
Electrocardiographic and Electrophysiologic Abnormalities
PAUL C. GILLETTE, M.D., MARK A. YEOMAN, M.D.,CHARLES E. MULLINS, M.D., AND DAN G. MCNAMARA, M.D.
SUMMARY In order to try to determine the mechanism of sud-den death in patients after surgical repair of tetralogy of Fallot, elec-trocardiographic, intracardiac electrophysiologic, and clinical dataof 51 children who had postoperative intracardiac electrophysiologicstudies were reviewed. Ninety-four percent had developed right bun-dle branch block (RBBB) and 16 percent had additional left anteriorhemiblock (LAH). Two had had transient complete A-V block(CAVB) and one had permanent CAVB. Six had a first degree A-Vblock and nine had premature ventricular contractions (PVC).
Nine patients were found to have prolonged intra-atrial conduc-tion times, four prolonged A-V nodal conduction, four prolonged His-Purkinje conduction, and five prolonged corrected sinus node
ALTHOUGH SURGICAL REPAIR of tetralogy of Fallotresults in an improvement in the duration and quality of lifefor most patients, late sudden deaths are known to occur."'The cause of these deaths has been thought to be dysrhyth-
From the Section of Cardiology, Department of Pediatrics, Baylor Collegeof Medicine and Texas Children's Hospital, Houston, Texas.
Supported in part by Grant HL-5756 from the NIH and by USPHS GrantRR-00188 from the General Clinical Research Branch, NIH.Address for reprints: Paul C. Gillette, M.D., Section of Pediatric Car-
diology, Texas Children's Hospital, 6621 Fannin, Houston, Texas 77030.Received April 11, 1977; revision accepted May 30, 1977.
recovery times. Patients with first degree A-V block or LAH did nothave an increased incidence of abnormalities on electrophysiologicstudy.No patient with RBBB and LAH developed complete A-V block or
died. Three of the nine patients with PVCs died, one of intractableventricular fibrillation and two suddenly, presumably of dysrhyth-mia. All three had significant congestive heart failure.
Although late complete A-V block occurs and should be watchedfor, ventricular dysrhythmias in patients with PVCs may be the causeof most sudden deaths after tetralogy repair. We currently are treat-ing all of our postoperative tetralogy patients who have PVCs withquinidine or propranolol.
mias. There is a question as to whether ventricular tachy-dysrhythmias, complete atrioventricular block, or sick sinussyndrome is the cause.'-"
Intracardiac repair of tetralogy of Fallot carries the riskof damage to impulse generating or conducting system as a
result of surgical incision, cannulation or suture. The objectof this investigation was to use surface electrocardiography,His bundle electrography, atrial pacing, and the atrial extra-stimulus technique to study electrophysiological propertiesof the sinoatrial node, atria, atrioventricular node, His-Purkinje system and ventricles after intracardiac repair of
566
by guest on June 7, 2018http://circ.ahajournals.org/
Dow
nloaded from
G M Vincent, J A Abildskov and M J Burgessrecordings.
Mechanisms of ischemic ST-segment displacement. Evaluation by direct current
Print ISSN: 0009-7322. Online ISSN: 1524-4539 Copyright © 1977 American Heart Association, Inc. All rights reserved.
is published by the American Heart Association, 7272 Greenville Avenue, Dallas, TX 75231Circulation doi: 10.1161/01.CIR.56.4.559
1977;56:559-566Circulation.
http://circ.ahajournals.org/content/56/4/559.citationthe World Wide Web at:
The online version of this article, along with updated information and services, is located on
http://circ.ahajournals.org//subscriptions/
is online at: Circulation Information about subscribing to Subscriptions:
http://www.lww.com/reprints Information about reprints can be found online at: Reprints:
document. Permissions and Rights Question and Answer information about this process is available in the
located, click Request Permissions in the middle column of the Web page under Services. FurtherEditorial Office. Once the online version of the published article for which permission is being requested is
can be obtained via RightsLink, a service of the Copyright Clearance Center, not theCirculationpublished in Requests for permissions to reproduce figures, tables, or portions of articles originallyPermissions:
by guest on June 7, 2018http://circ.ahajournals.org/
Dow
nloaded from