Embed Size (px)
Citation preview

Page 1/31
Meta-analysis of tumor and T cell intrinsicmechanisms of sensitization to checkpointinhibitionKevin Litch�eld
Cancer Evolution and Genome Instability Laboratory, The Francis Crick InstituteJames L. Reading
Cancer Immunology Unit, Research department of Haematology, University College London CancerInstituteClare Puttick
Cancer Evolution and Genome Instability Laboratory, The Francis Crick InstituteChris Abbosh
Cancer Evolution and Genome Instability Laboratory, The Francis Crick InstituteRobert Bentham
Cancer Research UK Lung Cancer Centre of Excellence, University College London Cancer InstituteThomas B. K. Watkins
Cancer Evolution and Genome Instability Laboratory, The Francis Crick InstituteRachel Rosenthal
Cancer Evolution and Genome Instability Laboratory, The Francis Crick InstituteDhruva Biswas
Cancer Evolution and Genome Instability Laboratory, The Francis Crick InstituteEmilia Lim
Cancer Evolution and Genome Instability Laboratory, The Francis Crick InstituteMaise AL-Bakir
Cancer Evolution and Genome Instability Laboratory, The Francis Crick InstituteVirginia Turati
Department of Cancer Biology, University College London Cancer InstituteJosé Afonso Guerra-Assunção
Bill Lyons Informatics Centre, University College London Cancer InstituteLucia Conde
Bill Lyons Informatics Centre, University College London Cancer InstituteAndrew J.S. Furness
Renal and Skin Units, The Royal Marsden HospitalSunil Kumar Saini
Department of Health Technology, Technical University of Denmark

Page 2/31
Sine R Hadrup Department of Health Technology, Technical University of Denmark
Javier Herrero Bill Lyons Informatics Centre, University College London Cancer Institute
Andrew Rowan Cancer Evolution and Genome Instability Laboratory, The Francis Crick Institute
Tariq Enver Department of Cancer Biology, University College London Cancer Institute
Matthew D. Hellmann Thoracic Oncology Service, Division of Solid Tumor Oncology, Department of Medicine, Memorial Sloan
Kettering Cancer CenterJames Larkin
Thoracic Oncology Service, Division of Solid Tumor Oncology, Department of Medicine, Memorial SloanKettering Cancer CenterSamra Turajlic
Cancer Dynamics Laboratory, The Francis Crick InstituteSergio Quezada
Cancer Immunology Unit, Research department of Haematology, University College London CancerInstituteNicholas McGranahan ( [email protected] )
Cancer Research UK Lung Cancer Centre of Excellence, University College London Cancer InstituteCharles Swanton ( [email protected] )
Cancer Evolution and Genome Instability Laboratory, The Francis Crick Institute
Research Article
Keywords: biomarkers, immunotherapy, checkpoint inhibitors, meta-analysis
Posted Date: September 16th, 2020
DOI: https://doi.org/10.21203/rs.3.rs-76468/v1
License: This work is licensed under a Creative Commons Attribution 4.0 International License. Read Full License
Version of Record: A version of this preprint was published at Cell on February 1st, 2021. See thepublished version at https://doi.org/10.1016/j.cell.2021.01.002.
Page 3/31
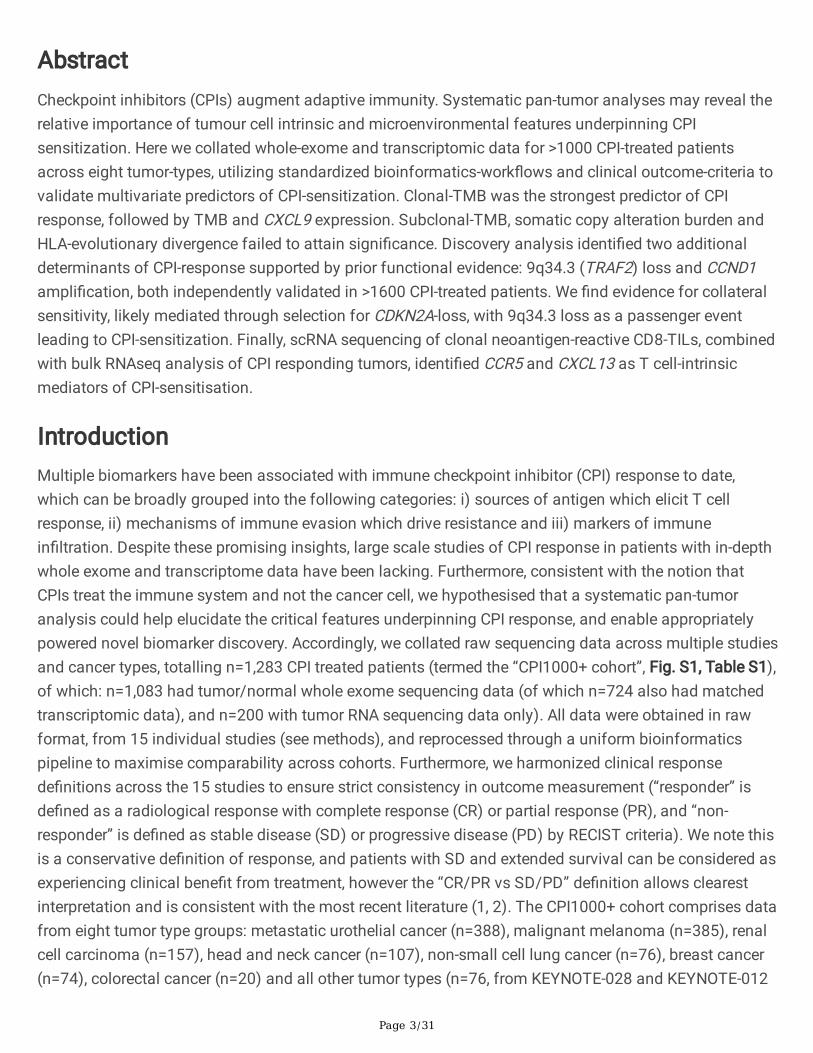
AbstractCheckpoint inhibitors (CPIs) augment adaptive immunity. Systematic pan-tumor analyses may reveal therelative importance of tumour cell intrinsic and microenvironmental features underpinning CPIsensitization. Here we collated whole-exome and transcriptomic data for >1000 CPI-treated patientsacross eight tumor-types, utilizing standardized bioinformatics-work�ows and clinical outcome-criteria tovalidate multivariate predictors of CPI-sensitization. Clonal-TMB was the strongest predictor of CPIresponse, followed by TMB and CXCL9 expression. Subclonal-TMB, somatic copy alteration burden andHLA-evolutionary divergence failed to attain signi�cance. Discovery analysis identi�ed two additionaldeterminants of CPI-response supported by prior functional evidence: 9q34.3 (TRAF2) loss and CCND1ampli�cation, both independently validated in >1600 CPI-treated patients. We �nd evidence for collateralsensitivity, likely mediated through selection for CDKN2A-loss, with 9q34.3 loss as a passenger eventleading to CPI-sensitization. Finally, scRNA sequencing of clonal neoantigen-reactive CD8-TILs, combinedwith bulk RNAseq analysis of CPI responding tumors, identi�ed CCR5 and CXCL13 as T cell-intrinsicmediators of CPI-sensitisation.
IntroductionMultiple biomarkers have been associated with immune checkpoint inhibitor (CPI) response to date,which can be broadly grouped into the following categories: i) sources of antigen which elicit T cellresponse, ii) mechanisms of immune evasion which drive resistance and iii) markers of immunein�ltration. Despite these promising insights, large scale studies of CPI response in patients with in-depthwhole exome and transcriptome data have been lacking. Furthermore, consistent with the notion thatCPIs treat the immune system and not the cancer cell, we hypothesised that a systematic pan-tumoranalysis could help elucidate the critical features underpinning CPI response, and enable appropriatelypowered novel biomarker discovery. Accordingly, we collated raw sequencing data across multiple studiesand cancer types, totalling n=1,283 CPI treated patients (termed the “CPI1000+ cohort”, Fig. S1, Table S1),of which: n=1,083 had tumor/normal whole exome sequencing data (of which n=724 also had matchedtranscriptomic data), and n=200 with tumor RNA sequencing data only). All data were obtained in rawformat, from 15 individual studies (see methods), and reprocessed through a uniform bioinformaticspipeline to maximise comparability across cohorts. Furthermore, we harmonized clinical responsede�nitions across the 15 studies to ensure strict consistency in outcome measurement (“responder” isde�ned as a radiological response with complete response (CR) or partial response (PR), and “non-responder” is de�ned as stable disease (SD) or progressive disease (PD) by RECIST criteria). We note thisis a conservative de�nition of response, and patients with SD and extended survival can be considered asexperiencing clinical bene�t from treatment, however the “CR/PR vs SD/PD” de�nition allows clearestinterpretation and is consistent with the most recent literature (1, 2). The CPI1000+ cohort comprises datafrom eight tumor type groups: metastatic urothelial cancer (n=388), malignant melanoma (n=385), renalcell carcinoma (n=157), head and neck cancer (n=107), non-small cell lung cancer (n=76), breast cancer(n=74), colorectal cancer (n=20) and all other tumor types (n=76, from KEYNOTE-028 and KEYNOTE-012

Page 4/31
studies), treated with three classes of CPI: anti-CTLA4 (n=176), anti-PD-1 (n=487) and anti-PD-L1 (n=620).Samples were almost exclusively baseline pre-treatment specimens, and treatment was single agent CPI(see Table S1 for rare exceptions). Finally, as a validation cohort we obtained variant called format andcopy number segment data from n=1600 cases from CPI treated patients pro�led using the MSK-IMPACTpanel (3, 4) (referred to hereafter as the MSK1600 cohort).
ResultsBenchmarking of previously published biomarkers of CPI response
We began analysis by benchmarking a comprehensive list of previously published CPI responsebiomarkers, grouped into the three distinct categories: “sources of antigen”, “drivers of immune escape”and “markers of immune in�ltration” (Fig. 1A). To allow biomarkers with varying measurement scales(e.g. mutation counts vs gene expression values) to be compared equivalently based on effect size ratherthan p-value (5), all biomarker values were converted to standard z-scores (i.e. mean normalised to equalzero, and standard deviation normalised to one). We note this same z-score approach has been similarlyapplied in other large-scale TMB projects (6), and as a control all analyses were repeated without z-scoreconversion and the top-ranked biomarkers were found to be the same. As an additional quality controlcheck, we assessed for any technical correlations between mutation counts and purity, sequencingcoverage or exome capture kit, and did not observe any signi�cant relationships (Fig. S2, Fig. S3). Inaddition, we utilised germline SNP analysis to ensure no sample duplications (Fig. S4), as well utilisingusing the deTiN tool (7) to ensure no tumor in normal contamination (see methods). Finally, to avoid datapooling and to preserve the clarity of potential drug or histology speci�c effects, each biomarker in eachstudy was analysed individually and then the effect sizes/standard errors were combined only throughmeta-analysis (Fig. 1A).
The biomarker with strongest effect size across all 15 studies in the CPI1000+ cohort was the clonaltumor mutation burden ((Clonal TMB), i.e. number of non-synonymous mutations in every cancer cell)(Odds Ratio for “CR/PR” vs “SD/PD” = 1.88, 95% con�dence interval [1.52 – 2.33], p=8.08 x 10⁻⁹), closelyfollowed by standard TMB (OR = 1.84, [1.47 – 2.28], p=4.11 x 10⁻⁸). Subclonal mutation burden(Subclonal TMB) was not signi�cantly associated with CPI response (OR = 1.15 [0.96 – 1.39, p=0.12]),indicating the dominant association of CPI response is with clonal mutational burden. Within the“sources of antigen” category, other biomarkers frameshift insertion/deletion burden (indel TMB) (OR =1.36, [1.11 – 1.66], p=3.32 x 10⁻³), nonsense mediated decay escaping fs-indel burden (OR = 1.37, [1.16 –1.61], p=2.19 x 10⁻⁴) and SERPINB3 mutations (OR = 1.32, [1.10 – 1.58], p=3.03 x 10⁻³) were allsigni�cantly associated with CPI response, while DNA damage response pathway mutations were not (OR= 1.11 [0.92 – 1.34, p=0.29]). With regard to “drivers of immune escape”, we observed no associationbetween the level of somatic copy number alteration (SCNA), measured using the weighted genomeinstability index (wGII) (8), and CPI response (OR = 1.08 [0.92 – 1.26], p=0.34). We also did not observe asigni�cant association between the level of HLA-I evolutionary divergence (9) (OR = 0.9, [0.8 – 1.1],p=0.35) in the combined meta-analysis. Intriguingly, loss of heterozygosity at the human leukocyte

Page 5/31
antigen locus (10) (LOHHLA) had a borderline association with improved chances of CPI response (OR =1.2, [1.0 – 1.4, p=2.4 x 10⁻²), possibly re�ecting the fact that LOHHLA is found at higher frequency in hotversus cold tumors (11). Similarly, sex was found to have a borderline association (OR = 1.2, [1.0 – 1.4,p=5.0 x 10⁻²), in the same direction as originally published (12) with male patients experiencing betterresponse rates. B2M, PTEN, JAK1/JAK2 and receptor tyrosine kinases pathway mutations did not reachoverall signi�cance, despite showing strong effect size in some individual cohorts (see Fig. 1A), nor didthe ITH Shannon diversity index (OR = 0.9, [0.8 – 1.2], p=0.70) (13) . Histology speci�c mutationpredictors such as STK11 and PBRM1 were not tested in this pan-cancer meta-analysis. In the “markersof immune in�ltration” category, we observe CXCL9 expression as the predictor with strongest effect size(OR = 1.72, [1.40 – 2.10], p=1.88 x 10⁻⁷), followed by signi�cant associations for the T cell in�amed geneexpression signature (14) (OR = 1.51, [1.24 – 1.84], p=5.98 x 10⁻⁵), CD8 effector signature (15) (OR = 1.42,[1.18 – 1.72], p=2.87 x 10⁻⁴) and PD-L1 expression level (OR = 1.27, [1.03 – 1.53], p=2.28 x 10⁻²). CXCL9 isa critical chemokine that binds CXCR3 on T cells, enhancing recruitment of cytotoxic CD8+ T cells intothe tumor (16) and promoting the differentiation of in�ammatory Th1 and Th17 CD4 T cells (17).
We note the lack of association for a number of these biomarkers does not rule out an importantunderlying biological role for these processes in determining CPI response. Instead, these data re�ect theuniversal predictors of CPI response, with evidence of predictive utility across multiple tumor types.Furthermore, the rare frequency of many mutational events (e.g. B2M mutations/deletions were foundonly in 1.4% of cases) meaning larger sample sizes are likely required to con�rm the role of these eventsin determining CPI response. In addition, the level of correlation between subsets of biomarkers shouldalso be noted, in particular mutation metrics (e.g. TMB vs Clonal TMB) and markers of immunein�ltration (e.g. CD8A vs CXCL9) have high degrees of correlation (Fig. 1B). The correlation betweenseparate biomarker categories is generally low however (e.g. “sources of antigen” are largely notcorrelated with “markers of immune in�ltration”), suggesting potential non-redundant utility in combiningmultiple makers together into a multi-variate test. We also observed a negative correlation betweensubclonal mutation burden and all measures of immune in�ltration (e.g. subclonal TMB was negativelycorrelated with CD8 effector signature, rho = -0.18, p=2.2 x 10⁻⁶), which is consistent with recentfunctional work highlighting the immunosuppressive effect of a high subclonal mutation burden (13)(Fig. 1C). Next we assessed for any evidence of variation in biomarker predictive utility across histologyor drug types. We found three signi�cant interactions (Fig. S6), the �rst being between histology andTMB/Clonal TMB, with the predictive effect size of TMB being signi�cantly lower in melanoma ascompared to bladder cancer (p=4.8 x 10⁻³) (Fig. S6). This likely re�ects the universally high level ofTMB/Clonal TMB in melanoma due to historic UV exposure, and hence it’s reduced discriminatory powerin predicting CPI response. Similarly, we also observed a signi�cantly lower odds ratio effect size forCXCL9 expression in melanoma as compared to bladder cancer (p=3.3 x 10⁻²) (Fig. S6), which may re�ectgenerally higher levels of in�ltration. Thirdly, SERPINB3 mutations were found to have signi�cantly highereffect size in anti-CTLA4 versus anti-PD-1/L1 cohorts (p=3.9 x 10⁻²) (Fig. S6), which may re�ect uniquebiology or be a consequence of the fact this association was originally discovered in the early anti-CTLA4

Page 6/31
cohorts. Finally, we quanti�ed the total proportion of variance in CPI response that could be explained byall 15+ genomic and transcriptomic biomarkers, which for most studies gave a value of ~0.4, suggestingthat over half of the factors determining CPI outcome are either still to be discovered, or lie outside of theexome/transcriptome (Fig. 1C, values calculated using logistic regression pseudo-R2).
A multivariate predictor of CPI response
Given the complexity of the CPI biomarker landscape, we next explored if biomarkers could be combined,and converted into a simple, single score predicting the overall likelihood of CPI response with maximumaccuracy. For this analysis we utilised the largest cohort of matched exome and transcriptome data foreach tumor type (bladder: Mariathasan et al. NATURE 2018 (n=169), head and neck: Cristescu et al.SCIENCE 2018 (n=97), melanoma: Cristescu et al. SCIENCE 2018 (n=83) and renal: McDermot et al.NMED 2018 (n=57)). In total across these four cohorts n=406 samples were available for analysis, andtumor types with n<=50 samples with exome and transcriptome data (e.g. breast, lung, CRC) wereexcluded from the analysis on account of insu�cient power. To derive a single accurate scoreencompassing information from multiple biomarkers, we utilised machine learning algorithm XGBoost(see methods) to construct a multivariate predictive model. The multivariate model was trained using allbiomarkers achieving overall signi�cance in the Fig. 1 meta-analysis (total 12 features), namely: TMB,Clonal TMB, Indel TMB, NMD-escape TMB, T cell in�amed and CD8 Effector expression signatures,Gender, SERPINB3 mutation status, LOHHLA, and gene expression values for CD274 (PD-L1), CD8A andCXCL9.
To benchmark performance of our multivariate model we calculated area under the receiver operatorcharacteristic curve (AUC) values, for both our multivariate predictor, and a univariate predictive modelcontaining TMB only. For both models AUC scores were calculated in unseen samples (taken from arandom 25% sub-sample of each cohort held back from model training), and the distribution of scoreswas derived using Monte Carlo sampling (n=1000 simulation rounds). In all four cohorts signi�cantlyhigher AUC values were obtained in the multivariate versus TMB models: bladder cohort (meanmultivariate AUC = 0.73, TMB AUC = 0.70, p=3.1 x 10⁻¹⁵), head & neck (multivariate AUC = 0.71, TMB AUC= 0.52, p<2.22 x 10⁻¹⁶), melanoma (multivariate AUC = 0.62, TMB AUC = 0.59, p=9.0 x 10⁻⁸) and renal(multivariate AUC = 0.68, TMB AUC = 0.56, p<2.22 x 10⁻¹⁶) (Fig. 2A). We note the relative importance ofeach biomarker (feature) varied by study (Fig. 2B), although predominantly TMB/Clonal TMB and CXCL9expression had the strongest weighting, in-line with the meta-analysis results.
In accordance with diagnostic accuracy best practice standards (e.g. STARD guidelines (18)), we nextsought to test the �nal parameterized multivariate and TMB predictors in independent cohorts of testsamples not used in any of the model training steps. For this purpose two test cohorts were availablewith exome and transcriptomic data: i) test cohort 1 was taken from KEYNOTE-028, a set of pan-tumorsamples from Cristescu et al. SCIENCE 2018 (n=76), and ii) test cohort 2 was taken from a recentlyreleased cohort from University Hospital Essen of melanoma samples, published Liu et al. NMED 2019(n=121). In the pan-tumor cohort, the multivariate predictor attained an AUC value of 0.86, signi�cantly

Page 7/31
higher than the TMB model with AUC = 0.59 (p=0.0096, Fig. 2C). Similarly, a signi�cantly betterperformance was observed for the multivariate model in the Liu et al. melanoma cohort with AUC=0.67,compared to the TMB model with AUC=0.54 (p=0.034, Fig. 2C). Thus in summary, a multivariate modelwas found to signi�cantly out-perform TMB as a predictor of CPI response across six cohorts, totalling>600 samples.
While demonstrating superior performance, AUC values may still not be su�cient for broad scale clinicalutility as a binary treatment strati�er. However, we reasoned there may be subsets of the patientpopulation that could be identi�ed with clinically relevant likelihoods of response. Accordingly we splitthe data into quartiles, allocating the lowest 25% of multivariate scores as “low” likelihood of response,the highest 25% as “high” likelihood, and the middle two quartiles as “medium” likelihood. In the twoindependent test cohorts (total n=197) the response rates (%PR/CR) per group were: “low” = 4.1%,“medium” = 33.0% and “high” = 50.0%. In certain clinical contexts, a reliable multivariate score of “low”with response rates in the range 0-5% may support consideration of alternative treatment or clinical trialoptions, and conversely a “high” score of =>~50% may support CPI treatment.
Loss of 9q34.3 sensitizes tumors to CPI response
Acknowledging the current set of published biomarkers provide only a partial explanation of CPIresponse, we next undertook discovery work to search for novel pan-cancer predictors of response in theCPI1000+ cohort. Accordingly, we undertook a genome-wide somatic copy number analysis in theCPI1000+ sample set, to search for genomic loci associated with CPI response. The reasoning for this isthat although the total burden of SCNAs was not found to predict response (Fig. 1A), there are likely to bespeci�c loci which can act in either direction to drive resistance or sensitization to therapy. The frequencyof somatic copy number gains and losses was tracked across the genome for all CPI responders (CR/PR)(n=261) and non-responders (SD/PD) (n=746) (Fig. 3A), and frequency differences were compared percytoband (Fig. 3B). The most signi�cantly differential cytoband was 9q34, which was lost in responderswith a frequency of 44.1% compared to non-responders with 31.0% (p=2.0 x 10⁻⁴, q=0.06, CPI1000+cohort) (Fig. 3B). Hence, loss of 9q34 is associated with sensitization to CPI therapy. Fine mapping ofthis locus revealed a sharp peak in the frequency difference at 9q34.3, directly overlapping the geneTRAF2 (Fig. 3C). Remarkably, TRAF2 has been independently identi�ed in recent functional work byVredevoogd et al. (Cell, 2018) (19) as the top hit in a genome wide CRISPR screen, for genes which whenknocked out sensitize tumor cells to T cell-mediated elimination. Mechanistically, TRAF2 loss was shownto enhance CPI e�cacy by lowering the tumor necrosis factor (TNF) cytotoxicity threshold and increasingT cell-mediated tumor cell apoptosis (19). The high frequency of 9q34.3 (TRAF2) loss in CPI respondingtumors (44.1%), raises the prospect of identi�cation of a novel and reasonably sized group of patientssuitable for CPI. TRAF2 loss was found to be signi�cantly enriched in responders in the overall pan-cancer cohort (p=2.0 x 10⁻⁴), as well as urothelial cancer (p=5.0 x 10⁻³), melanoma (p=3.0 x 10⁻²) and allother tumor types (p=5.0 x 10⁻²) as individual cohorts (Fig. 3D). Overall tumors with 9q34.3 loss had anOR=1.7 [1.3 – 2.3] (p=2.9 x 10⁻⁴) improved likelihood of response to CPI (Fig. 3F).

Page 8/31
The high frequency of 9q34.3 loss raises an important evolutionary question, as to why tumors would beselected with a potentially disadvantageous event. Detailed inspection of the 9q34.3 loss events revealedthat the majority of cases were in fact whole chromosome 9 losses, and analysis of independent TCGAdata for the same eight histologies considered in the CPI1000+ cohort revealed that loss of chromosome9 is the most frequent whole chromosome (p+q) loss event (Fig. 3E). Chromosome 9 contains a numberof tumor suppressor genes, with loss of CDKN2A (9p21.3) in particular being under strong positiveselection and associated with aggressive tumor growth in multiple tumor types . By contrast loss ofTRAF2 is not documented as a cancer driver event (e.g. not listed in the Cancer Gene Census,https://cancer.sanger.ac.uk/census), and hence loss of this gene is likely carried along as passengerevent (Fig. 3F) until CPI treatment, where it has potential to drive anti-tumor T cell activity (19).Supporting a likely functional role for TRAF2 loss we also observe higher rates of immune evasion events(i.e. antigen presentation pathway defects) in TRAF2 loss tumors compared to wildtype (Fig. 3H), whichhighlights heightened immune pressure in TRAF2 loss tumors (p=1.2x10⁻⁸). Hence these data suggest anevolutionary model where loss of whole chromosome 9 is selected as a potent driver event in a pre-CPI-treatment context (e.g. due to CDKN2A), but then the phenotypic effect of this event switches under CPItherapy to create a collateral sensitivity (22) to immunotherapy (due to TRAF2 loss) (Fig. 3F). Accordingly,tumors with loss of chromosome 9p only (or partial 9q loss not encompassing TRAF2) will have thebene�t of driver events such as CDKN2A loss but escape the sensitization to CPI therapy. To validate thismodel we conducted overall survival analysis using the independent MSK1600 cohort of CPI treatedpatients to compare tumors with (n=188) and without (n=58) 9q34.3 (TRAF2) loss, controlled for 9pstatus (due to the known strong survival effect of 9p loss in a general context). Indeed, overall survival inCPI treated patients was signi�cantly longer for the 9q34.3 (TRAF2) loss vs no loss group (hazard ratio(HR) = 0.61 [0.42 – 0.88], p=9.1 x 10⁻³) (Fig. 3G). We note radiological response labels are not availablefor the MSK1600 cohort, however as a negative control to ensure the effect of 9q34.3 (TRAF2) loss wasspeci�c to CPI treatment we repeated the analysis in patients pro�led with the same MSK-IMPACT panelbut who were not treated with CPI therapy, and found no survival difference (HR=1.1 [0.9-1.2], p=0.44)(Fig. S7).
Focal ampli�cation of CCND1 associates with CPI resistance
Next, we considered focal (<3Mb) ampli�cations (de�ned as copy number (cn) => 5) and homozygousdeletions (cn=0) in oncogenes and tumor suppressor genes, to understand if these events are associatedwith CPI response. We found signi�cantly lower rates of CPI response in tumors with CCND1ampli�cation (response rate = 16.3%) compared to wildtype (26.5%) (p=5.0 x 10⁻², Fig. 4A). Similarly toTRAF2, strong prior functional evidence supports a role for CCND1 in determining CPI response (23)demonstrating that PD-L1 protein abundance �uctuates during cell cycle progression and that Cyclin D-CDK4 negatively regulates PD-L1 protein stability. Hence, CCND1 ampli�cation would be expected todown-regulate PD-L1 abundance. Indeed, in cases where we have PD-L1 immunohistochemistry data (1)we see 68.9% (n=16) of CCND1 ampli�ed tumors scoring TC0. Urothelial cancer had the highest numberof CCND1 ampli�ed tumors (Fig. 4B); accordingly we assessed mRNA levels in this histology type and

Page 9/31
observed signi�cantly higher levels of CCND1 expression in urothelial cancer non-responders (SD/PD)versus responders (PR/CR) (p=1.5 x 10⁻²) (Fig. 4C). To validate the effect of CCND1 ampli�cation in anindependent cohort, we conducted overall survival analysis in n=185 urothelial cancer patients treatedwith CPI in the MSK1600 cohort and observed a strong effect size whereby CCND1 ampli�cation wasassociated with signi�cantly shorter overall survival (HR=3.5 [1.7 – 7.0], p=4.2 x 10⁻⁴)(Fig. 4D). To excludethe possibility that CCND1 ampli�ed tumours have a poorer prognosis in the absence of CPI therapy, weobserved no overall survival difference in MSK-IMPACT urothelial cancer patients not treated with CPI(p=n.s.) (Fig. 4E). Finally, we assessed the role of CCND1 ampli�cation in a pan-cancer context inMSK1600, and found a signi�cant association with reduced overall survival in CPI treated patients(HR=1.9 [1.2 – 2.9], p=3.5 x 10⁻³) (Fig. 4F), but not the non-CPI treated cohort (p=n.s.)(Fig. 4G).
CXCL13 and CCR5 are strongly up-regulated in clonal neoantigen reactive CD8 TILs and CPI respondersin the CPI1000+ cohort
The association of clonal mutation burden as the biomarker with strongest effect size in the CPI1000+cohort implicates a central role for neoantigen speci�c T cells in recognising clonal neoantigens anddriving the anti-tumour response post immunotherapy. To examine whether genes expressed by clonalneoantigen-reactive T cells could help further elucidate the drivers of CPI response we performed singlecell RNAseq on ex-vivo CD8 TILs from a treatment-naïve NSCLC patient (L011) sorted according to aclonal neoantigen (MTFR2) multimer (as previously described (24)). 864 genes were signi�cantly up-regulated in multimer positive (Mult+) cells relative to multimer negative (Mult-) cells from the sameregion (Fig. 5A) including markers of activation (e.g. HLA-DOA, HLA-DQB1, HLA-DMB, HLA-DQB2, CD38),cell-cycle (CHAF1B, CDK4, CDS1B), transcription factors associated with persistence/differentiation(RUNX2) and sensitivity to CPI (BCL-6) in memory T cells, genes related to T cell tra�cking and activationin the TME or draining LN (CCR5), hallmarks of tumour speci�c T cell dysfunction (CXCL13, IL-10, IL27RA,FAS, MYO7A), transcriptional repressors of IL-2 production (IKZF3) and negative regulators of TCRsignalling (SLA2) (Fig. 5B). Several genes encoding established immune co-receptors and inhibitorymolecules were up-regulated in Mult+ but were non-signi�cant after adjustment (TNFRSF18, CD27,HAVCR2, ENTPD1). Of the genes signi�cantly enriched in Mult+ cells (>2-fold up-regulation and pAdj<0.05), 101 were also signi�cantly up-regulated in responders (“CR/PR”) versus non-responders(“SD/PD”) in the CPI1000+ cohort dataset (p<0.05) (Fig. 5B). CXCL13 exhibited the strongest level of up-regulation in CPI responders (Fig. 5C) and was the second highest differentially expressed gene in Mult+cells (Log2FC=13.4 vs Mult-, p=0.0047) (Fig. 5A-C). Similarly, expression of the chemokine receptor CCR5was signi�cantly higher in Mult+ cells (Log FC=8.9 vs Mult-, p=0.002)) and in patients with CPI response(Fig. 5A-C). Other notable genes signi�cantly up-regulated in both Mult+ cells, and responders in theCPI1000+ cohort, included co-stimulatory molecules targeted by immunotherapeutic antibodies underclinical investigation (ICOS), MHC II presentation machinery and glycoprotein enzymes up-regulatedduring T cell activation (e.g. HLA-DOA, HLA-DMB, CD38), negative regulators of T cell function (SLA2,IKZF3), loci associated with predisposition to autoimmunity (NCF1, EPSTI1, PARP9) or allograft rejection(GBP4), regulators of type I IFN signalling (FBX06) and genes involved in DNA replication or cell cycle

Page 10/31
(e.g. CHAF1B, MCM4, MCM6, ZWILCH) (Fig. 5B). Given that previous reports have linked the presence ofCXCL13-secreting PD1hi, dysfunctional T cells to CPI response (25) we next evaluated whether publishedgene signatures of exhausted (Tex) were associated with outcome in the CPI1000 cohort. Four out of fourhuman CD8 Tex signatures signi�cantly correlated with response (“CR/PR”), to a similar extent to thatseen for the CD8 effector T cell signature (Fig. S8). Interestingly, the molecular pro�le of murine T cellsreversibly (day 8) but not irreversibly (day 34) committed to a chronic neoantigen-induced dysfunctionalstate was also linked with improved CPI outcome (Fig. S8). These data suggest that transcripts andmolecular circuits expressed in neoantigen-speci�c T cells related to chemotaxis, antigen-engagementand T cell exhaustion may help to identify patients that will bene�t from CPI and allude to potentialimmunological networks that confer sensitivity of tumours to immunotherapy.
DiscussionHere we present meta-analysis across >1000 patients to assess the reproducibility of CPI responsepredictors across eight different tumor types. Although clonal TMB and TMB were strongly correlated,clonal TMB emerged as the predictor with strongest effect size and subclonal TMB had no signi�cantassociation, substantiating the role of clonality in driving optimal immune control. In terms of markers ofimmune in�ltration, CXCL9 expression had highest ranking effect size, outperforming CD8 effector and Tcell in�amed signatures. Subclonal TMB and SCNA burden were both found to have no signi�cantassociation with CPI response. We also failed to �nd consistent evidence of association with responsefor a number of other putative predictors, including HLA-I evolutionary divergence scores as well as anumber of gene level mutation events. The failure of individual markers to reach signi�cance across alleight tumor types does not rule out their importance in speci�c histology or drug contexts, nor underminepotential biological relevance.
To realize the full clinical utility of biomarker strati�cation in immunotherapy treated patients, progress isrequired in two areas: i) the array of biomarkers identi�ed in a research context needs to be simpli�ed intoa single clinical grade test, ii) evidence that superior AUC values can be attained with such a test, overand above what can be achieved currently with TMB or PD-L1 IHC. In this context we propose amultivariate model tested across six separate tumor types, which attains AUC value of 0.86 in a pan-tumor independent test cohort, superior to TMB alone with 0.59. We also demonstrate a predictive scoringsystem that identi�es subgroups with very low (0-5%) or high (~50%) likelihood of response, which mayprovide valuable information to support clinical decision making or for trial strati�cation. Ultimatelyfurther discovery work is required to build a more complete understanding of CPI response, and in thiscontext our analysis shows that previously published biomarkers explain only ~0.4 of the variance in CPIoutcome. As datasets grow in size and additional markers can be found and validated, as wellincorporation of factors outside of the exome/transcriptome such as spatial measures of immunephenotype, it is plausible in the short term that multivariate CPI predictive models can provide clinicalutility in binary strati�cation. These models would of course need validation in further large retrospectivecohorts, or via prospective study. Regarding study limitations, we acknowledge that the CPI1000+ cohortis made up from a diverse set of underlying previously published studies, however the bioinformatics
Page 11/31
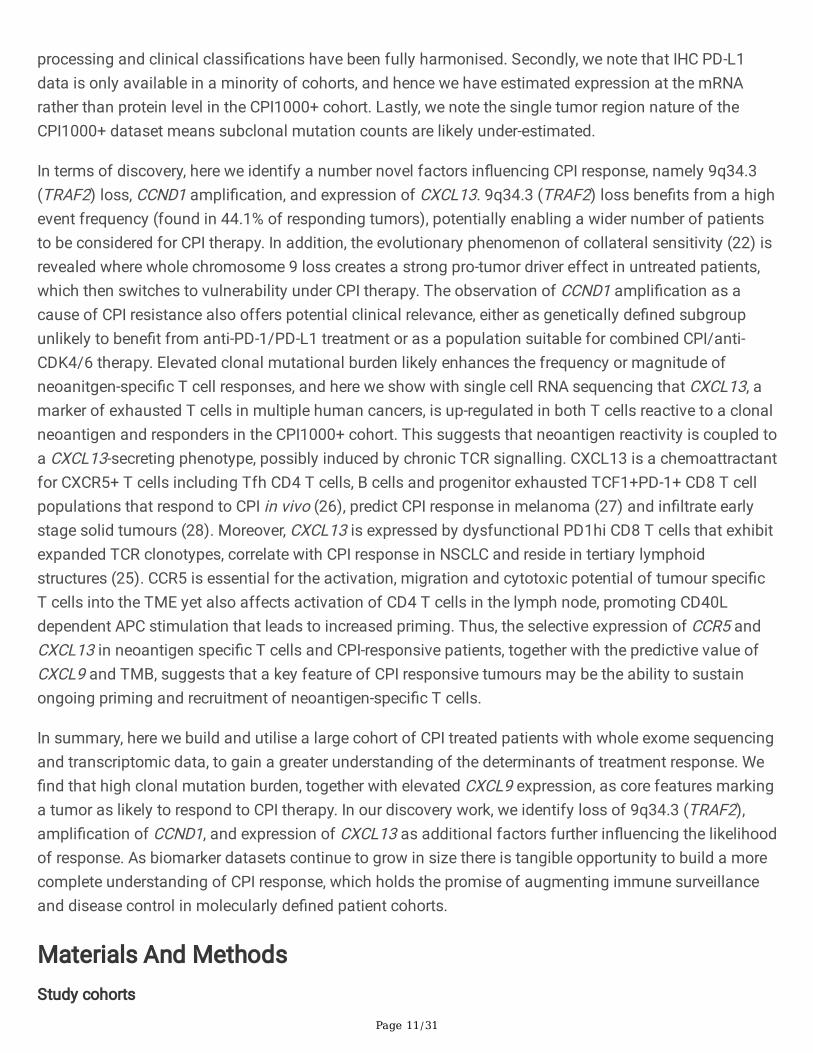
processing and clinical classi�cations have been fully harmonised. Secondly, we note that IHC PD-L1data is only available in a minority of cohorts, and hence we have estimated expression at the mRNArather than protein level in the CPI1000+ cohort. Lastly, we note the single tumor region nature of theCPI1000+ dataset means subclonal mutation counts are likely under-estimated.
In terms of discovery, here we identify a number novel factors in�uencing CPI response, namely 9q34.3(TRAF2) loss, CCND1 ampli�cation, and expression of CXCL13. 9q34.3 (TRAF2) loss bene�ts from a highevent frequency (found in 44.1% of responding tumors), potentially enabling a wider number of patientsto be considered for CPI therapy. In addition, the evolutionary phenomenon of collateral sensitivity (22) isrevealed where whole chromosome 9 loss creates a strong pro-tumor driver effect in untreated patients,which then switches to vulnerability under CPI therapy. The observation of CCND1 ampli�cation as acause of CPI resistance also offers potential clinical relevance, either as genetically de�ned subgroupunlikely to bene�t from anti-PD-1/PD-L1 treatment or as a population suitable for combined CPI/anti-CDK4/6 therapy. Elevated clonal mutational burden likely enhances the frequency or magnitude ofneoanitgen-speci�c T cell responses, and here we show with single cell RNA sequencing that CXCL13, amarker of exhausted T cells in multiple human cancers, is up-regulated in both T cells reactive to a clonalneoantigen and responders in the CPI1000+ cohort. This suggests that neoantigen reactivity is coupled toa CXCL13-secreting phenotype, possibly induced by chronic TCR signalling. CXCL13 is a chemoattractantfor CXCR5+ T cells including Tfh CD4 T cells, B cells and progenitor exhausted TCF1+PD-1+ CD8 T cellpopulations that respond to CPI in vivo (26), predict CPI response in melanoma (27) and in�ltrate earlystage solid tumours (28). Moreover, CXCL13 is expressed by dysfunctional PD1hi CD8 T cells that exhibitexpanded TCR clonotypes, correlate with CPI response in NSCLC and reside in tertiary lymphoidstructures (25). CCR5 is essential for the activation, migration and cytotoxic potential of tumour speci�cT cells into the TME yet also affects activation of CD4 T cells in the lymph node, promoting CD40Ldependent APC stimulation that leads to increased priming. Thus, the selective expression of CCR5 andCXCL13 in neoantigen speci�c T cells and CPI-responsive patients, together with the predictive value ofCXCL9 and TMB, suggests that a key feature of CPI responsive tumours may be the ability to sustainongoing priming and recruitment of neoantigen-speci�c T cells.
In summary, here we build and utilise a large cohort of CPI treated patients with whole exome sequencingand transcriptomic data, to gain a greater understanding of the determinants of treatment response. We�nd that high clonal mutation burden, together with elevated CXCL9 expression, as core features markinga tumor as likely to respond to CPI therapy. In our discovery work, we identify loss of 9q34.3 (TRAF2),ampli�cation of CCND1, and expression of CXCL13 as additional factors further in�uencing the likelihoodof response. As biomarker datasets continue to grow in size there is tangible opportunity to build a morecomplete understanding of CPI response, which holds the promise of augmenting immune surveillanceand disease control in molecularly de�ned patient cohorts.
Materials And MethodsStudy cohorts

Page 12/31
The CPI1000+ cohort utilises raw whole exome and RNA sequencing data from the following studies:
1. Snyder et al. (29), an advanced melanoma anti-CTLA-4 treated cohort.
2. Van Allen et al. (30), an advanced melanoma anti-CTLA-4 treated cohort.
3. Hugo et al. (31), an advanced melanoma anti-PD-1 treated cohort.
4. Riaz et al. (32), an advanced melanoma anti-PD-1 treated cohort.
5. Cristescu et al. (2) an advanced melanoma anti-PD-1 treated cohort.
�. Cristescu et al. (2) an advanced head and neck cancer anti-PD-1 treated cohort.
7. Cristescu et al. (2) “all other tumor types” cohort (from KEYNOTE-028 and KEYNOTE-012 studies),treated with anti-PD-1.
�. Snyder et al. (33), a metastatic urothelial cancer anti-PD-L1 treated cohort.
9. Mariathasan et al. (1), a metastatic urothelial cancer anti-PD-L1 treated cohort.
10. Mcdermot et al. (15), a metastatic renal cell carcinoma anti-PD-L1 treated cohort.
11. Rizvi et al. (34), a non-small cell lung cancer anti-PD-1 treated cohort.
12. Hellman et al., an unpublished cohort of non-small cell lung cancer samples treated with anti-PD-1.
13. Le et al. (35), a colorectal cancer cohort treated with anti-PD-1 therapy.
In order to allow studies to be grouped by histology, patients from the “all other tumor types” KEYNOTE-028 and KEYNOTE-12 cohort from Cristescu et al. were broken out to create two additional cohorts,cohort 14: Cristescu et al - urothelial cancer and cohort 15: Cristescu et al – breast cancer (N.B. anadditional n=67 breast cancer samples from Voorwerk et al. (36) are in the process of being analysed forthe �nal submission). Thus in total, the CPI1000+ cohort is comprised of data from 15 distinct sub-studies. A breakdown of sample numbers for each study/histology is contained in Table S1. Validationdata for copy number analysis was taken from Samstein et al. (3), a cohort of 1662 patients treated withCPI and pro�led using the MSK-IMPACT gene panel (referred to as the MSK1600 cohort). Segment copynumber data for these samples was downloaded from the GENIE Synapse portal (syn7222066),https://www.synapse.org/, and clinical data was utilised from the Samstein et al. paper. In addition, acohort of MSK-IMPACT sequenced, but non-CPI treated patients from were utilised for negative controlanalyses, to distinguish CPI predictive from generally prognostic biomarkers. Copy number segment datafor this non-CPI cohort was similarly obtained from the GENIE Synapse portal (syn7222066),https://www.synapse.org/, and clinical response data was taken from Bielski et al. (37), and patientsoverlapping with the Samstein et al. were removed. We note the clinical survival data from thesupplementary �les of Bielski et al. and Samstein et al MSK-IMPACT publications did not match foroverlapping patients (presumably due to differing duration of follow-up) and hence these two datasetscould only be analysed separately, and not combined together for interaction test analysis. Lastly, singlecell RNA sequencing was conducted on CD8 TILs from patient L011, a patient diagnosed with non-smallcell lung cancer who underwent de�nitive surgical resection prior to receiving any adjuvant therapy.Informed consent was obtained under study UCLHRTB 10/H1306/42.

Page 13/31
Clinical end points
In the CPI1000+ cohort, a uniform clinical end-point of response was de�ned across all the 15 studiesbased on radiological response as per the RECIST criteria, with “CR/PR” being classi�ed as a responderand “SD/PD” being a non-responder. We note this is a conservative de�nition of response, and patientswith SD and extended survival have in some previous studies been considered as experiencing clinicalbene�t from treatment, however the “CR/PR” vs “SD/PD” de�nition used here allows for uniformconsistency across cohorts, clearest interpretation and is consistent with the most recent literature (1, 2).For RECIST response evaluations we utilized the clinical data provided by the original authors, which in>90% of cases was best response time point. In a minority of cases the time point of RECIST evaluationwas not directly speci�ed. For the (2) cohort response labels were not available as a supplementary �le,however they could be inferred from cross-reference of Table S2 and Fig. S3 of that paper, and validatedby re-computing p-values from the paper to ensure exact match (e.g. Fig. 2 multivariate model p-valuesstated in the paper, we were able to match to the 4 decimal places accuracy provided in the paper). Inaddition, the inferred labels were further validated when we checked the numbers of responders perdetailed histology in Table S3 of (2) and found the inferred data matched exactly the reported results.RECIST response data was not available for the MSK1600 cohort, so instead overall survival was used asthe clinical end-point, combined with negative control analysis in MSK-IMPACT pro�led samples nottreated with CPI, to distinguish predictive from prognostic biomarkers.
Multimer sorting of neoantigen reactive T cells
We have previously identi�ed CD8+ neoantigen reactive T cells (NARTs) targeted against a clonalneoantigen (arising from the mutated MTFR2 gene) in NSCLC tumor regions derived from patient L011(24). Brie�y, neoantigen-speci�c CD8 T cells were identi�ed using high throughput MHC multimerscreening of candidate mutant peptides generated from patient-speci�c neoantigens of predicted <500nM a�nity for cognate HLA as previously described (24). 288 candidate mutant peptides (withpredicted HLA binding a�nity <500nM, including multiple potential peptide variations from the samemissense mutation) were synthesized and used to screen expanded L011 TILs. In patient L011, TILs werefound to recognize the HLA-B*3501 restricted, MTFR2D326Y-derived mutated sequence FAFQEYDSF(netMHC binding score: 22nM), but not the wild type sequence FAFQEDDSF (netMHC binding score:10nM). No responses were found against overlapping peptides AFQEYDSFEK and KFAFQEYDSF.Neoantigen-speci�c CD8+ T cells were tracked with peptide-MHC multimers conjugated with eitherstreptavidin PE (Biolegend, cat#405203), APC (Biolegend, cat#405207) BV650 (Biolegend, cat#405231)or PE-Cy-7 (Biolegend, cat#405206) and gated as double positive cells among live, single CD8+ cells.Phenotypic characterization of neoantigen-speci�c CD8 T cells in L011 was performed as previouslydescribed (24).
Single-Cell RNA sequencing of Neoantigen Reactive T cells
Multimer-positive and negative single CD8+ T cells from NSCLC specimens were sorted directly into theC1 Integrated Fluidic Circuit (IFC; Fluidigm). Cell lysing, reverse transcription, and cDNA ampli�cation

Page 14/31
were performed as speci�ed by the manufacturer. Brie�y, 1000 single, multimer positive or negative CD8T cells were �ow sorted directly into a 10- to 17-μm-diameter C1 Integrated Fluidic Circuit (IFC; Fluidigm).Ahead of sorting, the cell inlet well was preloaded with 3.5ul of PBS 0.5% BSA. Post-sorting the total wellvolume was measured and brought to 5ul with PBS 0.5% BSA. 1ul of C1 Cell Suspension Reagent(Fluidigm) was added and the �nal solution was mixed by pipetting. Each C1 IFC capture site wascarefully examined under an EVOS FL Auto Imaging System (Thermo Fisher Scienti�c) in bright �eld, forempty wells and cell doublets. An automated scan of all capture sites was also obtained for reference.Cell lysing, reverse transcription, and cDNA ampli�cation were performed on the C1 Single-Cell Auto PrepIFC, as speci�ed by the manufacturer. The SMARTer v4 Ultra Low RNA Kit (Takara Clontech) was used forcDNA synthesis from the single cells. cDNA was quanti�ed with Qubit dsDNA HS (Molecular Probes) andchecked on an Agilent Bioanalyser high sensitivity DNA chip. Illumina NGS libraries were constructed withNextera XT DNA Sample Preparation kit (Illumina), according to the Fluidigm Single-Cell cDNA Librariesfor mRNA sequencing protocol. Sequencing was performed on Illumina® NextSeq 500 using 150bppaired end kits.
Sample quality control
Several steps were taken to prevent contamination and sample quality issues. First, samples wereclustered using a panel of common germline SNPs, to ensure no duplicate participants were included(Fig. S4). Secondly, the DeTiN tumor-in-normal contamination tool (7) was run, and excluded anysamples with TiN>0.02. Thirdly, we assessed for any technical correlations between mutation counts andpurity or sequencing coverage, and did not observe any signi�cant relationships (Fig. S2). Fourthly, toremove any potential batch issues in the RNA sequencing data we used the removeBatchEffect() functionfrom the limma R package. Finally, we assessed for any evidence of different exome capture kits acrossthe cohorts impacting results, and found no signi�cant difference in TMB scores based on exome capturekits utilised (Fig. S3). We note however that Agilent SureSelect kits were used in nearly all studies, exceptfor one cohort, Snyder et al. (33), which used IDT xGen WES capture, and in addition we found nospeci�cation of the capture kit used in the Hugo et al. manuscript (31).
Whole exome sequencing (DNA) pipeline – variant calling
For all studies we obtained germline/tumor whole exome sequencing data in either BAM, SRA or fastqformat, from the relevant sequencing repository or directly original authors and reverted these �les backto FASTQ format using Picard tools (version 1.107) SamToFastq. Raw paired-end reads in FASTQ formatwere aligned to hg19 obtained from the GATK bundle (v2.8) using bwa mem (bwa v0.7.15) (McKenna etal., 2010, Li and Durbin, 2009). Picard tools (picard v1.107) was used to remove duplicates(http://broadinstitute.github.io/picard), and GATK was additionally used for local indel realignment.Quality control metrics were produced with picard tools (v1.107), FastQC (v0.11.5 -http://www.bioinformatics.babraham.ac.uk/projects/fastqc/) and GATK(v3.9) (McKenna et al., 2010).Platypus v0.8.1 was used to call homozygous and heterozygous germline SNPs (Rimmer et al., 2014).The default parameters were used, but the genIndels �ag was set to FALSE. Only SNPs with a minimum

Page 15/31
depth of coverage of 20x are taken forward. Somatic variants were detected using two tools (VarScan2v2.4.1 & MuTect v1.1.7) (Koboldt et al., 2012, Cibulskis et al., 2013), using the following method:SAMtools mpileup (version 0.1.19) was used to locate non-reference positions in tumor and germlinesamples. Bases with a Phred score of less than 20 or reads with a mapping quality less than 20 wereomitted. The Base alignment quality (BAQ) calculation option was deactivated and a threshold of 50 wasset for the coe�cient of downgrading mapping quality. VarScan2 somatic (version 2.3.6) used outputfrom SAMtools mpileup to identify somatic variants between tumour and matched germline samples.VarScan2 processSomatic was used to extract the somatic variants. Single nucleotide variant (SNV) callswere �ltered for false positives with the associated fp�lter.pl script in Varscan2, initially with defaultsettings then repeated with min-var-frac=0·02, having �rst run the data through bam-readcount (version0.5.1). MuTect (version 1.1.4) was also used to detect SNVs, and results were �ltered according to the�lter parameter PASS. Default parameters were used in both tools with the exception of: i) minimumcoverage for the germline sample was set to 10, ii) minimum coverage for the tumor sample was set to30, iii) minimum somatic variant allele frequency (VAF) was set to 0·01 and minimum alternative readcoverage set to 5, iv) alternative reads in the germline had to be <=5 and germline VAF <=1%, v) varianthad to be not present in EXAC03 database at 5% or higher frequency. In �nal QC �ltering, an SNV wasconsidered a true positive if the variant allele frequency (VAF) was greater than 1% and the mutation wascalled by both VarScan2, with a somatic p-value <=0.01, and MuTect. Alternatively, a frequency of 5% wasrequired if only called in VarScan2, again with a somatic p-value <=0.01. For small scaleinsertion/deletions (INDELs), only calls classed as high con�dence by VarScan2 processSomatic werekept for further analysis, with somatic_p_value scores less than 5 × 10⁻⁴. Variant annotation wasperformed using ANNOVAR (version 2016Feb01).
Whole exome sequencing (DNA) pipeline – copy number calling
VarScan2(v2.4.1) was used to generate logR depth ratios from paired tumour region/germline samples.These values were subsequently GC corrected (Cheng et al., 2011). Default parameters were used togenerate this data with the exception of: min-coverage=8 and min-segment-size=50. B-Allele Frequencies(BAFs) – the proportion of reads with a SNP variant relative to the total read depth – were calculatedusing the SNPs called in the germline by platypus. The GC-corrected logR values and BAF values are thenused by ASCAT (v2.3) (Van Loo et al., 2010) to generate segmented allele-speci�c copy number data,including estimates of tumour ploidy and cellularity. Sequenza (Favero et al., 2015) was additionally runon all samples in parallel. To ensure accuracy, default ASCAT copy number solutions were quality controlchecked, and where a sample failed any of the following quality �ags it then underwent manual review: i)unexpectedly high purity, de�ned as tumor cellularity > 80%, ii) unexpectedly low levels of loss ofheterozygosity, de�ned as fraction of the genome LOH of < 0.1, iii) unexpectedly high level of the genomewith both alleles at even copy number, de�ned as the fraction of the genome with alleles A and B botheven as > 0.7, iv) unexpectedly high level of the genome with copy number = 0, de�ned as >=4Mb withcopy number = 0. In addition, an orthogonal measure of tumor purity was derived based on mutationvariant allele fraction, as previously described [NEJM], and samples with a mismatch in purity between

Page 16/31
ASCAT and orthogonal measurements of greater than 1 standard deviation were additionally �agged formanual review. Samples that had been �agged for manual review underwent dual analyst inspection,which involved review of the default and alternative copy number solutions from ASCAT and Sequenzatools. Where a better �tting solution was available (based on the rules above, as well as obtainingconsistency in solutions between ASCAT and Sequenza) this was utilised rather than the ASCAT default.
RNA sequencing pipeline
RNAseq data was obtained in BAM/SRA/FASTQ format for all studies, and reverted back to FASTQformat using bam2fastq (v1.1.0). FASTQ data underwent quality control and were aligned to the hg19genome using STAR (38). Transcript quanti�cation was performed using RSEM with default parameters(39).
Mutation clonality analysis
PyClone (Roth et al., 2014) was used to determine the clonal status of mutations. For each samplevariant calls were integrated with local allele speci�c copy number (obtained from ASCAT), tumor purity(also obtained from ASCAT), and variant allele frequency data. All mutations were then clustered usingthe PyClone Dirichlet process clustering. We ran PyClone with 10,000 iterations and a burn-in of 1000,and using parameters as previously described (40).
HLA and neoantigen analysis
Neoantigen predictions were derived by �rst determining the 4-digit HLA type for each patient, along withmutations in class I HLA genes, using POLYSOLVER (41). Next, all possible 9, 10 and 11-mer mutantpeptides were computed, based on the detected somatic non-synonymous SNV and INDEL mutations ineach sample. Binding a�nities of mutant and corresponding wildtype peptides, relevant to thecorresponding POLYSOLVER-inferred HLA alleles, were predicted using NetMHCpan (v3.0) and NetMHC(v4.0) (42). Neoantigen binders were de�ned as IC500<500 nM or rank < 2.0. Germline HLA-I evolutionarydivergence scores were derived by calculating the Grantham distances between HLA gene allele pairsusing the same procedure as described in Pierini et al. (43), which utilises the Grantham distance metricoriginally designed for investigating protein evolution from physiochemical differences in amino acidsequences (44). Aligned protein sequences for HLA alleles were obtained from the IMGT database (45)for the different HLA alleles as called by Polysolver from the raw data �les for the HLA-A, B and C genes.A custom R script was created to calculate the Grantham distance at each position on exons 2 and 3 oftwo aligned HLA alleles (exon 2 and 3 being the the peptide binding region of the HLA protein). The �nalGrantham distance score between two HLA alleles was calculated as the sum of the scores at eachposition divided by length of the amino acid sequence. The average Grantham score for an individualpatient was then calculated by taking the mean of the separate Grantham scores for HLA-A, B and C. HLAloss of heterozygosity analysis was performed using the LOHHLA too as previously described (10).
Derivation of published biomarkers

Page 17/31
The following previously published biomarkers were tested for association with response to CPI therapy:tumor mutation burden (TMB) (29, 30, 34) (also split out into Clonal (24) and Subclonal TMB), frameshiftinsertion/deletion (indel) mutation burden (46), burden of indels escaping nonsense mediated decay (47),shannon diversity index for intratumor heterogeneity (SDI-ITH) (13), burden of somatic copy numberalterations (48), HLA-I evolutionary divergence (9), loss of heterozygosity at the HLA locus (10), Gender(12), B2M mutations (49), JAK1/JAK2 mutations (50), DNA damage response pathway mutations (51),Receptor tyrosine kinases pathway mutations (52), SERPINB3/SERPINB4 mutations (53), PTENmutations (54), CD8A (55), CD274 (PD-L1) (56) and CXCL9 expression (57), as well as the CD8 T celleffector (15) and T cell in�amed gene expression signatures (14). Histology speci�c CPI biomarkers, e.g.STK11 and PBRM1, were excluded from the analysis on account of lack of power to compressivelyassess biomarkers in single histology types. TMB was de�ned as the count of missense variants, SCNAload was de�ned using the weighted genome instability index (wGII) (8), expression of individual geneswas measured using either TPM (for datasets with RNAseq) or normalised nanostring expression valuesfor the Cristescu et al. cohort. For inactivating pathway mutations (i.e. B2M, PTEN, JAK1/JAK2, DNAdamage response) loss of function mutations (i.e. those causing a premature stop codon) andhomozygyous deletions were included. DNA damage response pathway genes were de�ned as: BRCA1,BRCA2, ATM, POLE, ERCC2, FANCA, MSH2, MLH1, POLD1 and MSH6 based on (51). Receptor tyrosinekinases pathway mutations were de�ned as per (52). All other biomarkers were de�ned as per the methodoutlined in the original underlying publication as referenced above. Associations with response weretested using logistic regression. To allow biomarkers with varying measurement scales (e.g. mutationcounts vs gene expression values) to be compared equivalently based on effect size rather than p-value(5), all biomarker values were converted to standard z-scores (i.e. mean normalised to equal zero, andstandard deviation normalised to one). To avoid data pooling, each biomarker was tested individually ineach sub-study, and then the effect sizes and standard errors were combined through meta-analysis toderive a �nal p-value per biomaker. Meta-analysis was conducted using R package ‘meta’. Proportion ofvariance explained analysis. The total proportion of variance explained by all biomarkers was calculatedby logistic regression pseudo-R2, using R function ‘PseudoR2’.
Fitting a multivariate model of CPI response
All biomarkers attaining signi�cance in the Fig. 1A meta-analysis were utilised, comprising 12 measuresin total: TMB, Clonal TMB, Indel TMB, NMD-escape TMB, T cell in�amed and CD8 Effector expressionsignatures, Gender, SERPINB3 mutation status, LOHHLA, and gene expression values for CD274 (PD-L1),CD8A and CXCL9. All 12 biomarkers were inputted into the gradient boosted tree algorithm XGBoost, awidely used machine learning algorithm effective for classi�cation tasks. R package ‘xgboost’ wasutilized, with maximum tree depth set at 2, nrounds set as 20 and all other parameters set to defaultvalues. In the four training/validation cohorts, individual models were trained on a randomly selected 75%subset of each cohort, with AUC values then calculated in 25% of held-back (unseen) samples. Tounderstand the distribution of AUC values the random subsampling procedure was repeated via 1000rounds of Monte Carlo simulation. For each Monte Carlo iteration the AUC value was measured in the

Page 18/31
25% set of unseen samples. An identical process was performed for TMB as a single biomarker. Rpackage ‘ROCR’ was used for the ROC curve analysis.
Pan-cancer analysis of copy number losses and gains
Copy number segment data from ASCAT for all responders (n=261) and non-responders (n=746) wereinputted to the R package ‘copynumber’ to derive the gain and loss frequency across the genome for eachgroup (i.e. for responders and non-responders separately). Region level cytoband coordinates wereobtained from the UCSC Table Browser, with 303 autosomal chromosomes cytobands de�ned. For gainsand losses (separately) the frequency per cytoband was converted back to absolute patient counts andthe difference between responders and non-responders was compared using a 2x2 Fisher’s exact test.Results were corrected for multiple testing using the p.adjust function in R, with the FDR method. Thefrequency of whole chromosal losses was analysed using genome-wide SNP6 segmented data persample from the TCGA GDAC Firehose repository (http://�rebrowse.org/), for histology types overlappingwith the CPI1000+ cohort, i.e. TCGA cohorts: BLCA, BRCA, COADREAD, HNSC, KIRC, LUAD, LUSC andSKCM. In MSK-IMPACT dataset, the overall survival analysis to validate 9q34.3 loss was conducted onlyin patients with 9p loss, given the strong co-correlation between 9p and 9q loss, and the known generallyprognostic impact of loss of 9p in driving reduced overall survival (e.g. CDK2NA). The immune evasionalteration analysis was conducted as per previously published method by Rosenthal et al. 2019 (11),which de�nes antigen-presentation-pathway genes as components of the HLA enhanceosome, peptidegeneration, chaperones or the MHC complex itself. In the analysis we included disruptive events (non-synonymous mutations or copy-number loss de�ned relative to ploidy) of the following genes: CIITA,IRF1, PSME1, PSME2, PSME3, ERAP1, ERAP2, HSPA, HSPC, TAP1, TAP2, TAPBP, CALR, CNX, PDIA3 andB2M. The analysis was also repeated for non-synonymous mutations only (i.e. no copy number lossevents). Signi�cance was determined using a one-sided 2x2 Fisher’s exact test. In addition, a multivariatelogistic regression test was also performed, adjusting for wGII and cancer type, which also con�rmed asigni�cant association between 9q34 loss and a higher rate of immune evasion.
Pan-cancer analysis of focal ampli�cations and deep deletions
Copy number segment data from ASCAT for all responders (n=261) and non-responders (n=746) wereutilised to identify tumors with either focal ampli�cation (copy number =>5 and segment length < 3Mb) orhomozygous deletions (copy number = 0 and segment length < 3Mb), in known oncogenes (forampli�cations) or tumor suppressor genes (for deep deletions). Oncogenes and tumor suppressor geneswere de�ned according to the Cancer Gene Census (https://cancer.sanger.ac.uk/census), accessed 23rd
October 2019, and events with greater than 5% frequency in the CPI1000+ cohort were analysed. Thedifference in Oncogene/TSG ampli�cation/deletion frequency was compared between responders andnon-responders using a one-sided 2x2 Fisher’s exact test (events were hypothesised to associate withresistance only, as they are not collateral passenger events that may cause sensitization).
Analysis of single cell RNA sequencing data

Page 19/31
All sequencing data was assessed to detect sequencing failures using FASTQC and lower quality readswere �ltered or trimmed using TrimGalore. Outlier samples containing low sequencing coverage or highduplication rates were discarded. Analyses using the RNAseq data were performed in the R statisticalcomputing framework, version 3.5 using packages from BioConductor version 3.7. The single cellRNAseq samples were mapped to the GRCh38 reference human genome, as included in Ensembl version84, using the STAR algorithm and transcript and gene abundance were estimated using the RSEMalgorithm. After quanti�cation, the scater package was used to set �ltering thresholds, based on usingspike ins and mitochondrial genes to �lter out bad quality cells, �ltering by total number of genes and�ltering by total number of sequenced reads. The remaining cells were used after normalizing using size-factors estimated by the SCRAN package. Downstream analyses used log2 transformed normalizedcount data. All count data, metadata and intermediate results were kept within aSummarisedExperiment/SingleCellExperiment R object. The data was processed using the edgeRBioConductor package that was used for outlier detection and differential gene expression analyses.Differentially expressed genes were assessed based on their protein coding status.
Statistical methods
Unless otherwise stated (e.g. the section above “Derivation of published biomarkers”), odds ratios werecalculated using Fisher's Exact Test for count data, Kruskal-Wallis test was used to test for a difference indistribution between three or more independent groups, and Mann Whitney U test was used to assess fora difference in distributions between two population groups. Logistic regression was used to assessmultiple variables jointly for independent association with binary outcomes. Overall survival analysis wasconducted using a Cox proportional hazards model. Statistical analysis were carried out using R3.4.4(http://www.r-project.org/) or greater. We considered a P value of 0.05 as being statistically signi�cant.Any analysis with 25 or more comparisons was subject to multiple testing correction using the R p.adjustfunction, with FDR method.
DeclarationsFunding
K.L. is supported by a UK Medical Research Council Skills Development Fellowship Award (grantreference number MR/P014712/1). S.T. is a Cancer Research UK clinician scientist and is funded byCancer Research UK (grant reference number C50947/A18176) and the National Institute for HealthResearch (NIHR) Biomedical Research Centre at the Royal Marsden Hospital and Institute of CancerResearch (grant reference number A109). C. S. is a senior Cancer Research UK clinical research fellowand is funded by Cancer Research UK (TRACERx), the Rosetrees Trust, NovoNordisk Foundation (ID16584), EU FP7 (projects PREDICT and RESPONSIFY, ID: 259303), the Prostate Cancer Foundation, theBreast Cancer Research Foundation, the European Research Council (THESEUS) and National Institute forHealth Research University College London Hospitals Biomedical Research Centre.
Disclosure

Page 20/31
KL has a patent on indel burden and checkpoint inhibitor response pending, and a patent on targeting offrameshift neoantigens for personalised immunotherapy pending. ST reports grants from Ventana,outside the submitted work; and has a patent on indel burden and checkpoint inhibitor response pending,and a patent on targeting of frameshift neoantigens for personalised immunotherapy pending. SAQreports personal fees and other from Achilles Therapeutics, outside of the submitted work. JL reportspersonal fees from Eisai, GlaxoSmithKline, Kymab, Roche/Genentech, Secarna, Pierre Fabre, and EUSAPharma; and grants and personal fees from Bristol-Myers Squibb, Merck Sharp & Dohme, P�zer, andNovartis, outside of the submitted work. CS reports personal fees from Janssen, Boehringer Ingelheim,Ventana, Novartis, Roche, Sequenom, Natera, Achilles Therapeutics, and Sarah Cannon ResearchInstitute, and personal fees and other from Apogen Biotechnologies, Epic Sciences, and GRAIL, outside ofthe submitted work; and has a patent on indel burden and checkpoint inhibitor response pending and apatent on targeting of frameshift neoantigens for personalised immunotherapy pending.
Acknowledgements
C.S. is Royal Society Napier Research Professor. This work was supported by the Francis Crick Institutethat receives its core funding from Cancer Research UK (FC001169,FC001202), the UK Medical ResearchCouncil (FC001169, FC001202), and the Wellcome Trust (FC001169, FC001202). C.S. is funded by CancerResearch UK (TRACERx, PEACE and CRUK Cancer Immunotherapy Catalyst Network), the CRUK LungCancer Centre of Excellence, the Rosetrees Trust, NovoNordisk Foundation (ID16584) and the BreastCancer Research Foundation (BCRF). This research is supported by a Stand Up To Cancer‐LUNGevity-American Lung Association Lung Cancer Interception Dream Team Translational Research Grant (GrantNumber: SU2C-AACR-DT23-17). Stand Up To Cancer is a program of the Entertainment IndustryFoundation. Research grants are administered by the American Association for Cancer Research, theScienti�c Partner of SU2C.
The research leading to these results has received funding from the European Research Council (ERC)under the European Union’s Seventh Framework Programme (FP7/2007-2013) Consolidator Grant (FP7-THESEUS-617844), European Commission ITN (FP7-PloidyNet 607722), an ERC Advanced Grant(PROTEUS) from the European Research Council under the European Union’s Horizon 2020 research andinnovation programme (grant agreement 835297), and Chromavision from the European Union’s Horizon2020 research and innovation programme (grant agreement 665233).
References1. Mariathasan S, Turley SJ, Nickles D, Castiglioni A, Yuen K, Wang Y, et al. TGFbeta attenuates tumour
response to PD-L1 blockade by contributing to exclusion of T cells. Nature. 2018;554(7693):544-8.
2. Cristescu R, Mogg R, Ayers M, Albright A, Murphy E, Yearley J, et al. Pan-tumor genomic biomarkersfor PD-1 checkpoint blockade-based immunotherapy. Science. 2018;362(6411).
3. Samstein RM, Lee CH, Shoushtari AN, Hellmann MD, Shen R, Janjigian YY, et al. Tumor mutationalload predicts survival after immunotherapy across multiple cancer types. Nature genetics.

Page 21/31
2019;51(2):202-6.
4. Consortium APG. AACR Project GENIE: Powering Precision Medicine Through An InternationalConsortium. Cancer discovery. 2017.
5. Ronald L. Wasserstein ALSNAL. Moving to a World Beyond “p < 0.05”. The American Statistician.(Pages 1-19 | Published online: 20 Mar 2019).
�. Natalie I. Vokes M, 2; David Liu, MD1,2; Biagio Ricciuti, MD1; Elizabeth Jimenez-Aguilar, MD3; HiraRizvi4; Felix Dietlein, MD, PhD1,2; Meng Xiao He5; Claire A. Margolis, MS1,2; Haitham A. Elmarakeby,PhD1,2; Jeffrey Girshman, MD4; Anika Adeni1; Francisco Sanchez-Vega, PhD4; Nikolaus Schultz,PhD4; Suzanne Dahlberg, PhD1; Ahmet Zehir, PhD4; Pasi A. Jänne, MD, PhD1,6; Mizuki Nishino,MD1,6; Renato Umeton, PhD1,7; Lynette M. Sholl, MD6; Eliezer M. Van Allen, MD1,2; Matthew D.Hellmann, MD4,8; and Mark M. Awad, MD, PhD. Harmonization of Tumor Mutational BurdenQuanti�cation and Association With Response to Immune Checkpoint Blockade in Non–Small-CellLung Cancer. JCO precision oncology. 2019.
7. Taylor-Weiner A, Stewart C, Giordano T, Miller M, Rosenberg M, Macbeth A, et al. DeTiN: overcomingtumor-in-normal contamination. Nature methods. 2018;15(7):531-4.
�. Endesfelder D, Burrell R, Kanu N, McGranahan N, Howell M, Parker PJ, et al. Chromosomal instabilityselects gene copy-number variants encoding core regulators of proliferation in ER+ breast cancer.Cancer research. 2014;74(17):4853-63.
9. Chowell D, Krishna C, Pierini F, Makarov V, Rizvi NA, Kuo F, et al. Evolutionary divergence of HLA classI genotype impacts e�cacy of cancer immunotherapy. Nature medicine. 2019;25(11):1715-20.
10. McGranahan N, Rosenthal R, Hiley CT, Rowan AJ, Watkins TBK, Wilson GA, et al. Allele-Speci�c HLALoss and Immune Escape in Lung Cancer Evolution. Cell. 2017;171(6):1259-71 e11.
11. Rosenthal R, Cadieux EL, Salgado R, Bakir MA, Moore DA, Hiley CT, et al. Neoantigen-directedimmune escape in lung cancer evolution. Nature. 2019;567(7749):479-85.
12. Conforti F, Pala L, Bagnardi V, De Pas T, Martinetti M, Viale G, et al. Cancer immunotherapy e�cacyand patients' sex: a systematic review and meta-analysis. The Lancet Oncology. 2018;19(6):737-46.
13. Wolf Y, Bartok O, Patkar S, Eli GB, Cohen S, Litch�eld K, et al. UVB-Induced Tumor HeterogeneityDiminishes Immune Response in Melanoma. Cell. 2019;179(1):219-35 e21.
14. Ayers M, Lunceford J, Nebozhyn M, Murphy E, Loboda A, Kaufman DR, et al. IFN-gamma-relatedmRNA pro�le predicts clinical response to PD-1 blockade. The Journal of clinical investigation.2017;127(8):2930-40.
15. McDermott DF, Huseni MA, Atkins MB, Motzer RJ, Rini BI, Escudier B, et al. Clinical activity andmolecular correlates of response to atezolizumab alone or in combination with bevacizumab versussunitinib in renal cell carcinoma. Nature medicine. 2018;24(6):749-57.
1�. Gorbachev AV, Kobayashi H, Kudo D, Tannenbaum CS, Finke JH, Shu S, et al. CXC chemokine ligand9/monokine induced by IFN-gamma production by tumor cells is critical for T cell-mediatedsuppression of cutaneous tumors. Journal of immunology. 2007;178(4):2278-86.

Page 22/31
17. Karin N, Wildbaum G, Thelen M. Biased signaling pathways via CXCR3 control the development andfunction of CD4+ T cell subsets. Journal of leukocyte biology. 2016;99(6):857-62.
1�. Cohen JF, Korevaar DA, Altman DG, Bruns DE, Gatsonis CA, Hooft L, et al. STARD 2015 guidelines forreporting diagnostic accuracy studies: explanation and elaboration. BMJ open. 2016;6(11):e012799.
19. Vredevoogd DW, Kuilman T, Ligtenberg MA, Boshuizen J, Stecker KE, de Bruijn B, et al. AugmentingImmunotherapy Impact by Lowering Tumor TNF Cytotoxicity Threshold. Cell. 2019;178(3):585-99e15.
20. Smith JC, Sheltzer JM. Systematic identi�cation of mutations and copy number alterationsassociated with cancer patient prognosis. eLife. 2018;7.
21. Turajlic S, Xu H, Litch�eld K, Rowan A, Chambers T, Lopez JI, et al. Tracking Cancer Evolution RevealsConstrained Routes to Metastases: TRACERx Renal. Cell. 2018;173(3):581-94 e12.
22. Zhao B, Sedlak JC, Srinivas R, Creixell P, Pritchard JR, Tidor B, et al. Exploiting Temporal CollateralSensitivity in Tumor Clonal Evolution. Cell. 2016;165(1):234-46.
23. Zhang J, Bu X, Wang H, Zhu Y, Geng Y, Nihira NT, et al. Cyclin D-CDK4 kinase destabilizes PD-L1 viacullin 3-SPOP to control cancer immune surveillance. Nature. 2018;553(7686):91-5.
24. McGranahan N, Furness AJ, Rosenthal R, Ramskov S, Lyngaa R, Saini SK, et al. Clonal neoantigenselicit T cell immunoreactivity and sensitivity to immune checkpoint blockade. Science.2016;351(6280):1463-9.
25. Thommen DS, Koelzer VH, Herzig P, Roller A, Trefny M, Dimeloe S, et al. A transcriptionally andfunctionally distinct PD-1(+) CD8(+) T cell pool with predictive potential in non-small-cell lung cancertreated with PD-1 blockade. Nature medicine. 2018;24(7):994-1004.
2�. Im SJ, Hashimoto M, Gerner MY, Lee J, Kissick HT, Burger MC, et al. De�ning CD8+ T cells thatprovide the proliferative burst after PD-1 therapy. Nature. 2016;537(7620):417-21.
27. Sade-Feldman M, Yizhak K, Bjorgaard SL, Ray JP, de Boer CG, Jenkins RW, et al. De�ning T CellStates Associated with Response to Checkpoint Immunotherapy in Melanoma. Cell.2018;175(4):998-1013 e20.
2�. Brummelman J, Mazza EMC, Alvisi G, Colombo FS, Grilli A, Mikulak J, et al. High-dimensional singlecell analysis identi�es stem-like cytotoxic CD8(+) T cells in�ltrating human tumors. The Journal ofexperimental medicine. 2018;215(10):2520-35.
29. Snyder A, Makarov V, Merghoub T, Yuan J, Zaretsky JM, Desrichard A, et al. Genetic basis for clinicalresponse to CTLA-4 blockade in melanoma. The New England journal of medicine.2014;371(23):2189-99.
30. Van Allen EM, Miao D, Schilling B, Shukla SA, Blank C, Zimmer L, et al. Genomic correlates ofresponse to CTLA-4 blockade in metastatic melanoma. Science. 2015;350(6257):207-11.
31. Hugo W, Zaretsky JM, Sun L, Song C, Moreno BH, Hu-Lieskovan S, et al. Genomic and TranscriptomicFeatures of Response to Anti-PD-1 Therapy in Metastatic Melanoma. Cell. 2016;165(1):35-44.

Page 23/31
32. Riaz N, Havel JJ, Makarov V, Desrichard A, Urba WJ, Sims JS, et al. Tumor and MicroenvironmentEvolution during Immunotherapy with Nivolumab. Cell. 2017;171(4):934-49 e16.
33. Snyder A, Nathanson T, Funt SA, Ahuja A, Buros Novik J, Hellmann MD, et al. Contribution ofsystemic and somatic factors to clinical response and resistance to PD-L1 blockade in urothelialcancer: An exploratory multi-omic analysis. PLoS Med. 2017;14(5):e1002309.
34. Rizvi NA, Hellmann MD, Snyder A, Kvistborg P, Makarov V, Havel JJ, et al. Cancer immunology.Mutational landscape determines sensitivity to PD-1 blockade in non-small cell lung cancer. Science.2015;348(6230):124-8.
35. Le DT, Uram JN, Wang H, Bartlett BR, Kemberling H, Eyring AD, et al. PD-1 Blockade in Tumors withMismatch-Repair De�ciency. The New England journal of medicine. 2015;372(26):2509-20.
3�. Voorwerk L, Slagter M, Horlings HM, Sikorska K, van de Vijver KK, de Maaker M, et al. Immuneinduction strategies in metastatic triple-negative breast cancer to enhance the sensitivity to PD-1blockade: the TONIC trial. Nature medicine. 2019;25(6):920-8.
37. Bielski CM, Zehir A, Penson AV, Donoghue MTA, Chatila W, Armenia J, et al. Genome doubling shapesthe evolution and prognosis of advanced cancers. Nature genetics. 2018;50(8):1189-95.
3�. Dobin A, Davis CA, Schlesinger F, Drenkow J, Zaleski C, Jha S, et al. STAR: ultrafast universal RNA-seq aligner. Bioinformatics. 2013;29(1):15-21.
39. Li B, Dewey CN. RSEM: accurate transcript quanti�cation from RNA-Seq data with or without areference genome. BMC bioinformatics. 2011;12:323.
40. Jamal-Hanjani M, Wilson GA, McGranahan N, Birkbak NJ, Watkins TBK, Veeriah S, et al. Tracking theEvolution of Non-Small-Cell Lung Cancer. The New England journal of medicine. 2017;376(22):2109-21.
41. Shukla SA, Rooney MS, Rajasagi M, Tiao G, Dixon PM, Lawrence MS, et al. Comprehensive analysisof cancer-associated somatic mutations in class I HLA genes. Nature biotechnology.2015;33(11):1152-8.
42. Andreatta M, Nielsen M. Gapped sequence alignment using arti�cial neural networks: application tothe MHC class I system. Bioinformatics. 2016;32(4):511-7.
43. Pierini F, Lenz TL. Divergent allele advantage at human MHC genes: signatures of past and ongoingselection. Molecular biology and evolution. 2018.
44. Grantham R. Amino acid difference formula to help explain protein evolution. Science.1974;185(4154):862-4.
45. Robinson J, Soormally AR, Hayhurst JD, Marsh SGE. The IPD-IMGT/HLA Database - Newdevelopments in reporting HLA variation. Human immunology. 2016;77(3):233-7.
4�. Turajlic S, Litch�eld K, Xu H, Rosenthal R, McGranahan N, Reading JL, et al. Insertion-and-deletion-derived tumour-speci�c neoantigens and the immunogenic phenotype: a pan-cancer analysis. TheLancet Oncology. 2017;18(8):1009-21.

Page 24/31
47. Lindeboom RGH, Vermeulen M, Lehner B, Supek F. The impact of nonsense-mediated mRNA decayon genetic disease, gene editing and cancer immunotherapy. Nature genetics. 2019.
4�. Davoli T, Uno H, Wooten EC, Elledge SJ. Tumor aneuploidy correlates with markers of immuneevasion and with reduced response to immunotherapy. Science. 2017;355(6322).
49. Gettinger S, Choi J, Hastings K, Truini A, Datar I, Sowell R, et al. Impaired HLA Class I AntigenProcessing and Presentation as a Mechanism of Acquired Resistance to Immune CheckpointInhibitors in Lung Cancer. Cancer discovery. 2017;7(12):1420-35.
50. Shin DS, Zaretsky JM, Escuin-Ordinas H, Garcia-Diaz A, Hu-Lieskovan S, Kalbasi A, et al. PrimaryResistance to PD-1 Blockade Mediated by JAK1/2 Mutations. Cancer discovery. 2017;7(2):188-201.
51. Conway JR, Kofman E, Mo SS, Elmarakeby H, Van Allen E. Genomics of response to immunecheckpoint therapies for cancer: implications for precision medicine. Genome medicine.2018;10(1):93.
52. Valsamo Anagnostou 1, 9*, Noushin Niknafs1,9, Kristen Marrone1,2, Daniel C. Bruhm1, JRW, ,Jarushka Naidoo1, Karlijn Hummelink3, KM, FL, et al. Multimodal genomic features predictoutcome of immune checkpoint blockade in non-small-cell lung cancer. Nature Cancer. 2020.
53. Riaz N, Havel JJ, Kendall SM, Makarov V, Walsh LA, Desrichard A, et al. Recurrent SERPINB3 andSERPINB4 mutations in patients who respond to anti-CTLA4 immunotherapy. Nature genetics.2016;48(11):1327-9.
54. Peng W, Chen JQ, Liu C, Malu S, Creasy C, Tetzlaff MT, et al. Loss of PTEN Promotes Resistance to TCell-Mediated Immunotherapy. Cancer discovery. 2016;6(2):202-16.
55. Tumeh PC, Harview CL, Yearley JH, Shintaku IP, Taylor EJ, Robert L, et al. PD-1 blockade inducesresponses by inhibiting adaptive immune resistance. Nature. 2014;515(7528):568-71.
5�. Gibney GT, Weiner LM, Atkins MB. Predictive biomarkers for checkpoint inhibitor-basedimmunotherapy. The Lancet Oncology. 2016;17(12):e542-e51.
57. Chow MT, Ozga AJ, Servis RL, Frederick DT, Lo JA, Fisher DE, et al. Intratumoral Activity of the CXCR3Chemokine System Is Required for the E�cacy of Anti-PD-1 Therapy. Immunity. 2019;50(6):1498-512e5.
Figures

Page 25/31
Figure 1
The biomarker landscape of CPI response Panel A shows previously published biomarkers as rows andindividual cohorts within the CPI1000+ cohort as columns. The heatmap indicates the effect size of eachbiomarker in each cohort, measured as the log2 odds ratio for response “CR/PR” versus non-response“SD/PD” derived from logistic regression. Drug class and cohort sizes are annotated, and the right handforest plot shows the overall effect size and signi�cance of each biomarker in meta-analysis across all

Page 26/31
studies, based on effect sizes and stand errors from each individual cohort. Panel B shows the correlationbetween biomarkers which are measured on a continuous scale. Panel C shows the proportion ofvariance explained for each category of biomarker, for each study, calculated using logistic regressionpseudo-R2.
Figure 2

Page 27/31
A multivariate predictor of CPI response outperforms TMB Panel A shows area under the ROC curvevalues in unseen samples (25% subsample of each cohort), with distribution derived using 1000 roundsof Monte Carlo sampling. The largest cohort for each cancer type, with n>50 samples with exome andtranscriptome data, were utilised. The multivariate predictive model was compared to an identical modelusing TMB only, as a benchmark comparator. Panel B shows the feature importance scores fromXGBoost for the multivariate model, corresponding to the same Monte Carlo sampling rounds. Panel Cshows ROC curves and AUC values for the multivariate and TMB predictors, in the two independent testcohorts not used in any of the model training steps. P-values report the signi�cance of improvedperformance for the multivariate versus TMB model, using DeLong’s test.

Page 28/31
Figure 3
Somatic copy number alteration pro�le of CPI responders vs non-responders Panel A shows thefrequency of somatic copy number gain (top) and loss (bottom) across the genome for CPI responders(“CR/PR”) vs non-responders (“SD/PD”). Panel B shows cytobands with signi�cantly different loss ofgain frequency in responders vs non-responders. Panel C shows minimal mapping of the 9q34 locus, toidentify the peak of differential loss frequency between groups. Panel D shows the TRAF2 loss %

Page 29/31
frequencies for cohorts with a signi�cant difference between responders and non-responders. Panel E themost frequent whole chromosome loss events (p+q) in TCGA data, from the same eight histologies asanalysed in the CPI1000+ cohort. Panel F shows an hypothesised model of collateral sensitization to CPItreatment, in tumors which have both loss of 9p+9q versus 9p loss only. Panel G shows validation cohortdata from CPI treated patients sequenced with the MSK-IMPACT panel, comparing overall survival for 9ploss only versus 9p+9q34 loss groups. Panel H shows immune evasion analysis, measuring as the % ofpatients with an antigen presentation pathway defect between tumours with 9q34 wildtype (i.e. no loss)compared to 9q34 loss tumors. The left barplot includes either a somatic copy number loss, or a non-synonymous mutation, in an antigen presentation pathway gene. The right plot includes non-synonymous mutations only. Antigen presentation pathway genes were de�ned as per Rosenthal et al.2019 Nature (11), also see methods.
Figure 4
Focal ampli�cation and deletion pro�le of CPI responders vs non-responders Panel A shows the CPIresponse rate (% “CR/PR”) in patients with focal ampli�cation (de�ned as copy number => 5) orhomozygous deletion (copy number =0) compared to wildtype (non-ampli�ed/deleted) tumors. Theanalysis was conducted for all oncogenes/tumor suppressor genes with greater than 5%ampli�cation/deletion frequency in the CPI1000+ cohort. Panel B shows the counts of CCND1ampli�cation by histology. Panel C shows mRNA expression (measured in TPM) for CCND1 in respondersversus non-responders from the Mariathasan et al. bladder cancer cohort. Panel D shows overall survivalanalysis in MSK-IMPACT bladder cancer CPI treated patients, for CCND1 ampli�ed versus wildtype tumorgroups. Panel E shows overall survival analysis in MSK-IMPACT bladder cancer non-CPI treated patients,

Page 30/31
for CCND1 ampli�ed versus wildtype tumor groups. Panel F shows overall survival analysis in MSK-IMPACT pan-cancer CPI treated patients, for CCND1 ampli�ed versus wildtype tumor groups. Panel Gshows overall survival analysis in MSK-IMPACT pan-cancer non-CPI treated patients, for CCND1 ampli�edversus wildtype tumor groups.
Figure 5
CD8+ neoantigen reactive single cell RNAseq and CPI1000+ cohort analysis Panel A shows single cellRNA sequencing data from neoantigen multimer negative versus positive CD8+ TILs. The top plot showsthe sorting of multimer positive versus negative T cells, and the bottom plot shows differential geneexpression analysis between multimer+ versus multimer- cells, with log2 fold-change shown on the x-axisand –log10 p-value on the y-axis. Signi�cant genes with >2 fold-change (FC) up-regulation (log2(FC)>1)and FDR < 0.05 are shown blue. Panel B shows the same fold change up-regulation values from panel Bon y-axis and then overlaid on the x-axis is up-regulation scores from the CPI1000+ cohort (log2(FC)values for responders “PR/CR” vs non-responders “SD/PD”). The panel only shows genes signi�cantly

Page 31/31
up-regulated in both experiments. Panel C show patient level data for the two most strongly unregulatedgenes (CXCL13 and CCR5) from panel B from the CPI1000+ cohort.
Supplementary Files
This is a list of supplementary �les associated with this preprint. Click to download.
FigS1.pdf
FigS2.pdf
FigS3.pdf
FigS4.pdf
FigS5.pdf
FigS6.pdf
FigS7.pdf
FigS8.pdf
TableS1.xlsx