Embed Size (px)
Citation preview
Mechanisms of the Persistent Photoconductivity Quenching
in Pb1-xSnxTe(In)
V.I. Chernichkin, D.E. Dolzhenko, L.I. Ryabova, D.R.
KhokhlovM.V. Lomonosov Moscow State
University
Unusual Impurity States in Pb1-xSnxTe(In)
and on a Way to the Passive Terahertz Imager
V.I. Chernichkin, D.E. Dolzhenko, L.I. Ryabova, D.R.
KhokhlovM.V. Lomonosov Moscow State
University
Cooperation M.V. Lomonosov
Moscow State University
Ludmila Ryabova Dmitry Dolzhenko Vladimir Chernichkin
Institute of Applied Physics, Kishinev, Moldova
Andrey Nicorici University of Beer
Sheva, Israel Vladimir Kasiyan Zinovy Dashevsky
University of Regensburg
Sergey Ganichev Sergey Danilov
A.F. Ioffe Physical-Technical Institute, St-Petersburg
Vassily Bel’kov
Outline
1. Introduction 2. Undoped lead telluride-based alloys. 3. Effects appearing upon doping.
a) Fermi level pinning effect. b) Persistent photoconductivity. c) Theoretical model
4. Terahertz photoconductivity and local metastable states
5. Pb1-xSnxTe(In)-based terahertz photodetectors. 6. Summary.
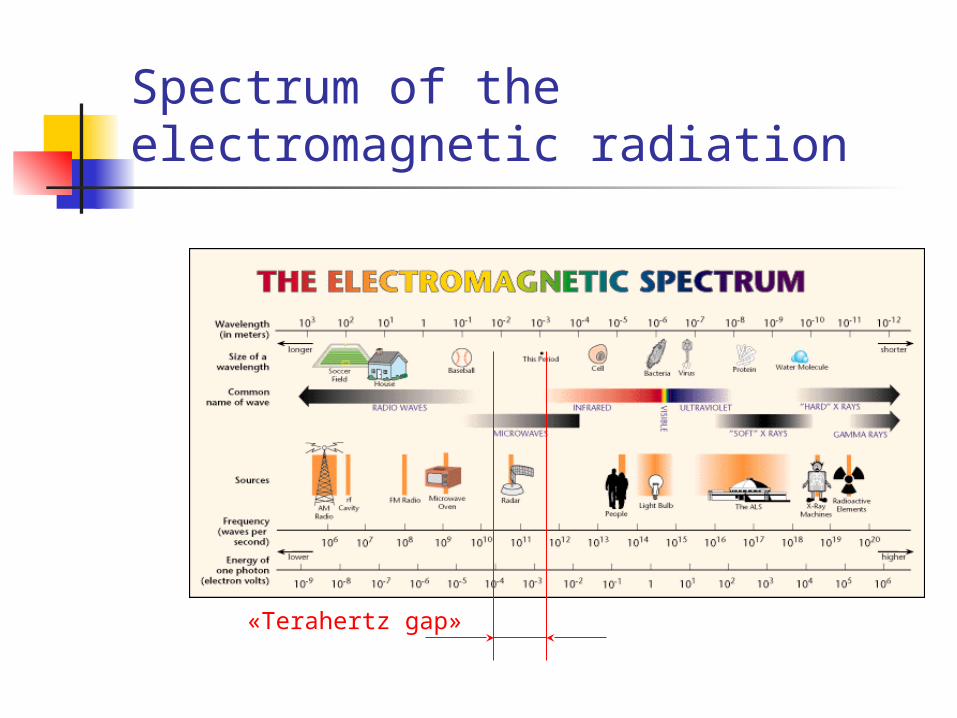
Spectrum of the electromagnetic radiation
«Terahertz gap»
Terahertz radiation
In this spectral region both radiophysics methods (at the long-wavelength side) and optical methods (at the short-wavelength side) work not well
Consequence: absence of good sources and sensitive detectors of radiation
Areas of application of the Terahertz radiation
Monitoring of concentration of heavy organic molecules
Medical applications (oncology, stomatology)
Meteorology Security systems (search and
detection of explosives) Infrared astronomy
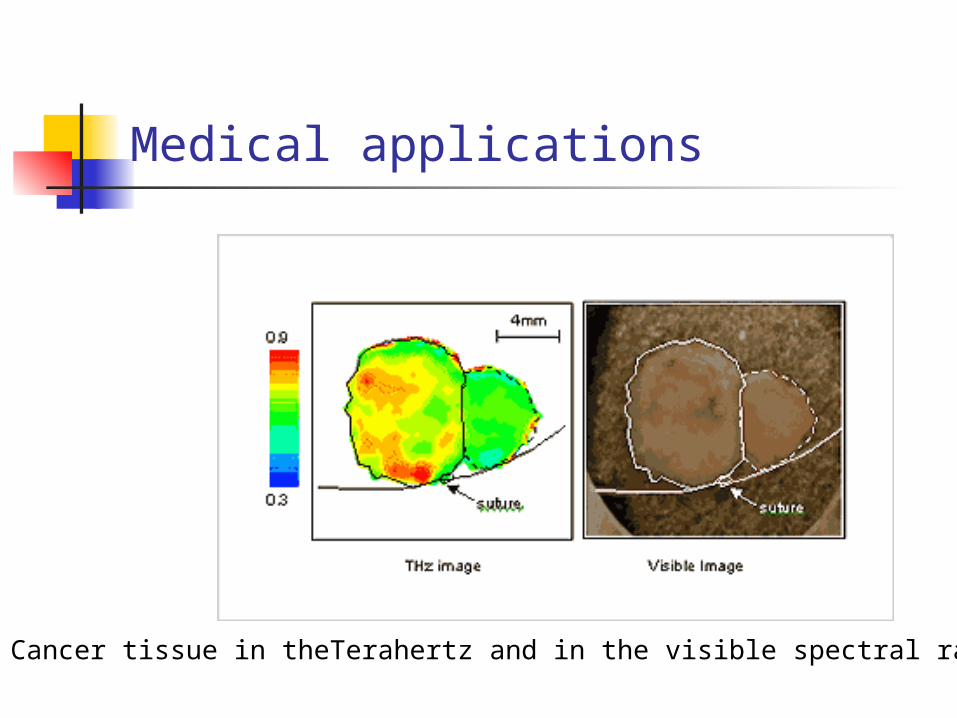
Medical applications
Cancer tissue in theTerahertz and in the visible spectral range
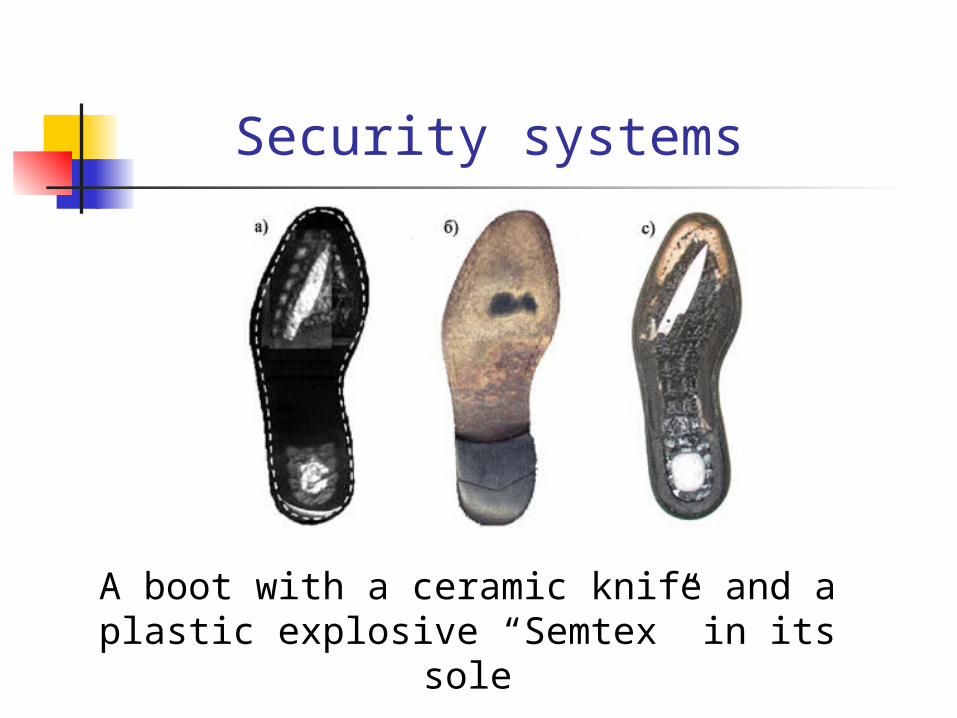
Security systems
A boot with a ceramic knife and a plastic explosive “Semtex” in its sole
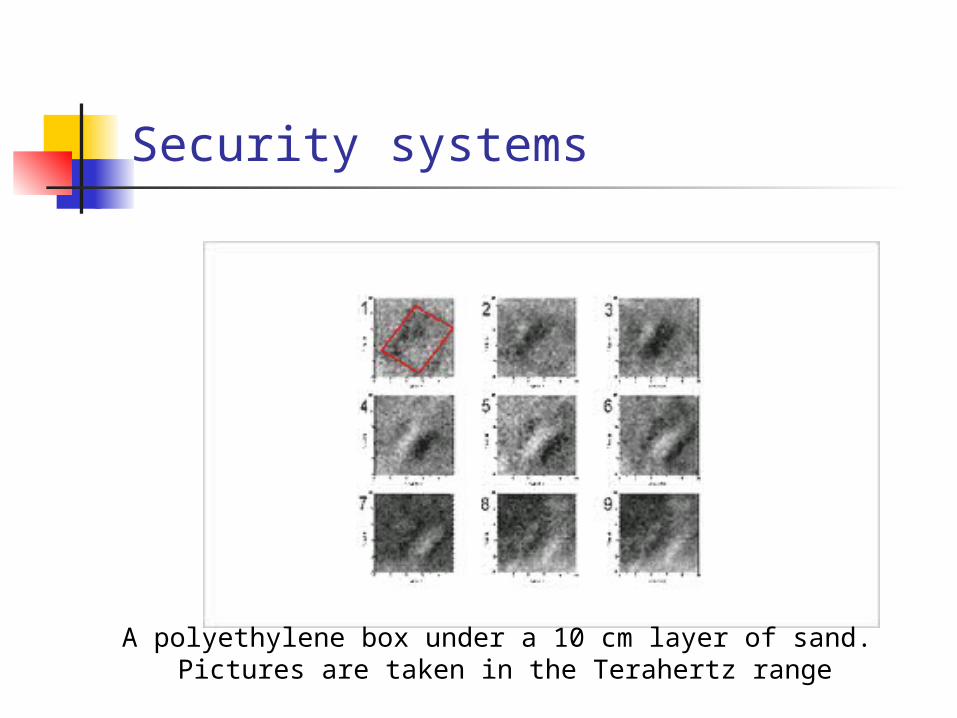
Security systems
A polyethylene box under a 10 cm layer of sand. Pictures are taken in the Terahertz range
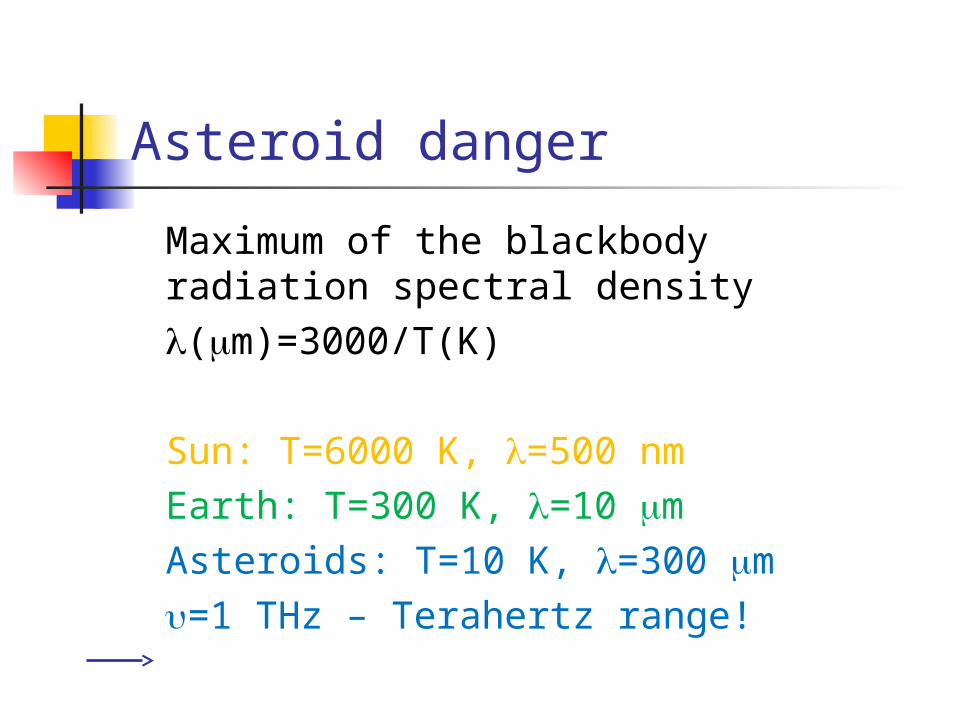
Asteroid danger
Maximum of the blackbody radiation spectral density
(m)=3000/T(K)
Sun: T=6000 K, =500 nmEarth: T=300 K, =10 mAsteroids: T=10 K, =300 m =1 THz – Terahertz range!
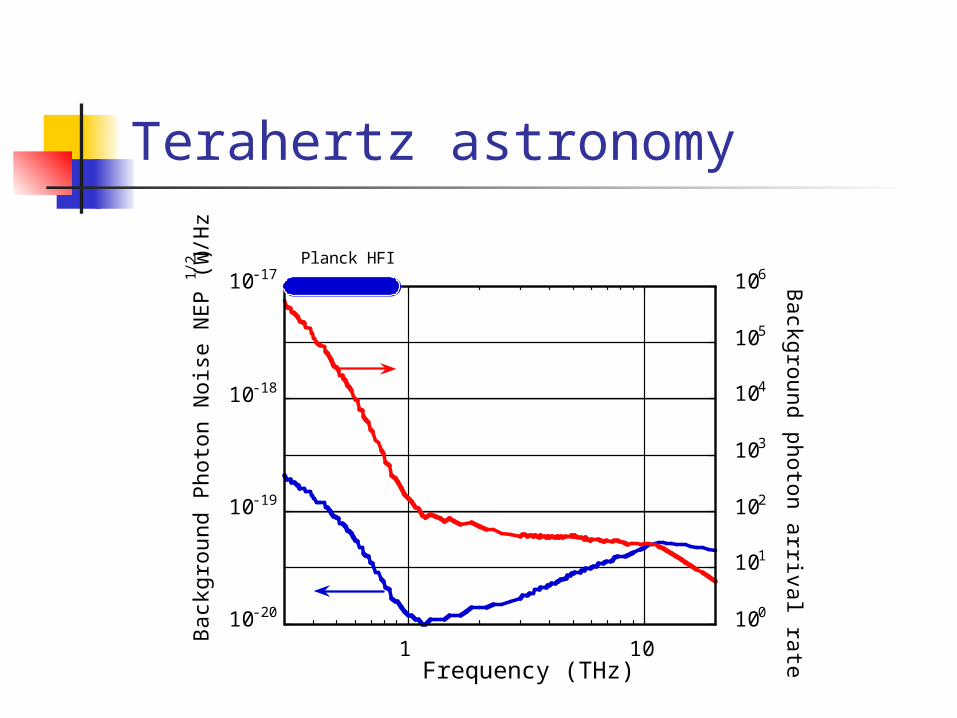
Terahertz astronomy
10-20
10-19
10-18
10-17
100
101
102
103
104
105
106
1 10
Bac
kgro
und
Pho
ton
Noi
se N
EP
(W
/Hz1
/2)
Background photon arrival rate (1/s)
Frequency (THz)
Planck HFI
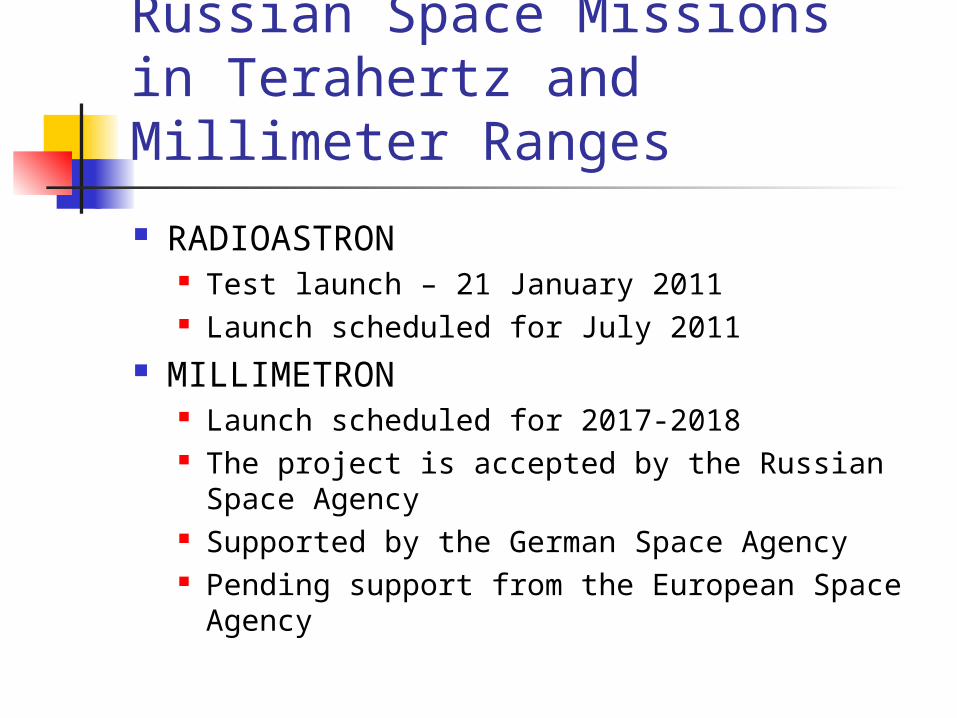
Russian Space Missions in Terahertz and Millimeter Ranges
RADIOASTRON Test launch – 21 January 2011 Launch scheduled for July 2011
MILLIMETRON Launch scheduled for 2017-2018 The project is accepted by the Russian Space
Agency Supported by the German Space Agency Pending support from the European Space
Agency
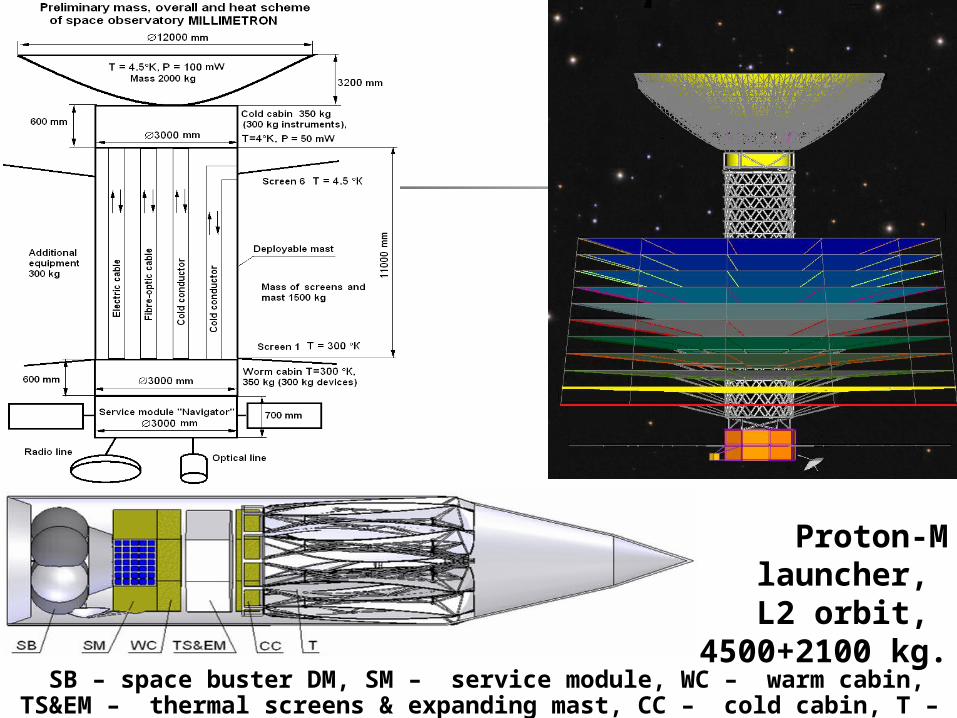
Proton-M launcher, L2 orbit,
4500+2100 kg.SB – space buster DM, SM – service module, WC – warm cabin,
TS&EM – thermal screens & expanding mast, CC – cold cabin, T – telescope.
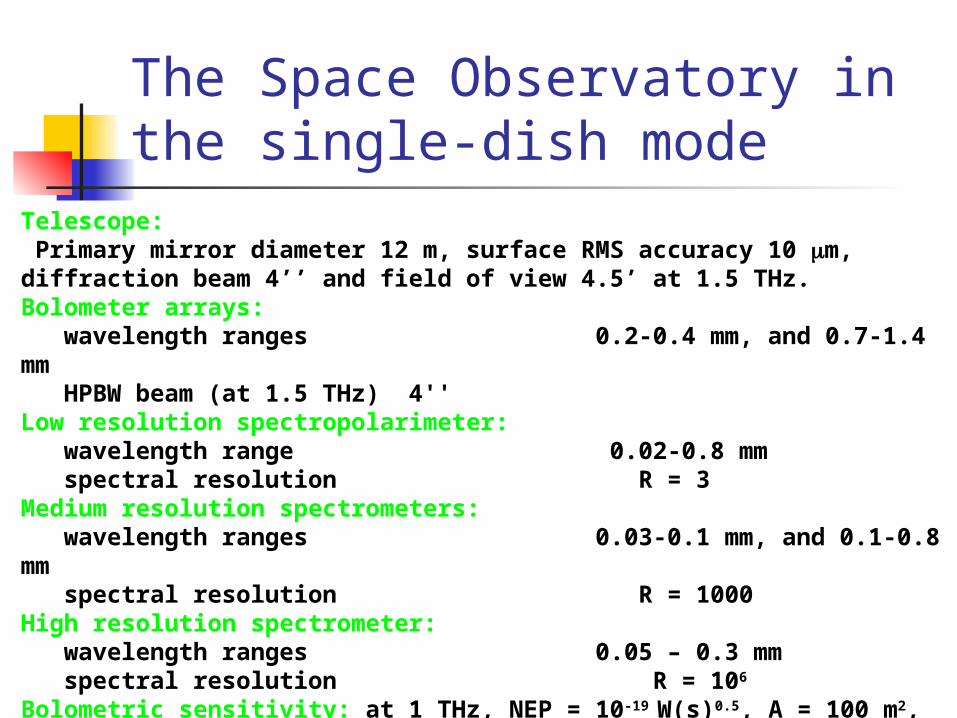
The Space Observatory in the single-dish mode
Telescope: Primary mirror diameter 12 m, surface RMS accuracy 10 m, diffraction beam 4’’ and field of view 4.5’ at 1.5 THz. Bolometer arrays: wavelength ranges 0.2-0.4 mm, and 0.7-1.4 mm HPBW beam (at 1.5 THz) 4''Low resolution spectropolarimeter: wavelength range 0.02-0.8 mm spectral resolution R = 3Medium resolution spectrometers: wavelength ranges 0.03-0.1 mm, and 0.1-0.8 mm spectral resolution R = 1000High resolution spectrometer: wavelength ranges 0.05 – 0.3 mm spectral resolution R = 106
Bolometric sensitivity: at 1 THz, NEP = 10-19 W(s)0.5, A = 100 m2, R=3 and 1 h integration 5∙10-9 Jy (1 )
State of the art sensitive terahertz detectors
Transition edge sensors Hot electron bolometers Ge(Ga) blocked impurity band
detectors Kinetic inductance detectors
Problems (as I see them)
Very low operating temperature < 150 mK
NEP not better than 4*10-19 W/Hz1/2 in the lab and not better than 10-17 W/Hz1/2 in real space missions
Quite poor dynamic range Problems with arrays
Alternative possibility
Doped lead telluride-based alloys
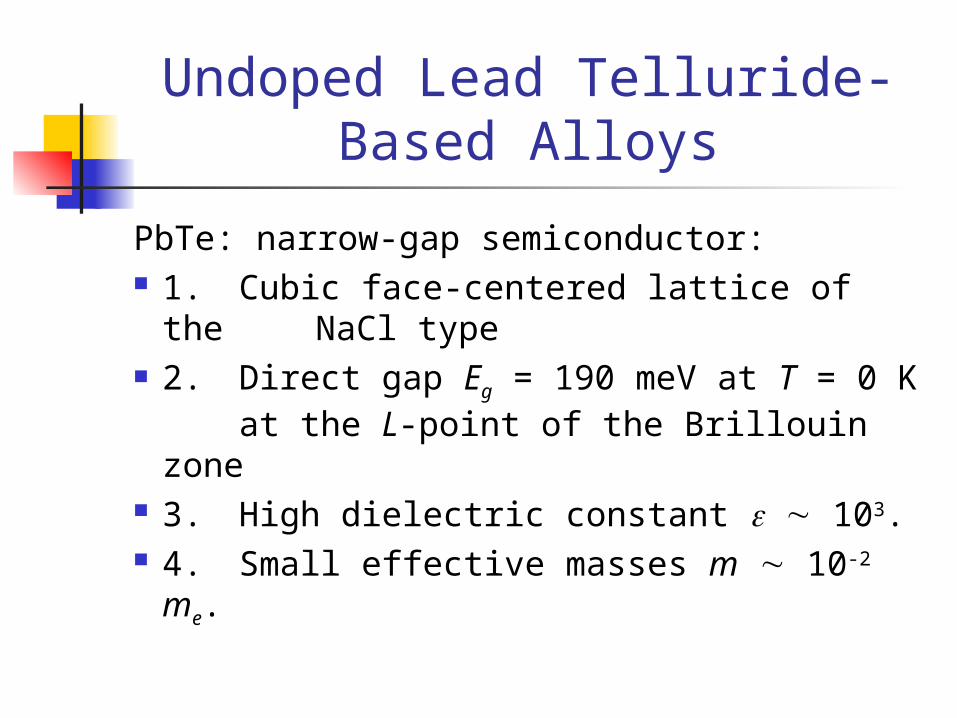
Undoped Lead Telluride-Based Alloys
PbTe: narrow-gap semiconductor: 1. Cubic face-centered lattice of the
NaCl type 2. Direct gap Eg = 190 meV at T = 0 K
at the L-point of the Brillouin zone 3. High dielectric constant 103. 4. Small effective masses m 10-2 me.
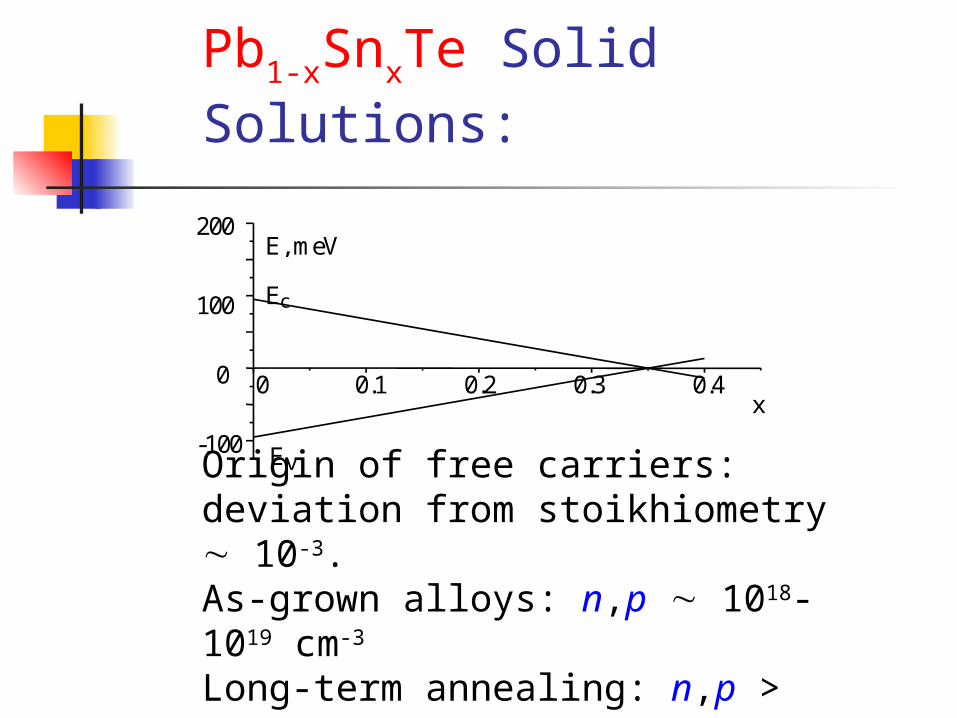
Pb1-xSnxTe Solid Solutions:
0 0.1 0.2 0.3 0.4
-100
0
100
200
Ev
Ec
E, meV
x
Origin of free carriers: deviation from stoikhiometry 10-
3.As-grown alloys: n,p 1018-1019 cm-3
Long-term annealing: n,p > 1016 cm-3
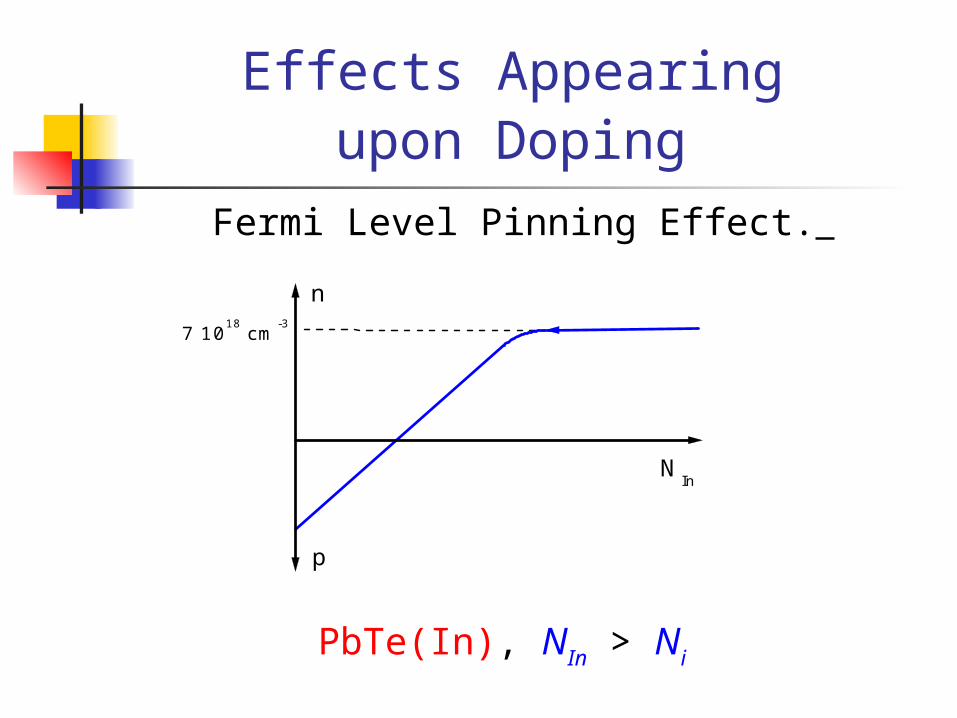
Effects Appearing upon Doping
Fermi Level Pinning Effect.
7 1018
cm-3
NIn
p
n
PbTe(In), NIn > Ni
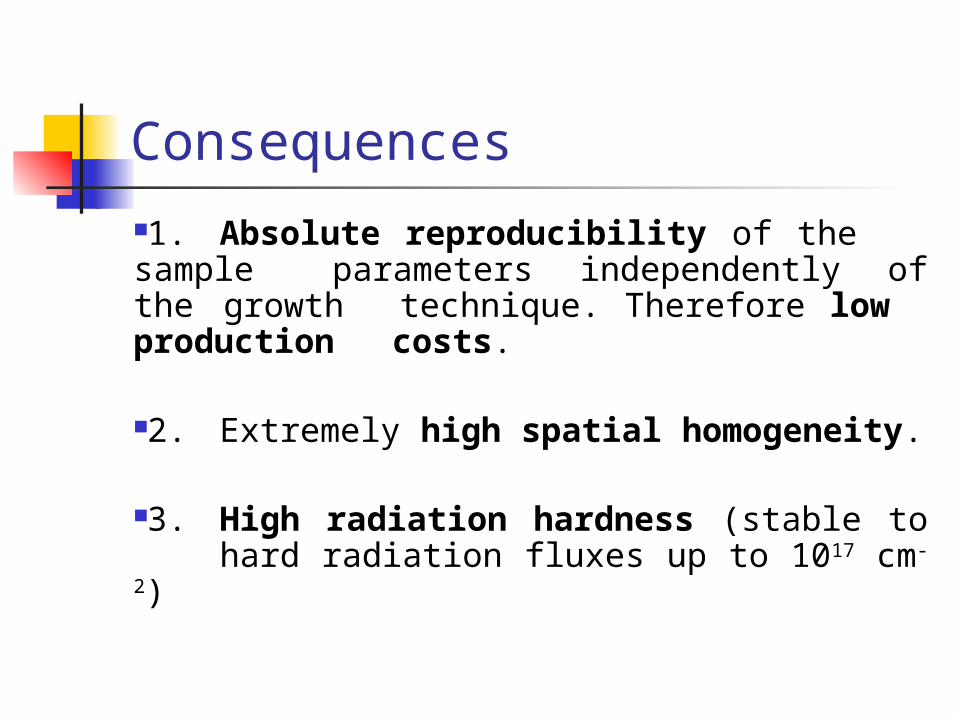
Consequences
1. Absolute reproducibility of the sample parameters independently of the growth technique. Therefore low
production costs.
2. Extremely high spatial homogeneity.
3. High radiation hardness (stable to hard radiation fluxes up to 1017 cm-2)
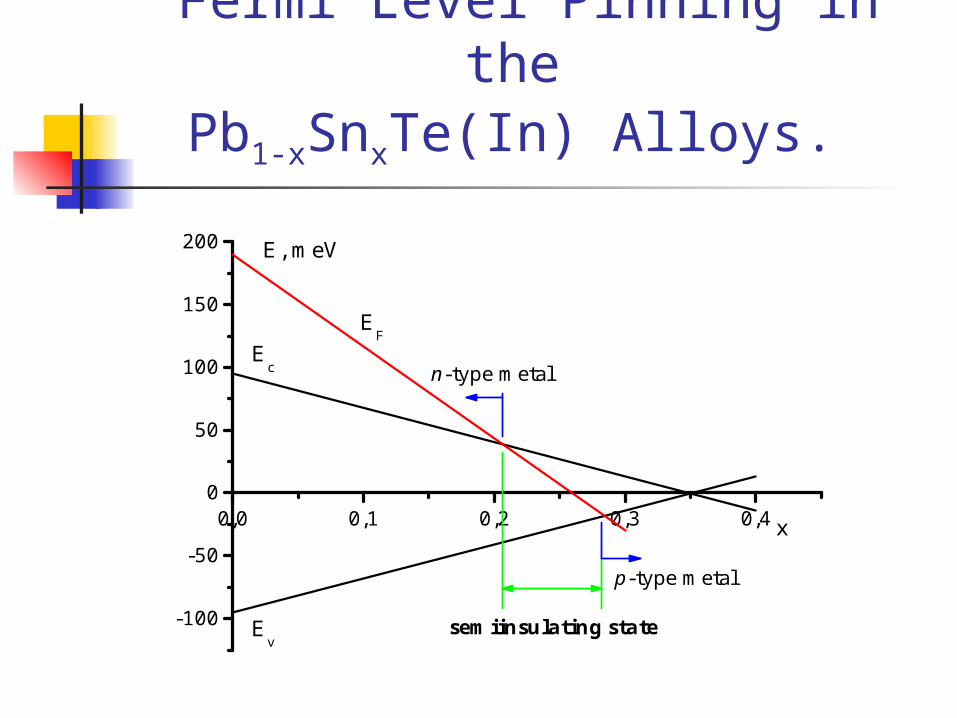
Fermi Level Pinning in the Pb1-xSnxTe(In) Alloys.
0,0 0,1 0,2 0,3 0,4
-100
-50
0
50
100
150
200
semiinsulating state
p-type metal
n-type metal
Ev
Ec
EF
E, meV
x
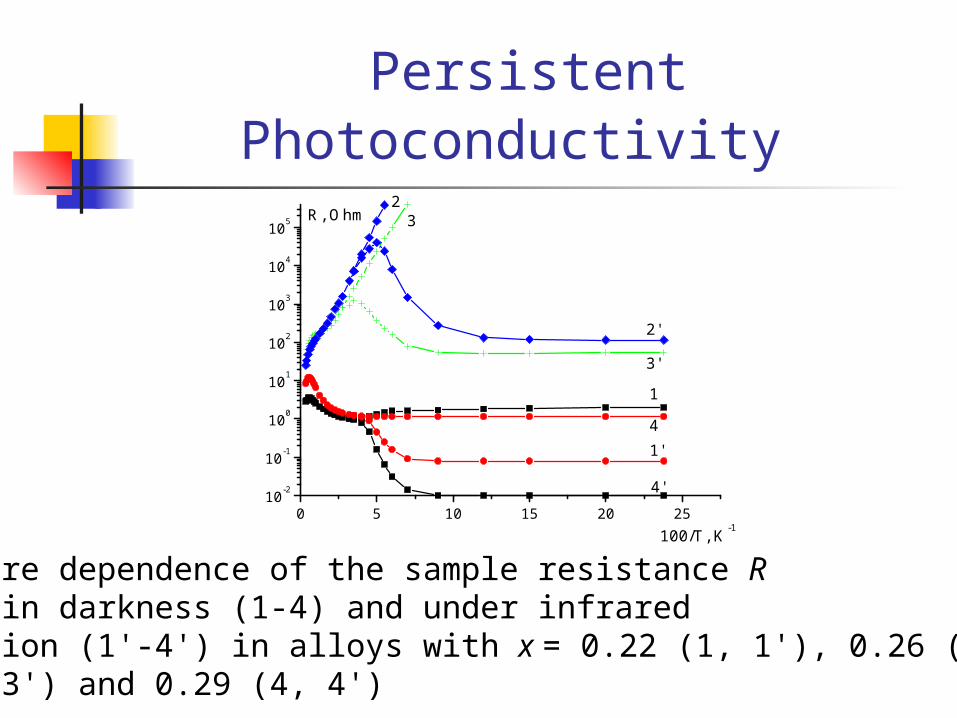
Persistent Photoconductivity
0 5 10 15 20 2510-2
10-1
100
101
102
103
104
105
3'
2'
32
4'
41'
1
R, Ohm
100/T, K-1
Temperature dependence of the sample resistance Rmeasured in darkness (1-4) and under infrared illumination (1'-4') in alloys with x = 0.22 (1, 1'), 0.26 (2, 2'), 0.27 (3, 3') and 0.29 (4, 4')
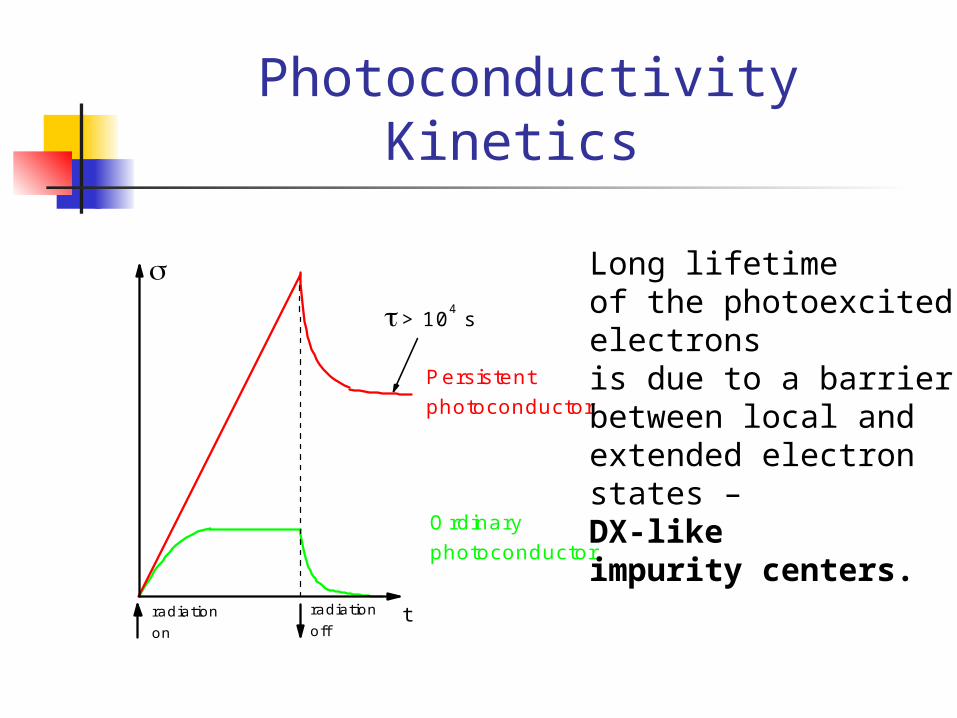
Photoconductivity Kinetics
> 104 s
Ordinaryphotoconductor
Persistent photoconductor
tradiationoff
radiation on
Long lifetime of the photoexcited electrons is due to a barrier between local and extended electron states – DX-like impurity centers.
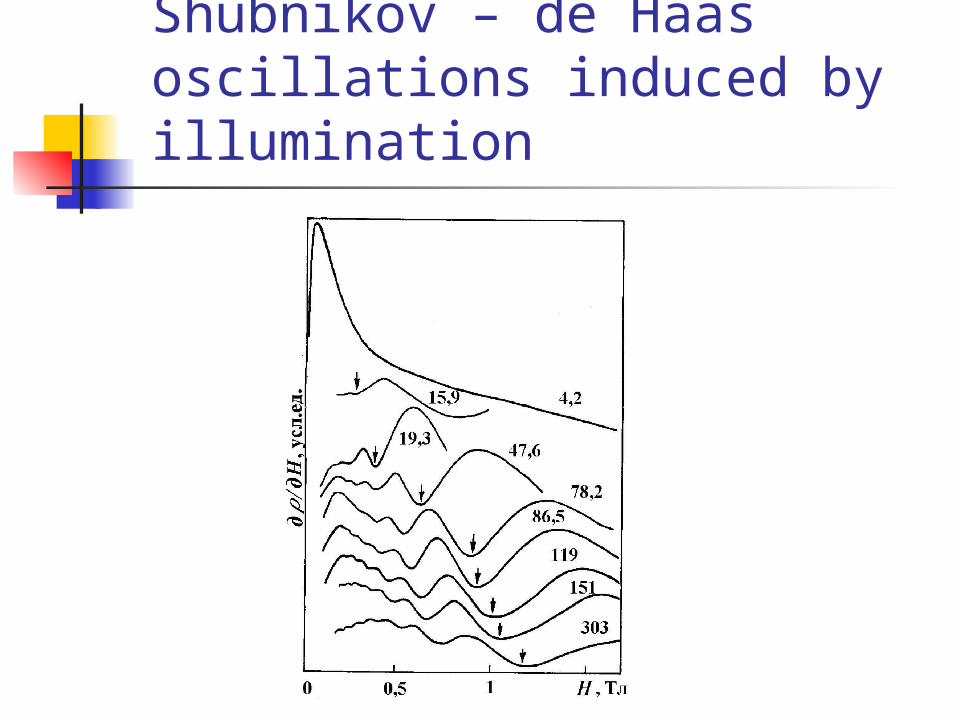
Shubnikov – de Haas oscillations induced by illumination
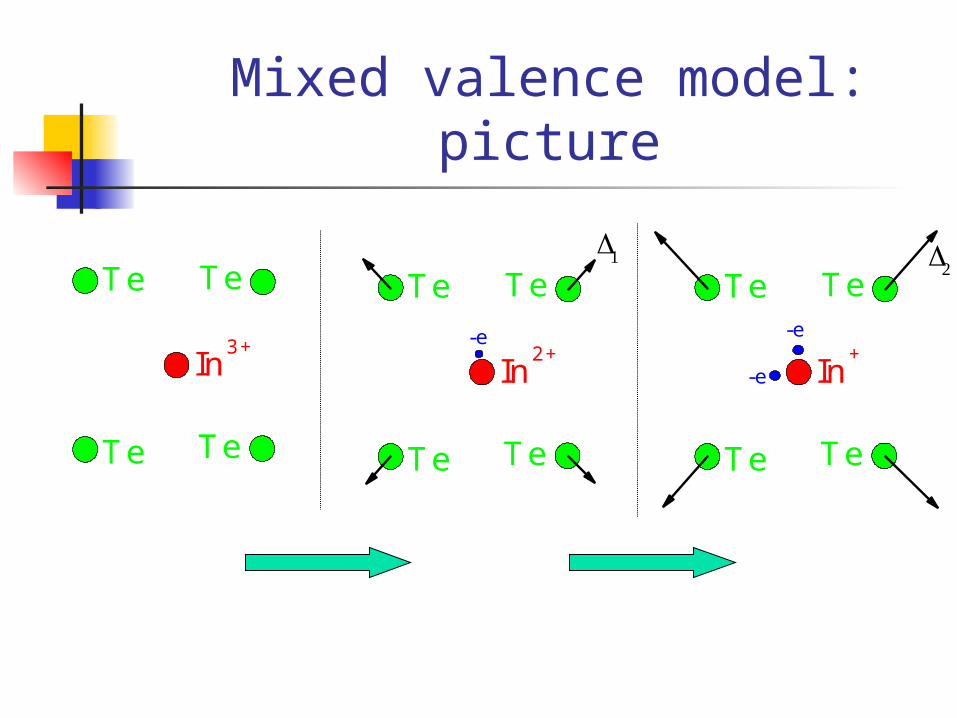
Mixed valence model: picture
TeTe
Te
In2+
Te
-e
TeTe
Te
In3+
Te-e
TeTe
Te
In+
Te
-e

Model for long-term relaxation processes
TeTe
Te
In
Te
e
h
Configuration-coordinate diagramEtot = Eel + Elat =
= (Ei-)n +2/20
(n = 0,1,2) – number of localized electrons
Bound electron,The lattice is locally deformed
Bound state Of one electron
Free electronIn the conduction band
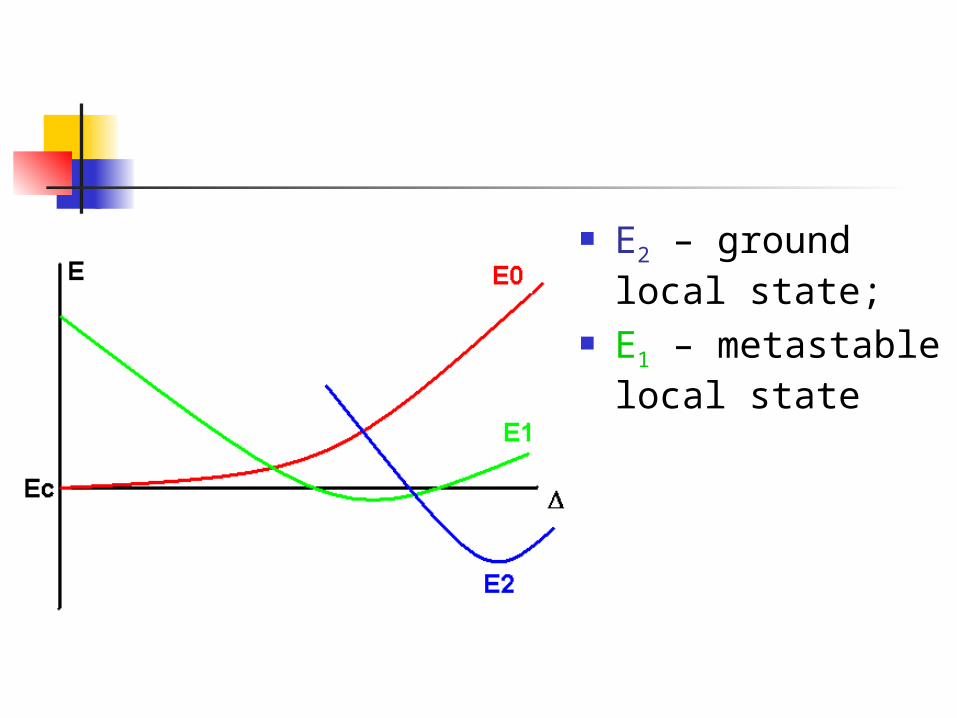
E2 – ground local state;
E1 – metastable local state
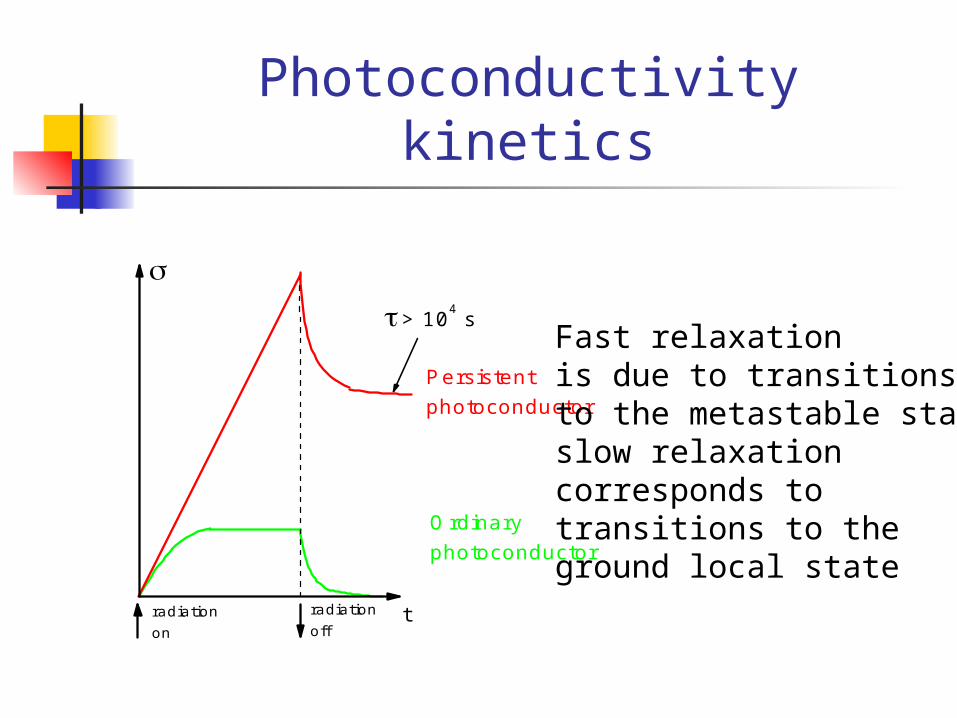
Photoconductivity kinetics
> 104 s
Ordinaryphotoconductor
Persistent photoconductor
tradiationoff
radiation on
Fast relaxationis due to transitionsto the metastable state,slow relaxationcorresponds to transitions to theground local state
Local metastable states
The metastable states are responsible for appearance of a range of strong effects:
Enhanced diamagnetic response up to 1% of ideal
Enhancement of effectic dielectric permittivity up to 105 at TeraHertz illumination
Giant negative magnetoresistance up to 106
Persistent photoconductivity in the terahertz spectral range
Spectral response
Two approaches Low-background: sample screened
from the background radiation, low-intensity sources
High-background: sample is not screened from the background radiation, high-intensity sources
High-background approach Laser wavelengths:
90, 148, 280, 496 m Pulse length: 100 ns Power in a pulse: up to 30 kW Sample temperature: 4.2 – 300 K Samples: single crystalline
Pb0.75Sn0.25Te(In), polycrystalline PbTe(In) films
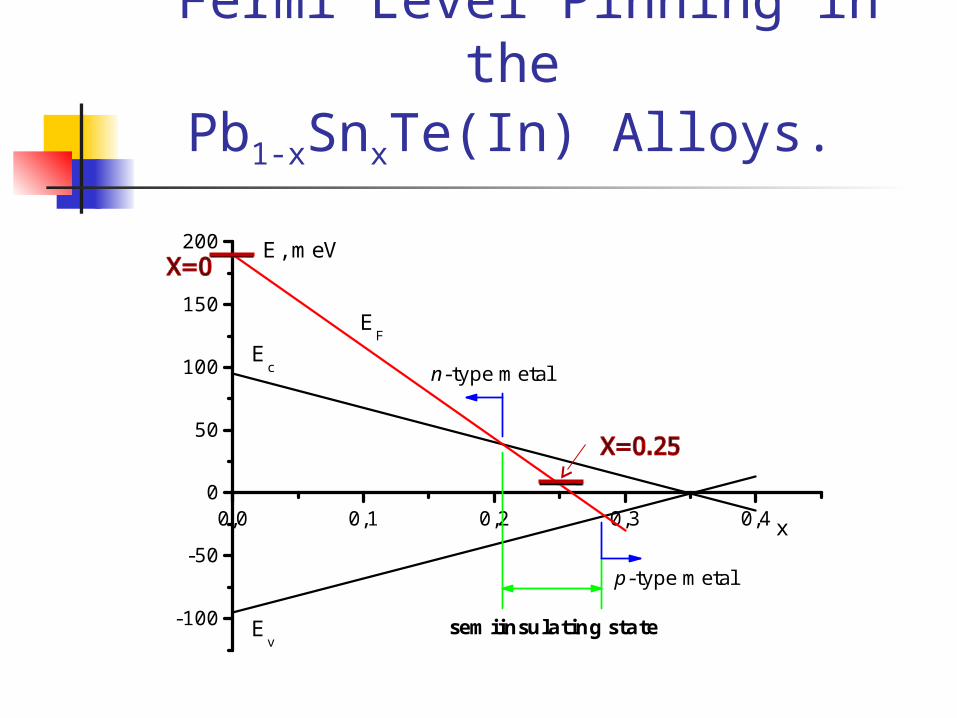
Fermi Level Pinning in the Pb1-xSnxTe(In) Alloys.
0,0 0,1 0,2 0,3 0,4
-100
-50
0
50
100
150
200
semiinsulating state
p-type metal
n-type metal
Ev
Ec
EF
E, meV
x
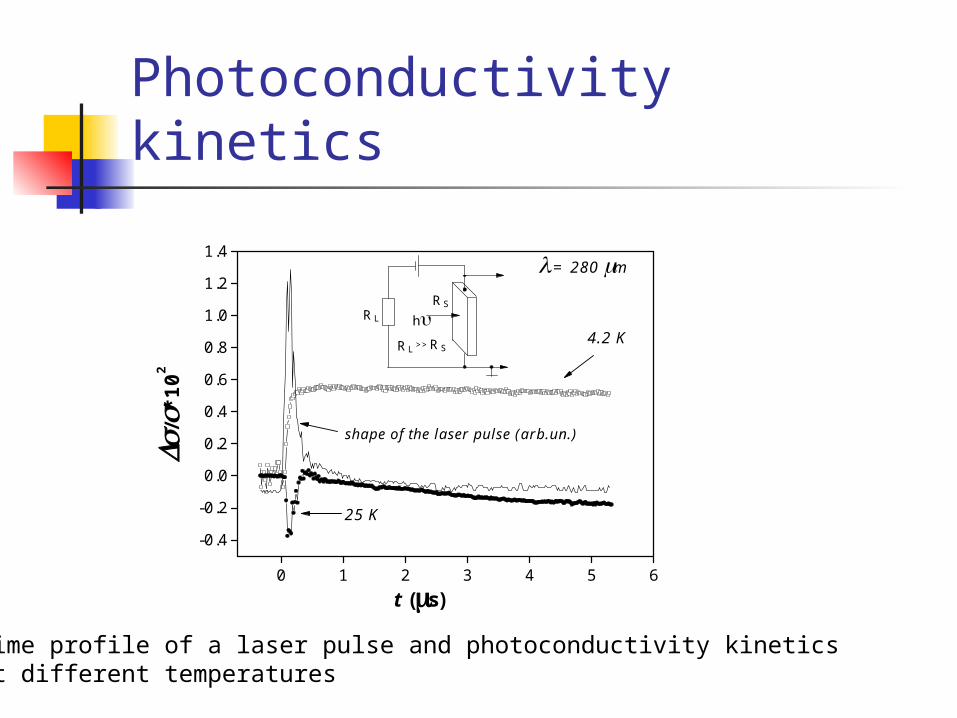
Photoconductivity kinetics
Time profile of a laser pulse and photoconductivity kinetics at different temperatures
0 1 2 3 4 5 6
-0.4
-0.2
0.0
0.2
0.4
0.6
0.8
1.0
1.2
1.4
RS
RSRL
hRL
>>
/
*102
t (s)
shape of the laser pulse (arb.un.)
4.2 K
25 K
= 280 m
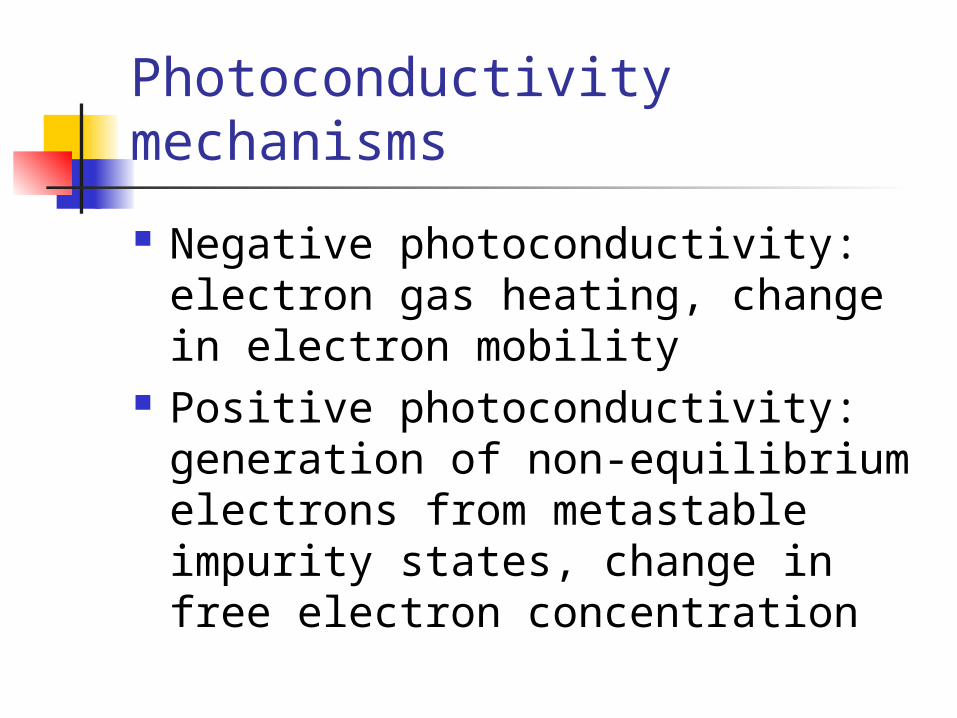
Photoconductivity mechanisms
Negative photoconductivity: electron gas heating, change in electron mobility
Positive photoconductivity: generation of non-equilibrium electrons from metastable impurity states, change in free electron concentration
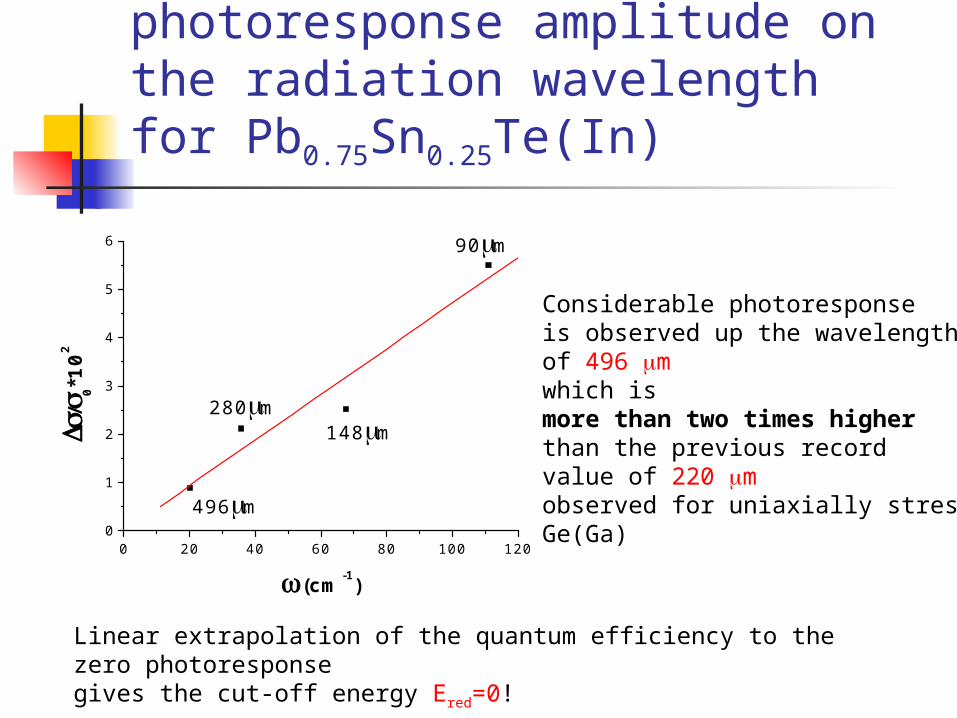
Dependence of the photoresponse amplitude on the radiation wavelength for Pb0.75Sn0.25Te(In)
0 20 40 60 80 100 1200
1
2
3
4
5
6
/
0*10
2
(cm-1)
496m
280m148m
90m
Considerable photoresponseis observed up the wavelengthof 496 m which is more than two times higherthan the previous recordvalue of 220 m observed for uniaxially stressed Ge(Ga)
Linear extrapolation of the quantum efficiency to the zero photoresponsegives the cut-off energy Еred=0!
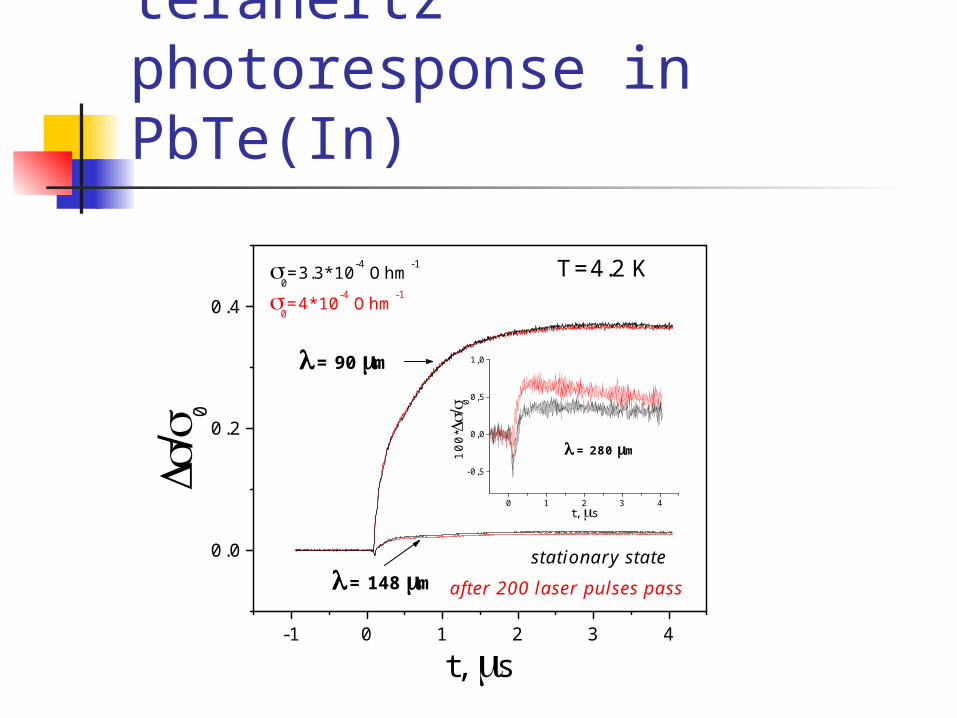
Kinetics of the terahertz photoresponse in PbTe(In)
-1 0 1 2 3 4
0.0
0.2
0.4
0 1 2 3 4
-0,5
0,0
0,5
1,0
= 280 m10
0*
0
t, s
0=4*10-4 Ohm-1
0=3.3*10-4 Ohm-1
after 200 laser pulses passstationary state
T=4.2 K
= 148 m
= 90 m
0
t, s
EF
Ec
EqF
0
20
40
60
80
100
E, meV
Equ
E, meV
Ec
EF
EqF
Equ
0
20
40
60
-20
-40
PbTe(In) Pb0.75Sn0.25Te(In)
EqF
Equ
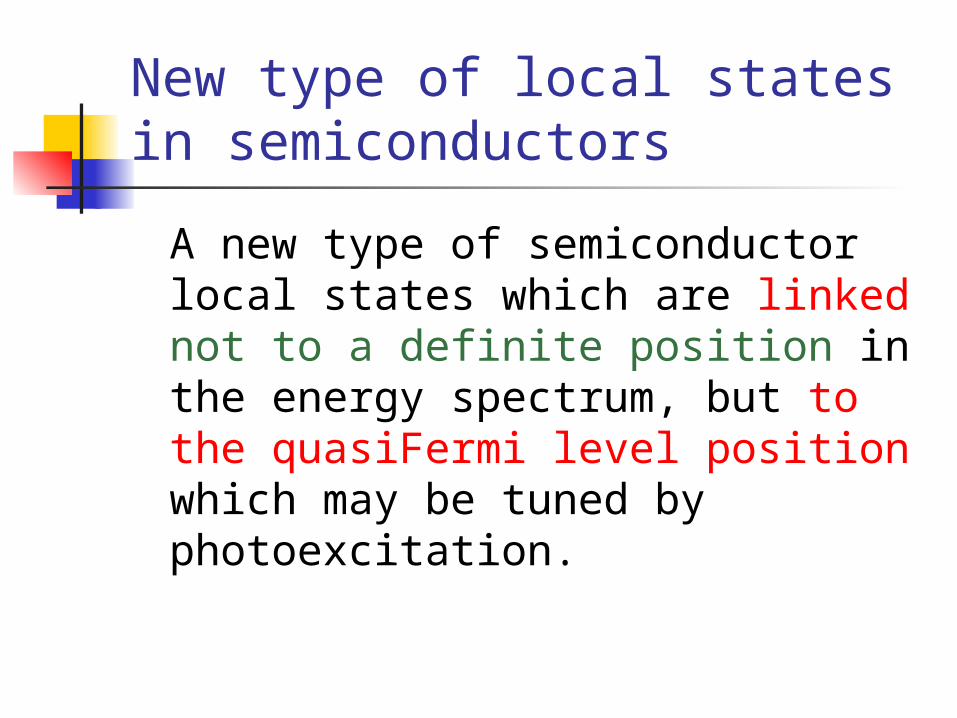
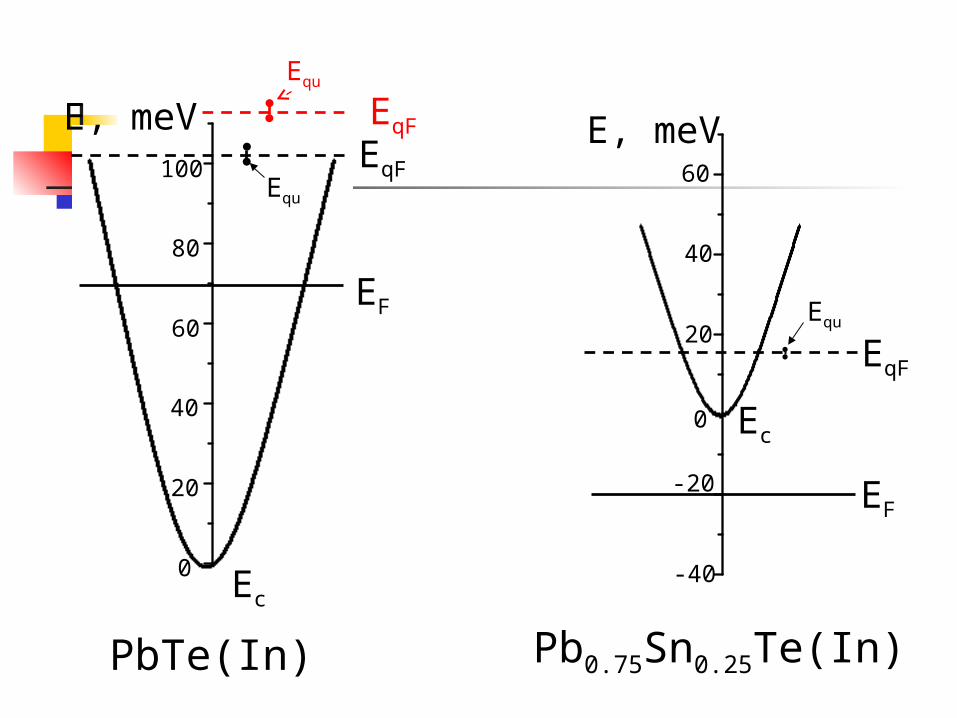
New type of local states in semiconductors
A new type of semiconductor local states which are linked not to a definite position in the energy spectrum, but to the quasiFermi level position which may be tuned by photoexcitation.
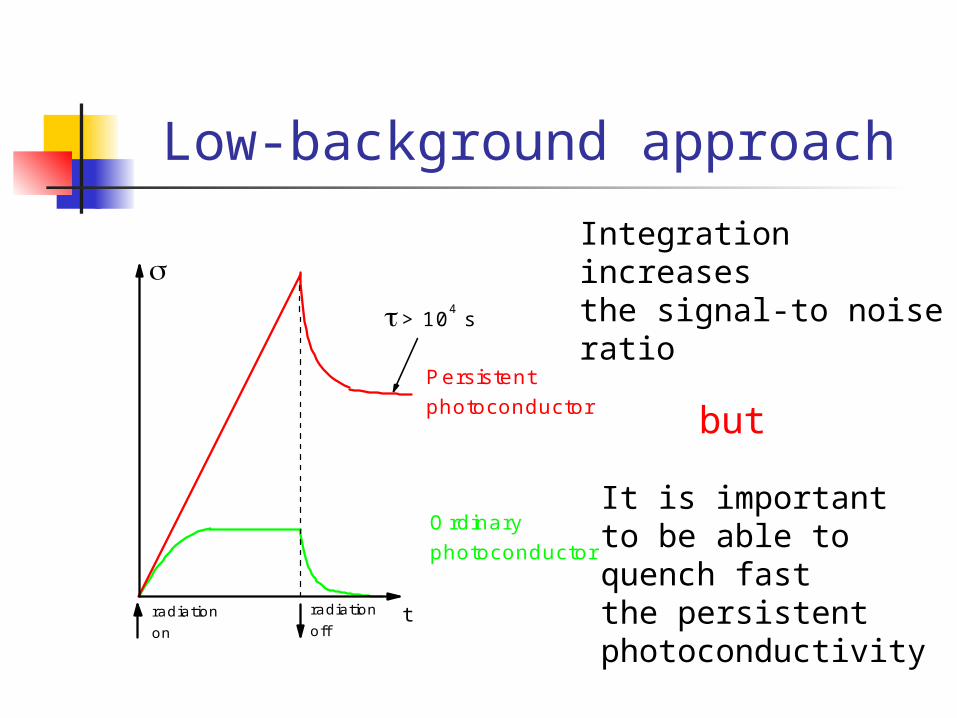
Low-background approach
> 104 s
Ordinaryphotoconductor
Persistent photoconductor
tradiationoff
radiation on
Integrationincreases the signal-to noiseratio
but
It is important to be able toquench fast the persistentphotoconductivity

Quenching of the Persistent Photoconductivity
1. Thermal quenching: heating to 25 K and cooling down: too slow process.
2. Microwave quenching: application of microwave pulses to the samplesf = 250 MHz, P = 0.9 W, t = 10 s
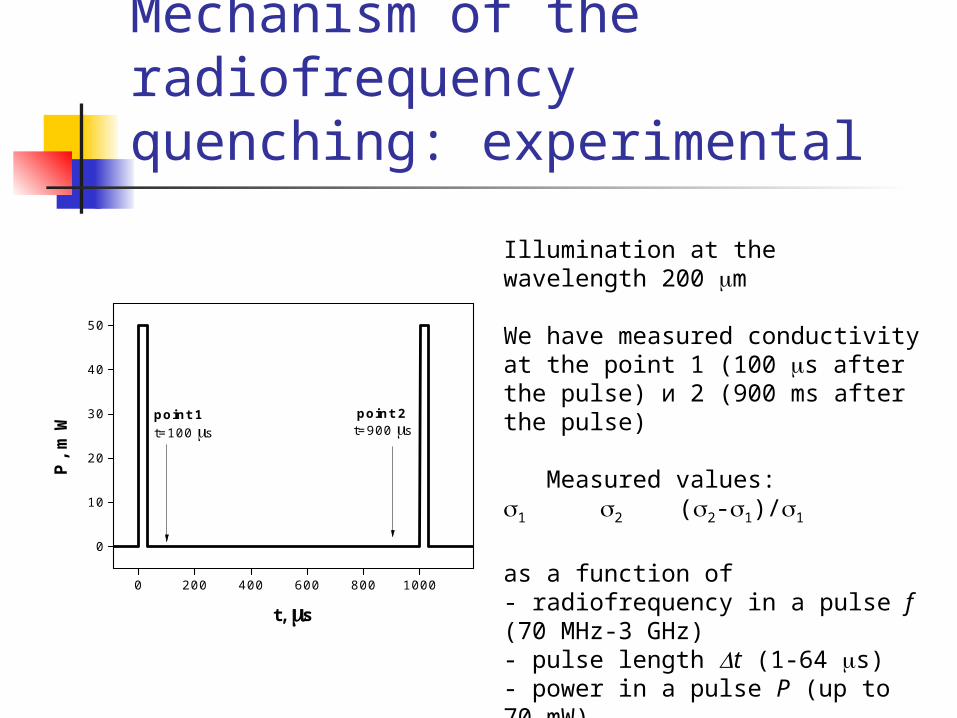
Mechanism of the radiofrequency quenching: experimental
0 200 400 600 800 1000
0
10
20
30
40
50
P, m
W
t, s
t=100 s t=900 spoint 1 point 2
Illumination at the wavelength 200 m
We have measured conductivity at the point 1 (100 s after the pulse) и 2 (900 ms after the pulse)
Measured values:1 2 (2-1)/1
as a function of - radiofrequency in a pulse f (70 MHz-3 GHz)- pulse length t (1-64 s)- power in a pulse P (up to 70 mW)
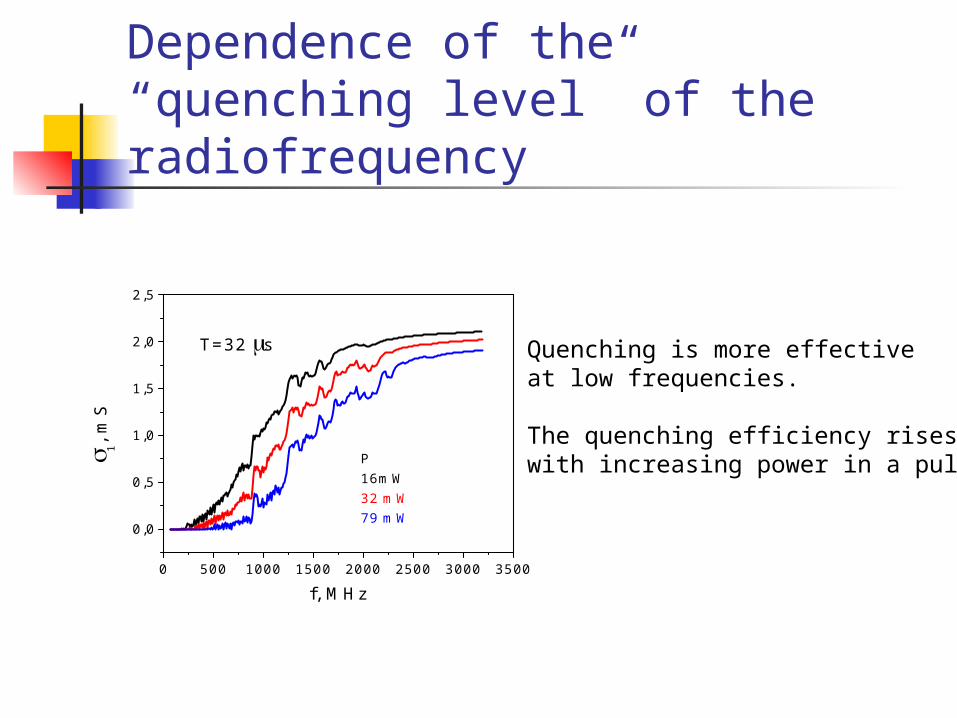
Dependence of the “quenching level” of the radiofrequency
0 500 1000 1500 2000 2500 3000 3500
0,0
0,5
1,0
1,5
2,0
2,5
P16mW32 mW79 mW
1, mS
f, MHz
T=32 s Quenching is more effective at low frequencies.
The quenching efficiency rises with increasing power in a pulse
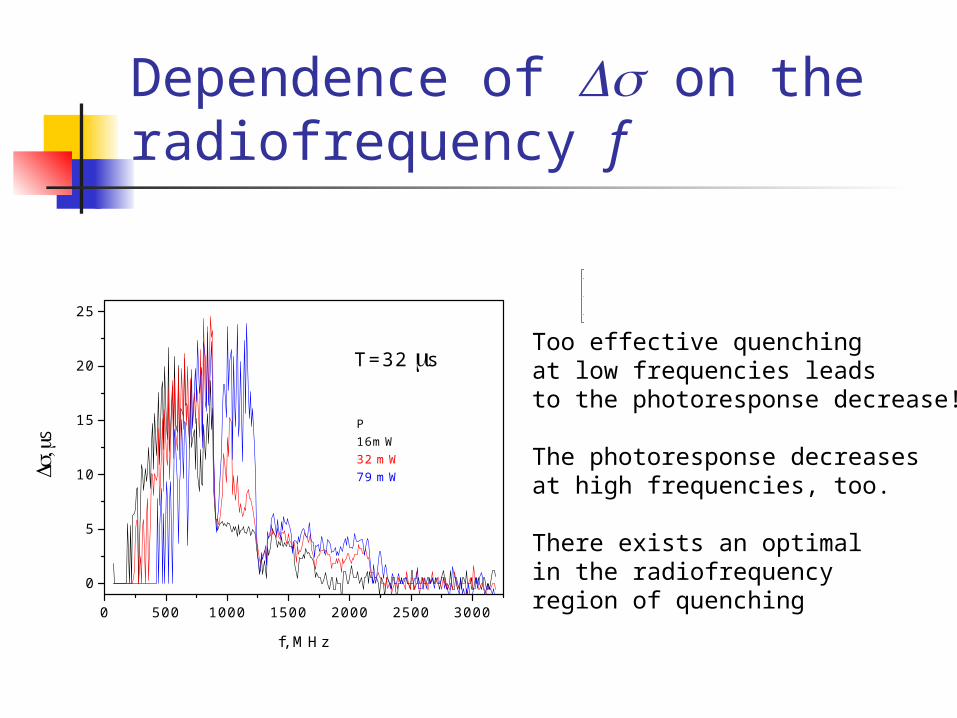
Dependence of on the radiofrequency f
0 500 1000 1500 2000 2500 3000
0
5
10
15
20
25
T=32 s
S
f, MHz
12 15 19
P16mW32 mW79 mW
Too effective quenching at low frequencies leads to the photoresponse decrease!
The photoresponse decreases at high frequencies, too.
There exists an optimal in the radiofrequency region of quenching
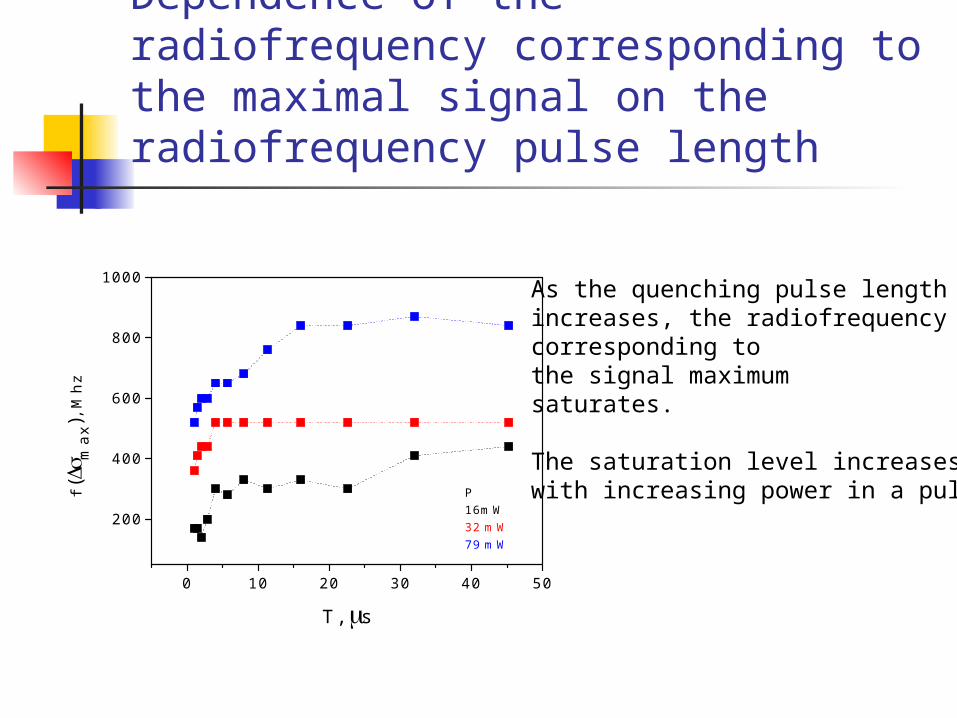
Dependence of the radiofrequency corresponding to the maximal signal on the radiofrequency pulse length
0 10 20 30 40 50
200
400
600
800
1000
P16mW32 mW79 mW
f (
max
), M
hz
T, s
As the quenching pulse length increases, the radiofrequencycorresponding to the signal maximumsaturates.
The saturation level increaseswith increasing power in a pulse.
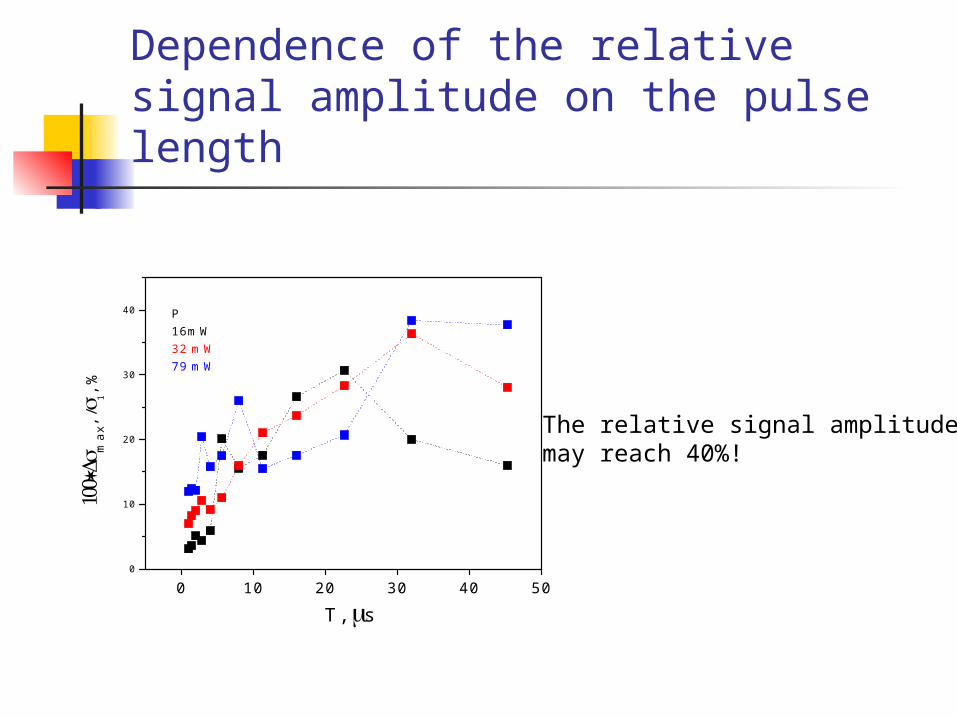
Dependence of the relative signal amplitude on the pulse length
0 10 20 30 40 500
10
20
30
40
T, s
P16mW32 mW79 mW
m
ax,
/1,
%
The relative signal amplitude may reach 40%!
Conclusions of the quenching features The thermal mechanism of quenching is
excluded The mechanism related to the electron
gas heating is likely As the radiofrequency decreases, the
power in a pulse or the pulse length increase, the quenching efficiancy rises
At the same time it is easy to destroy the “photosensitive state” of a sample if the quenching pulse is “too effective”
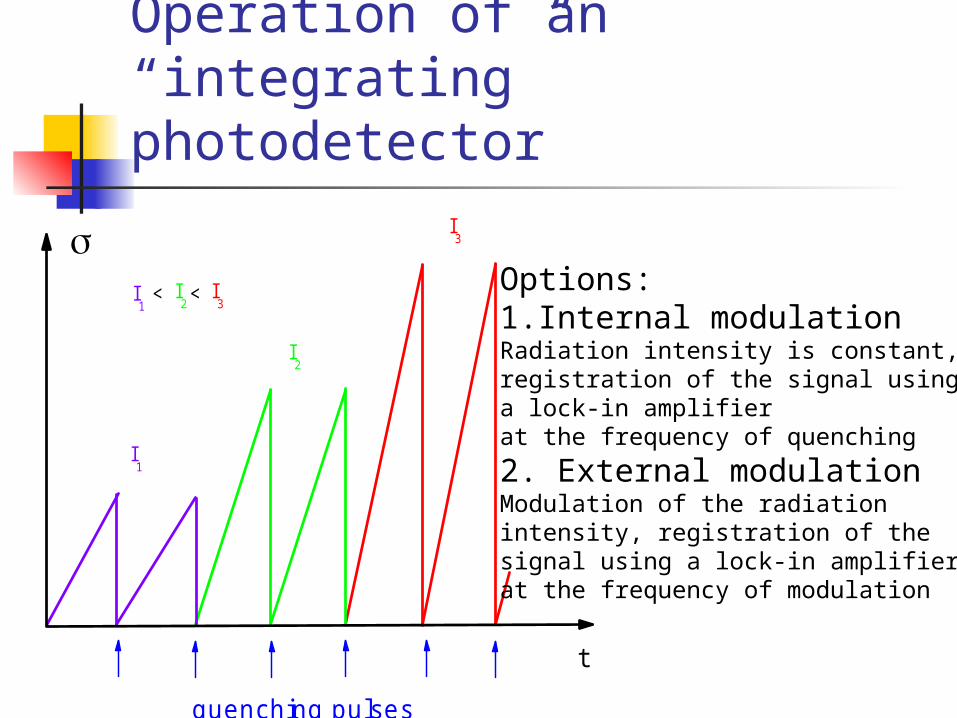
<< I
3I2I
1
I3
I2
I1
t
quenching pulses
Operation of an “integrating” photodetector
Options:1. Internal modulationRadiation intensity is constant,registration of the signal usinga lock-in amplifier at the frequency of quenching
2. External modulationModulation of the radiation intensity, registration of the signal using a lock-in amplifier at the frequency of modulation
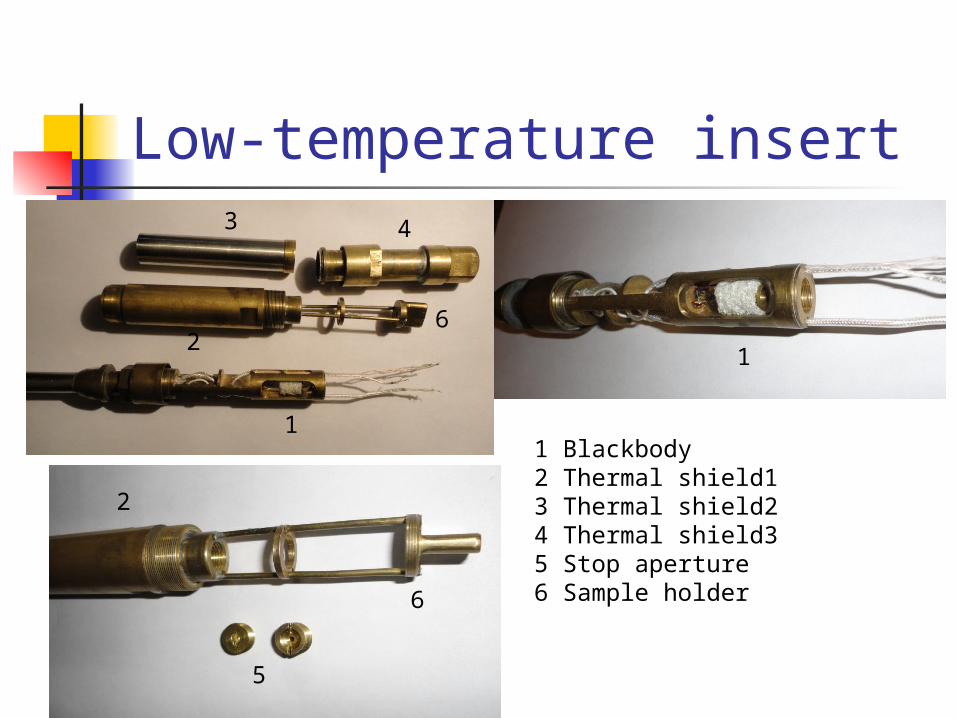
Low-temperature insert
1 Blackbody2 Thermal shield13 Thermal shield24 Thermal shield35 Stop aperture6 Sample holder6
6
5
2
2
3 4
1
1
Internal modulationSingle photodetector operating in the regime of the periodical accumulation and successive fast quenching of the photosignal.
operating temperature 4.2 K; wavelenghth below 1100 m (defined by the
stop aperture diameter); area 300*200 m; quenching rate 1000 Hz; lock-in amplifier integration time 1 s
(bandwidth 1Hz); NEP = 8*10-17 W/Hz1/2
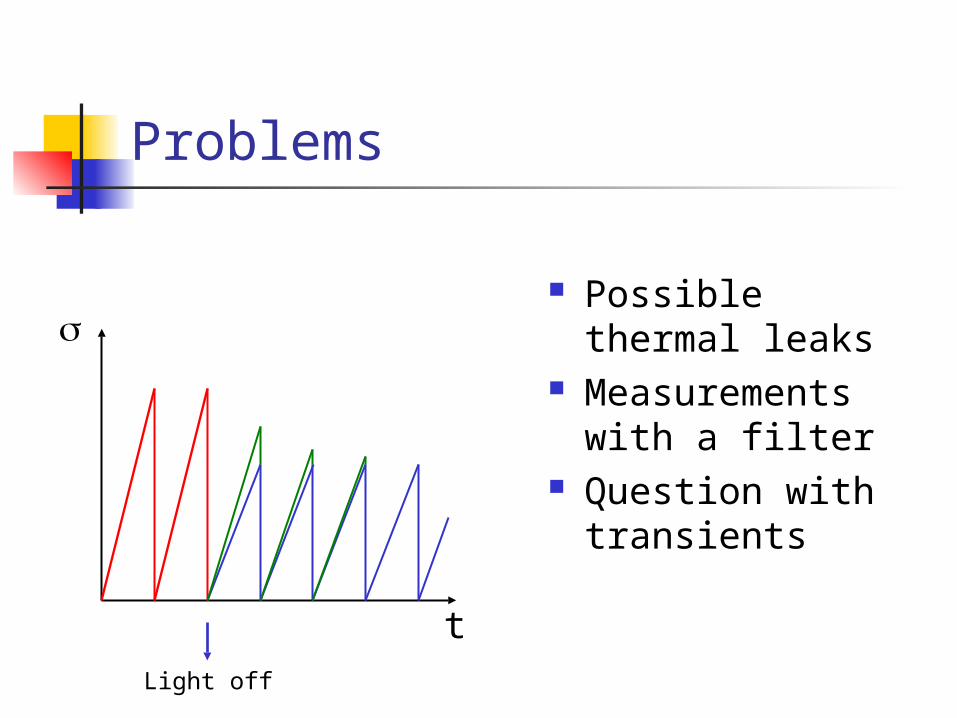
Problems
Possible thermal leaks
Measurements with a filter
Question with transients
tLight off
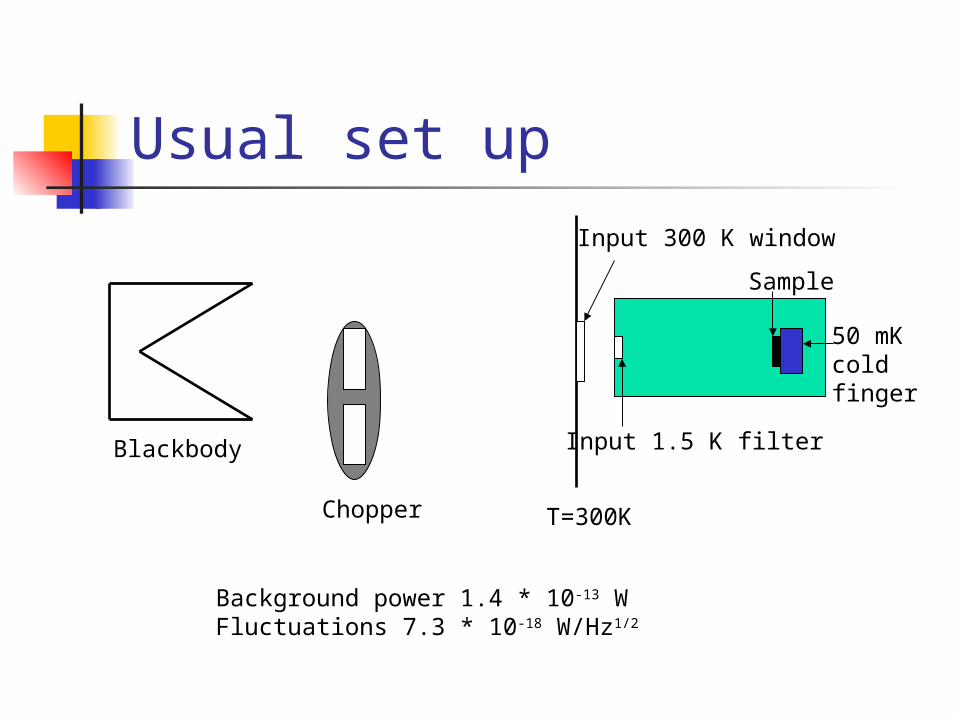
Usual set up
Blackbody
Chopper T=300K
Input 300 K window
Input 1.5 K filter
Sample
50 mKcold finger
Background power 1.4 * 10-13 WFluctuations 7.3 * 10-18 W/Hz1/2
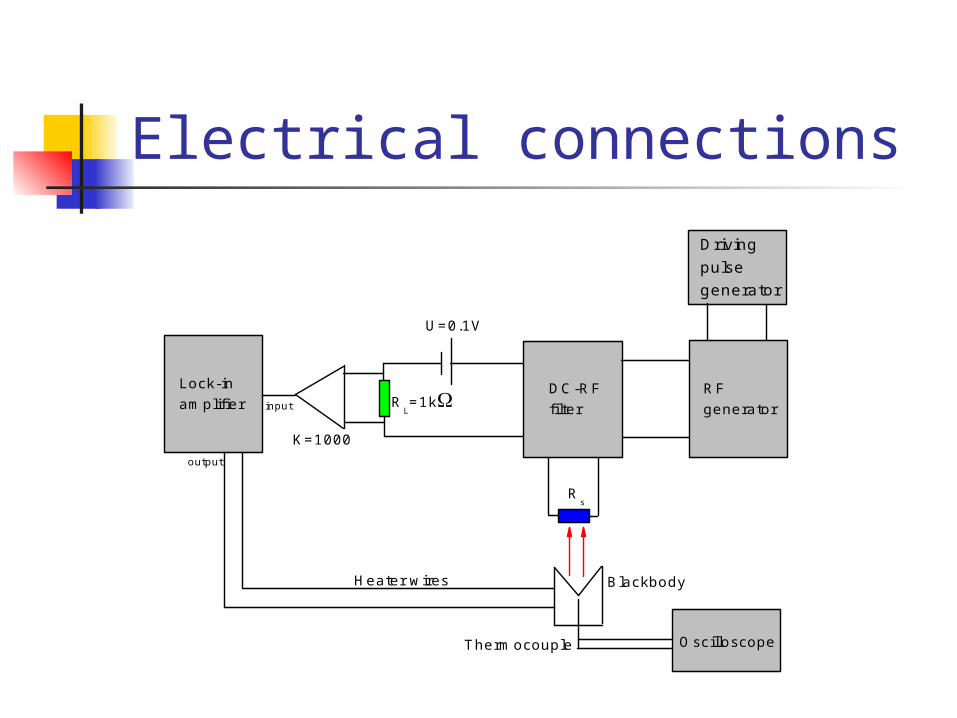
Electrical connections
Lock-inamplifier
DC-RFfilter
Oscilloscope
RFgenerator
Drivingpulsegenerator
Thermocouple
BlackbodyHeater wires
input
output
K=1000
RL=1k
U=0.1V
Rs
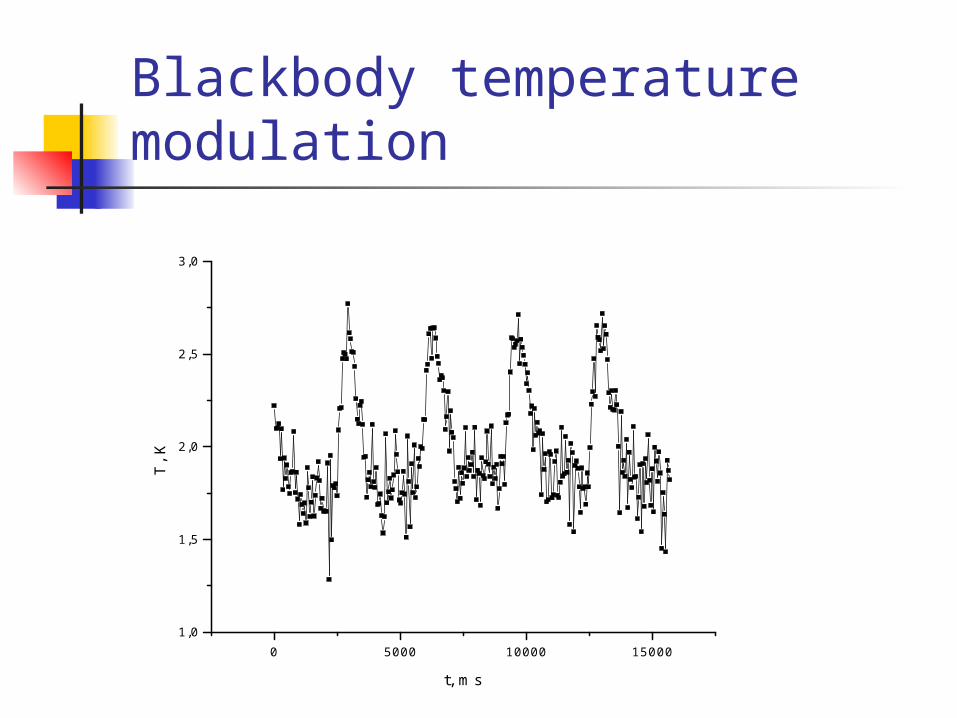
Blackbody temperature modulation
0 5000 10000 150001,0
1,5
2,0
2,5
3,0
T, K
t, ms
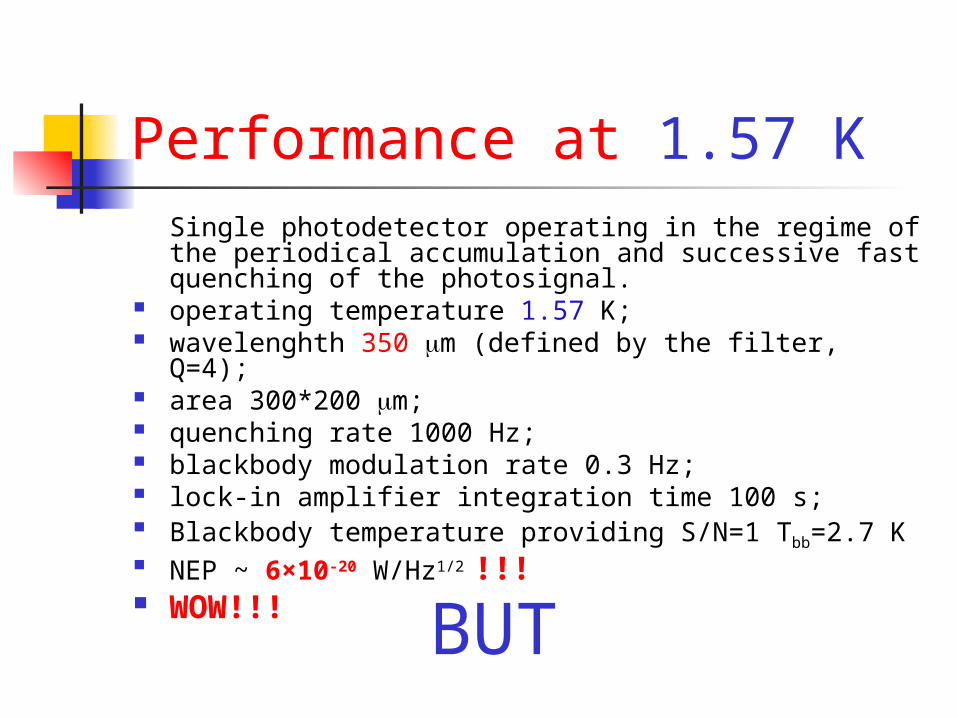
Performance at 1.57 KSingle photodetector operating in the regime of the periodical accumulation and successive fast quenching of the photosignal.
operating temperature 1.57 K; wavelenghth 350 m (defined by the filter, Q=4); area 300*200 m; quenching rate 1000 Hz; blackbody modulation rate 0.3 Hz; lock-in amplifier integration time 100 s; Blackbody temperature providing S/N=1 Tbb=2.7 K NEP ~ 6×10-20 W/Hz1/2 !!! WOW!!!
BUT
Problems
No control on the signal form Possible thermal leaks Possible radiation leaks Possible influence of the off-band
transmission of the filter Possible cross-talks of the blackbody
heater and the measurement circuit
Therefore
No firm conclusion yet
Summary We have observed a new type of
semiconductor local states which are linked not to a definite position in the energy spectrum, but to the quasiFermi level position
We have demonstrated NEP = 6×10-20 W/Hz1/2 for a single photodetector operating in the regime of the periodical accumulation and successive fast quenching of the photosignal, with the operating temperature 1.57 K at the wavelength of 350 μmHOWEVERfurther tests are needed to confirm this
Directions of the future activities Measurements of the photon noise Single photon counting? Why not Development of the portable readout
electronics Development of linear arrays and full-scale
arrays Development of tunable terahertz filters Development of a system for passive terahertz
vision in medical applications Investigation for possibilities of application in
space missions
2-nd International Conference "Terahertz and Microwave radiation: Generation, Detection and Applications“
Moscow, June 20-22 Tera2012.phys.msu.ru