Embed Size (px)
Citation preview
December 16, 2018 Journal of Hydraulic Research GeyserMechanism
To appear in the Journal of Hydraulic ResearchVol. 00, No. 00, Month 20XX, 1–24
Research paper
Mechanisms that lead to violent geysers in vertical shafts
ARTURO S. LEON (IAHR Member), Associate Professor, Department of Civil and Environmental
Engineering, University of Houston, Houston, Texas, United States
Email: [email protected] (author for correspondence)
v1.0 released June 2016

December 16, 2018 Journal of Hydraulic Research GeyserMechanism
Mechanisms that lead to violent geysers in vertical shaftsABSTRACTSupported with laboratory observations, this paper describes the mechanisms that lead to violent eruptions instormwater and combined sewer systems. This paper also derives the upper limit for the geyser eruption velocity inthese systems. The mathematical analysis shows that the maximum velocity of a gas-liquid mixture eruption in avertical shaft is that of its mixture sound speed. The analysis also shows that the pressure gradient ∂p/∂z needs toincrease substantially for the eruption velocity to approach the air-water mixture sound speed. The derived upperlimit for the geyser eruption velocity is assessed using two test cases: A geyser event in a stormwater collection systemin Minneapolis and our laboratory experiments.
Keywords: Combined sewer overflows; combined sewer system; geyser; stormwater; transient; violent eruption
1 Introduction
In general, stormwater (SW) and combined sewer systems (CSSs) consist of near-horizontal tunnelsand vertical shafts, the latter of which serve as ventilation columns, access points for maintenanceand/or as flow entry points to these systems. A geyser in these systems is a high frequency os-cillatory release of a mixture of gas and liquid that occurs at vertical shafts. The oscillating jetof gas-liquid mixture may reach a height of the order of a few to tens of meters above groundlevel. Most geyser videos available in the web show multiple independent geyser events (e.g.,http://www.youtube.com/watch?v=4aQySL0sKys), each of which consisted of several eruptions.Each independent geyser is very likely associated to a different isolated air pocket. Wright, Lewis,and Vasconcelos (2011) in their study of geyser events in a stormwater collection system in Min-neapolis, identified nine independent geysers, each of which consisted of several eruptions, andeach geyser lasted for about 10-25 s with about 75-90 s separating the onset of each geyser. Violentgeysers are highly destructive. Many combined sewer systems are operated at a fraction of theirmaximum capacity to avoid transients and geysers (e.g., Leon, Ghidaoui, Schmidt, and Garcıa2006; Leon, 2006). Operating CSSs at a fraction of their full capacity means that these systemsare not fully utilized and hence, combined sewer overflows (CSOs) occur more often than theyshould (e.g., Leon, Ghidaoui, Schmidt, & Garcıa, 2009; Leon, Ghidaoui, Schmidt, & Garcıa, 2010).These overflows contain not only stormwater but also untreated human and industrial waste, toxicmaterials, and debris. They are a major water pollution concern for approximately 772 cities inthe U.S. that have combined sewer systems (EPA, 2004).
Geysers have been studied over three decades in terms of water phase only or air-water interaction(e.g., Guo & Song, 1991; Vasconcelos, 2005; Lewis, 2011; Wright et al., 2011). A considerablenumber of hypothesis were formulated for the causes of geysers in stormwater and combined sewersystems. Guo and Song (1991) hypothesized that geysers are mainly caused by “the impact forceof the rising water”. These authors argued that if a dropshaft is well ventilated, the manholecannot be blown off by air pressure alone. Later, Vasconcelos (2005) argued that the dropshafthydrodynamics can be influenced by the presence of air pockets. More recently, Wright et al.(2011) discussed that the pressure from the sewer flow alone would not have been enough to raisethe water level in the vertical shaft event to near the ground surface. Along the same reasoningof Wright et al. (2011); Lewis (2011) argued that with an “inertia-induced surge” alone, geyserscannot be explained entirely.
Even though geysers were studied for a relatively long time, their violent behaviour was neitherreproduced experimentally nor numerically. In particular, it is not clear how to predict a largegeyser height as observed in actual stormwater and combined sewer systems. For instance, for ageyser eruption to rise a height of 20 meters, the velocity of the gas-liquid mixture at the manholeexit would need to be about 20.4 m/s (
√2gH, where H is the eruption height). It is cautioned that
the ballistic equation (w =√
2gH) is intended for a single-phase flow and not a spray-like (e.g.,air-water mixture) flow as is the case for geysers, however it can still provide a rough estimate(e.g., Karlstrom et al., 2013). Also, it is not clear the reasons for consecutive eruptions, where the
2

December 16, 2018 Journal of Hydraulic Research GeyserMechanism
first eruption is not the strongest in terms of height and velocity. For instance note in the YouTubevideo (http://www.youtube.com/watch?v=4aQySL0sKys) that for the first geyser (0:08-0:36) andthe second geyser (1:26-1:42) the strongest eruption is definitely not the first one but the laterones. Hence, it can be inferred that the processes that lead to the occurrence of violent geysersare not yet well understood. The motivation of this article is to describe the mechanisms thatlead to violent geysers in stormwater and combined sewer systems and to derive the upper limitfor the geyser eruption velocity in these systems. This paper is divided as follows. First, based onlaboratory observations, the mechanisms that lead to violent geysers in stormwater and combinedsewer systems are described. Second, based on a mathematical analysis, the upper limit for thegeyser eruption velocity is derived. Third, the derived upper limit for the geyser eruption velocityis assessed using two test cases: A geyser event in a stormwater collection system in Minneapolisand our laboratory experiments. Finally, the key results are summarized in the conclusion.
2 Mechanisms that lead to geysering in stormwater and combined sewer systems
The mechanisms described below are supported with laboratory observations of the author, whoseresearch group has produced violent eruptions in a laboratory setting for the first time. The ex-periments took place at Oregon State University in Corvallis during June and July of 2016. For anin-depth description of the experimental setup and results, the reader is referred to Leon, Elayeb,and Tang (2018). Two types of experiments were performed, namely non-visualization and vi-sualization. The non-visualization experiments focused on finding geyser heights for an array ofconditions, which results can be found in Leon et al. (2018). The visualization experiments wereintended to video filming the processes leading to violent geysers, the results of which are usedin this paper. To facilitate the measurement of the geyser height, the present experiments werefocused on a vertical pipe completely full of water, which may not represent field conditions. Therole of smaller initial water depths on geyser intensity will be investigated in a subsequent study.
The apparatus for our experimental study consisted of a horizontal and vertical pipe, both ofwhich were clear PVC with an internal diameter of 152.4 mm (6′′). The upstream tank, which waslocated 6.3 m upstream of the vertical pipe, has a total volume of 1.7 m3 (450 U.S. gallons). Theupstream tank is connected to the horizontal pipe through a 152.4 mm gate valve, which controlsthe flow from the head tank. Another valve with 76.2 mm (3′′) diameter was installed at thedownstream end of the horizontal pipe to drain the water from the system. This downstream valvewas closed during the experiments, which means that the initial velocity in the system was zero.Nine pressure transducers were used in the visualization experiments. The location of pressuretransducers 2 to 8 are presented in Fig. 1. Pressure transducer 1 was located at the top of theupstream tank (see complete experimental setup in Leon et al., 2018).
The visualization experiments, which results are used in this paper, were limited to a verticalpipe length of 6m, an initial water volume in the tank of 0.9615 m3 and an initial absolute airpressure head in the tank of 30.9 m. This pressure head is only used to drain the water out of thetank in such a way that when the upstream valve is fully opened the water level in the tank isat its bottom (i.e., air has occupied the entire tank) and at this point the system is in apparentequilibrium and the pressure head in the tank and anywhere in the horizontal pipe is 6 m (e.g.,see pressure heads before 113.5 seconds in Fig. 2). If after opening the valve, the water level in thetank was significantly above its bottom (e.g., more than about 10 mm), geysering did not occur asthe air in the tank was never admitted into the horizontal pipe. The latter means that before airentered the horizontal pipe to produce geysering, the pressure gradient in the horizontal pipe waszero. The experimental procedure was as follows:
(1) Keeping the upstream gate valve fully closed, the upstream tank is partially filled with water(2) The upstream tank is pressurized with air to a pre-specified pressure and the data acquisition
3

December 16, 2018 Journal of Hydraulic Research GeyserMechanism
system (DAQ) started to acquire data.(3) The upstream gate is fully opened. Once the gate is fully opened, the water level in the
tank is at its bottom and the system is in apparent equilibrium. Shortly after this apparentequilibrium, the air-water interface at the bottom of the air tank oscillates up and downslightly which quickly grows and then leads to the air admission from the air tank to thehorizontal pipe. The geyser eruptions would occur shortly after the air admission to thehorizontal pipe. The propagation of the air pocket and the geyser processes are describedlater in this section.
(4) After the eruptions, the system is depressurized and the data recording is stopped. It is worthmentioning that in all geyser experiments, all air in the tank evacuated the system and thefinal water depth at rest in the horizontal pipe was between 10% to 50% of the pipe diameter.
Each geyser produced in the experiments consisted of several violent eruptions (three to eight)which lasted a few seconds with heights exceeding 30 meters measured from the top of the verticalpipe. It is worth mentioning that as shown in Leon et al. (2018), the scale effects for the geyser labexperiments are negligible. The violent eruptions produced resemble the characteristics of thosethat occurred in actual stormwater and combined sewer systems. The laboratory observations aresummarized in data of pressure transducers (Figs. 2-4), schematics (Figs. 5a-5f), video snapshotsfor vertical pipe (Fig. 6), and video snapshots for horizontal pipe (Fig. 7). The main mechanismsthat lead to geysering can be summarized as follows:
(1) A large air pocket, which is formed during the filling of near-horizontal tunnels (e.g., Vas-concelos, 2005), approaches the dropshaft. This can be observed in Figs. 5a and 7.1.
(2) The large air pocket enters the dropshaft and rises due to buoyancy. The front of the airpocket, which resembles the classical Taylor bubble, occupies almost the entire cross-sectionalarea of the dropshaft. The tail of the air pocket ascending in the dropshaft is highly turbulentwith a near homogenous mixture of air and water with great content of void fraction. In asimilar way to the classical Taylor bubble, as the air pocket ascends, a significant amount ofliquid that is on top of the air pocket is carried upwards and a portion of the water falls onthe sides of the pocket (e.g., film flow). This can be observed in Figs. 5b and 6.1.
(3) When the Taylor-like bubble reaches the top of the dropshaft, most of the water that is ontop of the air pocket is spilled (Fig. 5c).
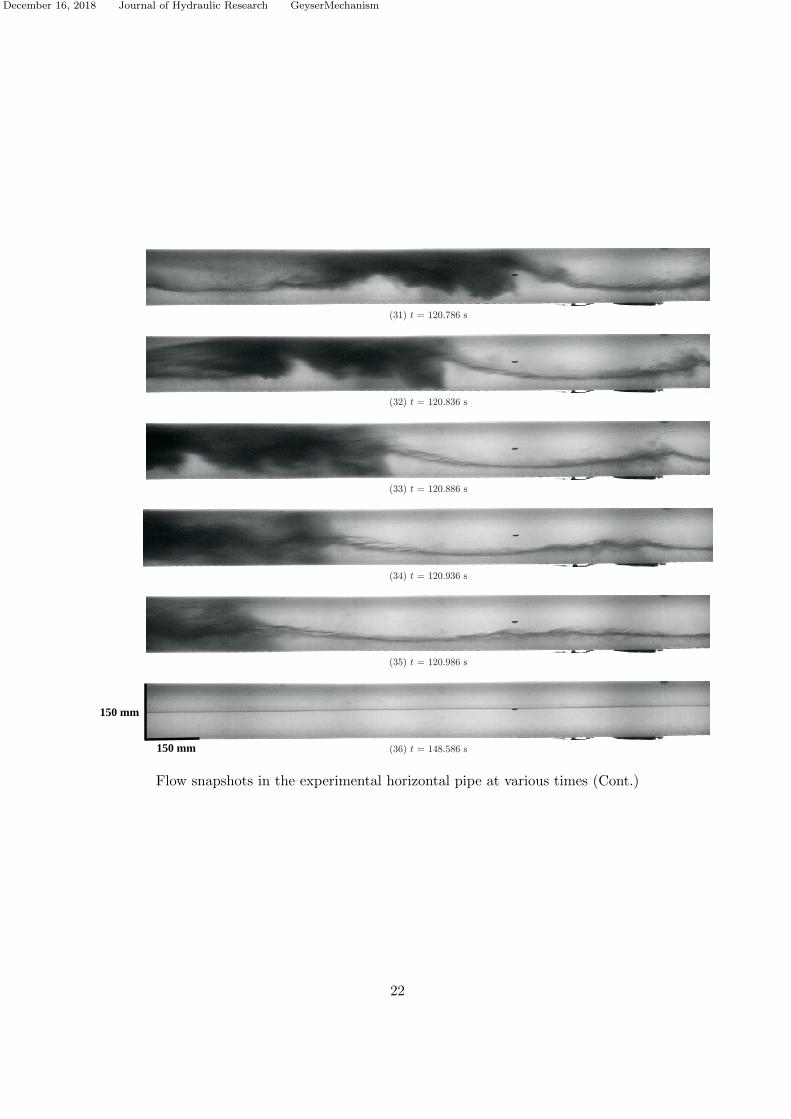
(4) As water is quickly lost due to spilling, the hydrostatic pressure in the dropshaft is rapidlyreduced, which accelerates the air entering the dropshaft. The rapid acceleration of air leads toa weak eruption from the dropshaft (Fig. 5d). Subsequently, the rapid increase in air velocityin the horizontal pipe results in the Kelvin-Helmholtz (KH) instability that transforms theinitial stratified flow regime (Fig. 7.2) to wavy and, eventually, slug flow, which is a seriesof liquid plugs (slugs) separated by relatively large air pockets. The liquid slugs have someentrained air. The aforementioned wavy air interfaces and slugs can be observed in snapshots3 to 35 in Fig. 7. During this process, the flow in the dropshaft is highly mixed and turbulent(see Fig. 6.2).
To verify the hypothesis that the transition from the initial stratified flow regime to slugflow is due to Kelvin-Helmholtz (KH) instability of the waves, we can use the followingempirical fitted KH instability criteria (e.g., Kordyban, 1990):
UG − UL > 0.5√
(ρL − ρG)ghG/ρG (1)
where UG is the gas (i.e., air) velocity, UL is the liquid (i.e., water) velocity, ρL is the densityof liquid, ρG is the density of gas, g is acceleration of gravity and hg is the depth of gas atequilibrium level. For air and water at 20 ◦C, ρL = 1000 kg/m3, ρG = 1.2 kg/m3. From thefirst two snapshots in the horizontal pipe (Figs. 7.1 and 7.2), hG is approximately 13 mm.
4

December 16, 2018 Journal of Hydraulic Research GeyserMechanism
Also, UL = 0 because the downstream gate in the horizontal pipe is closed. Substituting valuesinto Eq. (1), the KH instability criteria gives UG > 5.1 m/s. Even though, the air velocity wasnot explicitly measured in the experiments, by comparing flow features in different frames(snapshots) in Fig. 7, the velocity of the air could be estimated. These velocities can easilyexceed 5 m/s implying that the transition from the initial stratified flow regime to slugflow may be due to Kelvin-Helmholtz (KH) instability. It is worth mentioning that the KHinstability provide a mechanism for initiating jumps and transitions, however after one or fewslugs are weakly formed, the dynamics of the slugs (e.g., violent propelling) including theirgrowth are governed by the pressure gradients between the slugs and the dropshaft.
(5) Once the slugs are formed in the horizontal pipe, they are violently propelled into the drop-shaft right after a sudden drop of pressure in the dropshaft (e.g., after the previous eruption).During this process, new slugs can be formed in the horizontal pipe. The slugs in the horizon-tal pipe are propelled in bursts, each of which may result in a new eruption. The propelling ofliquid slugs is activated whenever a significant pressure gradient between the horizontal pipeand the dropshaft is attained. Note in Figs. 2-4 that geyser eruptions (e.g., large pressurefluctuations at transducer 9), are preceded by large pressure gradients between the horizontalpipe (e.g., transducers 4 and 6) and the dropshaft (e.g., transducer 8). Note also in Figs. 2-4that the pressures located downstream of the vertical pipe (transducers 6 and 7) have signifi-cant fluctuations around the mean pressure. According to the so-called Joukowsky equation,a pressure surge occurs when a fluid in motion is forced to stop or change velocity suddenly.In the geyser experiments, the flow velocity at the downstream end of the pipe is zero (e.g.,dead end). However, the flow velocity in the horizontal pipe, upstream of the vertical pipe,may be very high as a result of the eruptions in the vertical pipe. Thus, there is a significantchange of velocity in the downstream horizontal pipe (from large velocity at the vertical pipeto zero at the downstream end), which would lead a significant pressure surge. Note in Figs.2-4 that the pressure trace at transducer 8 follows a similar pressure oscillation pattern tothat of transducer 6, although with a slight delay. This means that pressure transients inthe horizontal pipe are propagated to the dropshaft, and hence, pressure transients can alsohave an impact on geyser eruptions as they may lead to larger pressure gradients. Note alsoin Fig. 4 that the pressure head at transducer 2 decays slowly and it is not significantlyaffected by the pressure head oscillations at transducer 8. This is because of the discontinuityproduced by the slugs, which block the uniform release of air from the horizontal pipe. Theslow decay of pressure head in the horizontal pipe, due to the slugs, provides the pressure tostill achieve significant pressure gradients (between the horizontal pipe and dropshaft) afterthe first geyser eruption. It is worth mentioning that the liquid slugs supply the water forthe eruptions. Overall, the second or third geyser eruption has the largest intensity in termsof height (Fig. 5e).
(6) After the second or third eruption, there may be a few more eruptions, however as water is lostat the top of the dropshaft and the horizontal pipe around the dropshaft is depressurized,the geysering is terminated. On average we observed between 3 to 8 eruptions in a timeframe of 2 to 10 seconds. After the eruptions are terminated, the water depth at rest in thehorizontal pipe is between 10% to 50% of the pipe diameter (see Figs. 5f and 7.36). Theviolent propelling of slugs was reported in various studies of two-phase flows (e.g., Wallis &Dodson, 1973; Grotjahn & Mewes, 2007).
3 Upper limit for the geyser eruption velocity in vertical shafts
The aim of this section is to derive the upper limit for the geyser eruption velocity in verticalshafts. The assumptions of this derivation are listed below:
5

December 16, 2018 Journal of Hydraulic Research GeyserMechanism
• The air-liquid mixture is assumed to be homogeneus (well mixed) during the geysering.• The liquid is assumed to have a constant density (e.g., independent of pressure).• The air gas is ideal and it is assumed to follow the isothermal process.
The compressible Navier-Stokes equations for the vertical direction (z) assuming a one-dimensionalflow can be written as (Shapiro, 1954; Leon, 2016):
∂ρ
∂t+∂(ρw)
∂z= 0 (2)
∂w
∂t+
1
ρ
∂p
∂z+ w
∂w
∂z= −g − f
2Dw2 (3)
where t is time, p is pressure, ρ is the density of the gas-liquid mixture, g is the gravitationalacceleration, z is vertical distance measured from the dropshaft bottom, w is the velocity and fis the Darcy-Weisbach friction factor. Noting that the sound speed in the flow (a) is given by√dp/dρ, Eq. (2) can be rewritten as:
a2∂w
∂z+
1
ρ
(∂p
∂t+ w
∂p
∂z
)= 0 (4)
Combining Eqs. (3) and (4), the following equation is obtained:
1
ρ
∂p
∂z
(w2
a2− 1
)= g +
f
2Dw2 +
∂w
∂t− w
ρa2∂p
∂t(5)
Note in the right side of Eq. (5) that the first (gravity) and second (friction) terms are positive.Note also that for an accelerating flow in the vertical direction, ∂w/∂t is positive. With the solepurpose of finding the sign of ∂p/∂t in Eq. (5) let’s make use of a Bernoulli-like equation, whichapplies to an unsteady frictionless and compressible flow in a stream tube and is given by (Fox,McDonald, Pritchard, & Mitchell, 2015; MIT, 2017)
wdw +∂w
∂tdz = −1
ρdp− gdz (6)
Even though the Momentum equation (Eq. 3) includes a friction term, the use of the Bernoulli-likeequation(Eq. 6), which strictly applies to frictionless flow, is justified because these two equations(Eqs. 3 and 6) are not combined into a single equation. Instead, the Bernoulli-like equation(Eq.6) is used for establishing qualitatively how the pressure changes with a change in velocity. Byexpanding the differentials dw and dp in Eq. (6) as partial derivatives with respect to the variablest and z and by setting dz → 0, Eq. (6) can be simplified as follows:
w∂w
∂tdt = −1
ρ
∂p
∂tdt (7)
Note in Eq. (7) that for an accelerating flow in the vertical direction, ∂w/∂t is positive and thus,∂p/∂t needs to be negative. Hence, all terms in the right side of Eq. (5) are positive. In addition,note that ∂p/∂z in the left side of Eq. (5) is negative. Thus, for Eq. (5) to be valid, the following
6
December 16, 2018 Journal of Hydraulic Research GeyserMechanism
condition needs to be satisfied:
w < a (8)
Note in Eq. (5) that even though the upper limit of the geyser eruption velocity is the gas-liquidmixture sound speed, w can never reach the value of a as to maintain the positive terms on the righthand side of Eq. (5). Note also in Eq. (5) that as w increases, the magnitude of the term w2/a2−1decreases and thus, the magnitude of ∂p/∂z needs to increase to maintain the positive terms onthe right hand side of Eq. (5). The latter is expected as a larger pressure gradient would result in alarger geyser eruption velocity. Even though the geyser eruption velocity can never match the air-liquid mixture sound speed, the geyser eruption velocity can get close to the aforementioned soundspeed as discussed in Section 4. This is an important finding as the air-liquid mixture sound speedcan be easily calculated, which could be used to calculate impact force and other parameters thatwould be useful in the design of manholes for mitigating the adverse effects of geysers. The findingthat the geyser eruption velocity can get close to the air-liquid mixture sound speed is actuallynot a surprising result as explained below. As mentioned earlier, the measured geyser heights inthe experiments exceeded 30 m, which would result in a geyser eruption velocity of about 24.2m/s using the ballistic equation. Even though the ballistic equation is not strictly applicable toair-liquid mixtures, it can give a rough estimate of the eruption velocity (Karlstrom et al., 2013).In the other hand, the sound speed in an air-water mixture can achieve very low values (as low as20 m/s) for small pressures (e.g., 1 bar) and void fractions between 15% and 85% (see for instanceKieffer, 1977, pages 2898 and 2899). An equation for estimating the sound speed of a two-phasemixture is given by (Mastin, 1995):
a =
√klkg
ρ[(1− φ)kg + φkl](9)
where φ is the volume fraction of gas (i.e., ratio of gas volume to total volume), kl and kg arethe bulk modulus of liquid and gas, respectively. The author is not aware of any measurementof gas/water volume ratios during geysering in stormwater or combined sewer systems. However,the literature reports these measurements during geysering in the degassing of lakes Nyos andMonoun. Even though the processes of geysering in a stormwater system and those in degassing oflakes are clearly different, regardless of the processes, a geyser eruption involves a significant ratio ofgas/water volume. In this paper, due to the lack of data of gas/water volume ratios during geyseringin stormwater or combined sewer systems, the data for geysering in degassing of lakes Nyos andMonoun will be used. The measured gas/water volume ratios for geysering in the degassing oflakes Nyos and Monoun ranged from 2.9 to 9 (Halbwachs, Sabroux, Grangeon, Kayser, & Tochon-Danguy, 2004). The latter indicates that at eruption the values of φ would range between 0.74 and0.90. As shown in Leon (2016), at eruption, Eq. (9) can be reduced to the equation below withgood accuracy:
a ≈√
patmφ(1− φ)ρl
(10)
where patm is the absolute atmospheric pressure and ρl is the water density.It is worth mentioning that in our laboratory experiments (Leon et al., 2018), the void fraction
was not measured and hence, the “experimental” value of a cannot be directly compared with themaximum geyser eruption velocity.
7

December 16, 2018 Journal of Hydraulic Research GeyserMechanism
4 The air-water mixture sound speed as a predictor for the maximum geysereruption velocity
In this section we will discuss if the air-water mixture sound speed (Eq. 10) can be regarded asthe upper limit for the maximum geyser eruption velocity. For this discussion, two test cases areconsidered: A geyser event in a stormwater collection system in Minneapolis and our laboratoryexperiments. For estimating the air-water mixture sound speed, data of gas/water volume ratiosduring geysering are necessary, which were not available for both test cases. The author is notaware of any measurement of gas/water volume ratios during geysering in stormwater or combinedsewer systems. However, measurements of gas/water volume ratios are available for geysering inthe degassing of lakes Nyos and Monoun. As mentioned earlier, even though the processes ofgeysering in a stormwater system and those in degassing of lakes are clearly different, regardlessof the processes, a geyser eruption involves a significant ratio of gas/water volume. In this section,due to the lack of data of gas/water volume ratios during geysering in stormwater or combinedsewer systems, the data for geysering in degassing of lakes Nyos and Monoun were used. Themeasured gas/water volume ratios in the degassing of lakes Nyos and Monoun ranged from 2.9 to9 (Halbwachs et al., 2004), which give φ values between 0.74 and 0.90. The mixture density (ρ)is often approximated as ρ ≈ (1 − φ)ρl (e.g., Leon, 2016), which gives a mixture density rangingbetween 100 and 260 kg/m3.
4.1 Geyser event (July 11, 2004) in a stormwater collection system in Minneapolis
This event occurred on July 11, 2004 at Interstate 35W (Minnesota), which data is available inWright et al. (2011). According to Wright et al. (2011), the system is a 3.7-m high arch storm-watertunnel and the dropshaft is 2.4 m in diameter and 24.9 m in height. The reported eruption heightwas about 20 m (Wright et al., 2011), which results in a geyser eruption velocity of 19.8 m/s usingthe ballistic equation (w ≈
√2gH). The barometric pressure for July of 2016 in Minnesota was
about 29.9 in Hg (Usairnet, 2016), which is 101253 Pa.Figure 8 shows the “observed” geyser eruption velocity together with the calculated sound speed
in the air-water mixture for the range of mixture densities obtained from geyser measurementsduring the degassing of Lakes Nyos and Monoun. The results in Fig. 8 show that for the aforemen-tioned range of mixture densities, the air-water mixture sound speed decreased about 32% for anincrease of the density of the air-water mixture (e.g., as air volume reduces) of about 160%. Therelatively slow reduction of the air-water mixture sound speed with an increase in the density ofthe air-water mixture implies that the air-water mixture sound speed can be well quantified evenif the volume fraction of gas (i.e., ratio of gas volume to total volume) is not accurately estimated.The results in Fig. 8 also show that, as predicted by Eq. (8), the “measured” geyser eruption ve-locity does not exceed the air-water mixture sound speed for the entire range of mixture densitiesobtained during the degassing of Lakes Nyos and Monoun.
4.2 Our laboratory work
As shown in Leon et al. (2018), the geysers produced in our lab experiments resemble the charac-teristics of those that occurred in actual stormwater and combined sewer systems. The maximumgeyser height measured from the top of the dropshaft was 32 meters, which results in a geyser erup-tion velocity of about 25 m/s using the ballistic equation. The barometric pressure for Corvallis,Oregon in June and July of 2016 was about 30.13 in Hg (Usairnet, 2016), which is 102032 Pa.
Figure 9 shows the maximum “observed” geyser eruption velocity together with the calculatedair-water mixture sound speed for the range of mixture densities obtained from geyser measure-ments during the degassing of Lakes Nyos and Monoun. In a similar way to the Minneapolis geyser
8

December 16, 2018 Journal of Hydraulic Research GeyserMechanism
case, the results in Fig. 9 show that for the aforementioned range of mixture densities, the air-watermixture sound speed decreased about 32% for an increase of the density of the air-water mixture(e.g., as air volume reduces) of about 160%. The latter was expected as the only variation betweenthe two test cases is the atmospheric pressure, which does not change significantly. The resultsin Fig. 9 also show that for most of the aforementioned range of mixture densities, the air-watermixture sound speed exceeds the “observed” geyser eruption velocity. However, for a small range ofmixture densities, the “observed” geyser eruption velocity exceeds slightly (< 2 m/s) the air-watermixture sound speed. As mentioned earlier, the void fraction was not measured in our laboratoryexperiments, and hence the “experimental” value of a cannot be directly compared with the max-imum geyser eruption velocity. Because for most of the range of mixture densities, the air-watermixture sound speed exceeds the “observed” geyser eruption velocity and for the small remainingrange the difference is only small (< 2 m/s), the air-water mixture sound speed (Eq. 10) can bedeemed as the upper limit for the maximum geyser eruption velocity.
5 Conclusion
This paper describes the mechanisms that lead to violent geysers in vertical shafts and derives theupper limit for the geyser eruption velocity. The key results are as follows:
(1) The described mechanisms that lead to violent geysers in vertical shafts were supported withlaboratory observations of the author, whose research group has produced violent geysers ina laboratory setting for the first time. Each geyser produced consists of a few consecutiveviolent eruptions within a time frame of a few seconds with heights that may exceed 30 m,measured from the top of the dropshaft. These characteristics resemble those geysers thatoccurred in actual stormwater and combined sewer systems.
(2) The air-water mixture sound speed (Eq. 10) can be deemed as the upper limit for the maxi-mum geyser eruption velocity.
(3) The air-water mixture sound speed decreases slowly with an increase in the density of theair-water mixture for the typical range of volume fraction of gas (i.e., ratio of gas volume tototal volume) observed in the geysering due to degassing of lakes Nyos and Monoun.
(4) the pressure gradient ∂p/∂z needs to increase substantially for the geyser eruption velocityto approach the air-water mixture sound speed. This is expected as a larger pressure gradientwould result in a larger geyser eruption velocity.
Overall, this paper shows that according to theory, the maximum geyser eruption velocity cannotmatch or exceed the air-water mixture sound speed. The test cases show that this is the case,however the geyser eruption velocity can get close to the aforementioned sound speed.
Acknowledgements
The authors are grateful to the JHR anonymous reviewers for their constructive comments, whichhelped to significantly improve the quality of the manuscript.
Disclosure
This manuscript has not been formally reviewed by EPA. The views expressed are solely those ofthe author. EPA does not endorse any products or commercial services mentioned.
9

December 16, 2018 Journal of Hydraulic Research GeyserMechanism
Funding
This work was supported by the U.S. Environmental Protection Agency [grant R835187].
Notation
a = sound speed (m s−1)f = Darcy-Weisbach friction factor (–)g = gravity acceleration (ms−2)hg = depth of gas at equilibrium level (m)kl = bulk modulus of liquid (Pa)kg = bulk modulus of gas (Pa)p = pressure (Pa)patm = absolute atmospheric pressure (Pa)t = time (s)UG = gas (i.e., air) velocity in horizontal pipe (m s−1)UL = liquid (i.e., water) velocity in horizontal pipe (m s−1)w = geyser eruption velocity (m s−1)z = vertical distance measured from the dropshaft bottom (m)φ = volume fraction of gas (i.e., ratio of gas volume to total volume) (–)ρ = density of gas-liquid mixture (kg m−3)ρG = gas density (kg m−3)ρL = liquid density (kg m−3)
References
EPA. (2004). Impacts and Control of CSOs and SSOs (Report to Congress No. EPA 833-R-04-001).Office of Water (4203), Washington, D.C. 20460: United States Environmental ProtectionAgency.
Fox, R. W., McDonald, A. T., Pritchard, P. J., & Mitchell, J. W. (2015). Introduction to FluidMechanics, 9th Edition SI Version. Wiley.
Grotjahn, K., & Mewes, D. (2007). Transient behaviour of two-phase slug flow in horizontalpipes. In Transient phenomena in multiphase and multicomponent systems (pp. 103–118).Wiley-VCH Verlag GmbH & Co. KGaA. Retrieved from http://dx.doi.org/10.1002/
9783527610785.ch7
Guo, Q., & Song, C. S. S. (1991). Hydrodynamics under transient conditions. J. Hydraul. Eng ,117 (8), 1042-1055.
Halbwachs, M., Sabroux, J. C., Grangeon, J., Kayser, G., & Tochon-Danguy, J. C. (2004). De-gassing the “killer lakes” Nyos and Monoun, Cameroon. Eos, 85 , 281.
Karlstrom, L., Hurwitz, S., Sohn, R., Vandemeulebrouck, J., Murphy, F., Rudolph, M. L., . . .McCleskey, R. B. (2013). Eruptions at Lone Star Geyser, Yellowstone National Park, USA,part 1: energetics and eruption dynamics. Journal of Geophysical Research B: Solid Earth,118 (8), 4048-4062.
Kieffer, S. W. (1977). Sound speed in liquid-gas mixtures: Water-air and water-steam. Journalof Geophysical Research, 82 (20), 2895–2904. Retrieved from http://dx.doi.org/10.1029/
JB082i020p02895
Kordyban, E. (1990). Horizontal slug flow: A comparison of existing theories. Journal of FluidsEngineering , 112 (1), 74-83.
10
December 16, 2018 Journal of Hydraulic Research GeyserMechanism
Leon, A. S. (2006). Improved modeling of unsteady free surface, pressurized and mixed flowsin storm-sewer systems (Unpublished doctoral dissertation). Univ. of Illinois at Urbana-Champaign, Urbana, IL.
Leon, A. S. (2016). Mathematical models for quantifying eruption velocity in degassing pipes basedon exsolution of a single gas and simultaneous exsolution of multiple gases. J. volcanologyand geothermal research, 323 (1), 72-79.
Leon, A. S., Elayeb, I., & Tang, Y. (2018). An experimental study on violent geysers in verticalpipes. Journal of Hydraulic Research (In print).
Leon, A. S., Ghidaoui, M. S., Schmidt, A. R., & Garcıa, M. H. (2006). Godunov-type solutionsfor transient flows in sewers. Journal of Hydraulic Engineering , 132 (8), 800–813.
Leon, A. S., Ghidaoui, M. S., Schmidt, A. R., & Garcıa, M. H. (2009). Application of Godunov-typeschemes to transient mixed flows. Journal of Hydraulic Research, 47 (2), 147–156.
Leon, A. S., Ghidaoui, M. S., Schmidt, A. R., & Garcıa, M. H. (2010). A robust two-equationmodel for transient mixed flows. Journal of Hydraulic Research, 48 (1), 44-56.
Lewis, J. M. (2011). A physical investigation of air/water interactions leading to geyser events inrapid filling pipelines (Unpublished doctoral dissertation). University of Michigan.
Mastin, L. G. (1995). A numerical program for steady-state flow of hawaiian magma gas mixturesthrough vertical eruption conduits. U. S. Geol. Surv. Open-File Rep., 95.
MIT. (2017). Advanced Fluid Mechanics notes of MIT Department of Mechanical Engineering.Retrieved 2017-12-16, from https://ocw.mit.edu/courses/mechanical-engineering/
2-25-advanced-fluid-mechanics-fall-2013/inviscid-flow-and-bernoulli/
MIT2 25F13 Shapi4.05 Solu.pdf
Shapiro, A. (1954). The dynamics and thermodynamics of compressible fluid flow, volume ii. NewYork: The Ronald Press Company.
Usairnet. (2016). Minnesota barometric pressure map. Retrieved 2015-7-24, from http://www
.usairnet.com/weather/maps/current/minnesota/barometric-pressure/
Vasconcelos, J. G. (2005). Dynamic approach to the description of flow regime transition instormwater systems (Unpublished doctoral dissertation). University of Michigan.
Wallis, G. B., & Dodson, J. E. (1973). The onset of slugging in horizontal stratified air-waterflow. International Journal of Multiphase Flow , 1 (1), 173 - 193. Retrieved from http://
www.sciencedirect.com/science/article/pii/0301932273900104
Wright, S., Lewis, J., & Vasconcelos, J. (2011). Geysering in rapidly filling storm-water tunnels.J. Hydraul. Eng , 137 (1), 112-115.
List of Figures
1 Location of pressure sensors for visualization experiments (Not To Scale) . . . . . 122 Example of pressure heads recorded in a geyser experiment (dropshaft height = 6 m) 123 First zoom-in of Figure ?? . . . . . . . . . . . . . . . . . . . . . . . . . . . . . . . 134 Second zoom-in of Figure ?? . . . . . . . . . . . . . . . . . . . . . . . . . . . . . . 135 Geyser Processes (a) air pocket approaching dropshaft . . . . . . . . . . . . . . . . 146 Flow snapshots in the experimental vertical pipe at various times . . . . . . . . . . 167 Flow snapshots in the experimental horizontal pipe at various times . . . . . . . . 178 Air-water mixture sound speed as a predictor for the maximum geyser eruption
velocity for the Minneapolis geyser on July 11, 2004 . . . . . . . . . . . . . . . . . 239 Air-water mixture sound speed as a predictor for the maximum geyser eruption
velocity for our laboratory geysers . . . . . . . . . . . . . . . . . . . . . . . . . . . 23
11

December 16, 2018 Journal of Hydraulic Research GeyserMechanism
P9
P8
P6 P4
3073 mm
3048 mm
762 mm
P2
P3P5P7
1168 mm
330 mm
2845 mm
P3
P2
152.4 mm
1270 mm
12.7 mm
508 mm
1703 mm
127 mm
Cameraview area
Figure 1: Location of pressure sensors for visualization experiments (Not To Scale)
110 112 114 116 118 120 122 124Time (s)
0
1
2
3
4
5
6
Gag
e pr
essu
re h
ead
(m)
Filtered data
P1P2P3P4P5P6P7P8P9
Figure 2: Example of pressure heads recorded in a geyser experiment (dropshaft height = 6 m)
12

December 16, 2018 Journal of Hydraulic Research GeyserMechanism
117 117.5 118 118.5 119 119.5 120Time (s)
0
1
2
3
4
5
6
Gag
e pr
essu
re h
ead
(m)
Filtered data
P1P2P3P4P5P6P7P8P9
Figure 3: First zoom-in of Figure 2
120 120.5 121 121.5 122 122.5 123Time (s)
0
1
2
3
4
5
6
Gag
e pr
essu
re h
ead
(m)
Filtered data
P1P2P3P4P5P6P7P8P9
Figure 4: Second zoom-in of Figure 2
13

December 16, 2018 Journal of Hydraulic Research GeyserMechanism
Figure 5: Geyser Processes (a) air pocket approaching dropshaft
(b) Rising of Taylor-like bubble
(c) Water spill and acceleration of air pocket in horizontal pipe
14

December 16, 2018 Journal of Hydraulic Research GeyserMechanism
(d) First eruption and formation of liquid slugs
(e) Successive eruptions as a result of blowout of slugs
15

December 16, 2018 Journal of Hydraulic Research GeyserMechanism
(f) Depressurization and propagation of waves in the horizontal pipe
(1) t=116.925 s (2) t=120.322 s
150 mm
150 mm
Figure 6: Flow snapshots in the experimental vertical pipe at various times
16

December 16, 2018 Journal of Hydraulic Research GeyserMechanism
(1) t = 110.086 s
(2) t = 114.411 s
(3) t = 114.711 s
(4) t = 115.336 s
(5) t = 117.961 s
(6) t = 118.011 s150 mm
150 mm
Figure 7: Flow snapshots in the experimental horizontal pipe at various times
17

December 16, 2018 Journal of Hydraulic Research GeyserMechanism
(7) t = 118.061 s
(8) t = 118.111 s
(9) t = 118.161 s
(10) t = 118.211 s
(11) t = 118.261 s
(12) t = 118.311 s150 mm
150 mm
Flow snapshots in the experimental horizontal pipe at various times (Cont.)
18

December 16, 2018 Journal of Hydraulic Research GeyserMechanism
(13) t = 118.361 s
(14) t = 118.411 s
(15) t = 118.461 s
(16) t = 118.511 s
(17) t = 118.561 s
(18) t = 118.611 s150 mm
150 mm
Flow snapshots in the experimental horizontal pipe at various times (Cont.)
19

December 16, 2018 Journal of Hydraulic Research GeyserMechanism
(19) t = 118.661 s
(20) t = 118.711 s
(21) t = 118.761 s
(22) t = 118.811 s
(23) t = 118.861 s
(24) t = 118.911 s150 mm
150 mm
Flow snapshots in the experimental horizontal pipe at various times (Cont.)
20

December 16, 2018 Journal of Hydraulic Research GeyserMechanism
(25) t = 120.486 s
(26) t = 120.536 s
(27) t = 120.586 s
(28) t = 120.636 s
(29) t = 120.686 s
(30) t = 120.736 s150 mm
150 mm
Flow snapshots in the experimental horizontal pipe at various times (Cont.)
21
December 16, 2018 Journal of Hydraulic Research GeyserMechanism
(31) t = 120.786 s
(32) t = 120.836 s
(33) t = 120.886 s
(34) t = 120.936 s
(35) t = 120.986 s
(36) t = 148.586 s150 mm
150 mm
Flow snapshots in the experimental horizontal pipe at various times (Cont.)
22

December 16, 2018 Journal of Hydraulic Research GeyserMechanism
Figure 8: Air-water mixture sound speed as a predictor for the maximum geyser eruption velocityfor the Minneapolis geyser on July 11, 2004
Figure 9: Air-water mixture sound speed as a predictor for the maximum geyser eruption velocityfor our laboratory geysers
23