Embed Size (px)
Citation preview

Media coverage in times of political crisis:a text mining approach
Enric Junque de Fortuny ∗
Faculty of Applied Economics
University of Antwerp, Belgium
Tom De SmedtFaculty of Arts
University of Antwerp, Belgium
David MartensFaculty of Applied Economics
University of Antwerp, Belgium
Walter DaelemansFaculty of Arts
University of Antwerp, Belgium
February 1, 2012
Abstract
At the year end of 2011 Belgium formed a government, after aworld record breaking period of 541 days of negotiations. We havegathered and analysed 68, 000 related on-line news articles publishedin 2011 in Flemish newspapers. These articles were analysed by acustom-built expert system. The results of our text mining analysesshow interesting differences in media coverage and votes for severalpolitical parties and politicians. With opinion mining, we are able toautomatically detect the sentiment of each article, thereby allowingto visualize how the tone of reporting evolved throughout the year,on a party, politician and newspaper level. Our suggested frameworkintroduces a generic text mining approach to analyse media coverageon political issues, including a set of methodological guidelines, eval-uation metrics, as well as open source opinion mining tools. Since allanalyses are based on automated text mining algorithms, an objectiveoverview of the manner of reporting is provided. The analysis showspeaks of positive and negative sentiments during key moments in thenegotiation process.
∗Corresponding author, [email protected]
1

1 Introduction
Belgium has recently recovered from the longest government formation pe-riod known to modern-day democratic systems (BBC Europe, 2011). It iswell established that mass media and the internet in particular play an in-creasingly more important role in opinion formation (Savigny, 2002). On-linearticles are easily accessible, providing us the unique opportunity to access,analyse and compare them over different newspapers. With huge amountsof articles available, it is no longer possible to analyse and interpret themmanually. This challenge is overcome by using a text mining approach, whichallows for automated analysis of all the articles. Using an automated tech-nique strengthens the objectivity of the analysis: personal bias and opinionin scoring is reduced substantially due to the absence of manual human in-tervention. Please note that we refrained from interpreting the results on apolitical level as much as possible, yet we write to demonstrate how a textmining approach allows an efficient and objective analysis and to summarizenews coverage in today’s on-line media landscape.
1.1 The role of mass media in opinion formation
Nowadays, news papers and other news providers are updating their on-linenews feeds in near real-time, allowing interested parties to follow the newsin near real-time. The Internet has thereby become an important broadcastmedium for politicians.
A study by Benewick et al. (1969) showed that high exposure to a party’sbroadcasts was positively related to a more favourable attitude towards thatparty for those with medium or weak motivation to follow the campaign.Knowing this, McCombs & Shaw (1972) raise the question whether the massmedia sources actually reproduce the political world perfectly. In an im-perfect setting, biases of media could propagate to the public opinion andtherefore influence favouritism towards one or another party or politician,thus shaping political reality. Most of this bias is introduced by the editingand selection process. They conclude that the mass media may well set theagenda of political campaigns. In the digital era, Internet has taken up itsown place as a mass medium next to TV (Fredricksen, 2010) and the afore-mentioned concerns are becoming increasingly more relevant for the Internetas well.
In a meta-analysis considering 59 studies D’Alessio & Allen (2000) found
2
three main bias metrics used to study partisan media bias. The first biasmetric is derived of the fact that mere selection (and deselection) of news ar-ticles to be published by editors introduces a bias. This so called gatekeepingbias causes some topics to never surface in the media landscape and is there-fore an interesting measure of a sampling bias, introduced by editors andjournalists (Dexter & White, 1964). The problem when measuring the gate-keeping bias, however, is that it assumes knowledge of the whole universe ofarticles before actual selection. This turns out to be infeasible to determinefor our purpose since information about rejection is generally undocumentedand thus unknown.
A second bias metric considered, is the coverage bias, which measures thephysical amount of coverage that each side of the issue receives. Traditionally,this is measured in column inches, amount of headlines or in broadcasts timedevoted to sides of the issue. We measure the coverage as the amount ofon-line articles. For political issues each party or politician can be seen asa ‘side’ or an entity. We argue that fair coverage is determined by an apriori distribution. This a priori distribution represents all entities in thepopulation by their relative importance as measured by electoral votes in thelast elections. Large deviations from the fair distribution tend to show somecoverage bias towards one or another entity.
Third, there is the statement bias metric which is concerned with the dis-tinction between favourable versus unfavourable or positive versus negativenews. Given the large corpus used in this study, we choose an automated sen-timent mining approach to measure the statement bias. A word of caution isin order about the interpretation of these ’sentiments’ in news articles. Whenan article about an entity is classified as negative, this does not necessarilyimply unfavouritism from a news source or journalist towards that entity. Itmight be that the entity is purposely interjecting negative criticism in thearticle. This measure should therefore be seen as an associative measure(i.e. a party is associated with a negative image when most of its coveragecontains negative content). No conclusions can be made as to whether thisimage is build by the entity in question or by the news source, that is, wecan only prove that it exists.
Belgium has seen a unique governmental crisis in 2007-2011 during whichboth political parties and politicians have had wide media coverage. In thisstudy, we analyse the bias towards political entities during this period usinga text mining approach. In order to do so, we must first elaborate on theunique setting in which this study took place.
3

Party Ideology Political figures
CD&V christian democratic M. ThyssenR. TorfsJ.-L. DehaeneE. SchouppeS. de BethuneP. Van Rompuy
N-VA Flemish nationalism, liberal B. Weverconservatism H. Stevens
Open VLD liberalism, social liberalism, A. de Croomarket liberalism D. Sterckx
SP.A social democracy, third way J. Vande LanotteF. VandenbrouckeM. Temmerman
VB Flemish nationalism, sepa-ratism, conservatism
F.Dewinter
Table 1: Flemish parties included in the corpus.
1.2 Belgium and its unique political crisis
At the basis of the Belgian crisis lies its dual federalist structure (the twomajor regions being the Dutch speaking Flemish Community and the FrenchSpeaking French Community). An overview of the political parties, includingtheir ideology and their prominent figures is displayed in Table 1.
The mass media has played an important and sometimes controversialrole in the courses taken by parties and - as is often the case in politicalconflicts - passionate assertions have been expressed towards the mass mediaand its favouritism (Niven, 2003). The question whether there truly existsa bias or not should however be answered by a systematic analysis. Weaccomplish this through the different bias metrics introduced in Section 1.1.Using text mining techniques we can calculate these metrics in an unbiasedway, a rare feat in a political setting. Comparison with the actual electionoutcomes allows us to extrapolate information on the relative biases of massmedia towards one or another party.
We use the 2010 Chamber election results as a golden standard againstwhich we measure the mass media bias. The reasoning behind this choiceis that the mass media know these results and therefore know the relative
4
weights of different political parties beforehand. A similar reasoning is used tocompare politicians, but using the 2010 Senate election results since popularpoliticians are voted for directly in the Senate elections, whereas Chamberelections concern party votes.
1.3 Text mining and sentiment analysis
The information age offers an overwhelming number of text documents avail-able on the Web and elsewhere. This poses a challenge since the amount ofinformation is constantly increasing. Furthermore, text documents gener-ally lack metadata such as language, topic, syntactic structure and semanticlabels.
Text mining or knowledge discovery concerns the process of automati-cally extracting novel, non-trivial information from unstructured text doc-uments (Fayyad & Piatetsky-Shapiro, 1996), by combining techniques fromdata mining, machine learning, natural language processing (NLP), informa-tion retrieval (IR) and knowledge management (Mihalcea, 2011). Commontext mining tasks involve document classification, summarization, cluster-ing of similar documents, concept extraction and sentiment analysis. Textmining has had a wide range of applications to date, prevalent applicationsinclude: forecasting petitions (Suh et al., 2010), guiding financial investments(Rada, 2008) and sentiment detection in reviews (Tang et al., 2009).
Textual information can be broadly categorized into two types: objec-tive facts and subjective opinions (Liu, 2010). Opinions carry people’s sen-timents, appraisals and feelings toward the world. Sentiment analysis (oropinion mining) is a subfield of natural language processing that in its moremature work focuses on two main approaches. The first approach is based onsubjectivity lexicons (Taboada et al., 2011), dictionaries of words associatedwith a positive or negative sentiment score (“polarity”). Such lexicons can beused to classify phrases, sentences or documents as subjective or objective,positive or negative. The second approach is by using machine learning textclassification (see for example Pang et al. (2002)). Most work on sentimentanalysis has been carried out on product reviews.
News sources are sentiment-rich resources for which we can extract qual-itative information using similar techniques as described above. Using asubjectivity lexicon for Dutch adjectives we analyse the general tone asso-ciated with politicians and their parties during the political crisis. Similarresearch has been conducted by Schumaker & Chen (2009) for stock market
5

Media Source
Keyword Dictionary
CrawlRemove
Duplicates
Extract
coverage
Extract
sentiments
Compare
Election Results
Political Analysis
Selection Preprocessing Data Mining Evaluation Interpretation
Figure 1: Processing steps used to build and analyse the corpus.
prediction, Godbole & Skiena (2007) for news and blogs and Balahur et al.(2010) for newspaper articles.
2 Material and methodology
In our analyses, we followed the KDD methodology (knowledge discovery indatabases) by Fayyad & Piatetsky-Shapiro (1996) that describes the differentsteps in a KDD application. The resulting process as applied to our problemis displayed in Figure 1.
2.1 Data acquisition and selection
The corpus used in this study comprises of all articles published in on-lineversions of all major Flemish newspapers in 2011 until the end of the politicalcrisis. The corpus contains over 68, 000 articles, spanning a ten month period(from January 1, 2011 to October 31, 2011). An overview of the eight coverednewspapers is displayed in Table 2.
All articles were gathered using a custom built web-crawler. The crawlerextracts articles from the sources’ websites using their built-in search func-tionalities. The crawling process is the equivalent of a typical database selec-tion process in which relevant data are selected using the given query criteria.The query keywords are all major Flemish party names and leading figuresof political parties (see Table 1). The criterion for being a party of interestis based on the votes for that party in the 2010 Chamber Elections, we onlyincluded major parties who were allowed in the Chamber (i.e. parties withat least one chair). A leading figure is a politician with a top ten ranking
6

amount of preference votes in the 2010 Senate Elections (cf. Section 1.2). Anoverview of all political entities included in this study is displayed in Table 1.
2.2 Data Preprocessing
In a second preprocessing phase all data is filtered so as to remove possibleduplicate articles. To see why this is necessary, consider the case in whichan article concerns two parties at the same time. As a consequence of thecrawling process, this article will be presented twice in the dataset (once forthe first party name search, once for the second party name search). Thesecond article present is a redundant entry and must be removed for thefrequency information to be correct. This leaves us with a corpus of allunique articles containing the keywords presented in Table 1.
2.3 Data Mining: Sentiment analysis
For sentiment analysis, we used the previously created Pattern mining mod-ule for Python1. The module contains a subjectivity lexicon of over 3, 000Dutch adjectives that occur frequently in product reviews, manually anno-tated with scores for polarity (positive or negative between +1.0 and −1.0)and subjectivity (objective or subjective between +0.0 and +1.0). For exam-ple: “boeiend” (fascinating) has a positive polarity of +0.9 and “belabberd”(lousy) has a negative polarity of −0.6. A similar approach with one axisfor polarity and one for subjectivity is used by Esuli & Sebastiani (2006) forEnglish words.
In previous research, the lexicon was tested with a set of 2, 000 Dutchbook reviews. Each review also has a user-given star rating. The set wasevenly distributed over negative opinion (star rating 1 and 2) and positiveopinion (star rating 4 and 5). The average score of adjectives in each reviewwas then compared to the original star rating, with a precision of 72% and arecall of 82% (De Smedt & Daelemans, 2011).
In our approach, we look for occurrences of Flemish political parties (seeTable 1) in each newspaper article. We then calculate the polarity of eachadjective that occurs in a window of two sentences before and two sentencesafter. An article can mention several party names, or switch tone. The given
1http://www.clips.ua.ac.be/pages/pattern
7

interval ensures a more reliable correlation between the political party be-ing mentioned (the “target”) and the adjective’s polarity score, contrary tomeasuring all adjectives in the article. A similar approach for target identifi-cation with a 10-word window is used in Balahur et al. (2010). They reportimproved accuracy when compared to measuring all words in the article. Wefurthermore exclude adjectives that score between −0.1 and +0.1 to reducenoise. This results in a set of 366, 613 assessments, where one assessmentcorresponds to an adjective score linked to a party or politician.
For example:
Bart De Wever ( N-VA) verwijt de Franstalige krant Le Soir dat ze aanzettot haat, omdat zij een opiniestuk publiceerde over de Vlaamse wooncodemet daarbij een foto van een Nigeriaans massagraf. De hoofdredactrice legtuit waarom ze De Wever in zijn segregatiezucht hard zal blijven bestrijden.“Verontwaardigd? Ja, we zijn eerst en boven alles verontwaardigd.”
Bart De Wever ( N-VA) accuses the French newspaper Le Soir of incitinghatred after they published an opinion piece on the Flemish housing code to-gether with a picture of a Nigerian mass grave. The editor explains why theywill continue to fight De Wever’s love of segregation hard. “Outraged? Yes,we are first and above all outraged.”
The adjective “hard” scores -0.03 and is excluded. The adjective “veront-waardigd” (outraged, indignant) scores -0.4. In overall, the passage aboutthe political party N-VA is assessed as negative.
3 Results
We analyse the biases and sentiments throughout the whole corpus for eachpolitical entity. We will first be looking at the frequency of occurrence (i.e.the coverage) and afterwards at the tone of articles.
3.1 Media coverage bias
2Source: Federal Public Services Home Affairs (http://polling2010.belgium.be/. Allpercentages in this study are normalized over the Flemish parties and the selection, so as
8

Source Regional #Articles #Readers2 dH,c dH,v BiasDe Redactie No 5,767 146,250 0 2 16.16%De Morgen No 11,303 256,800 0 2 21.53%GVA Yes 9,154 395,700 6 4 27.30%HBVL Yes 3,511 423,700 3 5 37.43%Nieuwsblad No 7,320 1,002,200 2 4 20.24%De Standaard No 9,154 314,000 2 4 23.32%De Tijd No 10,061 123,300 3 4 22.71%HLN No 11,380 1,125,600 3 4 21.62%
Table 2: News sources used for the analysis including their respective num-ber of articles and readers as well as bias metric values for the hammingdistance from consensus (dH,c), the hamming distance from votes (dH,v) andthe deviation from election outcomes (bias).
The coverage c(e, s) of an entity e by a newspaper s is defined as the numberof news articles published by the newspaper on that entity, normalized onthe total amount of articles by that newspaper in the corpus As :
c(e, s) =# {a|a ∈ As ∧ e ∈ a}
#As
(1)
The popularity p(e) of a political party e is defined as the relative amountof preference votes v(e) for that entity (as compared to other entities in thetop ranking set E):
p(e) =v(e)∑
e′∈Ev(e′)
(2)
The popularity is used as the a priori fair distribution. The coverage bias(henceforth referred to as the bias) of a media source is the difference betweenthe real distribution and the fair distribution. That is:
bias(e, s) = c(e, s)− p(e) (3)
bias(s) =∑e∈E
bias(e, s) (4)
where a is an article, represented as a bag of words {w1, w2, ..., wna} with na
the amount of words in the article. Figure 2 shows that for some parties a
to be able to make statistically sound comparisons.
9

substantial bias is found, with a maximal positive bias towards CD&V and amaximal negative bias towards the far-right Vlaams Belang (VB). The firstresult can be justified by the fact that CD&V ran the interim governmentwhile the new government formations took place. The latter result givessupportive evidence to previous research outcomes that the party is beingquarantined by the media (Yperman, 2004).
Figure 2: Discrepancy between media coverage and popularity for popularparties
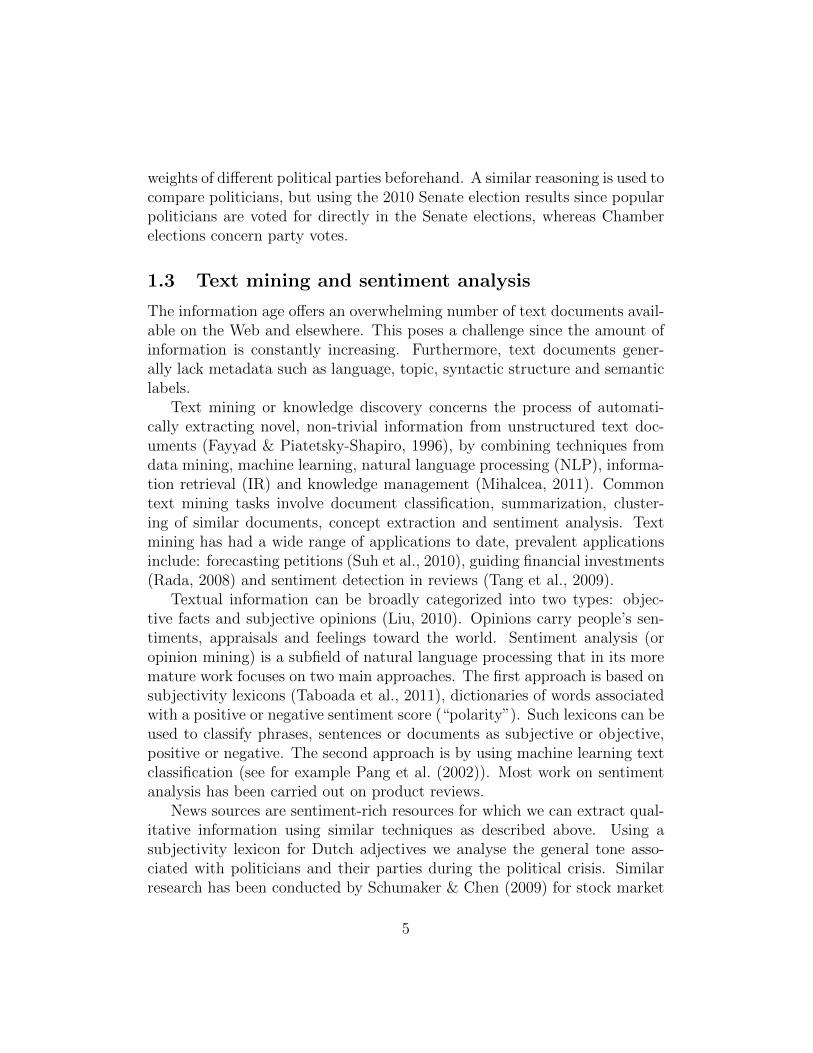
We repeat the analysis for politicians, using the relative amount of pref-erence votes for a party in 2010 as a comparison measure. As can be seen inFigure 3, the bias with respect to a politician varies irrespective of the partyfrom which the politician comes. For instance, a positive bias towards BartDe Wever is not reflected in the (negative) bias of his party (N-VA).
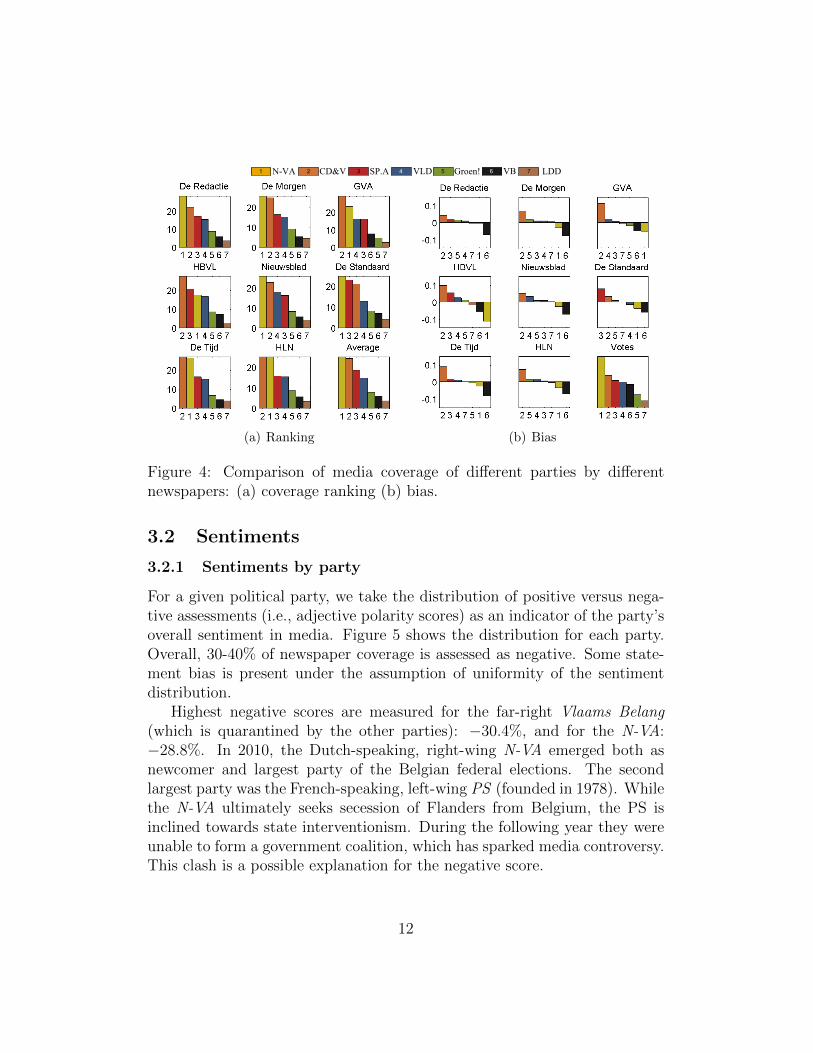
It is also interesting to note the differences between different news sources.To this extent we define a matrix, ranking all political parties by coverageper newspaper (Figure 4(a)). The major tendencies are similar to our pre-vious analysis, but some local differences do exist. We use the Hammingdistance dH (Equation 5) to measure the amount of ranking difference foreach newspaper, compared to the average ranking (see Table 2, dH,c). As theHamming distance increases, disagreement between the consensus rankingincreases. A maximal Hamming distance of 6 is found for regional newspa-per GVA. When we look at the total bias of news papers (Equation 4), we
10
Figure 3: Discrepancy between media coverage and popularity for popularpoliticians
see that again regional newspapers (GVA, HBVL) deviate more than globalones. This is also visible in the Hamming distance between coverage andvotes (see Table 2, dH,c).
dH(v, w) =
#E∑i=1
µ(vi, wi) (5)
µ(a, b) =
{0 a = b
1 a 6= b(6)
The bias between different parties is not uniformly distributed among allparties (i.e. equal to zero). A more fine grained analysis (Figure 4(b)) showsthat general tendencies propagate to the local level (i.e. Vlaams Belang isunder-represented in all newspapers). Interestingly though, some substantiallocal differences exist as well. For instance regional newspaper Het BelangVan Limburg (HBVL) has a large negative bias towards N-VA.
11
CD&VN-VA SP.A VLD VB LDDGroen!1 2 3 4 5 6 7
(a) Ranking (b) Bias
Figure 4: Comparison of media coverage of different parties by differentnewspapers: (a) coverage ranking (b) bias.
3.2 Sentiments
3.2.1 Sentiments by party
For a given political party, we take the distribution of positive versus nega-tive assessments (i.e., adjective polarity scores) as an indicator of the party’soverall sentiment in media. Figure 5 shows the distribution for each party.Overall, 30-40% of newspaper coverage is assessed as negative. Some state-ment bias is present under the assumption of uniformity of the sentimentdistribution.
Highest negative scores are measured for the far-right Vlaams Belang(which is quarantined by the other parties): −30.4%, and for the N-VA:−28.8%. In 2010, the Dutch-speaking, right-wing N-VA emerged both asnewcomer and largest party of the Belgian federal elections. The secondlargest party was the French-speaking, left-wing PS (founded in 1978). Whilethe N-VA ultimately seeks secession of Flanders from Belgium, the PS isinclined towards state interventionism. During the following year they wereunable to form a government coalition, which has sparked media controversy.This clash is a possible explanation for the negative score.
12
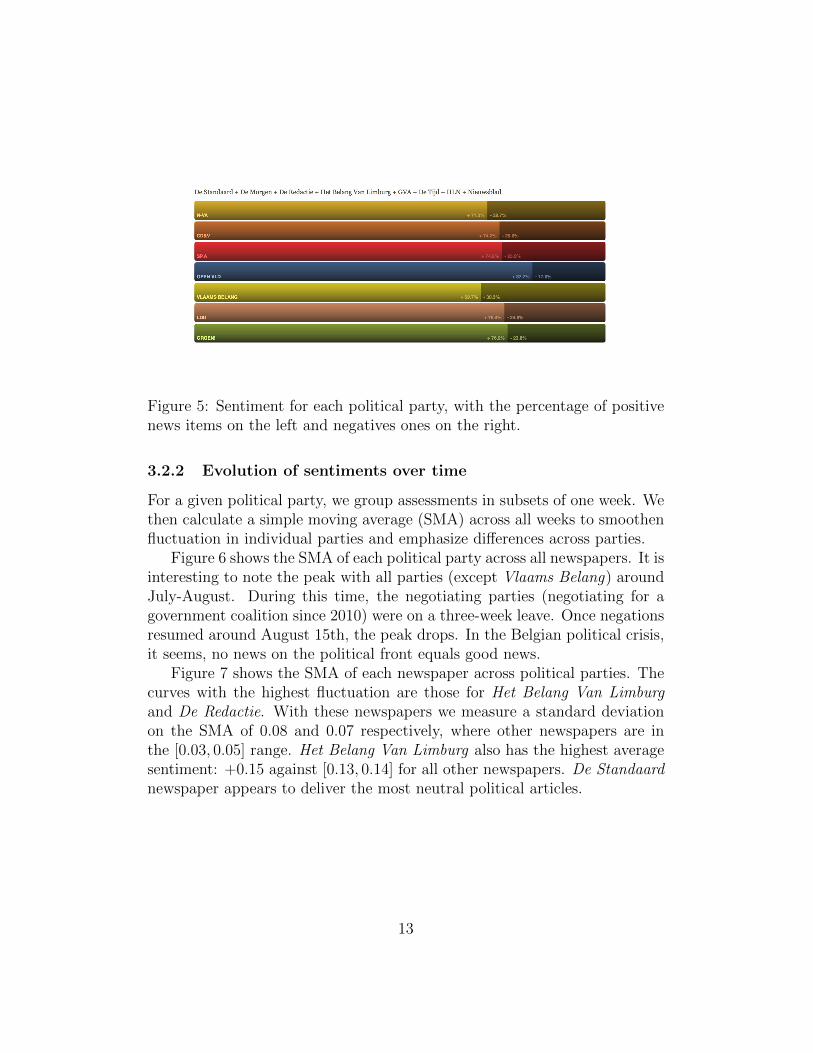
Figure 5: Sentiment for each political party, with the percentage of positivenews items on the left and negatives ones on the right.
3.2.2 Evolution of sentiments over time
For a given political party, we group assessments in subsets of one week. Wethen calculate a simple moving average (SMA) across all weeks to smoothenfluctuation in individual parties and emphasize differences across parties.
Figure 6 shows the SMA of each political party across all newspapers. It isinteresting to note the peak with all parties (except Vlaams Belang) aroundJuly-August. During this time, the negotiating parties (negotiating for agovernment coalition since 2010) were on a three-week leave. Once negationsresumed around August 15th, the peak drops. In the Belgian political crisis,it seems, no news on the political front equals good news.
Figure 7 shows the SMA of each newspaper across political parties. Thecurves with the highest fluctuation are those for Het Belang Van Limburgand De Redactie. With these newspapers we measure a standard deviationon the SMA of 0.08 and 0.07 respectively, where other newspapers are inthe [0.03, 0.05] range. Het Belang Van Limburg also has the highest averagesentiment: +0.15 against [0.13, 0.14] for all other newspapers. De Standaardnewspaper appears to deliver the most neutral political articles.
13
4 Conclusions
We have analysed Flemish newspapers quantitatively during a period of po-litical crisis using a custom built expert system. We have shown that thereexists a coverage bias and provide support for the claim that some statementbias exists throughout the mass media. Methodologically we have shown thatexpert systems are a viable strategy for research in political text corpora.
This proposed text-mining approach based framework can be used as ageneral political barometer, to compare newspapers with regards to their (rel-ative) reporting style, and can even serve political parties who could followthe news reporting on specific topics and adjust their stands if deemed appro-priate. An on-line dashboard that updates the given graphs in real-time willfacilitate such uses. In our future research, we envision the application of thisframework for American political news, and more specific for the Americanpresidential race. From a methodological point of view, we aim to comparethe text mining approach using subjectivity lexicons with a machine learningclassification approach, using a labelled dataset. Furthermore, the sentimentanalysis could be refined by distinguishing negative content from negativeopinion and by adding more classes of sentiment.
To conclude, we hope that further political analysis can benefit from thissystematic and unbiased approach.
References
Balahur, A., Steinberger, R., Kabadjov, M., Zavarella, V., Van Der Goot,E., Halkia, M., Pouliquen, B., & Belyaeva, J. (2010). Sentiment Analysisin the News, .
BBC Europe (2011). Belgium swears in new government headed by Elio DiRupo. http://www.bbc.co.uk/news/world-europe-16042750.
Benewick, R. J., Birch, A. H., Blumler, J. G., & Ewbank, A. (1969). TheFloating Voter and The Liberal View of Representation. Political Studies ,17 , 177–195.
D’Alessio, D., & Allen, M. (2000). Media bias in presidential elections: ameta-analysis. Journal of Communication, 50 , 133–156.
14
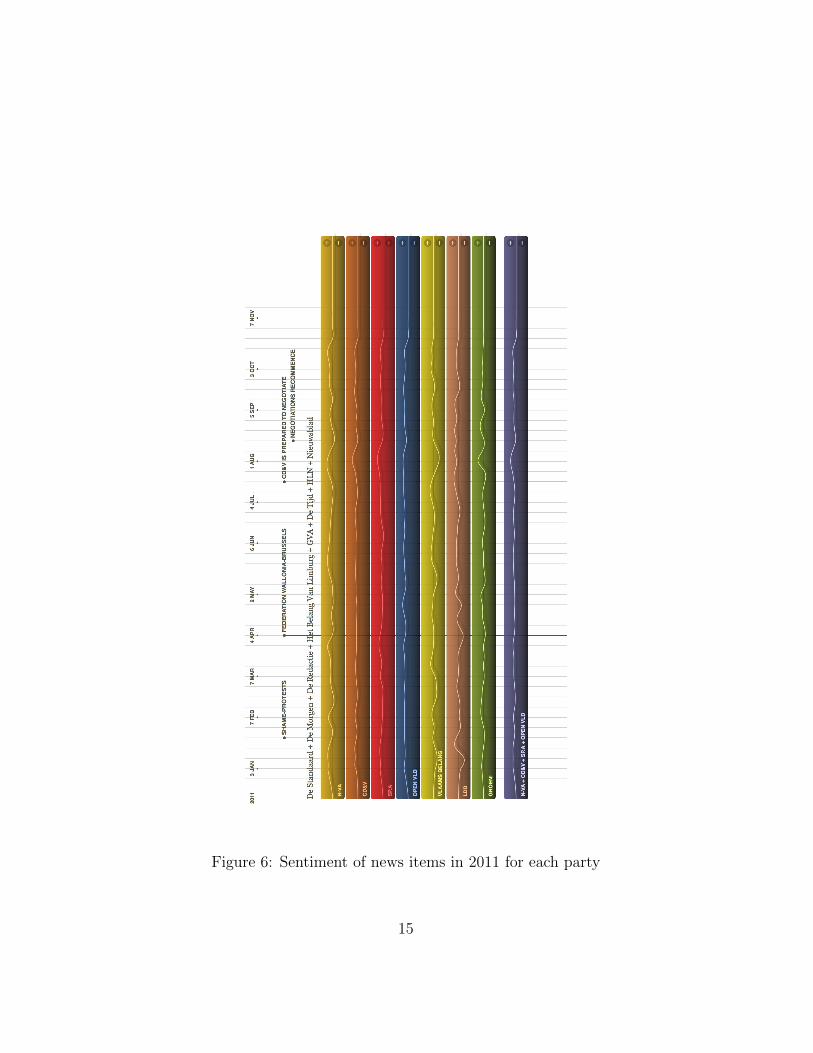
Figure 6: Sentiment of news items in 2011 for each party
15

Figure 7: Sentiment of news items in 2011 for each newspaper
16

Dexter, L., & White, D. (1964). People, society, and mass communications .The Free Press of Glencoe, Collier-MacMillan LTD., London.
Esuli, A., & Sebastiani, F. (2006). SentiWordNet: A publicly available lex-ical resource for opinion mining. In Proceedings of LREC (pp. 417–422).Citeseer volume 6.
Fayyad, U., & Piatetsky-Shapiro, G. (1996). From data mining to knowledgediscovery in databases. AI magazine, 17 , 37–54.
Fredricksen, C. (2010). Time Spent Watching TV Still Tops Inter-net . http://www.emarketer.com/blog/index.php/time-spent-watching-tv-tops-internet/.
Godbole, N., & Skiena, S. (2007). Large-Scale Sentiment Analysis for Newsand Blogs ( System Demonstration ). In ICWSM Icwsm 07 (pp. 1–2).
Liu, B. (2010). Sentiment Analysis and Subjectivity. Handbook of NaturalLanguage Processing , (pp. 1–38).
McCombs, M. E., & Shaw, D. L. (1972). The Agenda-Setting Function ofMass Media. Public Opinion Quarterly , 36 , 176.
Mihalcea, R. (2011). The Text Mining Handbook: Advanced Approachesto Analyzing Unstructured Data Ronen Feldman and James Sanger (Bar-Ilan University and ABS Ventures) Cambridge, England: Cambridge Uni-versity Press, 2007, xii+410 pp; hardbound, ISBN 0-521-83657-3, 70.00.Computational Linguistics , 34 , 125–127.
Niven, D. (2003). Objective evidence on media bias: Newspaper coverageof congressional party switchers. Journalism and Mass CommunicationQuarterly , 80 , 311–326.
Pang, B., Lee, L., & Vaithyanathan, S. (2002). Thumbs up? SentimentClassification using Machine Learning Techniques.
Rada, R. (2008). Expert systems and evolutionary computing for financialinvesting: A review. Expert Systems with Applications , 34 , 2232–2240.
Savigny, H. (2002). Public Opinion , Political Communication and the In-ternet. Political Studies , 22 , 1–8.
17
Schumaker, R. P., & Chen, H. (2009). Textual analysis of stock market pre-diction using breaking financial news. ACM Transactions on InformationSystems , 27 , 1–19.
Suh, J. H., Park, C. H., & Jeon, S. H. (2010). Applying text and data miningtechniques to forecasting the trend of petitions filed to e-People. ExpertSystems with Applications , 37 , 7255–7268.
Taboada, M., Brooke, J., Tofiloski, M., Voll, K., & Stede, M. (2011). Lexicon-Based Methods for Sentiment Analysis. Computational Linguistics , 1 ,1–41.
Tang, H., Tan, S., & Cheng, X. (2009). A survey on sentiment detection ofreviews. Expert Systems with Applications , 36 , 10760–10773.
Yperman, T. (2004). Van Vlaams Blok naar Vlaams Belang . Ph.D. thesisUniversity of Ghent.
18