Embed Size (px)
Citation preview

Media Framing of the Ebola Crisis
Theresa Vellek
Undergraduate Honors Thesis, Sanford School of Public Policy
Duke University
Durham, North Carolina
2016
Advisors: Prof. Misha Angrist and Prof. Kenneth Rogerson
Acknowledgements
I would like to offer a sincere thanks to the following people, without whom this
thesis would not have been possible:
Prof. Misha Angrist, my thesis advisor, for his encouragement, guidance, and
feedback was instrumental to the final product.
Prof. Kenneth Rogerson, my honors thesis seminar director, for his constant
support and for challenging me to think and write to the best of my ability.
Prof. Eric Green, my global health professor, for his comments and assistance in
conducting statistical analysis of my results.
Katherine Chernova, Erin Locey, and Surya Veerabagu, my friends, for being
my sounding board for ideas and always brightening my day.
Ann and Mark Vellek, my parents, for being a never-ending source of support
and encouragement.
Table of Contents
ABSTRACT ...................................................................................... 1
INTRODUCTION ........................................................................... 2
THEORETICAL FRAMEWORK .................................................. 3
Implications of Media Framing ....................................................................................... 3 Framing as Perception: True versus Manipulated ........................................................ 5 Risk Reporting: Media Coverage of International Crises .............................................. 7 Media Framing of International Health Crises ............................................................. 8 Media Frames Analysis of the Mid-1990s Ebola Outbreaks ....................................... 11
ANCILLARY RESEARCH QUESTIONS .................................. 12
METHODOLOGY ......................................................................... 13
Cases: 2000-2001 Ebola Outbreak and 2014-2015 Ebola Outbreak ........................... 13 Content Analysis & Coding ........................................................................................... 15 Mutation-Contagion Frame ........................................................................................... 17 “Othering” and Containment Frame ............................................................................ 18 Globalization Frame ...................................................................................................... 18 Human Interest Frame .................................................................................................. 19 Economic Consequences Frame .................................................................................... 19 Attribution of Responsibility Frame ............................................................................. 20 Phrase-to-Frame Coding and Analysis ......................................................................... 20
RESULTS ....................................................................................... 22
Sample ............................................................................................................................ 22 Mutation-Contagion Frame ........................................................................................... 24 “Othering” and Containment Frame ............................................................................ 29 Globalization Frame ...................................................................................................... 31 Human Interest Frame .................................................................................................. 33 Economic Consequences Frame .................................................................................... 35 Attribution of Responsibility Frame ............................................................................. 37
CONCLUSION .............................................................................. 39
Application of Frames from the Literature to Recent Ebola Coverage ....................... 39 Differences in Frames from 2000 to 2014 ..................................................................... 43 Differences in Frames Across Media Outlets ............................................................... 46 Consequences of Framing on Public Opinion of Ebola ................................................ 48 Limitations ..................................................................................................................... 49 Future Research ............................................................................................................. 50
REFERENCES .............................................................................. 51
APPENDICES ............................................................................... 57
Appendix 1. Sampling of the Media Coverage ............................................................ 57 Appendix 2. Number of Articles in which Frames Appeared ...................................... 58 Appendix 3. Total Number of Frame Occurrences ....................................................... 59 Appendix 4. Phrase-to-Frame Coding Inputs ............................................................... 60
Abstract
This study examines the role of international media framing in coverage of Ebola. A
quantitative content analysis compared framing techniques in Ebola coverage across BBC
Monitoring, The New York Times, The Daily Telegraph (UK), and The Straits Times (Singapore)
in the 2000-2001 and 2014-2015 outbreaks. Results show that mutation contagion was by far the
most frequently appearing frame in the media. Recent media coverage also mimicked the
tendency to represent Ebola as distinctively “African,” as found in research on the 1990s Ebola
outbreak. Additionally, the portrayal of Ebola as a globalized threat was especially important in
coverage of the 2014 outbreak. Overall, media coverage of the Ebola crisis appeared highly
politicized and event-based. Particularly because the media serve as the primary source of
information about infectious disease epidemics for much of the public, their framing has
implications for how the world views Ebola.
2
Introduction “The level of outbreak is beyond anything we’ve seen—or even imagined.”
— Dr. Tom Frieden, the director of the Centers for Disease Control and Prevention
September 2, 2014
“This is the biggest health problem facing our world in a generation.”
— British Prime Minister David Cameron October 17, 2014
Ebola has become a global issue. The newest outbreak far exceeds any previous one. The
biggest historic outbreak, in 1976, killed 280 people (CDC, 2015). Since 2014, Ebola has
infected almost 30,000 people, killed more than 11,000, and it continues to be a threat because of
sexual transmission from male survivors (WHO, 2015; McNeil, 2015). This is not the first global
epidemic this century. The world endured SARS, the avian bird flu, and Creutzfeldt-Jakob
disease. Sixteen percent of all deaths are from infectious diseases (Center for Strategic and
International Studies, 2015). But absent any effective treatment or vaccine, public health officials
are still unprepared to deal with contagions like Ebola.
Infectious diseases pose a security threat that the public and the media have previously
overlooked. The media serve as a reflection of the public’s concern and contribute to the general
population’s understanding of health epidemics (Shih, Wijaya, & Brossard, 2008). The social
and political contexts of infectious disease epidemics are captured in the frames mass media
employ to tell stories about emerging diseases. Framing theory suggests that how the media
present an issue affects how audiences feel about that issue (Ungar, 1998; Shih, Wijaya, &
Brossard, 2008). Thus analyzing news coverage of disease crises offers a window for
understanding public opinion and knowledge.
3
This paper endeavored to understand the role of media framing in coverage of two
international health crises involving a single infectious pathogen. A content and frame analysis
of news articles compared coverage of the 2014 Ebola outbreak with the more extensively
researched 2000-2001 outbreak (425 infections; 224 deaths) (CDC, 2015). This analysis
identified trends in media coverage of the Ebola crisis by applying frames recognized in past
studies of infectious disease outbreaks.
Theoretical Framework
Implications of Media Framing
Individuals use media coverage as a cognitive shortcut, or heuristic, to make sense of
complex risks, including infectious disease pandemics (Ungar, 1998). The public “co-constructs”
what they see, read, and hear from the media with information from personal experience to
understand an issue (Dearing & Rogers, 1996). Thus studying how the media interpret specific
issues is a prerequisite to understanding the dynamics surrounding public perception (Shih,
Wijaya, & Brossard, 2008; Ungar, 1998). Goffman (1986) first introduced the concept of
framing as an interpretation or schema that aims to structure the meaning of a message. Entman
and others suggest that analyses of frames in the media reveal how reading a story influences
readers’ attitudes about an issue (Entman, 1993).
Two types of media framing exist: journalistic and reader (Burton, 2010; Scheufele &
Tewksbury, 2007). Journalistic framing describes familiar features and conventions in text that
make it easy for the reader to take away the intended message of the producer (in this case the
media outlet). Reader framing leaves the meaning and message up to the audience’s
interpretation, including how a reader formulates their own meaning based on their own personal
4
experiences and values (Burton 2010; Scheufele & Tewksbury, 2007; Philo, Miller, & Happer,
2014).
Instead of studying the general population’s attitudes toward international health crises
more broadly, which would be required to study reader framing, this study focused on the role of
media outlets and journalistic framing as one influence on people’s understanding and policy
preferences. In journalistic framing, the media draw attention to certain features of an issue while
minimizing attention to others (Shih, Wijaya, & Brossard, 2008). A frame highlights a particular
interpretive package, which is a cluster of metaphors, exemplars, stories, visual images, moral
appeals, and symbolic devices (Ungar, 1998). Framing theory suggests that the way in which the
media talk about a certain issue affects how audiences feel about that issue (Ungar, 1998; Shih,
Wijaya, & Brossard, 2008).
By studying audience effects of the media, some scholars have developed models to
predict the amount of impact coverage will have on the public’s viewpoint. Kim (2014) presents
the concept of need for orientation, which “refers to the tendency of individuals to seek
information about public issues from the media,” as a way to explain how the media agenda
influences the public. He argues that individuals will be more susceptible to media messages and
agenda-setting if the information is relevant to them and if they have a high degree of uncertainty
(Kim, 2014). Berry, Wharf-Higgins, & Naylor (2007) take the ideas underlying this theory one
step further, as they reason that when a person lacks direct experience with a particular risk, their
knowledge originates from news media. Furthermore, they say dramatization, volume, and
symbolic connotations in the media dictate personal responses (Berry, Wharf-Higgins, & Naylor,
2007). Thus the need for orientation theory sets the expectation that media representations of
5
Ebola will result in a greater audience effect, as media frames influence audience knowledge and
attitudes toward the public health epidemic (Kim, 2014; Berry, Wharf-Higgins, & Naylor, 2007).
Framing as Perception: True versus Manipulated
Framing in the media is a social construction of news (Johnson-Cartee, 2004). Thus it
represents the media’s perception of an event, which is not necessarily an accurate reflection of
reality. Whether that perception is truthful or manipulated requires a discussion separate from
merely analyzing the media’s frames. The issue attention cycle—the ups and downs of attention
an issue receives either from the public or from mass media—can dictate the public importance
of an issue and explain the volume of associated media coverage (Shih, Wijaya, & Brossard,
2008). The sources media outlets rely upon can also manipulate, or spin, the messages in
coverage (Johnson-Cartee, 2004). Therefore, it is important to recognize the types of sources in
news reports in order to understand the effects of the media on how a story is received.
Depending on the reliability of the sources, coverage may depart from reality to a greater or
lesser extent.
Popular media and novels have fueled myths and hysteria surrounding Ebola. Weldon
(2001) illustrates how non-fiction accounts of Ebola have created an “urban legend” of the
“predatorial virus stalking the human race.” This type of horrific depiction coupled with
misinformation have driven dramatization, which then downplays the extent of human
involvement in the disease (Weldon, 2001).
Several scholars have looked to Richard Preston’s book The Hot Zone as the
quintessential example of how a single work can dramatically affect the public’s perception.
Haynes (2002) contends that Preston’s illustration of Ebola as an emerging virus in the
developing world follows a narrative common in colonist perceptions of Africa as the “heart of
6
darkness.” This creates a social construction of Africa as “other,” and in turn avoids casting
blame on the Western world (Haynes, 2002). Preston’s dramatic framing of the 1990s Ebola
outbreak exaggerated symptoms, created a myth of Ebola being airborne, and downplayed the
empirical absence of extreme contagion (Smith, 2014). He used language like “liquefy,”
“bleeding out,” and “dissolving” to describe Ebola, although workers from Médicins Sans
Frontières said patients mostly looked sick and weak, while blood excretion was minimal and
rare. Preston himself has conceded that The Hot Zone could have been more “clear and accurate”
and contains at least one scene that “almost certainly didn’t happen” (Alter, 2014).
Other accounts were more measured. Laurie Garrett’s The Coming Plague offered a
sharp contrast to Preston’s sensationalism. Her thoroughness was a likely product of her
background in public health and epidemiology; she acquired an “obsession with details” as she
researched and wrote the book over a 10-year period (Hall, 1994). Preston’s and Garrett’s
radically different framing of Ebola show how personal background and the sources journalists
consult can have a major impact on the end result.
A study of the construction of news reports on health topics revealed that public health
authorities (e.g., the World Health Organization, the Centers for Disease Control and Prevention,
and doctors from treating hospitals) are commonly the most used and quoted sources (Berry,
Wharf-Higgins, and Naylor, 2007). Similarly, a content analysis of European media coverage of
the opening days of the H1N1 influenza pandemic revealed that 74 percent of articles used
national and international public health authorities as the leading sources of information (Duncan,
2009). An analysis of Creutzfeldt-Jakob disease, West Nile virus, and avian flu also found the
media commonly cited official sources in their stories (Shih, Wijaya, & Brossard, 2008). These
7
studies set the expectation that official sources in media coverage of the 2000-2001 and 2014
Ebola outbreaks will play a significant role in framing stories.
Risk Reporting: Media Coverage of International Crises
To fully understand international health crises, including Ebola, it is necessary to evaluate
their impact in terms of their risk to global health. Sociological models of risk, which view risk
as socially, culturally, societally, and/or data contingent, create a framework to analyze how the
media portray the risk associated with disease. Thus studying sociological models of risk is
helpful. Previous research on health media coverage revealed that health topics were most often
discussed in terms of risk (Berry, Wharf-Higgins, & Naylor, 2007).
There are several models of risk in the social sciences. The realist or techno-scientific
view sees risk as a quantity to be calculated from hard data, which reflect unbiased, objective
reality (Anderson, 2006; Washer, 2004). This perspective would see media coverage of health
crises from a factual and statistical perspective, such as the number of individuals infected by a
disease or the dollar amount a disease cost a country’s health system. Another model, the social
constructivist or anthropologist view, perceives risk as subjectively mediated through social and
cultural processes (Anderson, 2006; Washer, 2004). This emphasis on social contexts of risk
would explain why, for example, HIV/AIDS was not frequently reported on initially because of
its taboo social characteristics. A third model, the risk society, deems post-modern society as
obsessed with risk due to the unique challenges that globalization poses (Beck, 1992). Following
this logic, the media magnify risks to create alarm, and with international health crises they
might focus on, for example, the added risk of spreading disease through air travel since it
creates a problem the previously less globalized world did not face. Critics of the risk society
model argue that people defend themselves against increased anxiety by creating representations
8
of risk (Joffe, 1999). For example, in the media coverage of the 1990s Ebola outbreak, the media
emphasized the ways in which Western biomedicine could help rid foreign countries of this
disease. These representations in the media, according to critics, transform risk into a rational,
calculable, and solvable phenomenon (Joffe, 1999).
Social and political contexts dictate the prominence of particular types of risks in the
public and media’s consciousness (Bennett, 2010). Consequently, the social and political
contexts brought the Ebola outbreaks to the forefront of media coverage. Fright factors—such as
risks being involuntary, inequitably distributed, inescapable, dreadful, and poorly understood by
science—increase the likelihood that public attention will focus on a particular risk (Bennett,
2010). The Social Amplification of Risk Framework (SARF) seeks to explain why certain events
attract more socio-political attention, although they do not always reflect relative objective risk
(Anderson, 2006). It asserts that when a person lacks direct experience with a particular risk,
their knowledge originates from news media (Berry, Wharf-Higgins, & Naylor, 2007).
Dramatization, volume, and symbolic connotations in the media dictate personal responses
(Berry, Wharf-Higgins, & Naylor, 2007). Thus SARF sets the expectation that media
representations of Ebola will result in a greater audience effect, as media frames influence
audience knowledge and attitudes toward the public health epidemic.
Media Framing of International Health Crises
Following the pattern of past research, this paper will concentrate on infectious disease
epidemics as a form of an international health crisis. The issue attention cycle explains why the
media sometimes drive public consciousness toward disease epidemics, while seemingly
ignoring them at other times (Shih, Wijaya, & Brossard, 2008). Studying public health epidemics,
such as CJD, West Nile virus, and avian flu, researchers discovered that coverage of epidemic
9
diseases was highly event-based and did not always mirror the total number of people infected.
Instead, media coverage varied along lines of government actions and major surges in numbers
of infected cases (Shih, Wijaya, & Brossard, 2008). Disease has become politicized because
costs of healthcare and resource allocation to public health and medical research are highly
contingent on governmental action (Hong, 2014). Using this logic, one would anticipate seeing
media coverage of Ebola highly contingent on political events and politicized outbreaks.
Social representations theory (SRT) argues that when faced with a newly encountered
illness, people collectively create a shared narrative based on “common sense” knowledge to
cope with the novelty and impose order (Washer, 2004; Joffe & Haarhoff, 2002). These social
representations construct the world through past events, images, terms, descriptions, examples,
models, and metaphors to anchor a new phenomenon and make it seem more familiar and
therefore less threatening (Moscovici, 2001). The mass media both cultivate and reflect these
representations (Washer, 2004).
With the threat of a new infectious disease, media reporting reveals broader anxieties
about the inability of technology and biomedicine to contain epidemics and about the ecological
and economic threats of globalization (Washer, 2004). These recurrent worries resurface with
each subsequent epidemic, allowing researchers to draw broader conclusions about media
coverage of international health crises.
Various studies of infectious disease epidemics demonstrated a shift from alarming to
reassuring coverage (Washer, 2004; Ungar, 1998; Joffe & Haarhoff, 2002). In an analysis of
SARS in British newspapers, Washer showed that coverage began with a mutation-contagion
frame by representing SARS as a threatening killer, but then contained the threat (a containment
frame) by illustrating how “different” or “other” the Chinese were to “us” as British (2004).
10
Early coverage of HIV/AIDS, however, skipped the mutation-contagion frame and instead
focused on the containment frame because of the stigma and “otherness” associated with the
homosexual population (Washer, 2004). Media editors initially avoided all news about AIDS
because they failed to see how a story about homosexuals and drug users would interest their
reader population (Washer, 2004). This dichotomy between “us” versus “them” created a
separation from the threat of an emerging infectious disease (Allan, 2002).
However, the containment representation of epidemics—and the coping mechanism the
media use to alleviate fears by focusing on how the disease affects “others” rather than the
immediate audience—does not translate to all infectious diseases. For example, British news
coverage of Creutzfeldt-Jakob disease (CJD) could not blame “others” for the emergence and
spread of the disease, since the English were at fault (Washer, 2006). The frames used in media
coverage of CJD instead lowered public anxiety about the disease by using the process of
anchoring in SRT: Media representations of CJD integrated the understanding of this new
disease by configuring it, i.e., anchoring it, in terms of past epidemics (like the flu and
salmonella), which made it more familiar and less frightening (Washer, 2006).
Media coverage of international health crises uses metaphors to describe emerging
infectious diseases to an uneducated public. Reports depict diseases as killers, plagues, or hostile
combatants in war (Wallis & Nerlich, 2005). The mass media have framed cancer, drug-resistant
tuberculosis, and HIV/AIDS in terms of militerized wars, mimicking the language of politicians,
such as President Richard Nixon’s “war on cancer,” which launched in the early 1970s. Yet
militarizing health crises can promote shame and guilt among sufferers, make it easier to
sacrifice rights, and encourage massive resource expenditure (Wallis & Nerlich, 2005). Initial
HIV/AIDS media coverage compared the disease to a plague (Wallis & Nerlich, 2005; Sontag,
11
1989). Rather than the historically prevalent military or plague metaphors, media coverage of
SARS in the early 2000s treated SARS as a “killer” (Wallis & Nerlich, 2005). Stories
incorporated language typically associated with a killer, using words such as “rampant,” ravages,”
“hunting,” and “victim.” Attention to metaphors in mass media representations of the Ebola
outbreaks will help illuminate the framing of the disease epidemic.
Content analyses of media coverage of the SARS epidemic in the early 2000s provide a
good framework for an analysis that can be applied to the Ebola outbreaks. The SARS studies
compared Chinese versus U.S. media coverage on the basis of several frames: responsibility,
conflict, severity, leadership, human interest, and economic consequences (Beaudoin, 2007;
Luther & Zhou, 2005). The present analysis of media reports about the 2000-2001 and 2014
Ebola outbreaks mirrored this content analysis and analyzed which of the frames were most
prevalent. Drawing from literature about SARS and Ebola media coverage, a model of
previously formulated frames analyzed the media’s portrayal of recent Ebola crises.
Media Frames Analysis of the Mid-1990s Ebola Outbreaks
Ungar analyzed media frames of the 1990s Ebola epidemic and found that the initial
mutation-contagion package (a frightful account of the emerging disease) transformed into a
containment package (a classification of victims as “others” to allay fear) (1998). He argued that
the earliest coverage contained the most terrifying aspects of the mutation-contagion package:
the Ebola virus was seen as being on a rampage, as cleverer than biomedicine, and as knowing
no boundaries. But after merely a few days, he noted that coverage began to contain the threats
of Ebola to Africa, emphasizing the “other” and “foreign” aspects, presumably to alleviate
anxiety. Drawing upon the sociology of moral panic, Ungar termed this switch from alarming to
reassuring coverage “the moderation effect.” This leads one to wonder whether this transition
12
from mutation-contagion to containment frames occurred in the media coverage of the 2000-
2001 and 2014 Ebola outbreaks.
Another content analysis of the mid-1990s Ebola outbreak examined how British
broadsheets, tabloids, and their readers interpreted Ebola as a far-flung illness (Joffe & Haarhoff,
2002). Joffe and Haarhoff’s research revealed that the mass media represented Ebola as African,
and as posing little threat to Britain (Joffe & Haarhoff, 2002). During this outbreak, tabloids used
a more sensationalized vision of Ebola, whereas broadsheets concentrated on the structural
features that led to Ebola’s escalation. This division in the British media illustrates how different
types of press may differ in their coverage of one event. The press made Ebola appear real by
focusing on its potential to globalize and how it could be contained. But readers drew an analogy
between Ebola and science fiction to share their view that Ebola, which plagued a distant land,
seemed unrealistically horrific (Joffe & Haarhoff, 2002). Although this study did not evaluate
readers’ interpretations of the 2000-2001 and 2014 Ebola outbreaks, it did test whether media
outlets characterized Ebola as African and not a threat to other parts of the world.
Ancillary Research Questions
The newest outbreak of Ebola has killed over 40 times the number of people than any
previous outbreak (WHO, 2015; CDC, 2015). Because of the uniqueness of the 2014-2015
epidemic and the fact that this was the first study to analyze its media coverage, it was difficult
to predict what frames the media used. Therefore, an inductive study to answer key research
questions was appropriate, rather than a deductive study to test previously formulated
hypotheses. Overall, the content analysis worked to answer the question of the role of media
framing in coverage of the recent Ebola outbreaks.
13
This analysis of media reports from the British Broadcasting Corporation World Service
Group’s BBC Monitoring, The New York Times, The Daily Telegraph (UK), and The Straits
Times (Singapore) for a year-long period following the initial confirmation of Ebola in 2000
(October 15) and the 2014 World Health Organization announcement of the outbreak (March 25)
also addressed several ancillary questions. These were derived from past research on
international health crises in the media:
• Do the frames from existing literature of international health crises apply to Ebola
coverage in 2000-2001 and 2014-2015?
• How does framing differ between the 2000-2001 outbreak and the 2014-2015 outbreak?
• How does framing differ among media outlets (BBC Monitoring, The New York Times,
The Daily Telegraph, and The Straits Times)?
Methodology
The method to assess the role of media framing in coverage of Ebola was a quantitative
content analysis of articles published by BBC Monitoring, The New York Times, The Daily
Telegraph (UK), and The Straits Times (Singapore). The two outbreaks analyzed were during
2000-2001 and 2014-2015, the two largest Ebola epidemics, to allow for a comparison in
coverage. The sample of media reports included one year of coverage from the LexisNexis
database, starting from the date the WHO confirmed the first cases of Ebola.
Cases: 2000-2001 Ebola Outbreak and 2014 Ebola Outbreak
Ebola is spread through direct contact via broken skin or unprotected mucus
membranes—such as those found in the eyes, nose, or mouth—with blood or bodily fluids,
needles and syringes contaminated with the virus, and infected fruit bats or primates (CDC,
14
2015). For every individual infected with Ebola, 1.5 to 2.5 other people will develop the disease
(Chowell & Nishiura, 2014). A person infected with the Ebola virus is not contagious until
symptoms appear. Symptoms appear on average 8 to 10 days after exposure, but may take up to
21 days to materialize. Symptoms of Ebola include fever, severe headache, fatigue, muscle pain,
weakness, diarrhea, vomiting, abdominal pain, and unexplained hemorrhage (CDC, 2015). There
is no cure or vaccine for Ebola. Ebola is more deadly than measles, plague, and smallpox (CDC
“Measles”, 2015; WHO “Plague”, 2014; “WHO Fact Sheet on Smallpox”, 2001). On average, 50
percent of people who contracted Ebola have died from it (WHO, 2015).
The 2014 Ebola outbreak was the most recent example of an emerging infectious disease
generating an international health crisis. The 2000-2001 outbreak acted as a model for
comparison because of previous research analyzing media frames in stories covering this event
(Joffe & Haaarhoff, 2002). The 2014 outbreak, the largest in history, affected 28,637 individuals
and caused 11,314 deaths as of November 22, 2015 (CDC, 2015). Ebola, previously known as
Ebola hemorrhagic fever, is a virus named after the Ebola River in what is now the Democratic
Republic of the Congo, where the first known outbreak of this disease occurred in 1976 (CDC,
2015). Aggregated, these early outbreaks in the DRC and Sudan killed more than 400 people.
Since then, Ebola outbreaks have sporadically appeared in Africa. The DRC saw the next big
outbreak of Ebola in 1995, when it killed 250 people. In 2000-2001, there was another upsurge
in Ebola deaths, killing 224 people in Uganda. There was also a flareup in 2007-2008 in DRC
and Uganda, which killed 187 people (CDC, 2015).
The impact and timeliness of the 2014 and 2000-2001 Ebola outbreaks made them
essential to answering the larger question of the role of the media in international health crises.
15
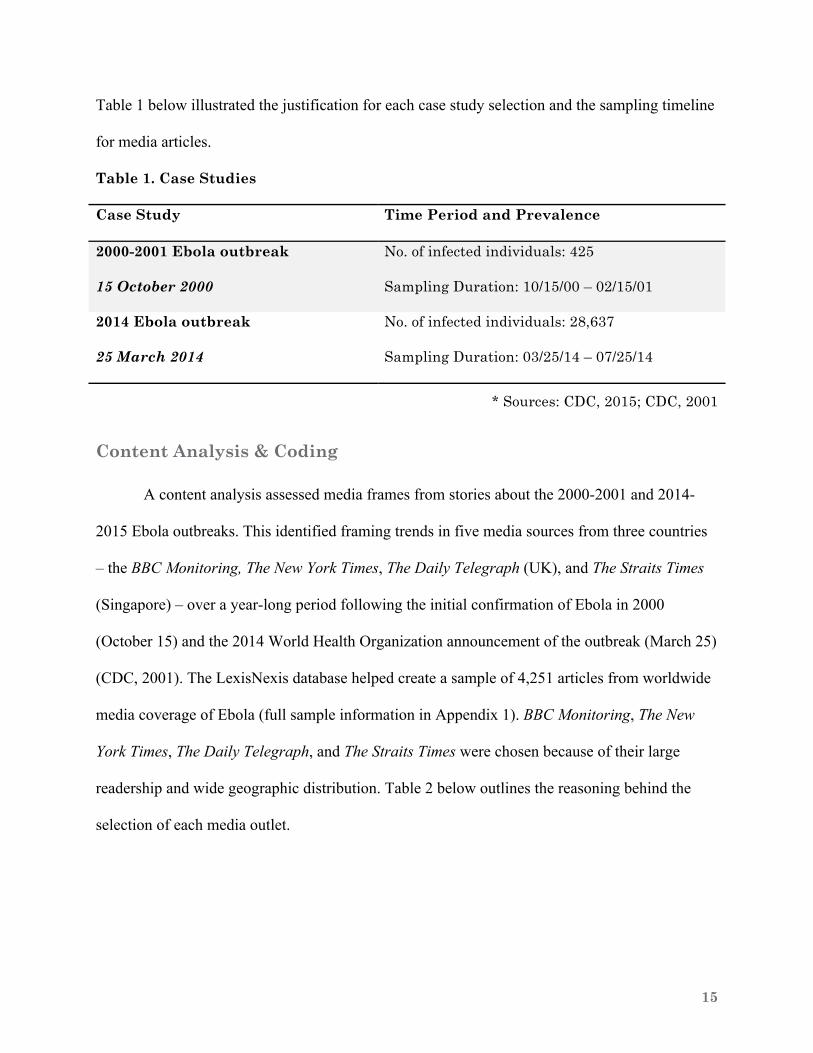
Table 1 below illustrated the justification for each case study selection and the sampling timeline
for media articles.
Table 1. Case Studies
Case Study Time Period and Prevalence
2000-2001 Ebola outbreak
15 October 2000
No. of infected individuals: 425
Sampling Duration: 10/15/00 – 02/15/01
2014 Ebola outbreak
25 March 2014
No. of infected individuals: 28,637
Sampling Duration: 03/25/14 – 07/25/14
* Sources: CDC, 2015; CDC, 2001
Content Analysis & Coding
A content analysis assessed media frames from stories about the 2000-2001 and 2014-
2015 Ebola outbreaks. This identified framing trends in five media sources from three countries
– the BBC Monitoring, The New York Times, The Daily Telegraph (UK), and The Straits Times
(Singapore) – over a year-long period following the initial confirmation of Ebola in 2000
(October 15) and the 2014 World Health Organization announcement of the outbreak (March 25)
(CDC, 2001). The LexisNexis database helped create a sample of 4,251 articles from worldwide
media coverage of Ebola (full sample information in Appendix 1). BBC Monitoring, The New
York Times, The Daily Telegraph, and The Straits Times were chosen because of their large
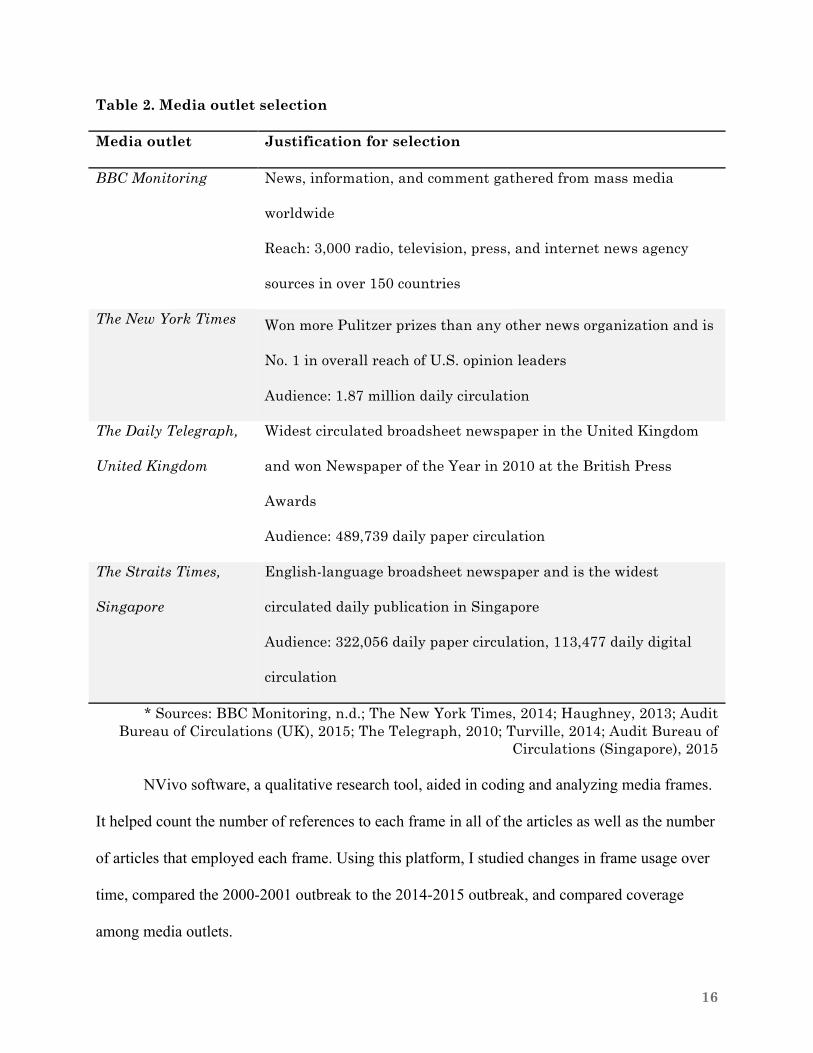
readership and wide geographic distribution. Table 2 below outlines the reasoning behind the
selection of each media outlet.
16
Table 2. Media outlet selection
Media outlet Justification for selection
BBC Monitoring News, information, and comment gathered from mass media
worldwide
Reach: 3,000 radio, television, press, and internet news agency
sources in over 150 countries
The New York Times Won more Pulitzer prizes than any other news organization and is
No. 1 in overall reach of U.S. opinion leaders
Audience: 1.87 million daily circulation
The Daily Telegraph,
United Kingdom
Widest circulated broadsheet newspaper in the United Kingdom
and won Newspaper of the Year in 2010 at the British Press
Awards
Audience: 489,739 daily paper circulation
The Straits Times,
Singapore
English-language broadsheet newspaper and is the widest
circulated daily publication in Singapore
Audience: 322,056 daily paper circulation, 113,477 daily digital
circulation
* Sources: BBC Monitoring, n.d.; The New York Times, 2014; Haughney, 2013; Audit Bureau of Circulations (UK), 2015; The Telegraph, 2010; Turville, 2014; Audit Bureau of
Circulations (Singapore), 2015
NVivo software, a qualitative research tool, aided in coding and analyzing media frames.
It helped count the number of references to each frame in all of the articles as well as the number
of articles that employed each frame. Using this platform, I studied changes in frame usage over
time, compared the 2000-2001 outbreak to the 2014-2015 outbreak, and compared coverage
among media outlets.
17
Content analysis of news articles from the 2000-2001 and 2014 outbreaks identified
recurring themes and frames as well as assessed their prevalence and differences between
outbreaks and media outlets. I used deductive content analysis: I analyzed articles and coded
them for pre-designated themes found in past literature of media coverage of international health
crises. Even articles with a brief mention of Ebola in business, world briefs, and book review
sections were included for analysis. This allowed for a comprehensive viewing of readers’ total
exposure to the topic of Ebola and avoided the possibility of cherry-picking articles with the
most vivid descriptions. Each article was coded based on six frames: mutation-contagion,
“othering” / containment, globalization human interest, economics, and attribution of
responsibility. The subsequent sections discuss these frames in detail and provide examples from
previous literature.
Mutation-Contagion Frame
The mutation-contagion frame, used by Ungar in his study of 1995 Ebola media
coverage, coded language and information used to render frightful accounts of Ebola (Ungar,
1998). Articles depicting the Ebola virus as being on a rampage, as cleverer than biomedicine,
and as knowing no boundaries were coded as mutation-contagion. The mutation-contagion frame
was coded using three metaphorical sub-frames: war, plague, and killer, which were previously
employed in the media content analysis of SARS (Wallis & Nerlich, 2005). An example of a
militarized mutation-contagion frame came from a New York Times article from July 31, 2014:
“First recognized in March in Guinea, the Ebola outbreak has surged through porous borders to
invade neighboring countries, quickly outstripping fragile health systems and forcing health
officials to fight the battle on many fronts” (Nossiter & Grady, 2014). The imagery employed in
this excerpt painted Ebola as a growing, unmanageable war-like threat. An example of the plague
18
metaphor came from the Daily Mirror on SARS: there was no certain “freedom from this latest
modern plague” (Wallis & Nerlich, 2005). The metaphor of Ebola as a killer was similar to
media coverage of SARS, which labeled SARS as the “killer virus” or “deadly bug,” described it
as “rampant,” and used “victim” to refer to those infected.
“Othering” and Containment Frame
The “othering” and containment frame, used in previous research on the 1995 Ebola
outbreak, 2000 Ebola outbreak, SARS outbreak, and HIV/AIDS, classified victims as “others” or
foreign to allay fear (Ungar, 1998; Joffe & Haarhoff, 2002; Washer, 2004; Allan, 2002). This
frame contained the virus in the African continent by describing it as a phenomenon that only
affects others. The media emphasized how Westerners practicing isolation, quarantine, and
surveillance could control Ebola, while Africans were depicted as passive and voiceless (Washer,
2004). Using this frame, the media created a dichotomy between “us” and “them” (Allan, 2002).
Globalization frame
The globalization frame, used in media coverage research of past Ebola outbreaks,
concentrated on the spreading and globalized effects of Ebola (Joffe & Haarhoff, 2002). Press in
the past referred to globalization relating to Ebola in terms of the spread of the virus from Africa
to the outside world (Joffe & Haarhoff, 2002). This frame looked at Ebola as a worldwide
problem, rather than a localized one, and emphasized how the disease could have wide-reaching
consequences in the current age of connectedness. An example of globalization in The Daily
Telegraph from May 17, 1995 was: “An Ebola outbreak in a Stone Age family would die out
with the demise of their isolated settlement. But with tourism, air travel and trucking, it is now
possible for a putative doomsday mutant of Ebola to ripple rapidly outwards from the dead”
19
(Joffe & Haarhoff, 2002). This excerpt depicted Ebola as a global threat due to increased long-
distance travel in the modern world.
Human Interest Frame
The human interest frame, used in previously published research on SARS media
coverage, incorporated emotional or personal stories to humanize or dramatize a story
(Beaudoin, 2007; Luther & Zhou, 2005). In terms of Ebola coverage, this meant identifying
examples containing language and anecdotes that conveyed emotion, gave Ebola a “human
face,” or emphasized the effects of Ebola on everyday people (Beaudoin, 2007). An article from
The New York Times on December 14, 2014 exemplified this human interest frame. It spoke of
how Ebola has created a new generation of orphans in West Africa. “None of the other children
in the group home looked especially healthy -- twice a day their temperatures are taken to make
sure they are not coming down with Ebola. One infant was sucking on an empty box of milk,
clearly hungry. Another little boy kept shielding his eyes, even though he was sitting in the
shade. He had survived Ebola but his eyes still hurt.” The emphasis on an individual’s
experience with Ebola characterizes the human interest frame.
Economic Consequences Frame
The economic consequences frame, used in past SARS media coverage studies, focused
on articles that concentrated on the financial and economic implications of Ebola (Beaudoin,
2007; Luther & Zhou, 2005). This frame helps to demonstrate how the media transformed the
Ebola issue from one of just a medical condition inflicted by a virus to one that affected various
parts of society, including financial and economic conditions. An example came from the BBC
20
from August 20, 2014: “‘The economy has been deflated by 30% because of Ebola,’ Sierra
Leone's Agriculture Minister Joseph Sam Sesay told the BBC” (Hamilton, 2014).
Attribution of Responsibility Frame
The attribution of responsibility frame, used in SARS media coverage research, related to
how the media tie blame and responsibility to the spread of Ebola (Beaudoin, 2007; Luther &
Zhou, 2005). It is important to analyze this theme because it illustrates whether the media
portrayed Ebola as something in people’s control, and thus able to single out a person, policy, or
group to blame, or out of any person or institution’s control. An example of attribution of
responsibility in The New York Times from December 30, 2014 was: “Some in the W.H.O. along
with Guinean officials played down the threat, leading to overconfidence and inattention” (Sack,
Fink, Belluck, & Nossiter, 2014). This quotation showed how the inaccurate threat assessment
by public health experts harmed the institutional reaction to Ebola, and thus laid blame on these
experts.
Phrase-to-Frame Coding and Analysis
To use NVivo to code for the six media frames, it was necessary to first determine which
words and phrases designated a particular frame. I read numerous randomly selected articles to
assign particular words and phrases to each media frame. These articles included a quarterly
sample from each news outlet for both the 2000-2001 and 2014 outbreaks; for example, there
were articles from BBC Monitoring, The New York Times, The Daily Telegraph and The Straits
Times for the first quarter following the initial confirmation of Ebola in 2000 (from October 15,
2000 to January 15, 2000), and for every quarter thereafter. Appendix 4 contains a full listing of
21
the words and phrases used in assigning each frame. These selected words and phrases were
mutually exclusive to each frame.
After this phrase-to-frame assignment, I used an automatic search function in NVivo to
find occurrences of keywords and assign them to their related frame. A manual reading of all
coded articles to check for computer errors was also necessary. Any automatic coding that
selected words used outside the context of the intended frame was “uncoded”. The criteria used
to warrant “uncoding” of automatically selected phrases were the following: words directly
related to another topic discussed in the article; words used as part of a proper noun or title (e.g..
“Centers for Disease Control and Prevention”); words used in the descriptor of an individual’s
title (e.g., “investment strategist”); or words appearing in graphic captions, news desk section
titles (e.g., “foreign desk”), or byline descriptors. Additionally, duplicate articles and those where
Ebola only appeared in the byline descriptor or graphic caption were discarded.
Once all articles were coded and checked in NVivo, the software supplied the raw data in
terms of the number of appearances of each frame, the number of articles containing each frame,
and the percentage of each article dedicated to each frame. These data allowed a comparison of
media frames, the 2000-2001 and 2014 outbreaks, and media outlets as well as identified trends
over time. R Studio, a statistical software package, and Microsoft Excel aided in cleaning up the
data and conducting this analysis.
To understand the relationships between media coverage of the two outbreaks, media
outlets, frames, and search terms, Excel helped to calculate the prevalence of frames and percent
of articles including various frames. Using R studio enabled me to calculate the internal
reliability of the phrase-to-frame constructs by testing the average correlation of all phrases
pertaining to their parent frame. Cronbach’s alpha was used for this calculation. R studio also
22
helped me determine whether differences in media frame usage between the 2000 and 2014
outbreaks were significant by calculating p-values with chi-square analysis.
Results
The content analysis of media coverage of Ebola outbreaks revealed differences in how
journalists framed the disease in 2000-2001 versus 2014-2015, as well as differences between
media outlets. This section will discuss the findings from this analysis, as well as provide the
basis for further discussion. It will begin by analyzing the sample of news coverage, and then
move through how keywords used by the media shaped the framing of articles.
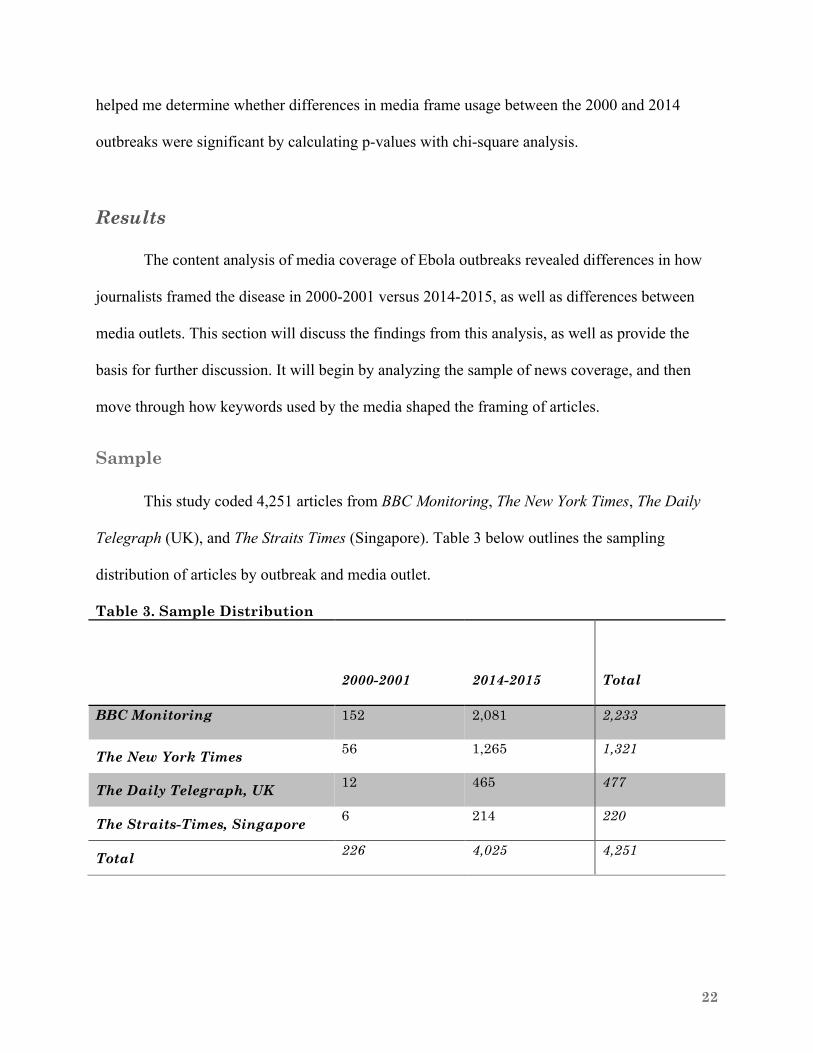
Sample
This study coded 4,251 articles from BBC Monitoring, The New York Times, The Daily
Telegraph (UK), and The Straits Times (Singapore). Table 3 below outlines the sampling
distribution of articles by outbreak and media outlet.
Table 3. Sample Distribution
2000-2001
2014-2015
Total
BBC Monitoring
152 2,081 2,233
The New York Times 56 1,265 1,321
The Daily Telegraph, UK 12 465 477
The Straits-Times, Singapore 6 214 220
Total 226 4,025 4,251
23
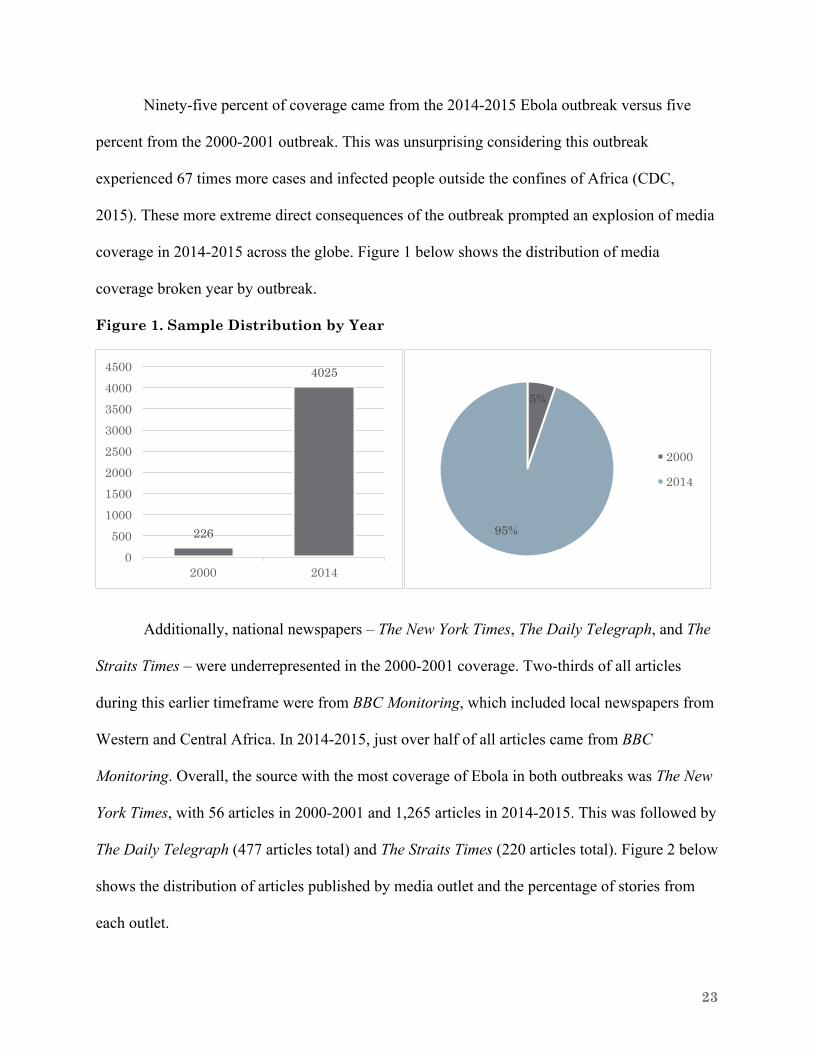
Ninety-five percent of coverage came from the 2014-2015 Ebola outbreak versus five
percent from the 2000-2001 outbreak. This was unsurprising considering this outbreak
experienced 67 times more cases and infected people outside the confines of Africa (CDC,
2015). These more extreme direct consequences of the outbreak prompted an explosion of media
coverage in 2014-2015 across the globe. Figure 1 below shows the distribution of media
coverage broken year by outbreak.
Figure 1. Sample Distribution by Year
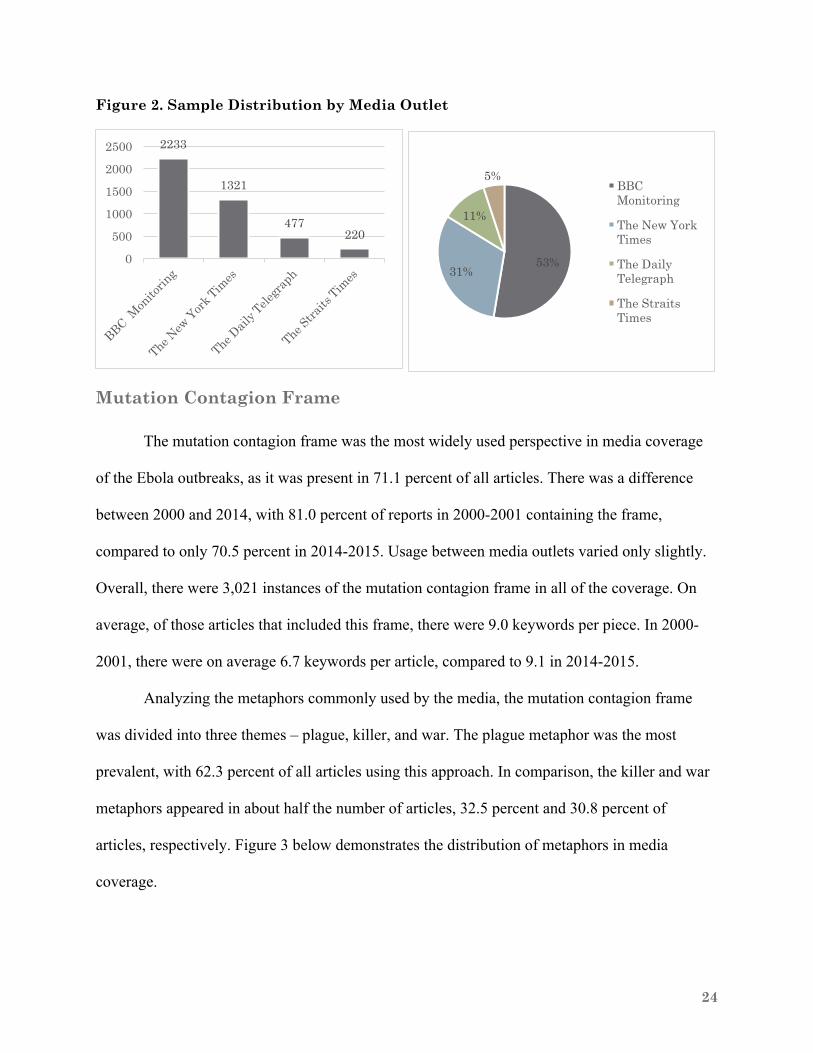
Additionally, national newspapers – The New York Times, The Daily Telegraph, and The
Straits Times – were underrepresented in the 2000-2001 coverage. Two-thirds of all articles
during this earlier timeframe were from BBC Monitoring, which included local newspapers from
Western and Central Africa. In 2014-2015, just over half of all articles came from BBC
Monitoring. Overall, the source with the most coverage of Ebola in both outbreaks was The New
York Times, with 56 articles in 2000-2001 and 1,265 articles in 2014-2015. This was followed by
The Daily Telegraph (477 articles total) and The Straits Times (220 articles total). Figure 2 below
shows the distribution of articles published by media outlet and the percentage of stories from
each outlet.
226
4025
0500
10001500200025003000350040004500
2000 2014
5%
95%
2000
2014
24
Figure 2. Sample Distribution by Media Outlet
Mutation Contagion Frame
The mutation contagion frame was the most widely used perspective in media coverage
of the Ebola outbreaks, as it was present in 71.1 percent of all articles. There was a difference
between 2000 and 2014, with 81.0 percent of reports in 2000-2001 containing the frame,
compared to only 70.5 percent in 2014-2015. Usage between media outlets varied only slightly.
Overall, there were 3,021 instances of the mutation contagion frame in all of the coverage. On
average, of those articles that included this frame, there were 9.0 keywords per piece. In 2000-
2001, there were on average 6.7 keywords per article, compared to 9.1 in 2014-2015.
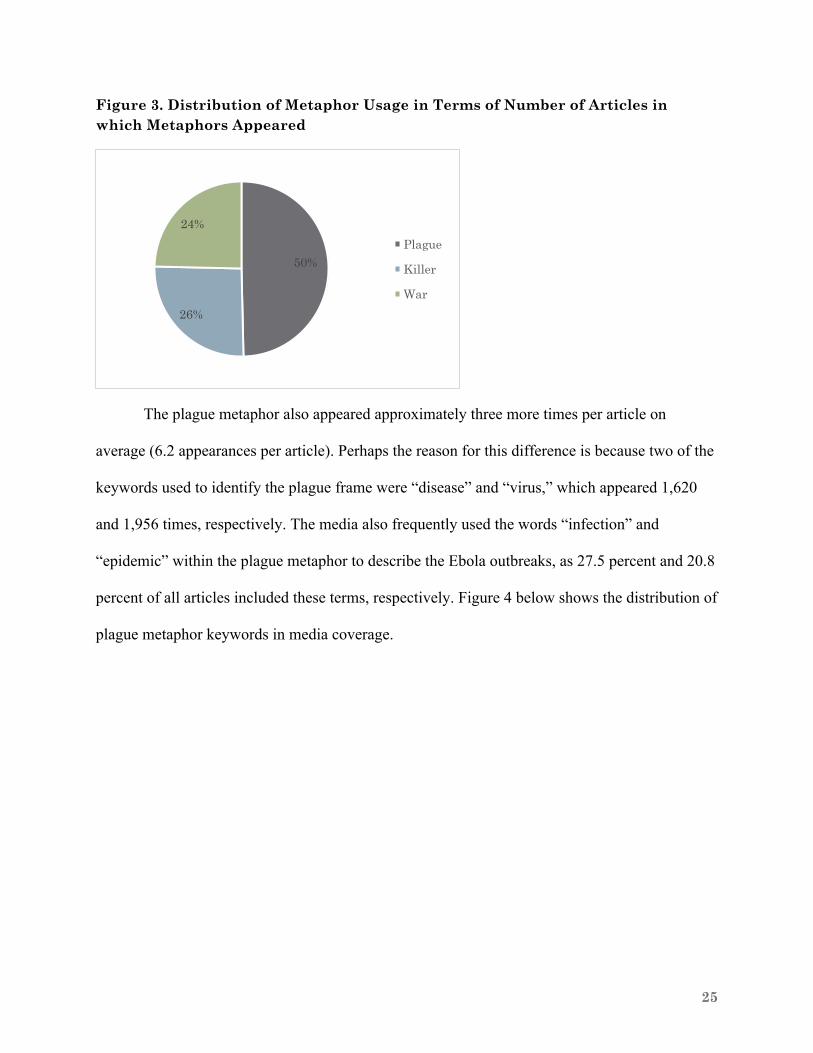
Analyzing the metaphors commonly used by the media, the mutation contagion frame
was divided into three themes – plague, killer, and war. The plague metaphor was the most
prevalent, with 62.3 percent of all articles using this approach. In comparison, the killer and war
metaphors appeared in about half the number of articles, 32.5 percent and 30.8 percent of
articles, respectively. Figure 3 below demonstrates the distribution of metaphors in media
coverage.
2233
1321
477220
0
500
1000
1500
2000
2500
53%31%
11%
5%BBC Monitoring
The New York Times
The Daily Telegraph
The Straits Times
25
Figure 3. Distribution of Metaphor Usage in Terms of Number of Articles in which Metaphors Appeared
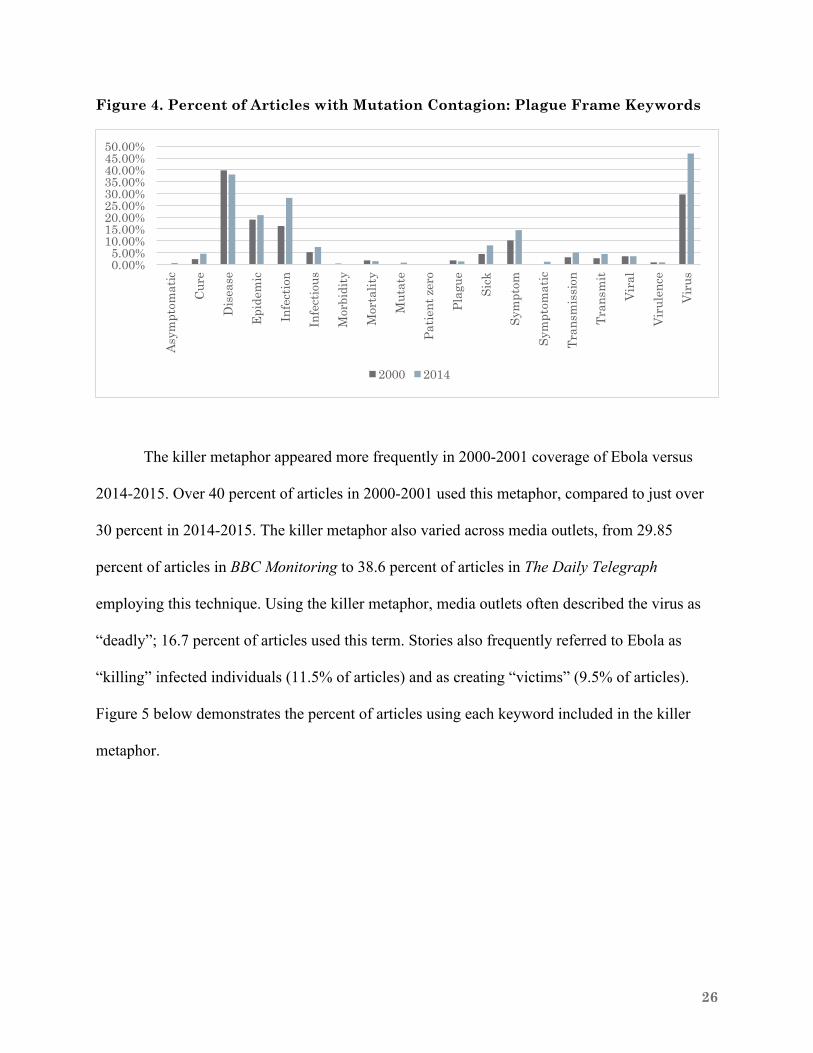
The plague metaphor also appeared approximately three more times per article on
average (6.2 appearances per article). Perhaps the reason for this difference is because two of the
keywords used to identify the plague frame were “disease” and “virus,” which appeared 1,620
and 1,956 times, respectively. The media also frequently used the words “infection” and
“epidemic” within the plague metaphor to describe the Ebola outbreaks, as 27.5 percent and 20.8
percent of all articles included these terms, respectively. Figure 4 below shows the distribution of
plague metaphor keywords in media coverage.
50%
26%
24%Plague
Killer
War
26
Figure 4. Percent of Articles with Mutation Contagion: Plague Frame Keywords
The killer metaphor appeared more frequently in 2000-2001 coverage of Ebola versus
2014-2015. Over 40 percent of articles in 2000-2001 used this metaphor, compared to just over
30 percent in 2014-2015. The killer metaphor also varied across media outlets, from 29.85
percent of articles in BBC Monitoring to 38.6 percent of articles in The Daily Telegraph
employing this technique. Using the killer metaphor, media outlets often described the virus as
“deadly”; 16.7 percent of articles used this term. Stories also frequently referred to Ebola as
“killing” infected individuals (11.5% of articles) and as creating “victims” (9.5% of articles).
Figure 5 below demonstrates the percent of articles using each keyword included in the killer
metaphor.
0.00%5.00%
10.00%15.00%20.00%25.00%30.00%35.00%40.00%45.00%50.00%
Asym
ptom
atic
Cure
Dis
ease
Epid
emic
Infe
ctio
n
Infe
ctio
us
Mor
bidi
ty
Mor
talit
y
Mut
ate
Patie
nt ze
ro
Plag
ue
Sick
Sym
ptom
Sym
ptom
atic
Tran
smis
sion
Tran
smit
Vira
l
Viru
lenc
e
Viru
s
2000 2014
27
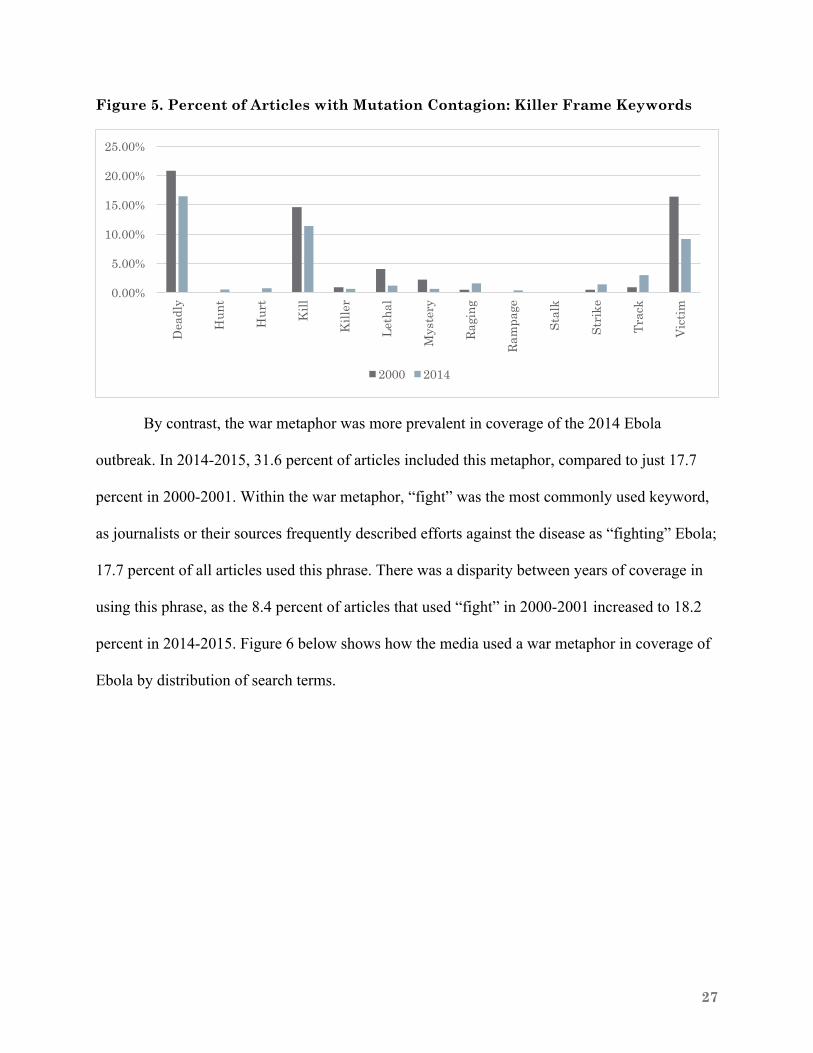
Figure 5. Percent of Articles with Mutation Contagion: Killer Frame Keywords
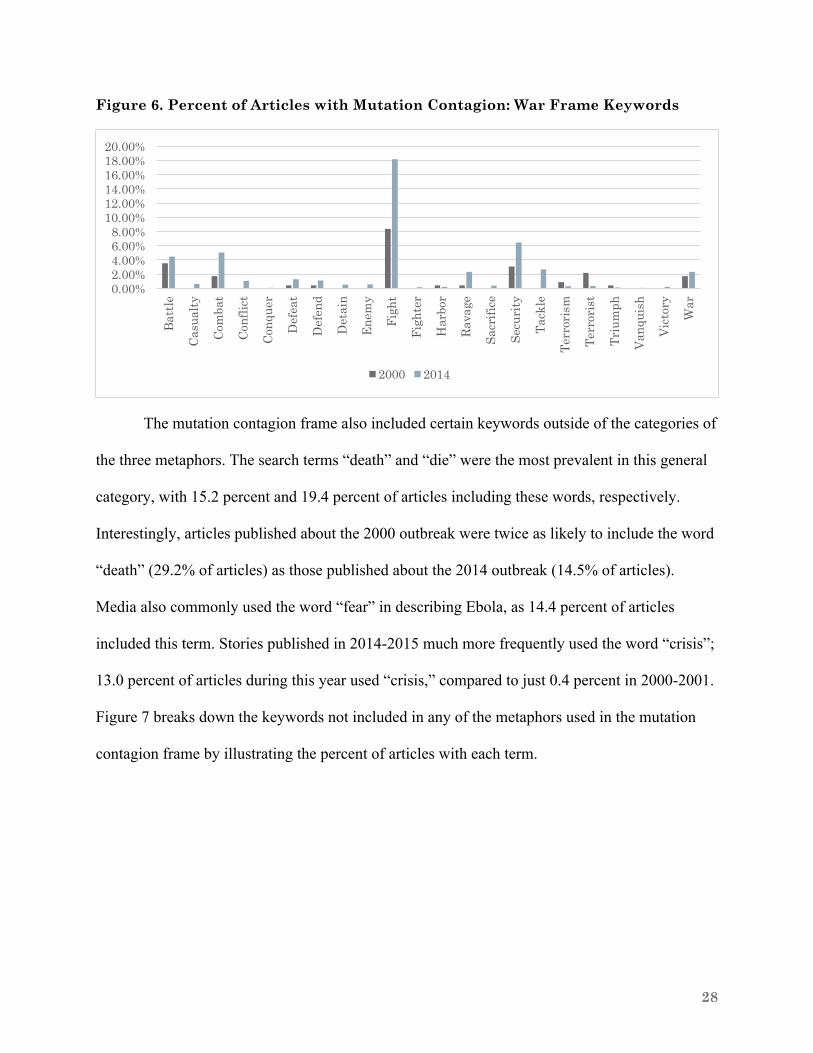
By contrast, the war metaphor was more prevalent in coverage of the 2014 Ebola
outbreak. In 2014-2015, 31.6 percent of articles included this metaphor, compared to just 17.7
percent in 2000-2001. Within the war metaphor, “fight” was the most commonly used keyword,
as journalists or their sources frequently described efforts against the disease as “fighting” Ebola;
17.7 percent of all articles used this phrase. There was a disparity between years of coverage in
using this phrase, as the 8.4 percent of articles that used “fight” in 2000-2001 increased to 18.2
percent in 2014-2015. Figure 6 below shows how the media used a war metaphor in coverage of
Ebola by distribution of search terms.
0.00%
5.00%
10.00%
15.00%
20.00%
25.00%
Dea
dly
Hun
t
Hur
t
Kill
Kill
er
Leth
al
Mys
tery
Ragi
ng
Ram
page
Stal
k
Stri
ke
Trac
k
Vict
im
2000 2014
28
Figure 6. Percent of Articles with Mutation Contagion: War Frame Keywords
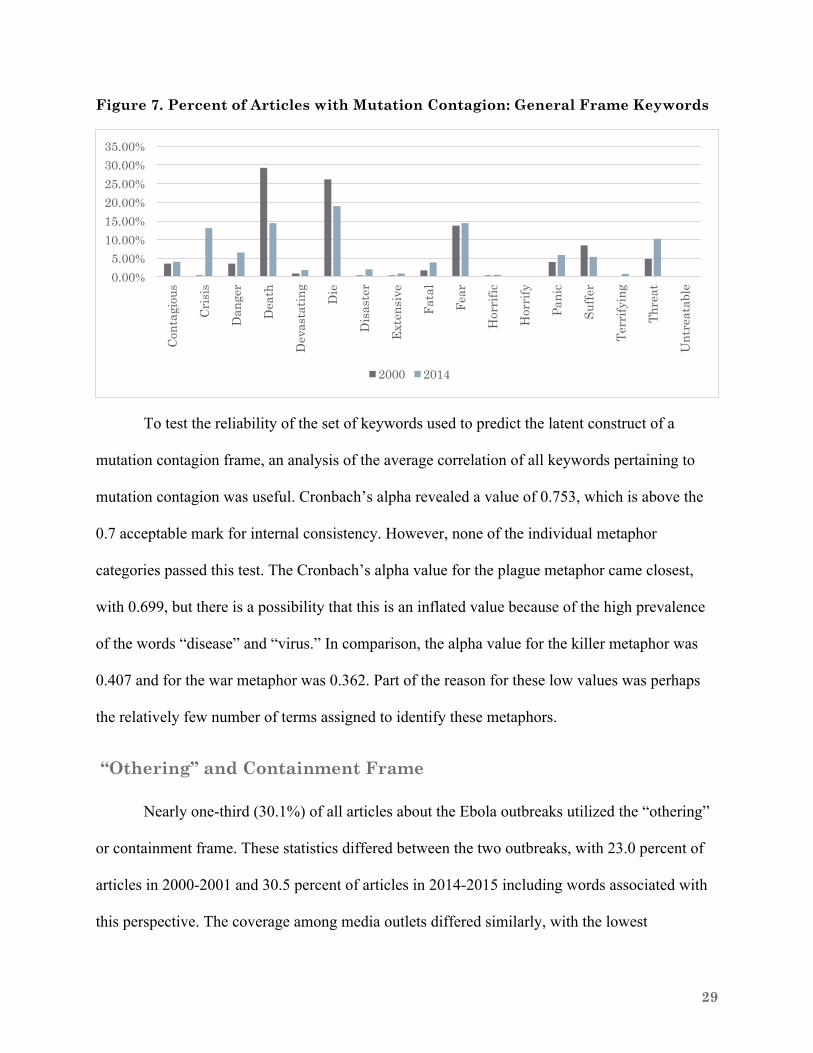
The mutation contagion frame also included certain keywords outside of the categories of
the three metaphors. The search terms “death” and “die” were the most prevalent in this general
category, with 15.2 percent and 19.4 percent of articles including these words, respectively.
Interestingly, articles published about the 2000 outbreak were twice as likely to include the word
“death” (29.2% of articles) as those published about the 2014 outbreak (14.5% of articles).
Media also commonly used the word “fear” in describing Ebola, as 14.4 percent of articles
included this term. Stories published in 2014-2015 much more frequently used the word “crisis”;
13.0 percent of articles during this year used “crisis,” compared to just 0.4 percent in 2000-2001.
Figure 7 breaks down the keywords not included in any of the metaphors used in the mutation
contagion frame by illustrating the percent of articles with each term.
0.00%2.00%4.00%6.00%8.00%
10.00%12.00%14.00%16.00%18.00%20.00%
Batt
le
Casu
alty
Com
bat
Conf
lict
Conq
uer
Def
eat
Def
end
Det
ain
Enem
y
Figh
t
Figh
ter
Har
bor
Rava
ge
Sacr
ifice
Secu
rity
Tack
le
Terr
oris
m
Terr
oris
t
Triu
mph
Vanq
uish
Vict
ory
War
2000 2014
29
Figure 7. Percent of Articles with Mutation Contagion: General Frame Keywords
To test the reliability of the set of keywords used to predict the latent construct of a
mutation contagion frame, an analysis of the average correlation of all keywords pertaining to
mutation contagion was useful. Cronbach’s alpha revealed a value of 0.753, which is above the
0.7 acceptable mark for internal consistency. However, none of the individual metaphor
categories passed this test. The Cronbach’s alpha value for the plague metaphor came closest,
with 0.699, but there is a possibility that this is an inflated value because of the high prevalence
of the words “disease” and “virus.” In comparison, the alpha value for the killer metaphor was
0.407 and for the war metaphor was 0.362. Part of the reason for these low values was perhaps
the relatively few number of terms assigned to identify these metaphors.
“Othering” and Containment Frame
Nearly one-third (30.1%) of all articles about the Ebola outbreaks utilized the “othering”
or containment frame. These statistics differed between the two outbreaks, with 23.0 percent of
articles in 2000-2001 and 30.5 percent of articles in 2014-2015 including words associated with
this perspective. The coverage among media outlets differed similarly, with the lowest
0.00%5.00%
10.00%15.00%20.00%25.00%30.00%35.00%
Cont
agio
us
Cris
is
Dan
ger
Dea
th
Dev
asta
ting
Die
Dis
aste
r
Exte
nsiv
e
Fata
l
Fear
Hor
rific
Hor
rify
Pani
c
Suffe
r
Terr
ifyin
g
Thre
at
Unt
reat
able
2000 2014
30
percentage of articles coming from The Daily Telegraph (24.7%) and the highest percent from
The New York Times (33.3%). Altogether, this frame was used 4,261 times throughout the media
coverage. On average, those articles portraying this interpretation used 3.2 keywords associated
with “othering” or containment. Notably, The New York Times had 3.9 keywords per article on
average, while all of the others had around 2.8 keywords.
As anticipated, the media employed this “othering” frame to describe the disease, and the
problems it caused, as inherently contained to Africa. Interfax News Agency in Russia,
distributed by BBC Monitoring, epitomized this notion of terming Ebola as “African” in a report
published October 9, 2014: “’The spread and establishment of this infection in Russia is not
possible. The spread of the Ebola virus is not possible anywhere except in tropical Africa. That's
obvious.” This showed how the Russian Health Ministry attempted to downplay the epidemic
and portray it as under control.
However, media outlets also used the “othering” frame to distance Ebola patients from
the greater population. Frequently media spoke about quarantine policies and controlling the
virus. For example, on October 23, 2014 The New York Times published an article about North
Korea’s attempt to separate itself from the rest of the Ebola-stricken world and disallow
foreigners from entering the country: “Fearful that Ebola could find a foothold in North Korea,
officials in the reclusive country have abruptly shut down its small and tightly-controlled tourism
industry… There was no word on how long Pyongyang intends to quarantine itself from the
world.” The North Korean response highlighted in Western media represented how the issue of
quarantine and disease control became global.
“Othering” and containment keywords varied from a prevalence of 0.2 percent of articles
for “alien” to 12.9 percent of articles for “control.” Media coverage of the 2014 outbreak had
31
nearly twice as many articles with “control”, as well as more “African,” “contain,” “foreign,”
“isolate,” and “quarantine.” The disparity between the media coverage of the two outbreaks and
usage of “quarantine” was especially notable, as it only appeared in 1.8 percent of reports in
2000-2001 compared to 8.7 percent of reports in 2014-2015. Interestingly, the opposite was true
of the word “surveillance.” Articles in 2000-2001 were nearly twice as likely to use the word
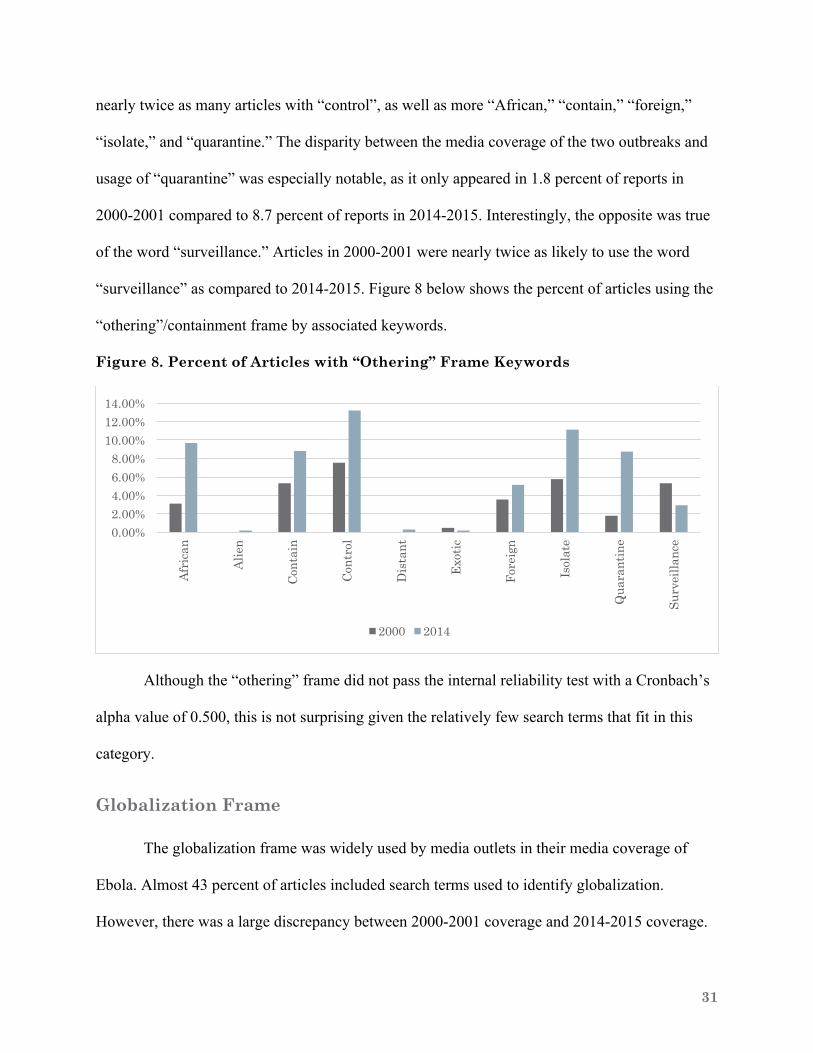
“surveillance” as compared to 2014-2015. Figure 8 below shows the percent of articles using the
“othering”/containment frame by associated keywords.
Figure 8. Percent of Articles with “Othering” Frame Keywords
Although the “othering” frame did not pass the internal reliability test with a Cronbach’s
alpha value of 0.500, this is not surprising given the relatively few search terms that fit in this
category.
Globalization Frame
The globalization frame was widely used by media outlets in their media coverage of
Ebola. Almost 43 percent of articles included search terms used to identify globalization.
However, there was a large discrepancy between 2000-2001 coverage and 2014-2015 coverage.
0.00%2.00%4.00%6.00%8.00%
10.00%12.00%14.00%
Afri
can
Alie
n
Cont
ain
Cont
rol
Dis
tant
Exot
ic
Fore
ign
Isol
ate
Qua
rant
ine
Surv
eilla
nce
2000 2014
32
Articles reporting on the latter outbreak were nearly twice as likely to utilize a globalized
perspective in their writing. In 2014-2015, 44.0 percent of articles included a globalization
keyword, but in 2000-2001, only 23.0 percent of articles included such words. Media outlets
were split in terms of the amount of coverage, with The Straits Times and The Daily Telegraph
having 47 percent of articles with a globalization frame, and BBC Monitoring and The New York
Times having 42 percent of articles with the frame. Overall, there were 9,782 instances of
globalization search terms. Out of those reports that included this worldwide spreading theme, on
average each article had 5.0 key words.
The media often portrayed Ebola as a growing global threat, and frequently spoke of
increased efforts to screen travelers at border checkpoints for the disease. For example, even
BBC Monitoring’s October 12, 2014 report from Russian National Television addressed the
possibility of the transmission of Ebola to foreign countries: “The Ebola outbreak has presented
the world with an ‘unusual situation’ in which ‘globalization has opened the door’ to the spread
of a virus. Whether we want it or not Ebola will reach Russia, scientists in Boston have said, but
Rospotrebnadzor head Anna Popova casts doubt on the prediction.” Thus the impending
worldwide threat of Ebola made it into newspapers across the globe.
The search terms used to identify the globalization frame differed in their prevalence
from “tourist” in 0.3 percent of articles to “spread” in 24.7 percent. As the word in the most
reports, “spread” was found in 29 articles in 2000-2001 and 1,022 in 2014-2015. This pointed to
a substantive difference in coverage between the two outbreaks. Journalists in 2014-2015 were
twice as likely to include “spread” in their work. Additionally, seven times more articles
included “global,” five times more articles included “flight,” three times more articles included
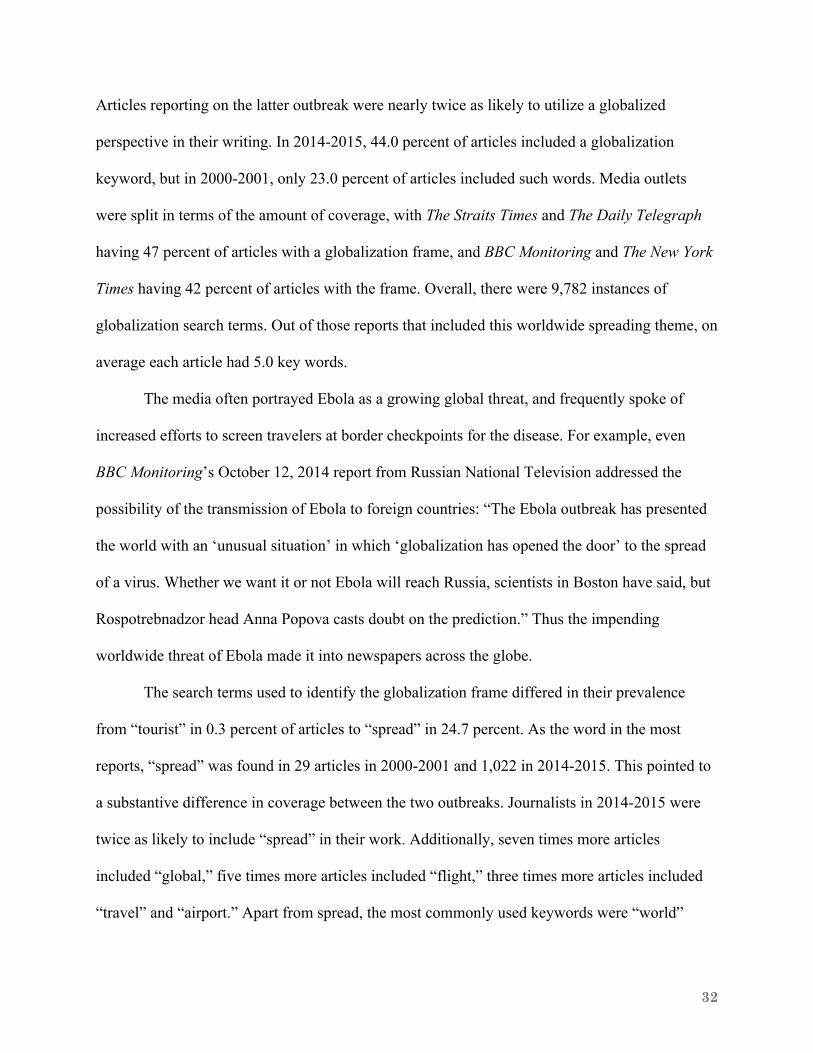
“travel” and “airport.” Apart from spread, the most commonly used keywords were “world”
33
(13.9% of articles) and “travel” (13.6% of articles). Figure 9 below illustrates the fraction of
articles that include keywords connected to the globalization frame.
Figure 9. Percent of Articles with Globalization Frame Keywords
The globalization frame’s search terms passed the internal reliability test, and thus were
sufficiently correlated to point towards the same “globalization” construct. The Cronbach’s alpha
value was 0.706, which is above the widely used 0.7 cutoff.
Human Interest Frame
Of all articles, 42.3 percent included a keyword from the human interest frame. This high
prevalence was not surprising considering the words included “doctor,” “family,” and “patient.”
A slightly higher percentage of stories (42.4%) from 2014-2015 included this perspective
compared to stories from 2000-2001 (38.9%). Media outlets varied in their use of the human
interest from 35.9 percent of articles in The Straits Times to 51.7 percent in The New York Times.
Overall, keywords appeared in media coverage of both outbreaks 9,042 times. On average, each
article that used the frame included 5.0 search terms.
0.00%
5.00%
10.00%
15.00%
20.00%
25.00%
30.00%
Airp
lane
Airp
ort
Bord
er
Bus
Entr
y
Flig
ht
Glo
bal
Glo
be
Pass
enge
r
Port
Scre
en
Ship
Spre
ad
Tour
ism
Tour
ist
Tour
ists
Trad
e
Trav
el
Visa
Visi
tor
Wor
ld
2000 2014
34
The media coverage of Ebola included hundreds of touching stories of Ebola victims and
doctors’ struggles to fight the disease. Frequently stories began with an anecdote about a
personal narrative of one individual, but other times entire articles were dedicated to these
human interest topics. One example was published by The Daily Telegraph on January 10, 2015
and told the story of Ebola survivors in Liberia: “Saah Blackie, 39, a father-of-two who lives in
Monrovia's rowdy Bushrod Island slum, says he too is a victim of stigmatisation. ‘If I didn't own
my house,’ he says, ‘I would have been thrown out.’ … When he contracted the disease, most of
his possessions were burnt. Among the few items he has left are a certificate from the MSF clinic
declaring him Ebola-free, and a handful of photographs taken when he was sick.” This quotation
showed how the media focused on a personal story to tell the broader narrative of Ebola.
Other human interest stories brought to life the weakened health care infrastructure. BBC
Monitoring’s September 18, 2014 piece from a Nairobi online news service spoke of how
already-full health clinics were forced to turn patients away: “’The first person I had to turn away
was a father who had brought in his sick daughter in the trunk of his car. He was an educated
man, and he pleaded [with] me to take her, saying while he knew we couldn't save her life, we
could save the rest of his family from her. At that point I had to go behind one of the tents to
cry.’” The personal stories humanized the crisis and emphasized that it was more than just
statistics.
The human interest frame’s associated keywords varied in terms of the numbers of
articles in which they appeared. Over one-quarter of the articles published included the word
“patient” with little difference between outbreak years (23.5% in 2000-2001 and 27.4% in 2014-
2015). “Nurse/nurses” and “doctor” were also relatively frequently occurring, appearing 17.5 and
16.9 percent of articles, respectively. Notably, stories in 2014-2015 were 10.6% more likely to
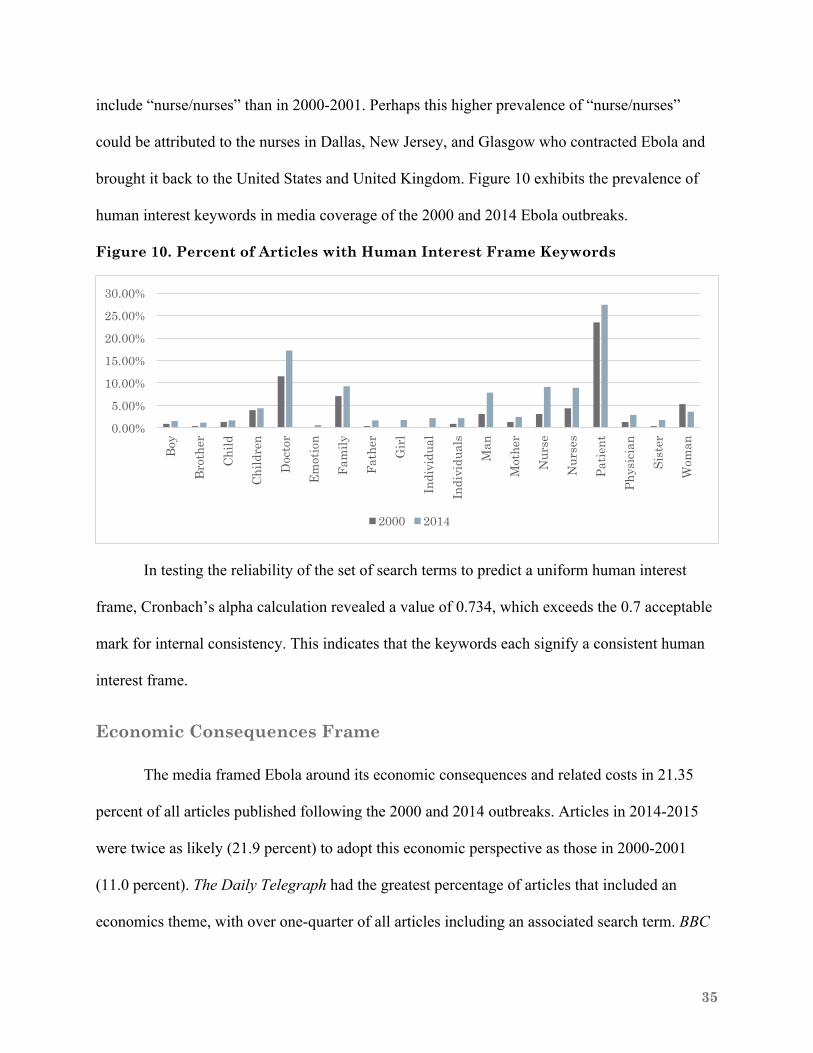
35
include “nurse/nurses” than in 2000-2001. Perhaps this higher prevalence of “nurse/nurses”
could be attributed to the nurses in Dallas, New Jersey, and Glasgow who contracted Ebola and
brought it back to the United States and United Kingdom. Figure 10 exhibits the prevalence of
human interest keywords in media coverage of the 2000 and 2014 Ebola outbreaks.
Figure 10. Percent of Articles with Human Interest Frame Keywords
In testing the reliability of the set of search terms to predict a uniform human interest
frame, Cronbach’s alpha calculation revealed a value of 0.734, which exceeds the 0.7 acceptable
mark for internal consistency. This indicates that the keywords each signify a consistent human
interest frame.
Economic Consequences Frame
The media framed Ebola around its economic consequences and related costs in 21.35
percent of all articles published following the 2000 and 2014 outbreaks. Articles in 2014-2015
were twice as likely (21.9 percent) to adopt this economic perspective as those in 2000-2001
(11.0 percent). The Daily Telegraph had the greatest percentage of articles that included an
economics theme, with over one-quarter of all articles including an associated search term. BBC
0.00%
5.00%
10.00%
15.00%
20.00%
25.00%
30.00%
Boy
Brot
her
Child
Child
ren
Doc
tor
Emot
ion
Fam
ily
Fath
er
Gir
l
Indi
vidu
al
Indi
vidu
als
Man
Mot
her
Nur
se
Nur
ses
Patie
nt
Phys
icia
n
Sist
er
Wom
an
2000 2014
36
Monitoring had the lowest percentage of articles with 19.3 percent. Overall, economics
keywords appeared almost 4,000 times in the media. In those articles that included information
about the financial status or costs related to Ebola, an economics-category keyword appeared 3.3
times on average.
The economic consequences frame often appeared in the form of assessing hospital costs
of treatment, noting international health agency and NGO donations to infected countries, and
explaining the economic consequences of Ebola for countries’ GDP and industry. A particularly
telling example of this appeared in BBC Monitoring’s September 8, 2014 article from Alwihda in
Chad, which explained how the closure of the Chad-Nigeria border affected the country’s trade
and economic situation: “Every day, prices of products are skyrocketing and vulnerable
Chadians can neither eat to their fill nor support their families. Entry of products is difficult and
life is becoming expensive to Chadians.”
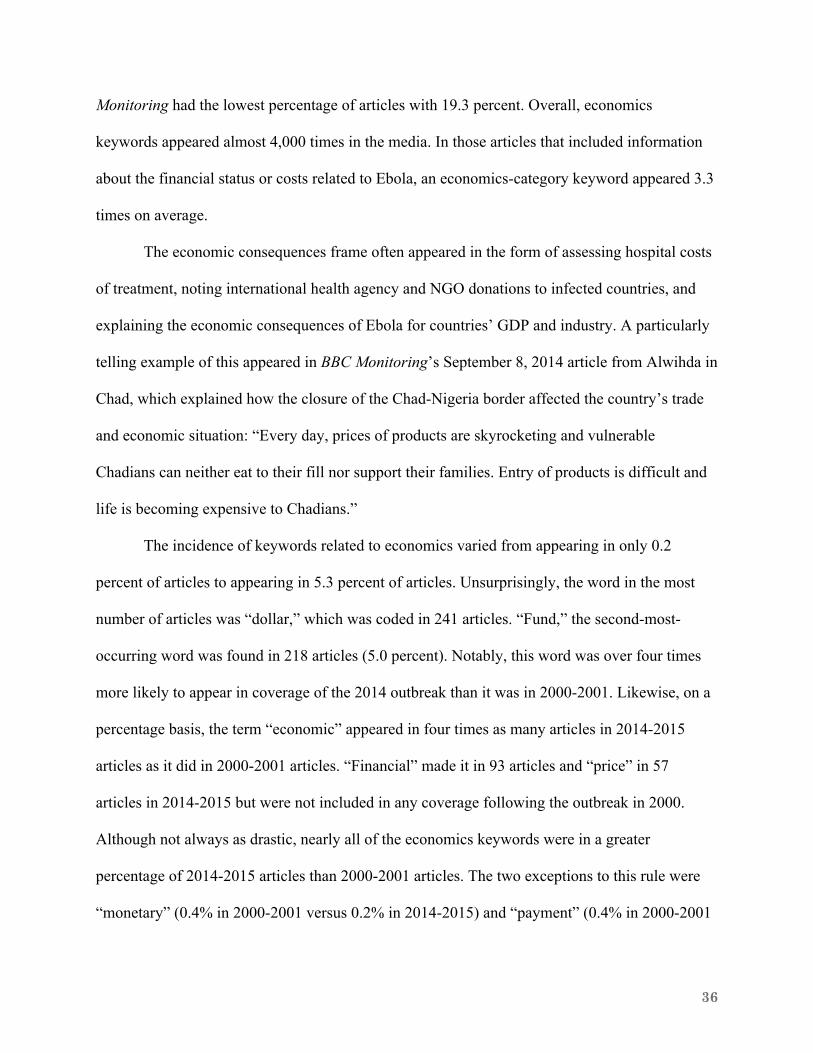
The incidence of keywords related to economics varied from appearing in only 0.2
percent of articles to appearing in 5.3 percent of articles. Unsurprisingly, the word in the most
number of articles was “dollar,” which was coded in 241 articles. “Fund,” the second-most-
occurring word was found in 218 articles (5.0 percent). Notably, this word was over four times
more likely to appear in coverage of the 2014 outbreak than it was in 2000-2001. Likewise, on a
percentage basis, the term “economic” appeared in four times as many articles in 2014-2015
articles as it did in 2000-2001 articles. “Financial” made it in 93 articles and “price” in 57
articles in 2014-2015 but were not included in any coverage following the outbreak in 2000.
Although not always as drastic, nearly all of the economics keywords were in a greater
percentage of 2014-2015 articles than 2000-2001 articles. The two exceptions to this rule were
“monetary” (0.4% in 2000-2001 versus 0.2% in 2014-2015) and “payment” (0.4% in 2000-2001
37
versus 0.2% in 2014-2015). Figure 11 below presents the coverage data associated with
economics consequences keywords.
Figure 11. Percent of Articles with Economic Consequences Frame Keywords
To test the consistency of the set of search terms used to predict the construct of an
economic consequences frame, Cronbach’s alpha calculation revealed a value of 0.697, which is
just barely under the 0.7 acceptable mark for internal consistency. This suggests that the search
terms each point to a consistent economics frame.
Attribution of Responsibility Frame
The attribution of responsibility frame was notably the least occurring frame in media
coverage of Ebola. Only 9.6 percent of articles included keywords associated with responsibility
or blame. This percentage was even smaller among articles in 2000-2001 – only 5.3 percent of
articles employed this frame. There was also some variance among media outlets in terms of
articles’ likelihood of speaking to who or what was responsible for causing and treating Ebola.
Whereas 15.8 percent of stories in the The New York Times included the responsibility frame,
only 6.2 percent of stories in BBC Monitoring included the frame. In total, there were 615
0.00%1.00%2.00%3.00%4.00%5.00%6.00%7.00%
Boug
htBu
dget
Busi
ness
Busi
ness
esBu
yCo
mm
erce
Com
mer
cial
Cost
Dol
lar
Don
atio
nEc
onom
icEc
onom
yEm
ploy
men
tEu
roFi
nanc
eFi
nanc
ial
Fisc
alFu
ndIn
dust
ryIn
vest
men
tM
arke
tM
onet
ary
Mon
ey Pay
Paym
ent
Pric
eRe
tail
2000 2014
38
instances of responsibility-related keywords. Of those articles including a keyword, the average
number of times a keyword appeared per piece was 1.5, which is the lowest average among any
of the frames. No noteworthy variation existed in this average number of appearances between
outbreaks or media outlets.
When media employed the attribution of responsibility frame, they typically used these
keywords to explain a failure in healthcare infrastructure or policy interventions. Additionally,
coverage used this perspective to attribute blame as well as to suggest who was accountable for
fixing the Ebola problem. A problem when coding for this frame was the articles’ diverse
number of phrasings used to speak about responsibility. For example, while the following
excerpt from The New York Times on January 31, 2015 was clearly about the idea of blame and
responsibility, no keyword existed: “The fear that was spread by the dramatic reports that
accentuated the negative, undermined confidence, made it harder to encourage people to seek
care, and misdirected attention away from Sierra Leone's urban areas, where data suggest the
economic effects of Ebola have been concentrated… Why were projections so bad? Partly
because it is hard to collect good data in a crisis. But also, we believe, because dramatic
headlines make for a better story.” This quotation showed how the phrase-to-frame model may
not have worked as well for this attribution of responsibility frame as it did for the other frames.
None of the search terms within the attribution of responsibility frame appeared in even 2
percent of the articles published. “Blame” was the most prevalent keyword, with occurrences in
only 80 reports – 1.9 percent of all coverage. Most of the keywords appeared in fewer than 10
articles. Figure 12 below shows the percent of articles using keywords associated with attribution
of responsibility. It is important to note the scale in this chart, as the vertical axis only reaches
2.5 percent.
39
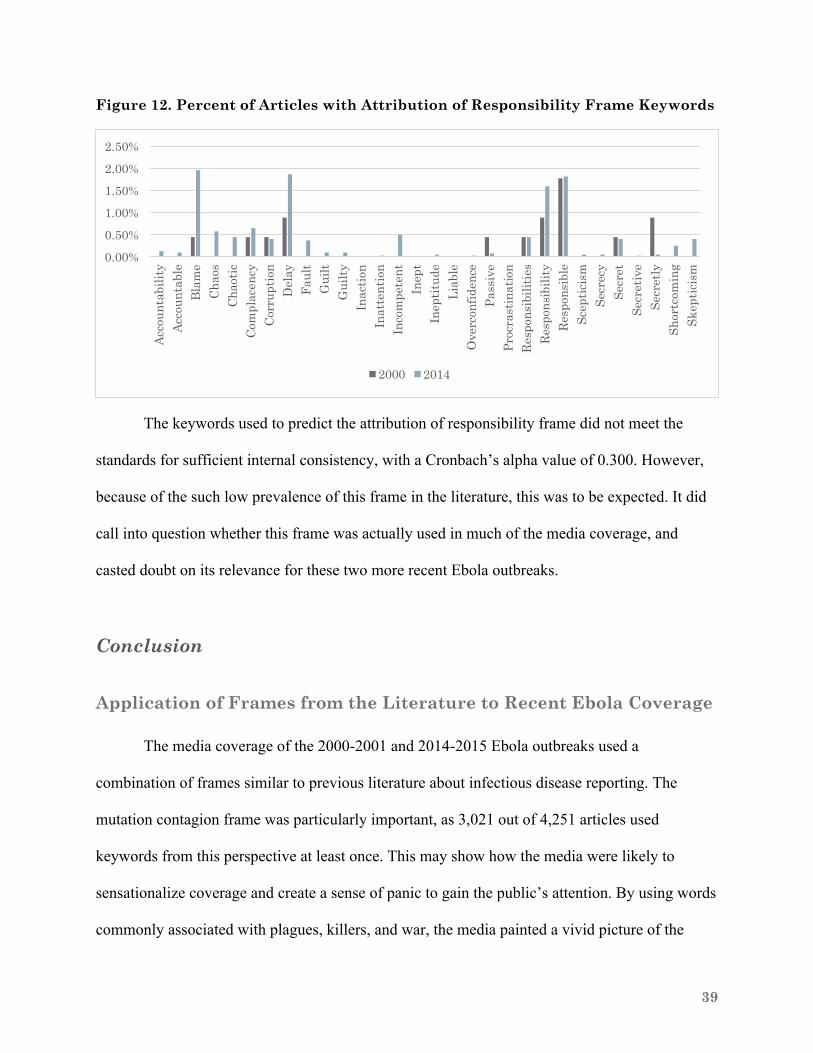
Figure 12. Percent of Articles with Attribution of Responsibility Frame Keywords
The keywords used to predict the attribution of responsibility frame did not meet the
standards for sufficient internal consistency, with a Cronbach’s alpha value of 0.300. However,
because of the such low prevalence of this frame in the literature, this was to be expected. It did
call into question whether this frame was actually used in much of the media coverage, and
casted doubt on its relevance for these two more recent Ebola outbreaks.
Conclusion
Application of Frames from the Literature to Recent Ebola Coverage
The media coverage of the 2000-2001 and 2014-2015 Ebola outbreaks used a
combination of frames similar to previous literature about infectious disease reporting. The
mutation contagion frame was particularly important, as 3,021 out of 4,251 articles used
keywords from this perspective at least once. This may show how the media were likely to
sensationalize coverage and create a sense of panic to gain the public’s attention. By using words
commonly associated with plagues, killers, and war, the media painted a vivid picture of the
0.00%0.50%1.00%1.50%2.00%2.50%
Acco
unta
bilit
yAc
coun
tabl
eBl
ame
Chao
sCh
aotic
Com
plac
ency
Corr
uptio
nD
elay
Faul
tG
uilt
Gui
ltyIn
actio
nIn
atte
ntio
nIn
com
pete
ntIn
ept
Inep
titud
eLi
able
Ove
rcon
fiden
cePa
ssiv
ePr
ocra
stin
atio
nRe
spon
sibi
litie
sRe
spon
sibi
lity
Resp
onsi
ble
Scep
ticis
mSe
crec
ySe
cret
Secr
etiv
eSe
cret
lySh
ortc
omin
gSk
eptic
ism
2000 2014
40
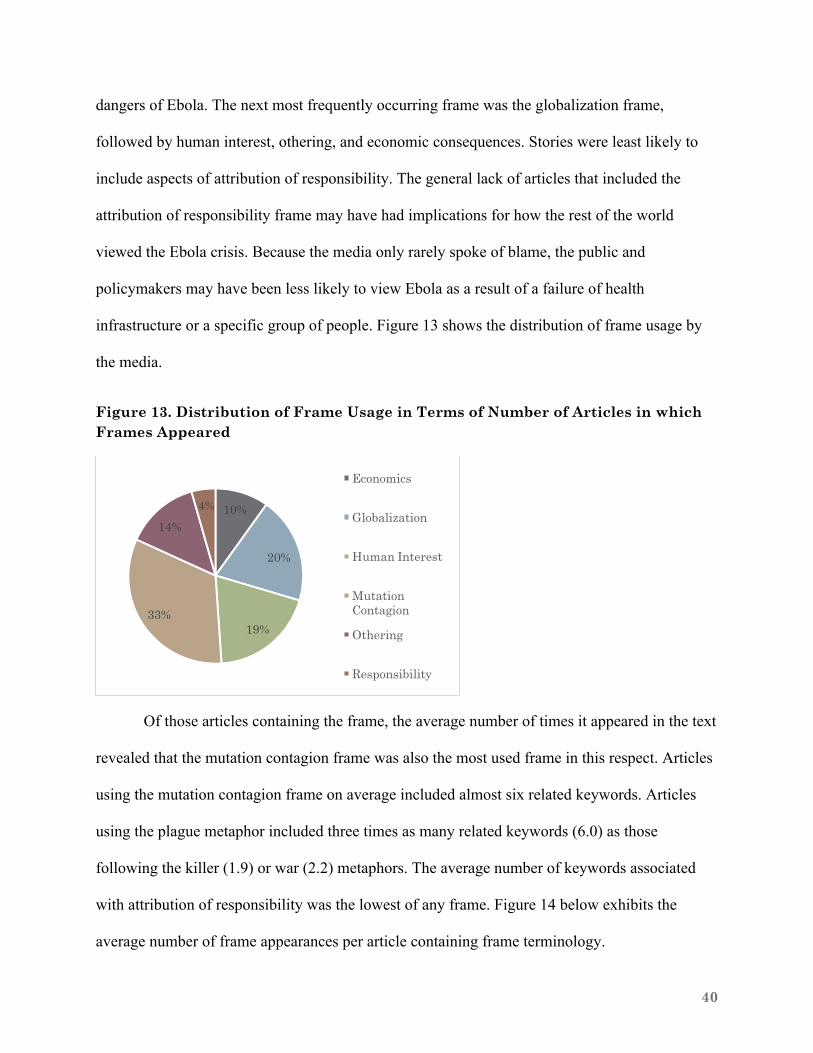
dangers of Ebola. The next most frequently occurring frame was the globalization frame,
followed by human interest, othering, and economic consequences. Stories were least likely to
include aspects of attribution of responsibility. The general lack of articles that included the
attribution of responsibility frame may have had implications for how the rest of the world
viewed the Ebola crisis. Because the media only rarely spoke of blame, the public and
policymakers may have been less likely to view Ebola as a result of a failure of health
infrastructure or a specific group of people. Figure 13 shows the distribution of frame usage by
the media.
Figure 13. Distribution of Frame Usage in Terms of Number of Articles in which Frames Appeared
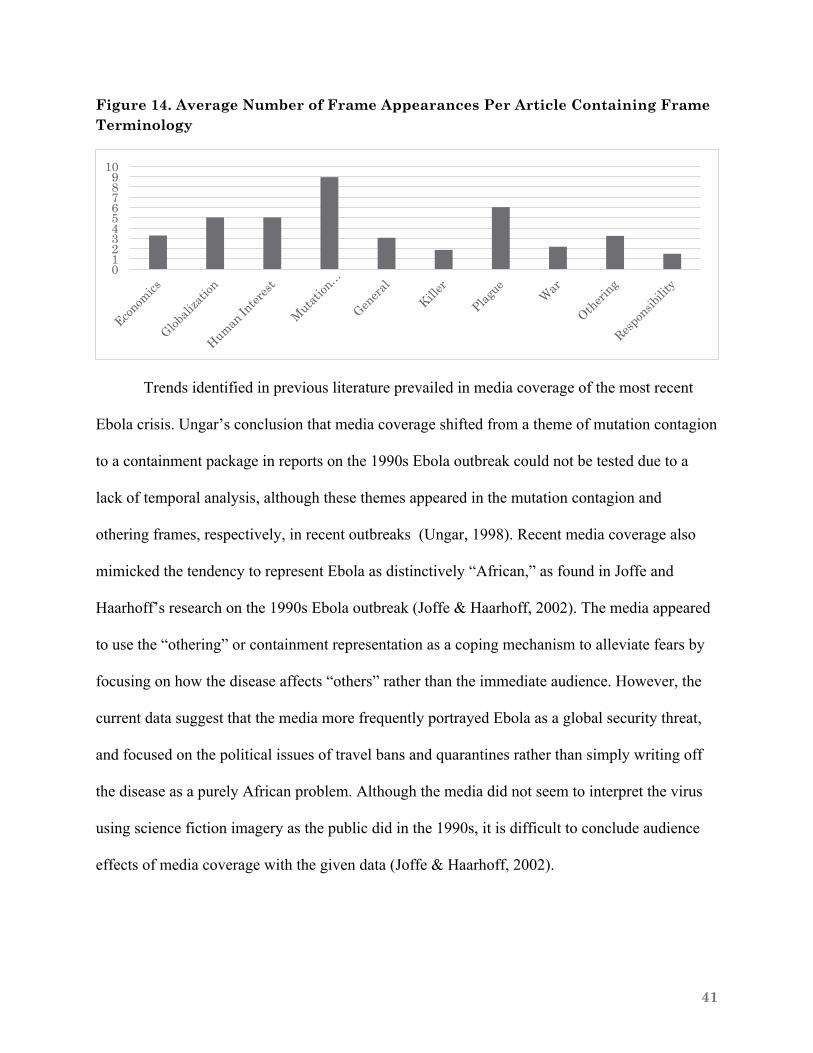
Of those articles containing the frame, the average number of times it appeared in the text
revealed that the mutation contagion frame was also the most used frame in this respect. Articles
using the mutation contagion frame on average included almost six related keywords. Articles
using the plague metaphor included three times as many related keywords (6.0) as those
following the killer (1.9) or war (2.2) metaphors. The average number of keywords associated
with attribution of responsibility was the lowest of any frame. Figure 14 below exhibits the
average number of frame appearances per article containing frame terminology.
10%
20%
19%33%
14%4%
Economics
Globalization
Human Interest
Mutation Contagion
Othering
Responsibility
41
Figure 14. Average Number of Frame Appearances Per Article Containing Frame Terminology
Trends identified in previous literature prevailed in media coverage of the most recent
Ebola crisis. Ungar’s conclusion that media coverage shifted from a theme of mutation contagion
to a containment package in reports on the 1990s Ebola outbreak could not be tested due to a
lack of temporal analysis, although these themes appeared in the mutation contagion and
othering frames, respectively, in recent outbreaks (Ungar, 1998). Recent media coverage also
mimicked the tendency to represent Ebola as distinctively “African,” as found in Joffe and
Haarhoff’s research on the 1990s Ebola outbreak (Joffe & Haarhoff, 2002). The media appeared
to use the “othering” or containment representation as a coping mechanism to alleviate fears by
focusing on how the disease affects “others” rather than the immediate audience. However, the
current data suggest that the media more frequently portrayed Ebola as a global security threat,
and focused on the political issues of travel bans and quarantines rather than simply writing off
the disease as a purely African problem. Although the media did not seem to interpret the virus
using science fiction imagery as the public did in the 1990s, it is difficult to conclude audience
effects of media coverage with the given data (Joffe & Haarhoff, 2002).
0123456789
10
42
The trend of media reporting revealing anxieties about the inability of technology and
biomedicine to contain epidemics and about the ecological and economic threats of globalization
appeared to continue with recent Ebola crises (Washer, 2004). The portrayal of Ebola as a
globalized threat was especially important in coverage of the 2014 outbreak. In the year
following the initial WHO announcement of Ebola, 44 percent of articles included a keyword
associated with globalization. Fewer articles in 2000-2001, only 23 percent, included this frame.
The frames identified in past research of SARS coverage seemed to translate to articles
about Ebola. Just as Wallis & Nerlich (2005) found that reports depicted diseases as killers,
plagues, or hostile combatants in war, keywords related to these metaphors were prevalent in
media coverage of the 2000 and 2014 Ebola outbreaks. Furthermore, media about these recent
outbreaks used frames of responsibility, human interest, and economic consequences, similar to
previous research on SARS media coverage (Beaudoin, 2007; Luther & Zhou, 2005). Therefore,
the data confirmed the hypothesis that media reports of the recent Ebola crises would mirror the
results found in previous content analyses of media coverage of infectious disease epidemics.
As hypothesized based on previous research on international health crises, media
coverage of the Ebola outbreak appeared highly politicized and event-based. Although the data
did not allow for a timeline analysis of how frames changed over time in relation to political
events, the topics of stories frequently reflected politicized events and policy decisions. For
example, the North Korean decision to close its borders to all outsiders instigated a wave of
media reports and analyses evaluating the political decision and its consequences. Media
coverage did not appear to follow a trend based on the number of people infected at any given
time, although the volume of articles in 2014-2015 greatly outnumbered those in 2000-2001
because of the greater magnitude of the epidemic.
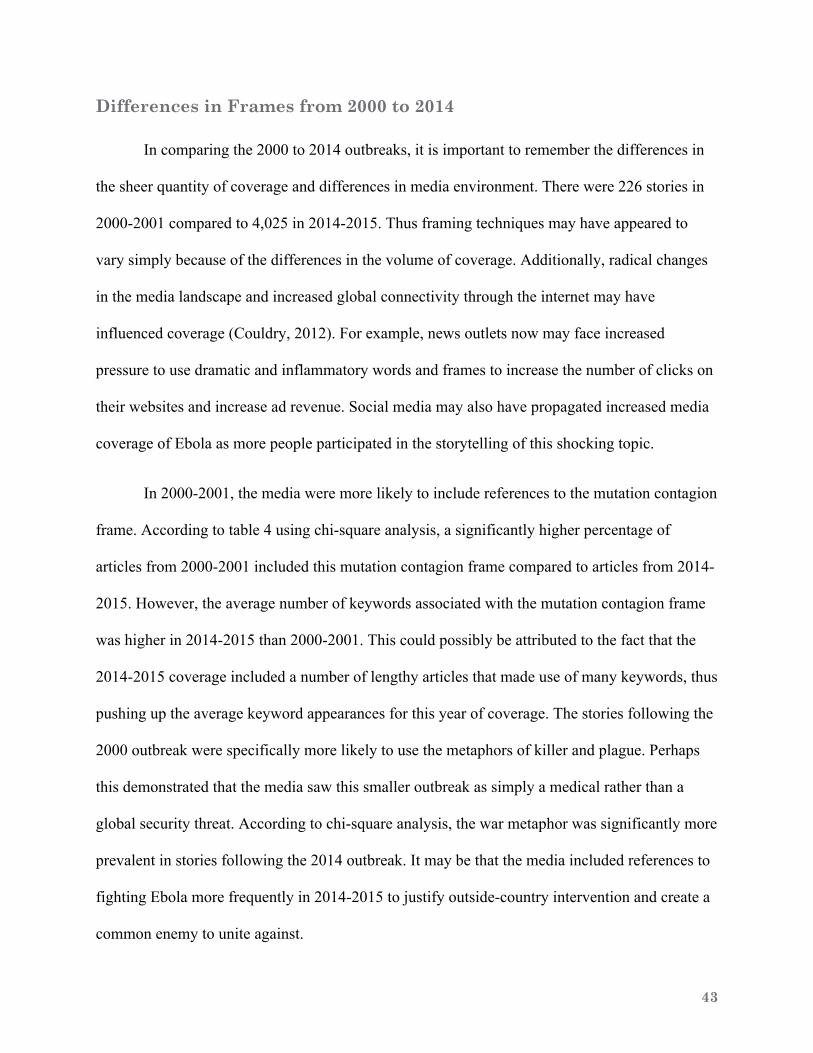
43
Differences in Frames from 2000 to 2014
In comparing the 2000 to 2014 outbreaks, it is important to remember the differences in
the sheer quantity of coverage and differences in media environment. There were 226 stories in
2000-2001 compared to 4,025 in 2014-2015. Thus framing techniques may have appeared to
vary simply because of the differences in the volume of coverage. Additionally, radical changes
in the media landscape and increased global connectivity through the internet may have
influenced coverage (Couldry, 2012). For example, news outlets now may face increased
pressure to use dramatic and inflammatory words and frames to increase the number of clicks on
their websites and increase ad revenue. Social media may also have propagated increased media
coverage of Ebola as more people participated in the storytelling of this shocking topic.
In 2000-2001, the media were more likely to include references to the mutation contagion
frame. According to table 4 using chi-square analysis, a significantly higher percentage of
articles from 2000-2001 included this mutation contagion frame compared to articles from 2014-
2015. However, the average number of keywords associated with the mutation contagion frame
was higher in 2014-2015 than 2000-2001. This could possibly be attributed to the fact that the
2014-2015 coverage included a number of lengthy articles that made use of many keywords, thus
pushing up the average keyword appearances for this year of coverage. The stories following the
2000 outbreak were specifically more likely to use the metaphors of killer and plague. Perhaps
this demonstrated that the media saw this smaller outbreak as simply a medical rather than a
global security threat. According to chi-square analysis, the war metaphor was significantly more
prevalent in stories following the 2014 outbreak. It may be that the media included references to
fighting Ebola more frequently in 2014-2015 to justify outside-country intervention and create a
common enemy to unite against.
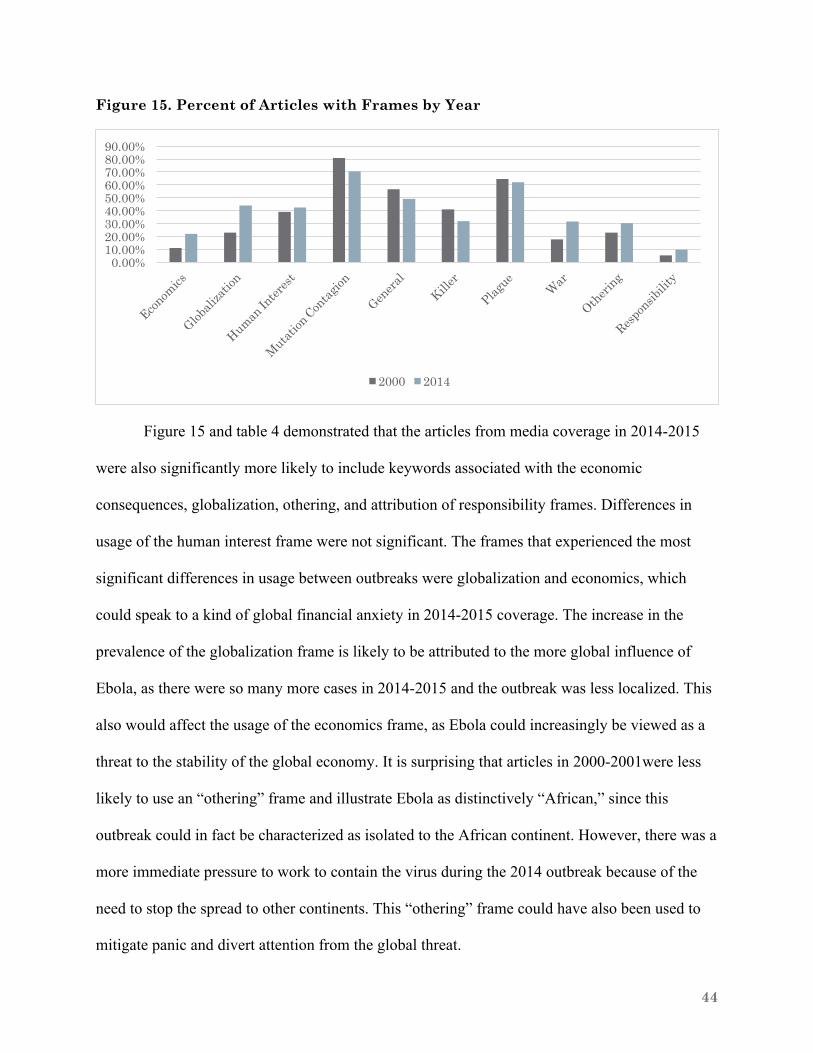
44
Figure 15. Percent of Articles with Frames by Year
Figure 15 and table 4 demonstrated that the articles from media coverage in 2014-2015
were also significantly more likely to include keywords associated with the economic
consequences, globalization, othering, and attribution of responsibility frames. Differences in
usage of the human interest frame were not significant. The frames that experienced the most
significant differences in usage between outbreaks were globalization and economics, which
could speak to a kind of global financial anxiety in 2014-2015 coverage. The increase in the
prevalence of the globalization frame is likely to be attributed to the more global influence of
Ebola, as there were so many more cases in 2014-2015 and the outbreak was less localized. This
also would affect the usage of the economics frame, as Ebola could increasingly be viewed as a
threat to the stability of the global economy. It is surprising that articles in 2000-2001were less
likely to use an “othering” frame and illustrate Ebola as distinctively “African,” since this
outbreak could in fact be characterized as isolated to the African continent. However, there was a
more immediate pressure to work to contain the virus during the 2014 outbreak because of the
need to stop the spread to other continents. This “othering” frame could have also been used to
mitigate panic and divert attention from the global threat.
0.00%10.00%20.00%30.00%40.00%50.00%60.00%70.00%80.00%90.00%
2000 2014
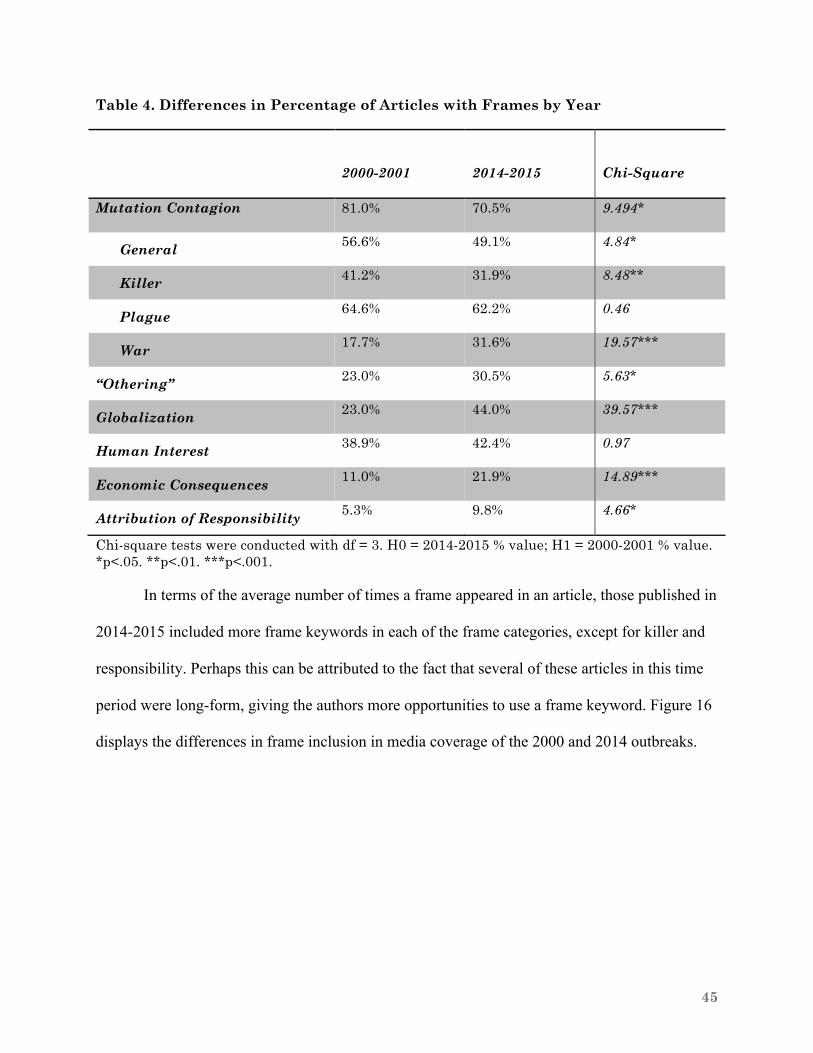
45
Table 4. Differences in Percentage of Articles with Frames by Year
2000-2001
2014-2015
Chi-Square
Mutation Contagion
81.0% 70.5% 9.494*
General 56.6% 49.1% 4.84*
Killer 41.2% 31.9% 8.48**
Plague 64.6% 62.2% 0.46
War 17.7% 31.6% 19.57***
“Othering” 23.0% 30.5% 5.63*
Globalization 23.0% 44.0% 39.57***
Human Interest 38.9% 42.4% 0.97
Economic Consequences 11.0% 21.9% 14.89***
Attribution of Responsibility 5.3% 9.8% 4.66*
Chi-square tests were conducted with df = 3. H0 = 2014-2015 % value; H1 = 2000-2001 % value. *p<.05. **p<.01. ***p<.001.
In terms of the average number of times a frame appeared in an article, those published in
2014-2015 included more frame keywords in each of the frame categories, except for killer and
responsibility. Perhaps this can be attributed to the fact that several of these articles in this time
period were long-form, giving the authors more opportunities to use a frame keyword. Figure 16
displays the differences in frame inclusion in media coverage of the 2000 and 2014 outbreaks.
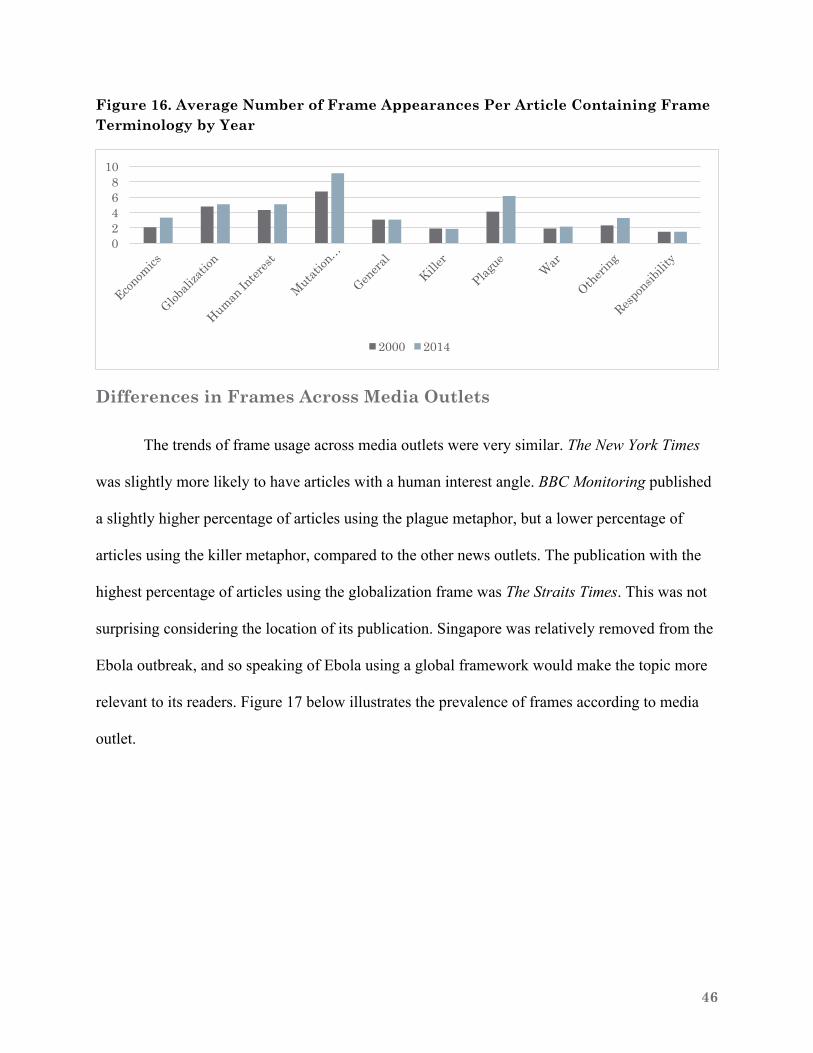
46
Figure 16. Average Number of Frame Appearances Per Article Containing Frame Terminology by Year
Differences in Frames Across Media Outlets
The trends of frame usage across media outlets were very similar. The New York Times
was slightly more likely to have articles with a human interest angle. BBC Monitoring published
a slightly higher percentage of articles using the plague metaphor, but a lower percentage of
articles using the killer metaphor, compared to the other news outlets. The publication with the
highest percentage of articles using the globalization frame was The Straits Times. This was not
surprising considering the location of its publication. Singapore was relatively removed from the
Ebola outbreak, and so speaking of Ebola using a global framework would make the topic more
relevant to its readers. Figure 17 below illustrates the prevalence of frames according to media
outlet.
02468
10
2000 2014
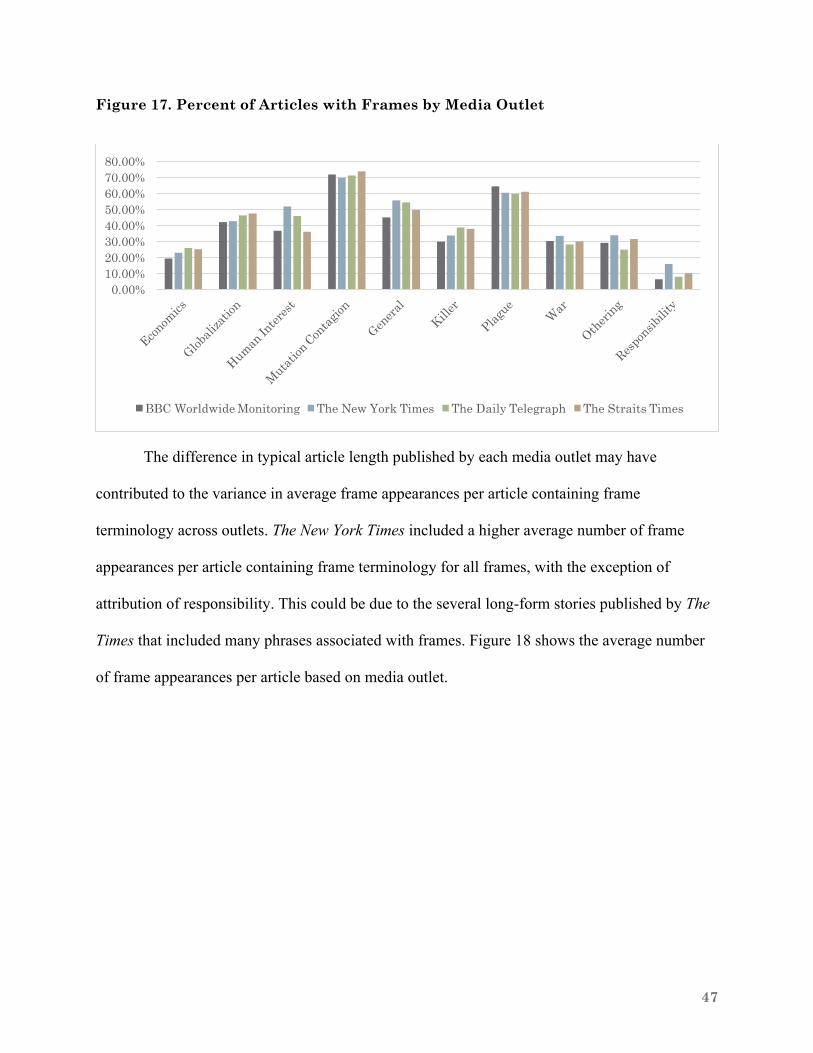
47
Figure 17. Percent of Articles with Frames by Media Outlet
The difference in typical article length published by each media outlet may have
contributed to the variance in average frame appearances per article containing frame
terminology across outlets. The New York Times included a higher average number of frame
appearances per article containing frame terminology for all frames, with the exception of
attribution of responsibility. This could be due to the several long-form stories published by The
Times that included many phrases associated with frames. Figure 18 shows the average number
of frame appearances per article based on media outlet.
0.00%10.00%20.00%30.00%40.00%50.00%60.00%70.00%80.00%
BBC Worldwide Monitoring The New York Times The Daily Telegraph The Straits Times
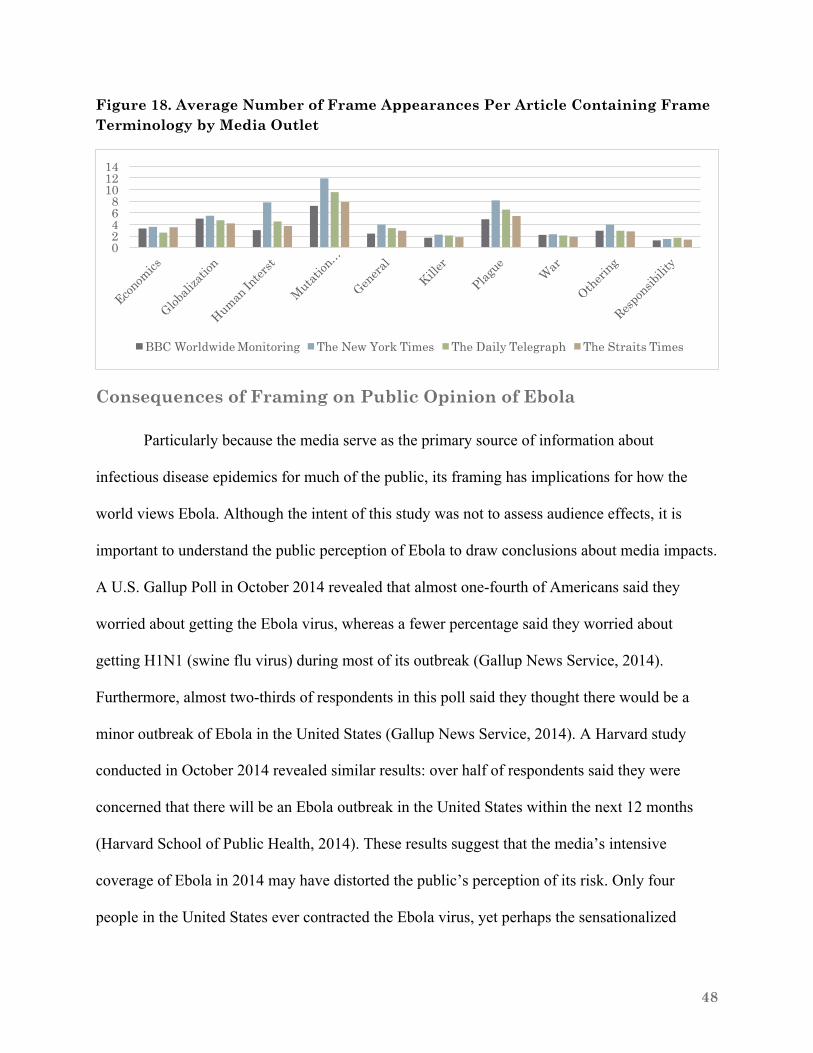
48
Figure 18. Average Number of Frame Appearances Per Article Containing Frame Terminology by Media Outlet
Consequences of Framing on Public Opinion of Ebola
Particularly because the media serve as the primary source of information about
infectious disease epidemics for much of the public, its framing has implications for how the
world views Ebola. Although the intent of this study was not to assess audience effects, it is
important to understand the public perception of Ebola to draw conclusions about media impacts.
A U.S. Gallup Poll in October 2014 revealed that almost one-fourth of Americans said they
worried about getting the Ebola virus, whereas a fewer percentage said they worried about
getting H1N1 (swine flu virus) during most of its outbreak (Gallup News Service, 2014).
Furthermore, almost two-thirds of respondents in this poll said they thought there would be a
minor outbreak of Ebola in the United States (Gallup News Service, 2014). A Harvard study
conducted in October 2014 revealed similar results: over half of respondents said they were
concerned that there will be an Ebola outbreak in the United States within the next 12 months
(Harvard School of Public Health, 2014). These results suggest that the media’s intensive
coverage of Ebola in 2014 may have distorted the public’s perception of its risk. Only four
people in the United States ever contracted the Ebola virus, yet perhaps the sensationalized
02468
101214
BBC Worldwide Monitoring The New York Times The Daily Telegraph The Straits Times
49
media coverage led the public to believe that it was a greater threat than it was in reality (WHO,
2015). If the media affected these respondents’ attitudes toward Ebola, they blatantly failed to
accurately represent risk.
Limitations
The present analysis had several limitations. First, a level of subjectivity was associated
with phrase-to-frame coding both in selecting relevant keywords and in determining whether
keywords used in the context of an article related to their linked frame. This subjectivity was
exacerbated by the fact that only one researcher coded all of the articles, which presented internal
reliability and validity problems. Multiple coders are preferred in qualitative data analysis
because high degrees of inter-coder agreement indicate that they are applying the codes similarly,
thus acting as “reliable” measurement instruments (Ryan, 1999). Because this study only used
one coder, it was not possible to calculate inter-coder reliability, or “the amount of agreement
between two or more coders for the codes applied to qualitative text” (MacPhail et al., 2015).
Contrastingly, a study with a single coder depends on the coder’s ability to not miss examples.
The current study attempted to minimize these problems by using an automatic search function
in NVivo, yet determining whether selected keywords were used in the context of their linked
frame was still subjective. Furthermore, when multiple independent coders mark the same text as
the same theme, it provides evidence that this theme has external validity and is not a figment of
the researcher’s imagination (Ryan, 1999).
With the limited sample of media outlets, it was also difficult to make broad
categorizations of worldwide media coverage of the Ebola crisis. Although the selected five
media outlets gave a depth to the data because of their differing geographic locations, nuances
such as political ideology of media organizations were lost. Liberal and conservative media may
50
have reacted differently to reporting on Ebola, but this analysis was constrained to the sample
from the four media outlets selected. These four outlets did not provide an adequate political-
position comparison because of their different countries of origin. Furthermore, the LexisNexis
database frequently included duplicates of stories, and although these were sorted through to
eliminate duplicates, human error could have missed some. Moreover, the current study would
have benefited from analyzing articles along a timeline from the first WHO announcement of
Ebola to one year later and by length of article. However, it proved prohibitively difficult to link
articles to their publication date and word count in analysis. Notably, the data excluded any
reference to media’s effects on audiences or public policy. Thus although the present analysis
suggested important trends in media coverage of the Ebola outbreaks, this topic requires further
research.
Future Research
Investigating media coverage of infectious disease epidemics should be a high priority for
media research and risk analysis. Scholars should look to the media to understand society’s
perception of these unique health threats. The recent Ebola crisis has opened a window for
potential research into not only the epidemiology of the mutated virus, but also the public’s
reaction and attitudes towards the disease. Using media coverage in combination with policy
actions of governments and international public health organizations is vital to understanding the
relationship between politics and media in a health crisis. Further research must be conducted on
the effects media have on public opinion during infectious disease epidemics, since the news
media serve as many people’s primary source of information. These analyses may help
government and public health officials better communicate the risk of the disease to
policymakers and the public. Assessment of risk perception of Ebola is crucial to prepare for
51
future epidemics and understand the relationship between the media and the public during health
crises.
52
References
ALLAN, S. 2002. Media, risk and science. Order, 9, 235.
ALTER, A. 2014. Updating a Chronicle of Suffering: Author of ‘The Hot Zone’ Tracks Ebola’s
Evolution. The New York Times, October 19.
ANDERSON, A. 2006. Media and Risk. In: MYTHEN, G., & S. WALKLATE (ed.) Beyond the Risk
Society: Critical reflections on risk and human security. Maidenhead: Open University Press.
AUDIT BUREAU OF CIRCULATIONS (SINGAPORE). 2015. ABC Audited Publications as of
September 2015 [Online]. Available from: http://abcsingapore.org/reports.html [Accessed
November 29, 2015].
AUDIT BUREAU OF CIRCULATIONS (UK). 2015. National Newspaper Circulation Certificate: The
Daily Telegraph [Online]. Available from: http://www.abc.org.uk/Certificates/47270367.pdf
[Accessed November 29, 2015].
BBC MONITORING. About the BBC Monitoring Library [Online]. Available from:
http://bbcmonitoringlibrary.com/bbcm/p/aboutus [Accessed November 29, 2015].
BEAUDOIN, C. E. 2007. SARS news coverage and its determinants in China and the US. International
Communication Gazette, 69, 509-524.
BECK, U. 1992. Risk society: Towards a new modernity, Sage.
BENNHOLD, K. 2015. Condition of British Ebola Patient Worsens. The New York Times, January 3.
BENNETT, P., ET AL. 2010. Risk Communication and Public Health. In: ONLINE, O. U. P. S. (ed.).
BERRY, T. R., WHARF-HIGGINS, J. & NAYLOR, P. 2007. SARS wars: an examination of the
quantity and construction of health information in the news media. Health communication, 21,
35-44.
BURNET, F. M. & WHITE, D. O. 1972. Natural History of Infectious Disease, University Press.
53
BURTON, G. 2010. Media and Society: Critical Perspectives, Maidenhead, Open University Press.
CDC. 2015. Ebola (Ebola Virus Disease) [Online]. Available: http://www.cdc.gov/vhf/ebola/index.html
[Accessed November 29, 2015].
CDC. 2015. Measles (Rubeola) [Online]. cdc.gov: Centers for Disease Control and Prevention.
Available from: http://www.cdc.gov/measles/hcp/ [Accessed April, 16 2015].
CENTER FOR STRATEGIC AND INTERNATIONAL STUDIES. 2015. Infectious Diseases [Online].
SmartGlobalHealth.org. Available from:
http://www.smartglobalhealth.org/issues/entry/infectious-diseases [Accessed February 10, 2015].
CHOWELL, G. & NISHIURA, H. 2014. Transmission dynamics and control of Ebola virus disease
(EVD): a review. BMC medicine, 12, 196.
COULDRY, N. 2012. Media, society, world: Social theory and digital media practice, Polity.
DEARING, R., AND EVERETT ROGERS 1996. What is Agenda Setting? Agenda-Setting. Thousand
Oaks, CA: Sage.
DUNCAN, B. 2009. How the media reported the first days of the pandemic (H1N1) 2009: results of EU-
wide media analysis. Euro surveillance, 14, 19286.
ENTMAN, R. M. 1993. Framing: Toward clarification of a fractured paradigm. Journal of
communication, 43, 51-58.
GALLUP NEWS SERVICE. 2014. Ebola Virus III. October 19.
GARRETT, L. 1994. The coming plague: newly emerging diseases in a world out of balance,
Macmillan.
GARRETT, L. The author [Online]. Available from: http://lauriegarrett.com/about/ [Accessed April 2,
2015].
GOFFMAN, E. 1974. Frame Analysis: An Essay on the Organization of Experience, New York, Harper
54
& Row.
HALL, S. 1994. Panic Everywhere. The New York Times, October 30.
HAMILTON, R. 2014. Ebola Crisis: The Economic Impact. British Broadcasting Corporation, August
20.
HARVARD SCHOOL OF PUBLIC HEALTH. 2014. Ebola Poll II Topline. October 12.
HAUGHNEY, C. 2013. Newspapers Post Gains in Digital Circulation. The New York Times, April 30
[Online]. Available from: http://www.nytimes.com/2013/05/01/business/media/digital-
subscribers-buoy-newspaper-circulation.html [Accessed November 29, 2015].
HAYNES, D. 2002. Still the Heart of Darkness: The Ebola Virus and the Meta-Narrative of Disease in
The Hot Zone. Journal of Medical Humanities, 23, 133-145.
HONG, C. 2014. The Politicization of Disease. The Princeton Public Health Review [Online]. Available
from: https://pphr.princeton.edu/2014/12/07/the-politicization-of-disease/ [Accessed November
7, 2015].
JOFFE, H. 1999. Risk and 'the Other', Cambridge University Press.
JOFFE, H. & HAARHOFF, G. 2002. Representations of far-flung illnesses: the case of Ebola in Britain.
Social science & medicine, 54, 955-969.
JOHNSON-CARTEE, K. S. 2004. News narratives and news framing: Constructing political reality,
Rowman & Littlefield Publishers.
KIM, Y. 2014. Contingent Factors of Agenda-Setting Effects. In: JOHNSON, T. (ed.) Agenda Setting in
a 2.0 World: New Agendas in Communication. New York: Routledge.
LUTHER, C. A. & ZHOU, X. 2005. Within the boundaries of politics: News framing of SARS in China
and the United States. Journalism & Mass Communication Quarterly, 82, 857-872.
MCCANDLESS, D. 2014. Visualised: how Ebola compares to other infectious diseases. The Guardian.
55
MACPHAIL, C., KHOZA, N., ABLER, L. & RANGANATHAN, M. 2015. Process guidelines for
establishing Intercoder Reliability in qualitative studies. Qualitative Research,
1468794115577012.
MCNEIL, D. 2015. Ask Well: Ebola and Sex. The New York Times [Online]. Available from:
http://well.blogs.nytimes.com/2015/11/13/ask-well-ebola-and-sex/ [Accessed November 29,
2015].
MOSCOVICI, S. 2001. Social Representations: Explorations in Social Psychology, New York, NYU
Press.
NEW YORK TIMES, THE. 2014. New York Times Media Kit: Newspaper [Online]. Available from:
http://nytmediakit.com/newspaper [Accessed March 28, 2015].
NOSSITER, A., & GRADY, D. 2014. Emergency Efforts in Africa to Contain Ebola as Toll Rises. The
New York Times, July 31 [Online]. Available from:
http://www.nytimes.com/2014/08/01/world/africa/sierra-leone-declares-health-emergency-over-
ebola.html?_r=0 [Accessed November 29, 2015].
PHILO, G., MILLER, D., & HAPPER, C. 2014. Circuits of Communication. In: HOLBORN, M. (ed.)
Contemporary Sociology. London: Polity.
PRESTON, R. 2012. The Hot Zone: The Terrifying True Story of the Origins of the Ebola Virus,
Anchor.
RYAN, G. 1999. Measuring the typicality of text: Using multiple coders for more than just reliability
and validity checks. Human Organization, 58, 313-322.
SACK, K., FINK, S, BELLUCK, P., & NOSSITER, A. 2014. Ebola's Deadly Escape. The New York
Times, December 30.
SCHEUFELE, D. A. & TEWKSBURY, D. 2007. Framing, agenda setting, and priming: The evolution
56
of three media effects models. Journal of communication, 57, 9-20.
SMITH, R. D. 2006. Responding to global infectious disease outbreaks: Lessons from SARS on the role
of risk perception, communication and management. Social science & medicine, 63, 3113-3123.
SMITH, T. 2014. "The Hot Zone" and the mythos of Ebola. Aetiology [Online]. Available from:
http://scienceblogs.com/aetiology/2014/10/21/the-hot-zone-and-the-mythos-of-ebola/ [Accessed
April 2, 2015].
SHIH, T., WIJAYA, R., & BROSSARD, D. 2008. Media Coverage of Public Health Epidemics:
Linking Framing and Issue Attention Cycle Toward an Integrated Theory of Print News
Coverage of Epidemics. Mass Communication and Society, 11, 141-160.
SONTAG, S. 1989. AIDS and its metaphors, New York, Farrar, Straus, Giroux.
THE TELEGRAPH. 2010. Daily Telegraph named Newspaper of the Year. The Telegraph, March 24
[Online]. Available from:
http://www.telegraph.co.uk/finance/newsbysector/mediatechnologyandtelecoms/media/awards-
for-telegraph/7508286/Daily-Telegraph-named-Newspaper-of-the-Year.html [Accessed
November 29, 2015].
TURVILL, W. 2014. After a decade of decline daily 'broadsheet' print circulations show signs of
levelling off. Press Gazette, October 21 [Online]. Available from:
http://www.pressgazette.co.uk/content/after-decade-decline-could-daily-broadsheet-circulations-
be-leveling [Accessed November 29, 2015].
UNGAR, S. 1998. Hot crises and media reassurance: A comparison of emerging diseases and Ebola
Zaire. British Journal of Sociology, 36-56.
WALLIS, P. & NERLICH, B. 2005. Disease metaphors in new epidemics: the UK media framing of the
2003 SARS epidemic. Social science & medicine, 60, 2629-2639.
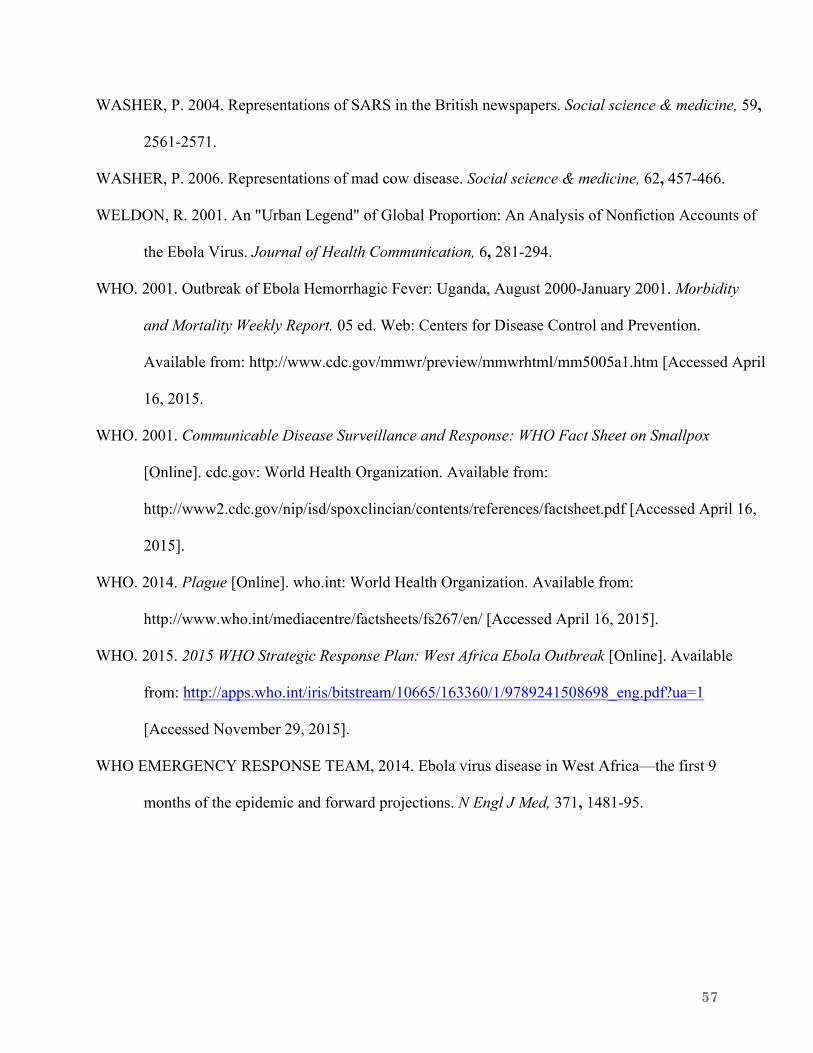
57
WASHER, P. 2004. Representations of SARS in the British newspapers. Social science & medicine, 59,
2561-2571.
WASHER, P. 2006. Representations of mad cow disease. Social science & medicine, 62, 457-466.
WELDON, R. 2001. An "Urban Legend" of Global Proportion: An Analysis of Nonfiction Accounts of
the Ebola Virus. Journal of Health Communication, 6, 281-294.
WHO. 2001. Outbreak of Ebola Hemorrhagic Fever: Uganda, August 2000-January 2001. Morbidity
and Mortality Weekly Report. 05 ed. Web: Centers for Disease Control and Prevention.
Available from: http://www.cdc.gov/mmwr/preview/mmwrhtml/mm5005a1.htm [Accessed April
16, 2015.
WHO. 2001. Communicable Disease Surveillance and Response: WHO Fact Sheet on Smallpox
[Online]. cdc.gov: World Health Organization. Available from:
http://www2.cdc.gov/nip/isd/spoxclincian/contents/references/factsheet.pdf [Accessed April 16,
2015].
WHO. 2014. Plague [Online]. who.int: World Health Organization. Available from:
http://www.who.int/mediacentre/factsheets/fs267/en/ [Accessed April 16, 2015].
WHO. 2015. 2015 WHO Strategic Response Plan: West Africa Ebola Outbreak [Online]. Available
from: http://apps.who.int/iris/bitstream/10665/163360/1/9789241508698_eng.pdf?ua=1
[Accessed November 29, 2015].
WHO EMERGENCY RESPONSE TEAM, 2014. Ebola virus disease in West Africa—the first 9
months of the epidemic and forward projections. N Engl J Med, 371, 1481-95.
58
Appendices
Appendix 1. Sampling of Media Coverage Figure 1.1. Sample Distribution in 2000-2001
Figure 1.2. Sample Distribution in 2014-2015
67%
25%
5%
3%
BBC
NY Times
Telegraph
Straits
52%31%
12%5%
BBC
NY Times
Telegraph
Straits
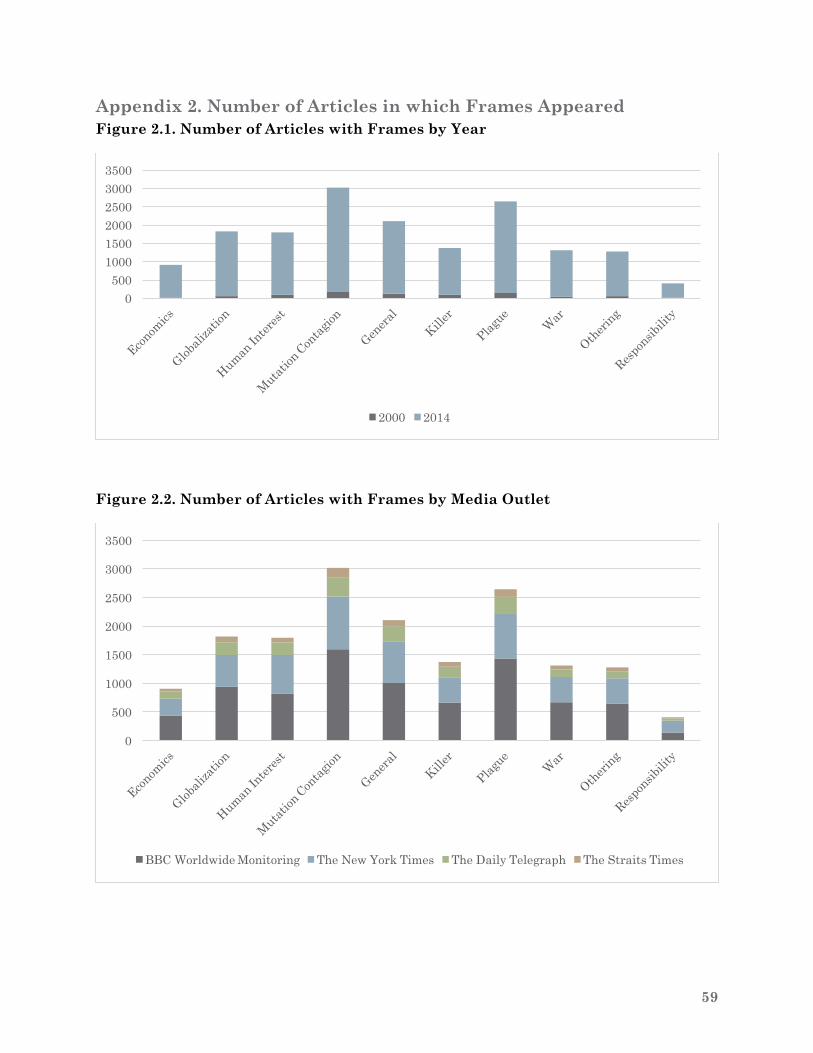
59
Appendix 2. Number of Articles in which Frames Appeared Figure 2.1. Number of Articles with Frames by Year
Figure 2.2. Number of Articles with Frames by Media Outlet
0500
100015002000250030003500
2000 2014
0
500
1000
1500
2000
2500
3000
3500
BBC Worldwide Monitoring The New York Times The Daily Telegraph The Straits Times
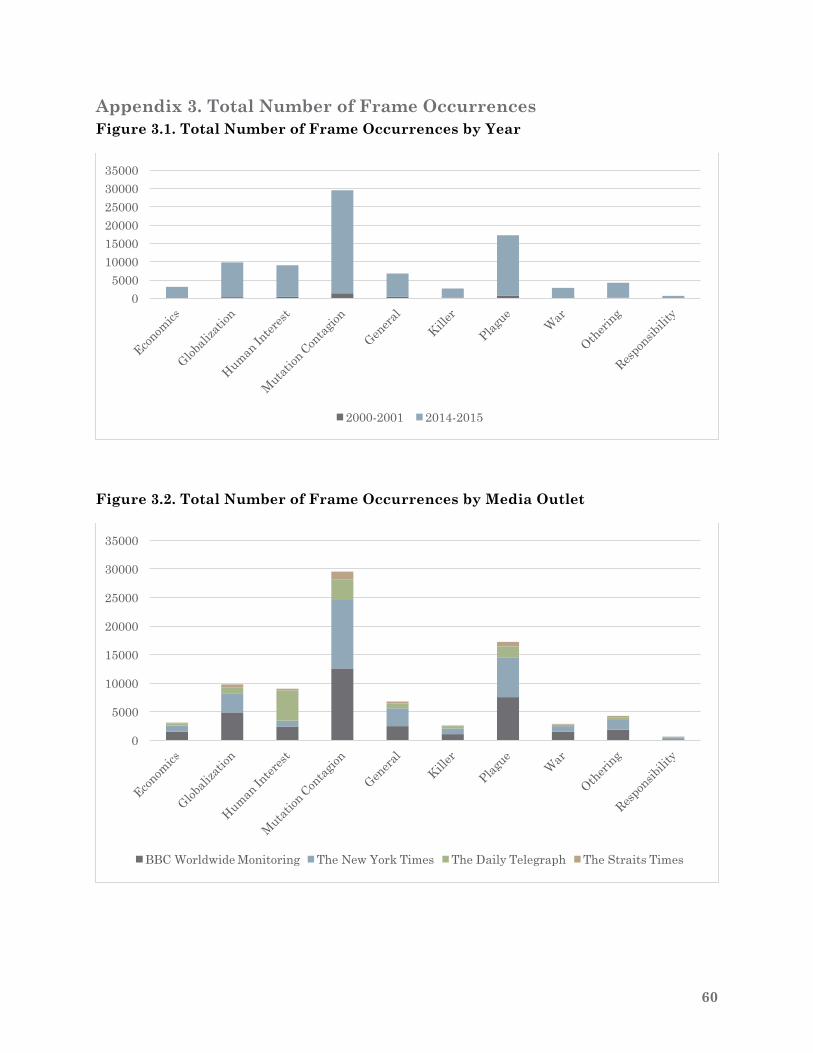
60
Appendix 3. Total Number of Frame Occurrences Figure 3.1. Total Number of Frame Occurrences by Year
Figure 3.2. Total Number of Frame Occurrences by Media Outlet
05000
100001500020000250003000035000
2000-2001 2014-2015
0
5000
10000
15000
20000
25000
30000
35000
BBC Worldwide Monitoring The New York Times The Daily Telegraph The Straits Times
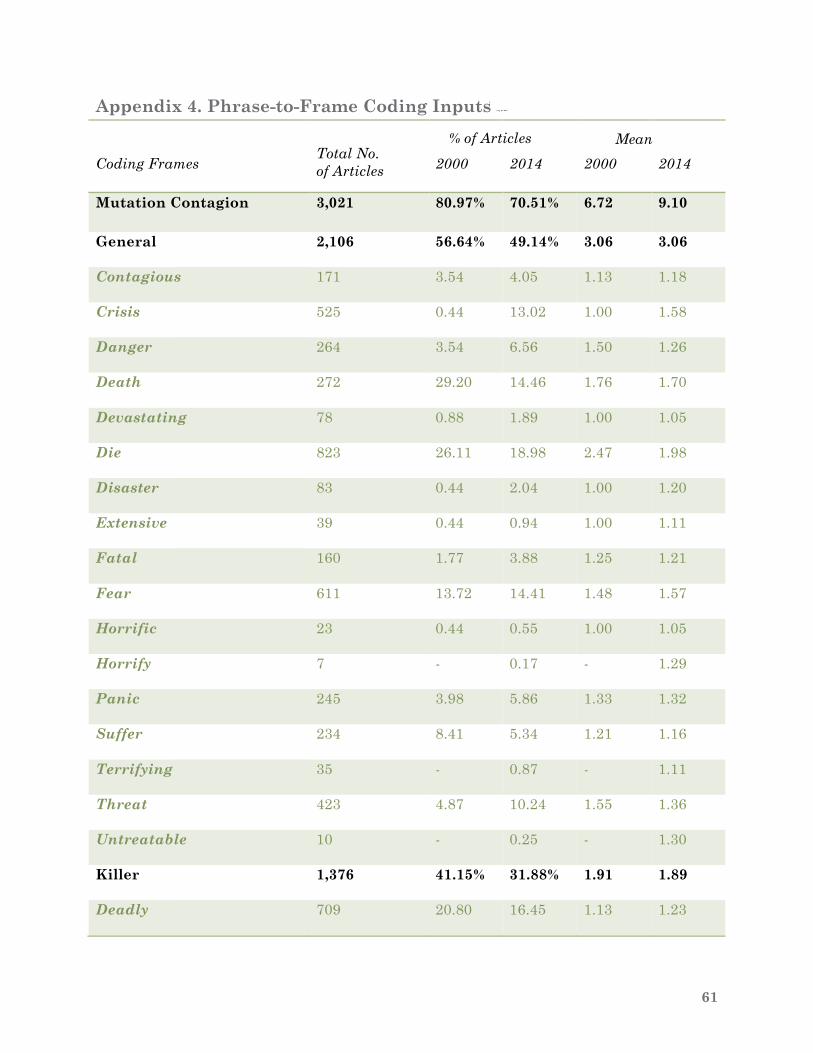
61
Appendix 4. Phrase-to-Frame Coding Inputs
Coding Frames
Total No. of Articles
2000
2014
2000
2014
Mutation Contagion 3,021 80.97% 70.51% 6.72 9.10
General 2,106 56.64% 49.14% 3.06 3.06
Contagious 171 3.54 4.05 1.13 1.18
Crisis 525 0.44 13.02 1.00 1.58
Danger 264 3.54 6.56 1.50 1.26
Death 272 29.20 14.46 1.76 1.70
Devastating 78 0.88 1.89 1.00 1.05
Die 823 26.11 18.98 2.47 1.98
Disaster 83 0.44 2.04 1.00 1.20
Extensive 39 0.44 0.94 1.00 1.11
Fatal 160 1.77 3.88 1.25 1.21
Fear 611 13.72 14.41 1.48 1.57
Horrific 23 0.44 0.55 1.00 1.05
Horrify 7 - 0.17 - 1.29
Panic 245 3.98 5.86 1.33 1.32
Suffer 234 8.41 5.34 1.21 1.16
Terrifying 35 - 0.87 - 1.11
Threat 423 4.87 10.24 1.55 1.36
Untreatable 10 - 0.25 - 1.30
Killer 1,376 41.15% 31.88% 1.91 1.89
Deadly 709 20.80 16.45 1.13 1.23
ç
% of Articles
Mean
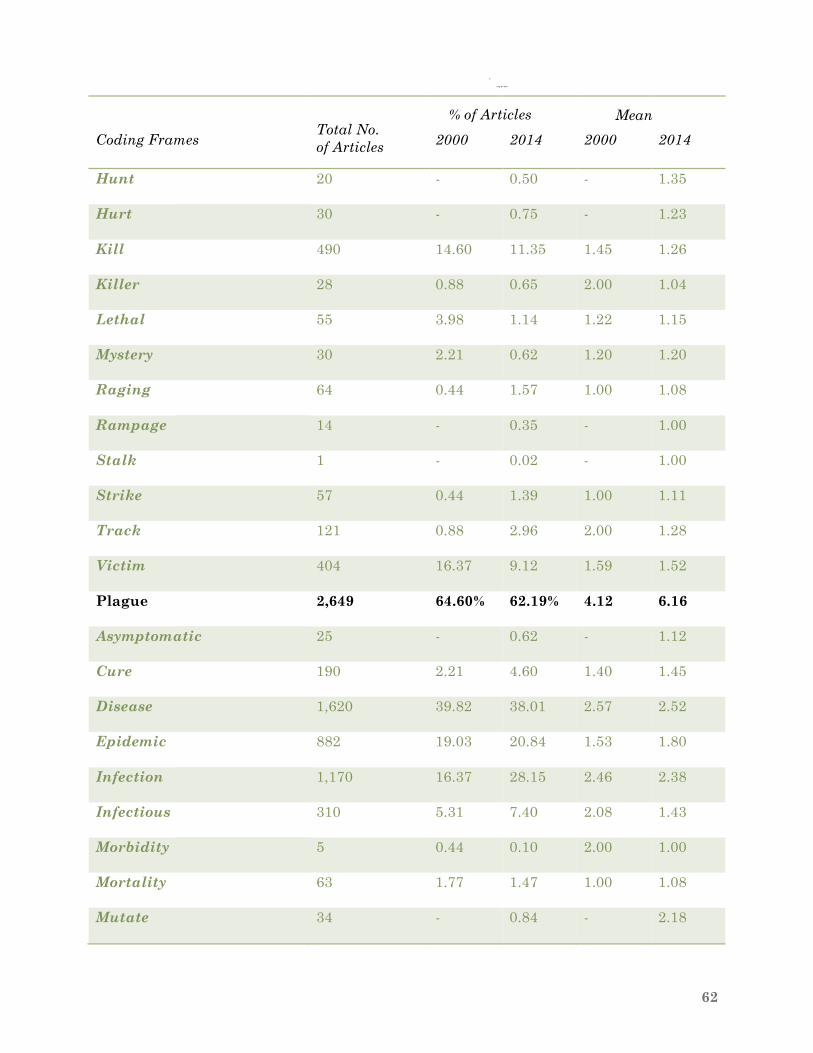
62
Coding Frames
Total No. of Articles
2000
2014
2000
2014
Hunt 20 - 0.50 - 1.35
Hurt 30 - 0.75 - 1.23
Kill 490 14.60 11.35 1.45 1.26
Killer 28 0.88 0.65 2.00 1.04
Lethal 55 3.98 1.14 1.22 1.15
Mystery 30 2.21 0.62 1.20 1.20
Raging 64 0.44 1.57 1.00 1.08
Rampage 14 - 0.35 - 1.00
Stalk 1 - 0.02 - 1.00
Strike 57 0.44 1.39 1.00 1.11
Track 121 0.88 2.96 2.00 1.28
Victim 404 16.37 9.12 1.59 1.52
Plague 2,649 64.60% 62.19% 4.12 6.16
Asymptomatic 25 - 0.62 - 1.12
Cure 190 2.21 4.60 1.40 1.45
Disease 1,620 39.82 38.01 2.57 2.52
Epidemic 882 19.03 20.84 1.53 1.80
Infection 1,170 16.37 28.15 2.46 2.38
Infectious 310 5.31 7.40 2.08 1.43
Morbidity 5 0.44 0.10 2.00 1.00
Mortality 63 1.77 1.47 1.00 1.08
Mutate 34 - 0.84 - 2.18
ç
% of Articles
Mean
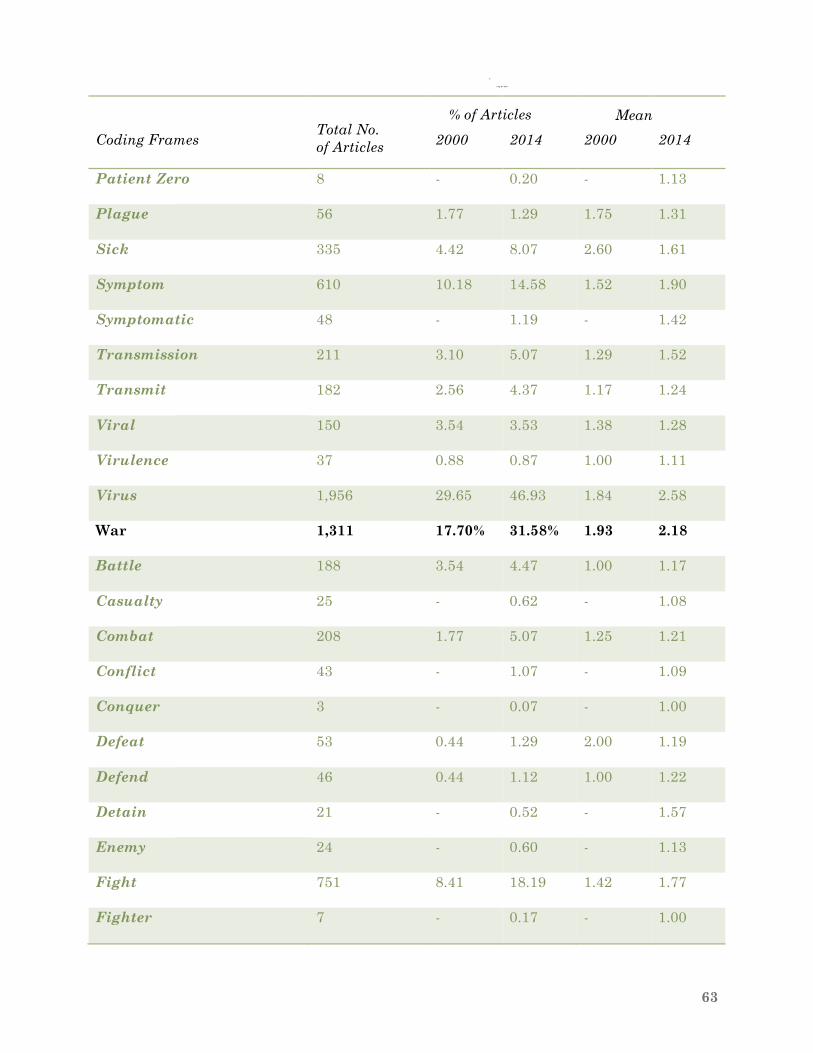
63
Coding Frames
Total No. of Articles
2000
2014
2000
2014
Patient Zero 8 - 0.20 - 1.13
Plague 56 1.77 1.29 1.75 1.31
Sick 335 4.42 8.07 2.60 1.61
Symptom 610 10.18 14.58 1.52 1.90
Symptomatic 48 - 1.19 - 1.42
Transmission 211 3.10 5.07 1.29 1.52
Transmit 182 2.56 4.37 1.17 1.24
Viral 150 3.54 3.53 1.38 1.28
Virulence 37 0.88 0.87 1.00 1.11
Virus 1,956 29.65 46.93 1.84 2.58
War 1,311 17.70% 31.58% 1.93 2.18
Battle 188 3.54 4.47 1.00 1.17
Casualty 25 - 0.62 - 1.08
Combat 208 1.77 5.07 1.25 1.21
Conflict 43 - 1.07 - 1.09
Conquer 3 - 0.07 - 1.00
Defeat 53 0.44 1.29 2.00 1.19
Defend 46 0.44 1.12 1.00 1.22
Detain 21 - 0.52 - 1.57
Enemy 24 - 0.60 - 1.13
Fight 751 8.41 18.19 1.42 1.77
Fighter 7 - 0.17 - 1.00
ç
% of Articles
Mean
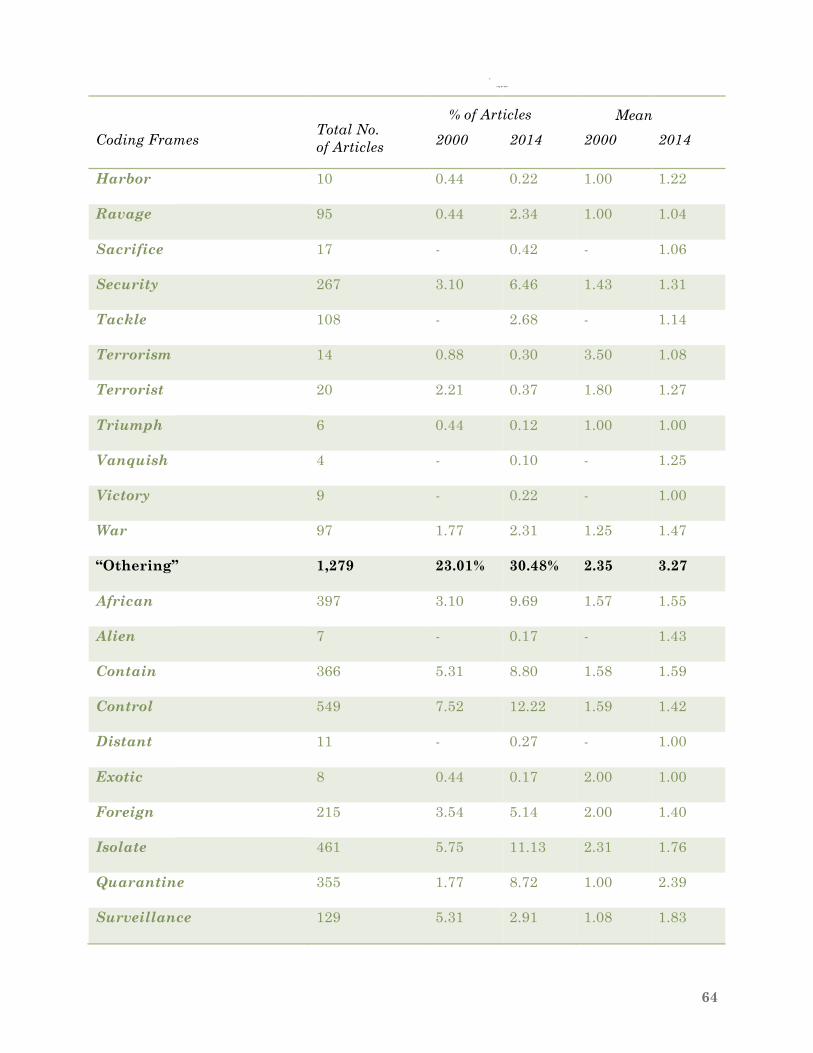
64
Coding Frames
Total No. of Articles
2000
2014
2000
2014
Harbor 10 0.44 0.22 1.00 1.22
Ravage 95 0.44 2.34 1.00 1.04
Sacrifice 17 - 0.42 - 1.06
Security 267 3.10 6.46 1.43 1.31
Tackle 108 - 2.68 - 1.14
Terrorism 14 0.88 0.30 3.50 1.08
Terrorist 20 2.21 0.37 1.80 1.27
Triumph 6 0.44 0.12 1.00 1.00
Vanquish 4 - 0.10 - 1.25
Victory 9 - 0.22 - 1.00
War 97 1.77 2.31 1.25 1.47
“Othering” 1,279 23.01% 30.48% 2.35 3.27
African 397 3.10 9.69 1.57 1.55
Alien 7 - 0.17 - 1.43
Contain 366 5.31 8.80 1.58 1.59
Control 549 7.52 12.22 1.59 1.42
Distant 11 - 0.27 - 1.00
Exotic 8 0.44 0.17 2.00 1.00
Foreign 215 3.54 5.14 2.00 1.40
Isolate 461 5.75 11.13 2.31 1.76
Quarantine 355 1.77 8.72 1.00 2.39
Surveillance 129 5.31 2.91 1.08 1.83
ç
% of Articles
Mean
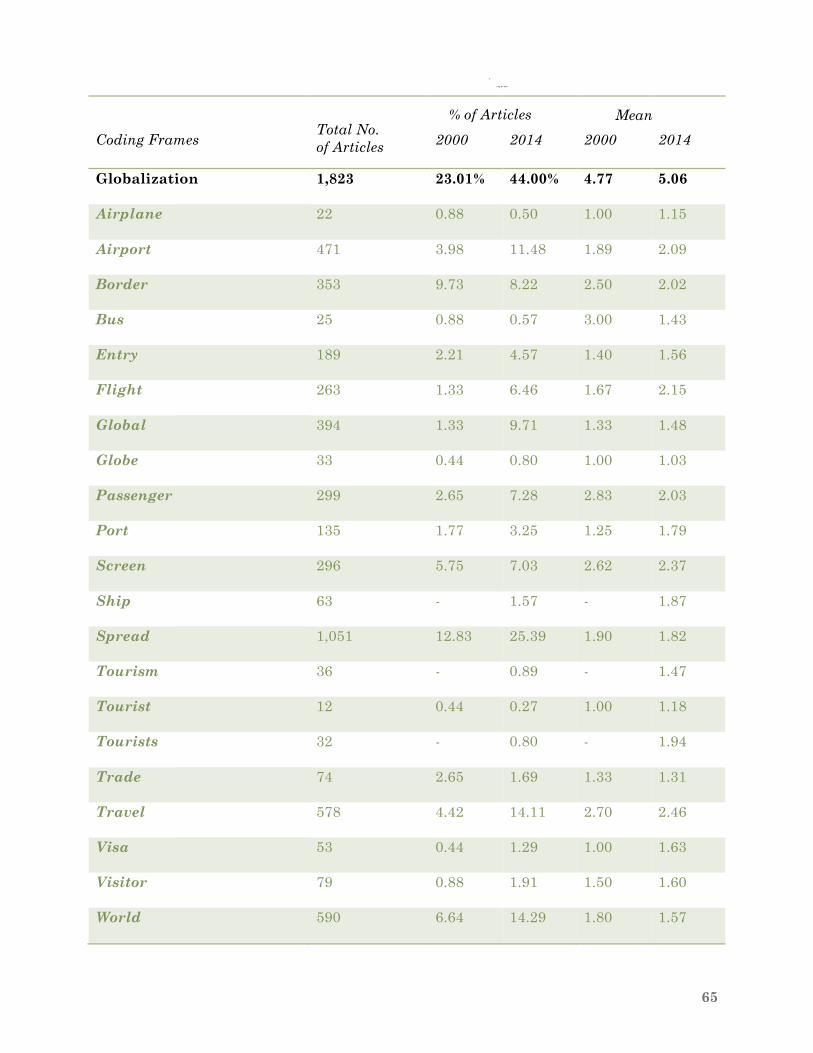
65
Coding Frames
Total No. of Articles
2000
2014
2000
2014
Globalization 1,823 23.01% 44.00% 4.77 5.06
Airplane 22 0.88 0.50 1.00 1.15
Airport 471 3.98 11.48 1.89 2.09
Border 353 9.73 8.22 2.50 2.02
Bus 25 0.88 0.57 3.00 1.43
Entry 189 2.21 4.57 1.40 1.56
Flight 263 1.33 6.46 1.67 2.15
Global 394 1.33 9.71 1.33 1.48
Globe 33 0.44 0.80 1.00 1.03
Passenger 299 2.65 7.28 2.83 2.03
Port 135 1.77 3.25 1.25 1.79
Screen 296 5.75 7.03 2.62 2.37
Ship 63 - 1.57 - 1.87
Spread 1,051 12.83 25.39 1.90 1.82
Tourism 36 - 0.89 - 1.47
Tourist 12 0.44 0.27 1.00 1.18
Tourists 32 - 0.80 - 1.94
Trade 74 2.65 1.69 1.33 1.31
Travel 578 4.42 14.11 2.70 2.46
Visa 53 0.44 1.29 1.00 1.63
Visitor 79 0.88 1.91 1.50 1.60
World 590 6.64 14.29 1.80 1.57
ç
% of Articles
Mean
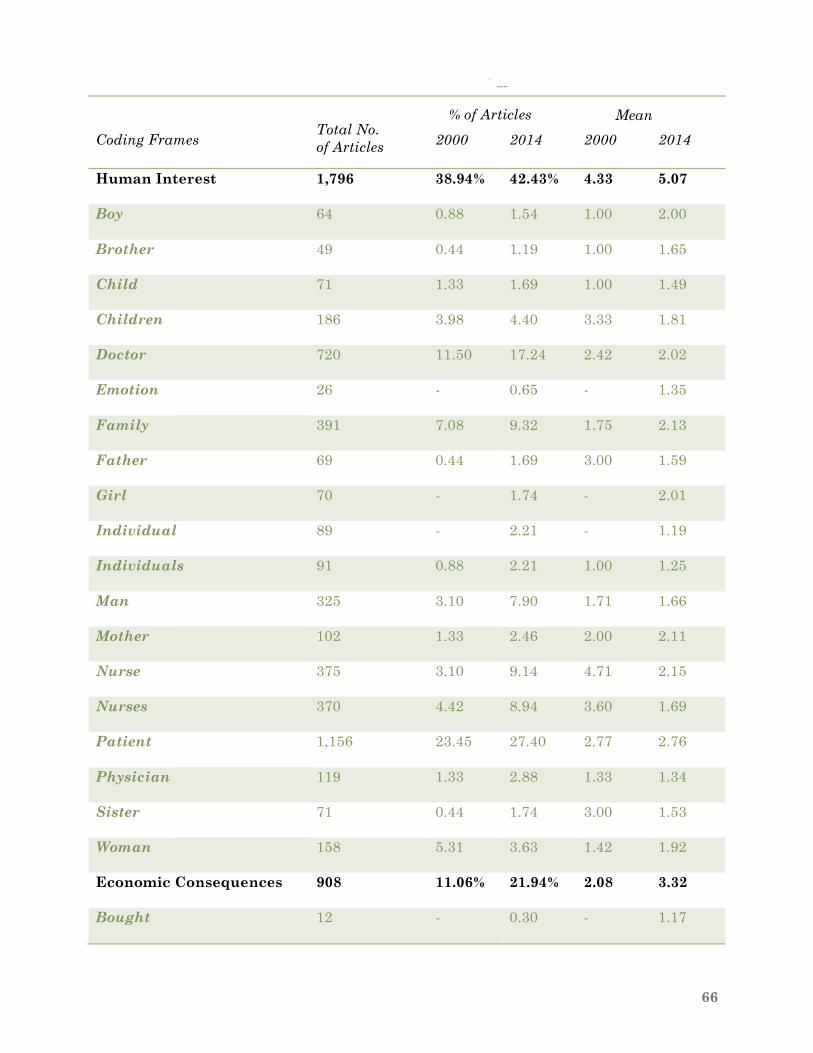
66
Coding Frames
Total No. of Articles
2000
2014
2000
2014
Human Interest 1,796 38.94% 42.43% 4.33 5.07
Boy 64 0.88 1.54 1.00 2.00
Brother 49 0.44 1.19 1.00 1.65
Child 71 1.33 1.69 1.00 1.49
Children 186 3.98 4.40 3.33 1.81
Doctor 720 11.50 17.24 2.42 2.02
Emotion 26 - 0.65 - 1.35
Family 391 7.08 9.32 1.75 2.13
Father 69 0.44 1.69 3.00 1.59
Girl 70 - 1.74 - 2.01
Individual 89 - 2.21 - 1.19
Individuals 91 0.88 2.21 1.00 1.25
Man 325 3.10 7.90 1.71 1.66
Mother 102 1.33 2.46 2.00 2.11
Nurse 375 3.10 9.14 4.71 2.15
Nurses 370 4.42 8.94 3.60 1.69
Patient 1,156 23.45 27.40 2.77 2.76
Physician 119 1.33 2.88 1.33 1.34
Sister 71 0.44 1.74 3.00 1.53
Woman 158 5.31 3.63 1.42 1.92
Economic Consequences 908 11.06% 21.94% 2.08 3.32
Bought 12 - 0.30 - 1.17
ç
% of Articles
Mean
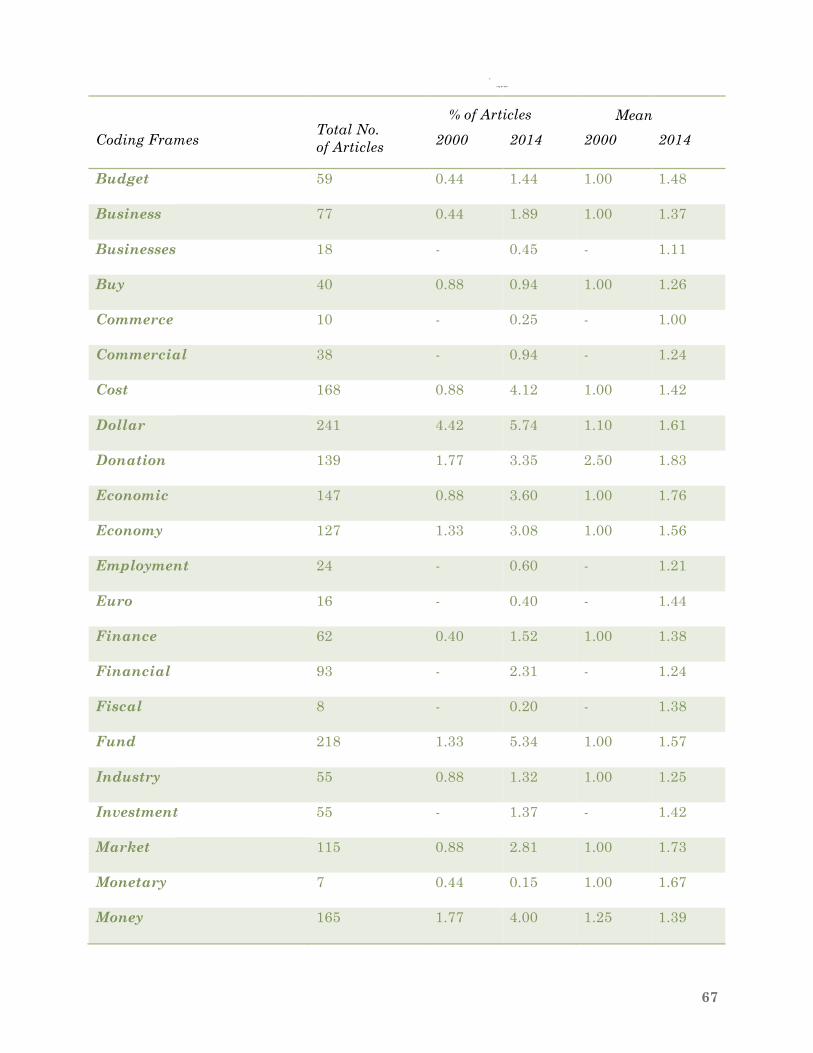
67
Coding Frames
Total No. of Articles
2000
2014
2000
2014
Budget 59 0.44 1.44 1.00 1.48
Business 77 0.44 1.89 1.00 1.37
Businesses 18 - 0.45 - 1.11
Buy 40 0.88 0.94 1.00 1.26
Commerce 10 - 0.25 - 1.00
Commercial 38 - 0.94 - 1.24
Cost 168 0.88 4.12 1.00 1.42
Dollar 241 4.42 5.74 1.10 1.61
Donation 139 1.77 3.35 2.50 1.83
Economic 147 0.88 3.60 1.00 1.76
Economy 127 1.33 3.08 1.00 1.56
Employment 24 - 0.60 - 1.21
Euro 16 - 0.40 - 1.44
Finance 62 0.40 1.52 1.00 1.38
Financial 93 - 2.31 - 1.24
Fiscal 8 - 0.20 - 1.38
Fund 218 1.33 5.34 1.00 1.57
Industry 55 0.88 1.32 1.00 1.25
Investment 55 - 1.37 - 1.42
Market 115 0.88 2.81 1.00 1.73
Monetary 7 0.44 0.15 1.00 1.67
Money 165 1.77 4.00 1.25 1.39
ç
% of Articles
Mean
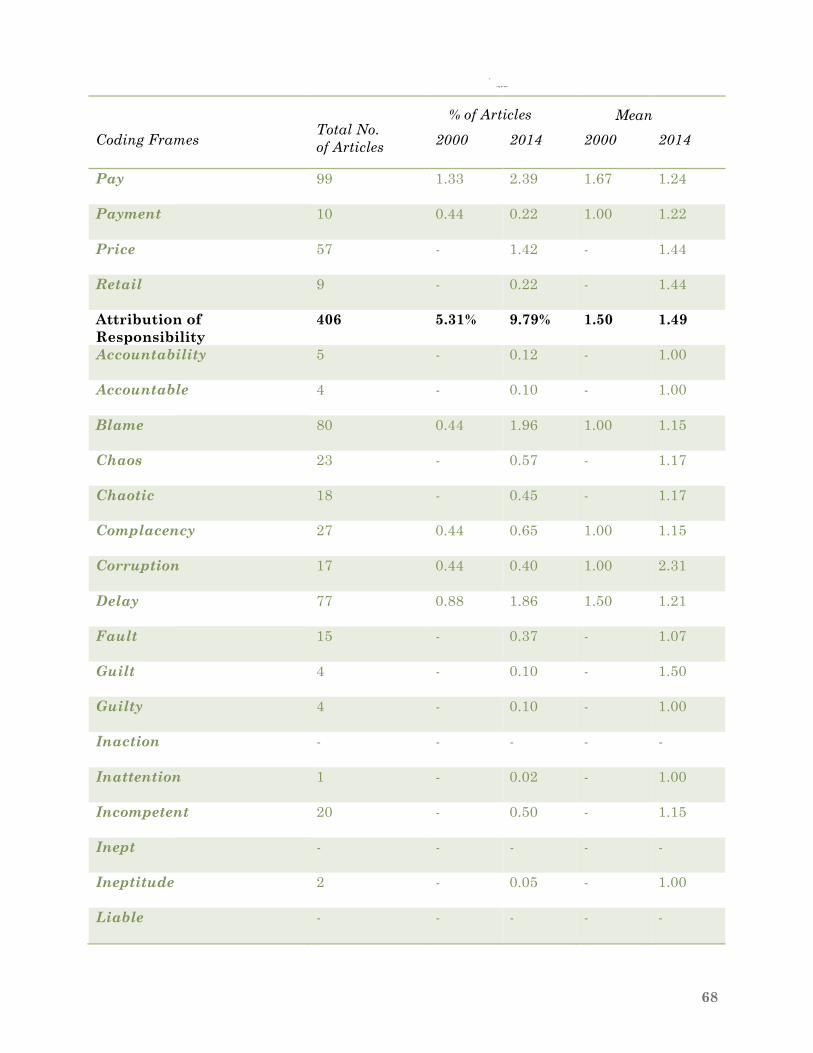
68
Coding Frames
Total No. of Articles
2000
2014
2000
2014
Pay 99 1.33 2.39 1.67 1.24
Payment 10 0.44 0.22 1.00 1.22
Price 57 - 1.42 - 1.44
Retail 9 - 0.22 - 1.44
Attribution of Responsibility
406 5.31% 9.79% 1.50 1.49
Accountability 5 - 0.12 - 1.00
Accountable 4 - 0.10 - 1.00
Blame 80 0.44 1.96 1.00 1.15
Chaos 23 - 0.57 - 1.17
Chaotic 18 - 0.45 - 1.17
Complacency 27 0.44 0.65 1.00 1.15
Corruption 17 0.44 0.40 1.00 2.31
Delay 77 0.88 1.86 1.50 1.21
Fault 15 - 0.37 - 1.07
Guilt 4 - 0.10 - 1.50
Guilty 4 - 0.10 - 1.00
Inaction - - - - -
Inattention 1 - 0.02 - 1.00
Incompetent 20 - 0.50 - 1.15
Inept - - - - -
Ineptitude 2 - 0.05 - 1.00
Liable - - - - -
ç
% of Articles
Mean
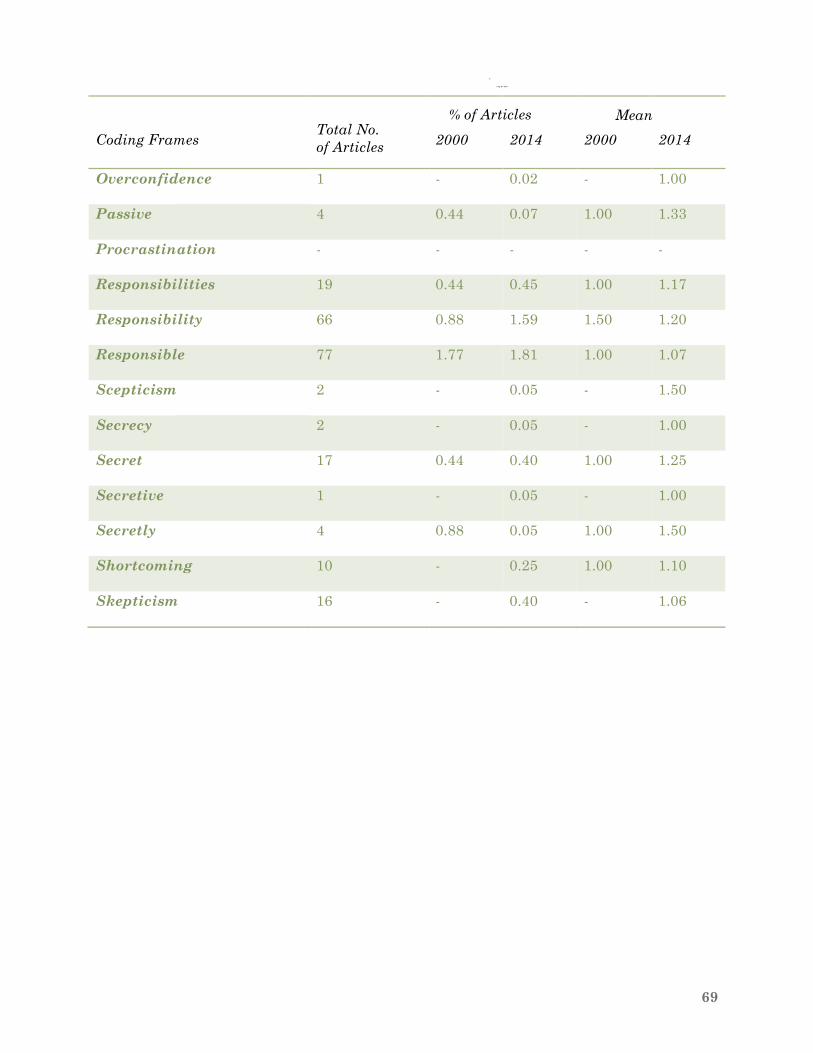
69
Coding Frames
Total No. of Articles
2000
2014
2000
2014
Overconfidence 1 - 0.02 - 1.00
Passive 4 0.44 0.07 1.00 1.33
Procrastination - - - - -
Responsibilities 19 0.44 0.45 1.00 1.17
Responsibility 66 0.88 1.59 1.50 1.20
Responsible 77 1.77 1.81 1.00 1.07
Scepticism 2 - 0.05 - 1.50
Secrecy 2 - 0.05 - 1.00
Secret 17 0.44 0.40 1.00 1.25
Secretive 1 - 0.05 - 1.00
Secretly 4 0.88 0.05 1.00 1.50
Shortcoming 10 - 0.25 1.00 1.10
Skepticism 16 - 0.40 - 1.06
ç
% of Articles
Mean


![OCB Ebola Review Summary Report Finalcdn.evaluation.msf.org/.../ocb_ebola_review_summary_report_final_3… · OCB EBOLA REVIEWOCB EBOLA REVIEW SUMMARY REPORT [[[[AprilAprilApril 2012200112016666]]]]](https://img.pdfslide.net/doc/110x75/5b05e1847f8b9ad1768c04f0/ocb-ebola-review-summary-report-ebola-reviewocb-ebola-review-summary-report-aprilaprilapril.jpg)