Embed Size (px)
Citation preview
Media release
Page 1 of 49
Rio Tinto announces a 21 per cent increase in first half underlying earnings to $5.1 billion 7 August 2014 Rio Tinto chief executive Sam Walsh said “Our outstanding half year performance reflects the quality of our world-class assets, our programme of operational excellence and our ability to drive performance during a period of weaker prices. These results show that our current strategic and management focus is making a meaningful contribution to cash flow generation.
“During the first half we have increased underlying earnings by 21 per cent to $5.1 billion and enhanced operating cash flow by eight per cent. We delivered what we said we would, exceeding our $3 billion operating cash cost reduction target six months ahead of schedule while producing record volumes and driving productivity improvements across all our businesses.
“We have decreased net debt by $6.0 billion compared with this time last year, through our stronger operating cash flows, sharply reduced capital spend and proceeds from divestments. We are confident Rio Tinto’s low cost, diversified portfolio will continue to generate strong and sustainable cash flows over the coming years. This solid foundation for growth will result in materially increased cash returns to shareholders, underscoring our commitment to deliver greater value.” First half results demonstrate the strength of our business
– Increased underlying earnings by 21 per cent to $5.1 billion. Underlying earnings per share rose to 276.8 US cents.
– Achieved $3.2 billion of sustainable operating cash cost improvements since 2012, exceeding the $3 billion reduction target six months ahead of schedule. Momentum in cost reductions is now expected to realise a further $1 billion of savings by the end of 2015.
– Shipped record iron ore volumes, set production records for iron ore and thermal coal and delivered a strong operational performance in copper.
– Increased cash flows from operations by eight per cent to $8.7 billion. – Reduced capital expenditure to $3.6 billion in the first half. 2014 capex is now expected to be around
$9 billion, $2 billion below previous guidance, and around $8 billion each year from 2015. – Decreased net debt by $1.9 billion in the first half to $16.1 billion at 30 June 2014. This compares with
$22.1 billion at 30 June 2013. Reduced adjusted total borrowings by $2.5 billion in the first half to $25.7 billion at 30 June 2014.
– Achieved EBITDA of $1.1 billion in Aluminium, up 26 per cent on 2013 first half, despite London Metal Exchange (LME) aluminium prices averaging nine per cent lower.
– Completed the review of the Kitimat Modernisation Project: total approved capital now stands at $4.8 billion. Net earnings of $4.4 billion reflect $0.8 billion of further impairments related to Kitimat, non-cash exchange rate gains of $0.6 billion and other excluded charges of $0.5 billion.
– Increased interim dividend by 15 per cent to 96 US cents per share.
Six months to 30 June 2014 2013 Change Underlying earnings1 (US$ millions) 5,116 4,229 +21% Net earnings1 (US$ millions) 4,402 1,720 +156% Cash flows from operations (US$ millions) 8,660 8,005 +8% Capital expenditure (US$ millions) 3,576 6,929 -48% Underlying earnings per share (US cents) 276.8 228.9 +21% Basic earnings per share (US cents) 238.2 93.1 +156% Ordinary dividends per share (US cents) 96.0 83.5 +15% The financial results are prepared in accordance with IFRS and are unaudited. 1Underlying earnings is the key financial performance indicator which management uses internally to assess performance. It is presented here to provide greater understanding of the underlying business performance of the Group’s operations attributable to the owners of Rio Tinto. Net and underlying earnings relate to profit attributable to owners of Rio Tinto. Underlying earnings is defined and reconciled to net earnings on page 49.
Page 2 of 49
Results for the six months ended 30 June 2014 Continued performance improvement through cost reductions and production records – Sustainable cost reductions have already exceeded the full year 2014 target, with $3.2 billion of
operating cost improvements compared with 2012. A further $1 billion of sustainable operating cash cost improvements are now anticipated by the end of 2015. The rate of cost savings is expected to slow to around $250 million in the second half of 2014, due to planned operational activities, in particular the maintenance shut at the Kennecott Utah Copper smelter. In 2015 the pace of cost savings is expected to increase again, to around $750 million in 2015 compared with 2014.
– Exploration and evaluation costs reduced to $340 million in the first half. The Group expects full year expenditure to be maintained at less than $900 million going forward.
– Net headcount reduction of 2,200 across the Group’s managed operations during the first half of the year. This includes 750 roles which left the Group from divested assets.
– Strong operational performance with first half records set for iron ore production and shipments and thermal coal production. Iron ore growth predominantly consists of high quality Pilbara Blend products, the reference point for the 62 per cent index, which continue to command attractive prices.
– Extending our competitive advantages as the Pilbara’s lowest cost producer with unit cash costs of $20.40 per tonne, excluding royalties and freight, in 2014 first half, and an average realised iron ore price of $99 per wet metric tonne.
– Higher copper volumes driven by improved grades and concentrator recoveries at Kennecott Utah Copper and the ramp-up at Oyu Tolgoi. Sales exceeded production at Oyu Tolgoi as logistics commissioning issues were resolved, enabling a strong acceleration in shipments.
– Gove now operating as a bauxite export business following the curtailment of the refinery in May and is expected to ramp up export capacity to 8 million tonnes per annum (Mt/a) by the end of 2015.
Strengthening our balance sheet by increasing operating cash flows and reducing capex – Cash flows from operations of $8.7 billion, up eight per cent compared with 2013 first half, reflecting
continued cost reductions and strong volume growth. These compensated for lower prices, $0.6 billion of adverse current trade working capital movements and $0.4 billion lower dividends from Escondida.
– Capital expenditure reduced to $3.6 billion in 2014 first half. 2014 capex is now expected to be around $9 billion, $2 billion below previous guidance, with capex in 2015 expected at around $8 billion. Beyond 2015, capex is expected to be maintained at around $8 billion a year in the medium term.
– Net debt reduced to $16.1 billion at 30 June 2014, $1.9 billion less than on 31 December 2013 and $6.0 billion less than on 30 June 2013. First half 2014 cash inflows included $1.2 billion from holders of non-controlling interests relating to the Turquoise Hill Resources Ltd (Turquoise Hill) rights issue and $1.0 billion from completion of the Clermont mine divestment. In 2014 first half, the Group repaid $2.7 billion of borrowings.
Delivering results – Full ramp-up of the Pilbara iron ore expansion to 290 Mt/a achieved in May, two months ahead of
schedule. This marks a major milestone in the delivery of our Pilbara growth plan.
– The rail duplication and track work required for the 360 Mt/a expansion is now complete. Critical 360 Mt/a port infrastructure on track for anticipated completion by the end of the first half of 2015.
– The Aluminium group achieved EBITDA of $1.1 billion, up 26 per cent on 2013 first half, despite LME aluminium prices averaging nine per cent lower.
– Strong performance from the Copper group reflected increased volumes from Kennecott Utah Copper and ramp-up at Oyu Tolgoi, as well as enhanced productivity and improving cost position.
Page 3 of 49
Significant potential for growth in free cash flows – Strong cash flow generation from a low-cost diversified portfolio of world-class assets, demonstrating
considerable resilience to commodity price changes.
– Industry-leading growth in the highest margin businesses: delivering eight per cent compound annual copper-equivalent growth from 2012 to 2015.
– A strong foundation is in place for material increases in cash returns to shareholders following a reduction in net debt of $6 billion over the past year and the improved cash flow generation capability of the business.
– The Group is committed to the progressive dividend policy, with considerable capacity to further enhance this with consistent additional cash returns to shareholders in the future.
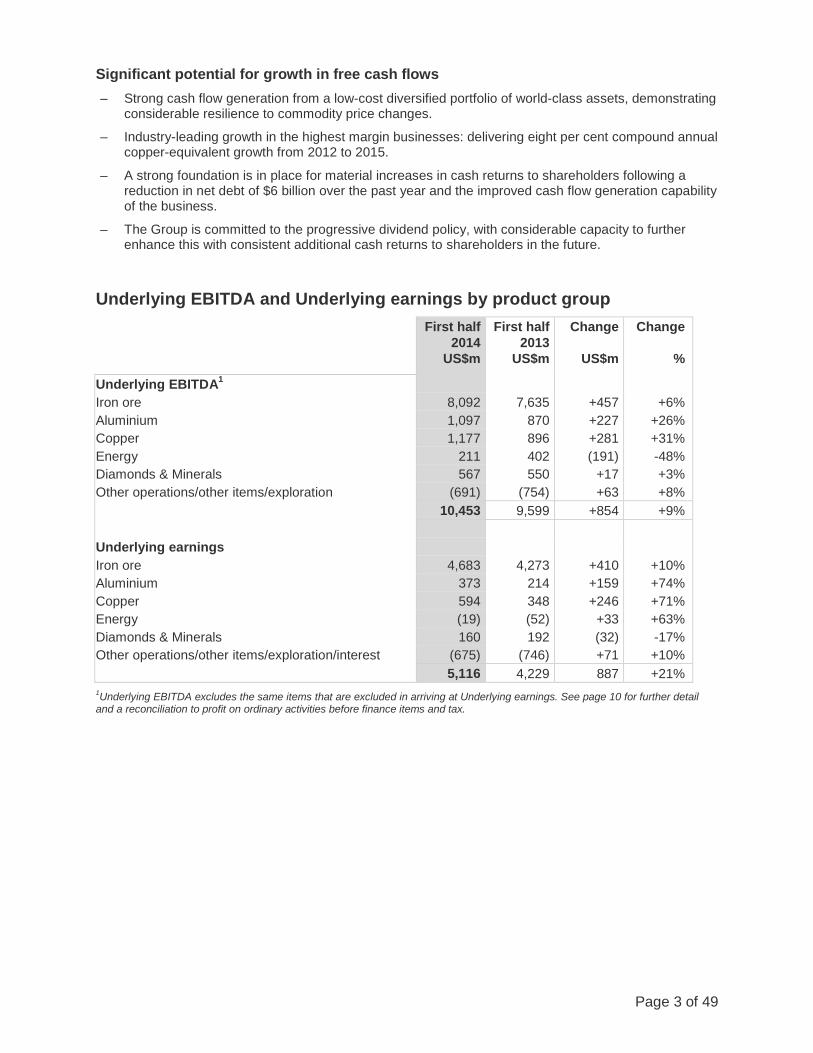
Underlying EBITDA and Underlying earnings by product group
First half 2014
US$m
First half 2013
US$m
Change
US$m
Change
%
Underlying EBITDA1 Iron ore 8,092 7,635 +457 +6% Aluminium 1,097 870 +227 +26% Copper 1,177 896 +281 +31% Energy 211 402 (191) -48% Diamonds & Minerals 567 550 +17 +3% Other operations/other items/exploration (691) (754) +63 +8% 10,453 9,599 +854 +9% Underlying earnings Iron ore 4,683 4,273 +410 +10% Aluminium 373 214 +159 +74% Copper 594 348 +246 +71% Energy (19) (52) +33 +63% Diamonds & Minerals 160 192 (32) -17% Other operations/other items/exploration/interest (675) (746) +71 +10% 5,116 4,229 887 +21% 1Underlying EBITDA excludes the same items that are excluded in arriving at Underlying earnings. See page 10 for further detail and a reconciliation to profit on ordinary activities before finance items and tax.
Page 4 of 49
Economic outlook – Overall, we remain confident of the long-term fundamentals of demand, whilst recognising the
changing nature of China’s economic development.
– Global GDP growth in 2014 is expected to exceed three per cent which will support commodity demand.
– The Chinese Government is dealing effectively with the rebalancing of its economy, with its desired GDP growth of 7.5 per cent in 2014 on target.
– Rio Tinto continues to forecast Chinese crude steel production reaching 1 billion tonnes towards 2030 as urbanisation rates approach 70 per cent. Chinese crude steel production currently stands at 830 Mt/a: steel demand in China is expected to grow by between three and four per cent in 2014 compared with 2013.
– Approximately 125 million tonnes of high-cost iron ore supply is expected to exit the market in 2014, as lower-grade producers from China and less traditional supply countries curtail production. This is expected to offset the impact of new supply to seaborne markets during 2014 from Australian and Brazilian producers.
– Recent supply increases from new copper mines has moved the copper market into surplus.
– Chinese demand for alternative sources of bauxite is expected to increase as stocks are depleted and Indonesian material remains unavailable due to the export ban.
– Aluminium supply curtailments and stronger demand are expected to mitigate the impact of regulatory changes on inventories. The market excluding China is currently in deficit.
Global growth Overall, we remain confident of the long-term fundamentals of demand, whilst recognising the changing nature of China’s economic development. Volatility in global financial markets is currently low, attributable to clear monetary policy direction from central banks, but geopolitical uncertainties, notably in Ukraine, the Middle East and the South China Sea, and economic risks could give rise to short-term fluctuations in our markets. In China, we still expect annual growth to end up near the official forecast of 7.5 per cent due to targeted expansionary policies. Endeavouring to address imbalances from its investment-led growth model, Chinese authorities are engaged in a delicate balancing act to control credit expansion while limiting loss of confidence and negative effects spreading across the national economy. The large stimulus packages of the past have been replaced with a range of tailored measures to prevent adjustments escalating into a negative spiral. Intervention has included directives to banks, a modest depreciation of the Chinese RMB to unwind speculative currency inflows and a symbolic tolerance towards small bond defaults. This intervention has been well managed so far with improvements in export growth and, to a lesser degree, manufacturing contributing to China’s GDP growth. These measures have contributed to a bearish short-term outlook in China’s property market. Weak sales growth, high inventories and financing difficulties are contributing to weak fundamentals. Offsetting this, in part, the Government is incentivising infrastructure investment. In the United States, the rebound in second quarter growth, after the negative impacts from weather disruptions earlier in the year, indicates that the backbone of the recovery seems intact. Unemployment has fallen and inflationary pressures are starting to build, once again raising questions over the timing of the first rise in the Federal Reserve rate since the global financial crisis. The Eurozone continues to flirt with deflation risks, sparking debate over quantitative easing from the European Central Bank. Growth remains unbalanced with Germany leading a stronger core while countries with high debt levels continue to lag despite bond yields being back to pre-crisis levels. While growth is returning to the Eurozone for the first time since 2011, it remains anaemic and with unresolved underlying fragilities.
Page 5 of 49
Commodities In the second half of 2014, China’s crude steel production is expected to remain at the current level of approximately 830 Mt/a, with steel demand expected to grow by between three and four per cent over the previous year. Growth in infrastructure (up around nine per cent), machinery (up around five per cent) and transport (up around 14 per cent) are expected to outweigh the weakness in residential construction activity (down around three per cent). There has also been a strong increase in Chinese finished steel exports in recent months, in particular to Japan, Korea, Taiwan and the ASEAN region with net finished steel exports approximately 40 per cent higher in 2014 first half compared with the same period of 2013. Much of the new non-Rio Tinto iron ore supply has been of lower iron ore content with higher contaminants. This has led to a more marked price differential between the 58 per cent and 62 per cent indices and greater discounting of lower-quality material by some producers. In turn, lower-grade producers from China and less-traditional supply countries have started to curtail production, with approximately 125 million tonnes of high-cost supply expected to exit the market in 2014. New mine supply has also moved the copper market into surplus over the past year, although the effects on prices have been more muted, with additional supply absorbed by Chinese bonded warehouses. Chinese corporate bond defaults in March raised concerns over a potential hardening of regulation on copper stock financing, resulting in price volatility. While more copper supply is expected to ramp up over the coming year, the long-term fundamentals remain supported by the complexity and high cost of new projects. Aluminium premiums, excluding China, reached record levels in 2014, in line with increased demand and a lack of physical supply. Regulatory changes that increase the speed with which stocks can exit LME warehouses may result in declining premiums, but supply curtailments and stronger demand should mitigate this impact with the market outside China now in deficit. Meanwhile, the ore export ban has stopped flows of Indonesian bauxite into China. The impact on prices has so far been limited as Chinese refineries had built significant inventory positions. These have begun to deplete, which could result in stronger demand for alternative bauxite supplies if Indonesian exports do not resume in the coming months.
Page 6 of 49
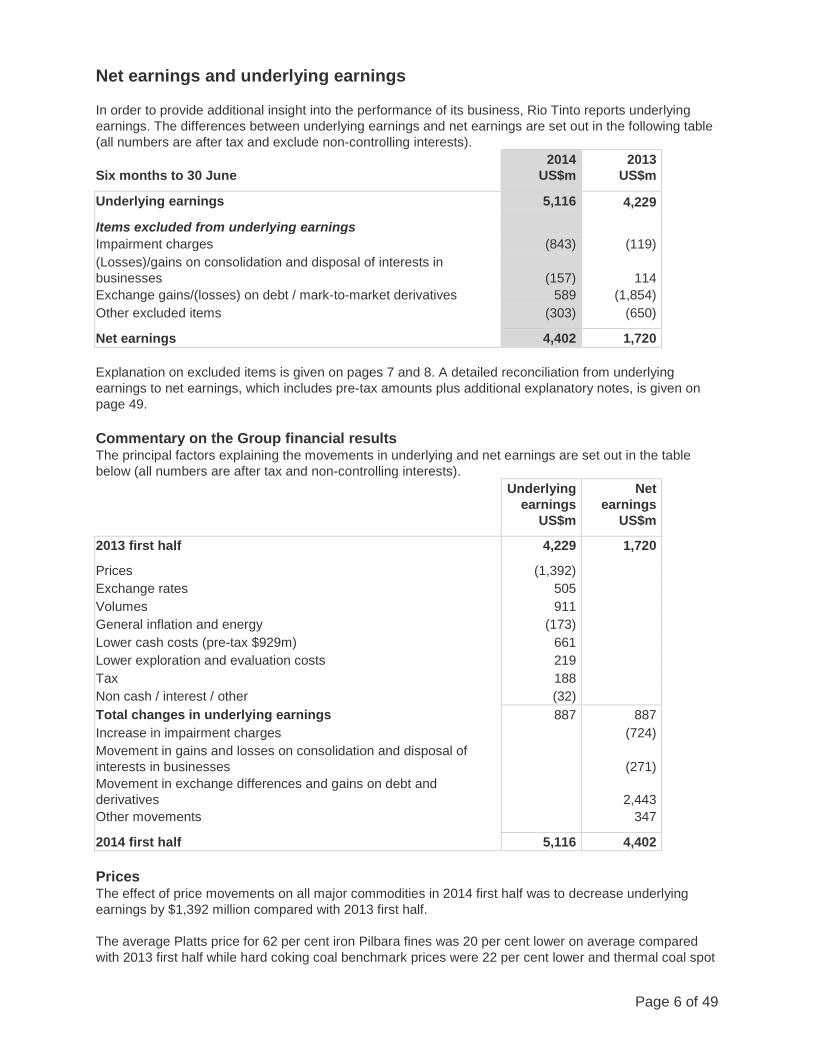
Net earnings and underlying earnings In order to provide additional insight into the performance of its business, Rio Tinto reports underlying earnings. The differences between underlying earnings and net earnings are set out in the following table (all numbers are after tax and exclude non-controlling interests). Six months to 30 June
2014 US$m
2013 US$m
Underlying earnings 5,116 4,229
Items excluded from underlying earnings
Impairment charges (843) (119) (Losses)/gains on consolidation and disposal of interests in businesses
(157)
114
Exchange gains/(losses) on debt / mark-to-market derivatives 589 (1,854) Other excluded items (303) (650)
Net earnings 4,402 1,720 Explanation on excluded items is given on pages 7 and 8. A detailed reconciliation from underlying earnings to net earnings, which includes pre-tax amounts plus additional explanatory notes, is given on page 49. Commentary on the Group financial results The principal factors explaining the movements in underlying and net earnings are set out in the table below (all numbers are after tax and non-controlling interests).
Underlying earnings
US$m
Net earnings
US$m
2013 first half 4,229 1,720
Prices (1,392) Exchange rates 505 Volumes 911 General inflation and energy (173) Lower cash costs (pre-tax $929m) 661 Lower exploration and evaluation costs 219 Tax 188 Non cash / interest / other (32) Total changes in underlying earnings 887 887 Increase in impairment charges (724) Movement in gains and losses on consolidation and disposal of interests in businesses
(271)
Movement in exchange differences and gains on debt and derivatives
2,443
Other movements 347
2014 first half 5,116 4,402 Prices The effect of price movements on all major commodities in 2014 first half was to decrease underlying earnings by $1,392 million compared with 2013 first half. The average Platts price for 62 per cent iron Pilbara fines was 20 per cent lower on average compared with 2013 first half while hard coking coal benchmark prices were 22 per cent lower and thermal coal spot
Page 7 of 49
prices averaged 16 per cent lower. Average copper prices were down nine per cent and LME prices for gold and aluminium averaged 15 and nine per cent lower, respectively. Exchange rates Compared with 2013 first half, the US dollar, on average, rose by ten per cent against the Australian dollar, by seven per cent against the Canadian dollar and by 14 per cent against the South African rand. The effect of all currency movements was to increase underlying earnings relative to 2013 first half by $505 million. Volumes Volumes enhanced earnings by $911 million compared with 2013 first half. These were achieved primarily in iron ore, where a new annual sales volume record was achieved, due to increased capacity at the Pilbara ports and productivity improvements. Volumes also rose in copper, from the recovery at Kennecott Utah Copper, in line with higher ore grades and increased throughput. Cash costs, exploration and evaluation Rio Tinto made further strong progress on its cost reduction programme and has now exceeded its $3 billion target compared with the 2012 base. In 2014 first half, the Group realised $929 million pre-tax ($661 million post tax) in operating cash cost savings. This was in addition to the $2,279 million pre-tax ($1,559 million post-tax) achieved in 2013.
Exploration and evaluation spend was reduced by $187 million (on a consolidated, pre-tax basis) in the first half. Evaluation spend has been prioritised on those projects with the greatest potential to deliver value in the medium term, with spend on certain longer dated options reduced.
In 2014 first half, the Group reduced headcount by 2,200, of which 750 roles left the Group through divested assets. Tax The 2014 first half effective corporate income tax rate on underlying earnings, excluding equity accounted units, was 30 per cent compared with 38 per cent in 2013 first half. The decreased charge was primarily attributable to lower Minerals Resource Rent Tax (MRRT) in line with lower iron ore prices and the absence of prior year tax provisions. The Group expects an effective tax rate in the range of 30 to 33 per cent in 2014. Non-cash / interest / other The Group interest charge was $17 million higher than in 2013 first half, mainly reflecting lower capitalised interest following completion of capital projects in 2013.
In 2013 first half there was a $128 million earnings impact from an iron ore royalty payable to joint venture partners following a court decision. There was no such charge in 2014 first half. Items excluded from underlying earnings Total impairment charges of $843 million were recognised in 2014 first half. As a result of further revisions to future capital required to complete the modernisation project at Kitimat in British Columbia, and related impacts on the project, the Kitimat assets were impaired by $800 million (net of tax). First production from the Kitimat Modernisation Project is expected during the first half of 2015. Other impairment charges relate to a site closure and an anticipated disposal in the aluminium portfolio.
Net losses on disposal of interests in businesses of $157 million arose mainly from indemnities provided in respect of prior disposals and further adjustments in respect of contractual obligations for product sales and delivery which remain with the Group following the sale of the Clermont mine on 29 May 2014.
Non cash exchange and derivative gains of $589 million arose primarily on US dollar debt in non-US dollar functional currency Group companies, and on intragroup balances, in addition to revaluation of certain derivatives which do not qualify for hedge accounting. The exchange gains are largely offset by currency translation losses recognised in equity and the quantum of US dollar debt, which will be repaid from US dollar sales receipts and US dollar divestment proceeds, is therefore unaffected.
Page 8 of 49
In 2013 first half, impairment charges of $119 million mainly related to a reduction in the carrying value of the Eagle nickel-copper project following the signing of a binding sales agreement. Non cash exchange losses of $1,854 million in 2013 first half arose primarily on US dollar debt in non US dollar functional currency companies. In April 2013, the Kennecott Utah Copper mine experienced a slide along a geological fault line of its north-eastern wall. Charges of $340 million were excluded from underlying earnings in 2013 first half, primarily comprising the write-off of certain deferred stripping assets and damaged equipment. Cash flow Cash flows from operations, including dividends from equity accounted units, were $8.7 billion, eight per cent higher than 2013 first half, reflecting the positive impact of higher volumes and the cost reduction initiatives. The variance was lower than the earnings momentum due to $0.6 billion of adverse current trade working capital movements and $0.5 billion lower dividends from equity accounted units, mainly related to Escondida. Tax payments in 2014 first half of $2.5 billion were $0.6 billion or 31 per cent higher than in 2013 first half driven by the move to monthly tax payments in Australia.
Purchase of property, plant and equipment and intangible assets (net of proceeds of sales of property, plant and equipment) declined by $3.4 billion or 48 per cent to $3.6 billion in 2014 first half, following the completion of five major capital projects in 2013 (Pilbara iron ore infrastructure expansion to 290 Mt/a, Oyu Tolgoi copper/gold mine, AP60 aluminium smelter, Kestrel coking coal mine and Argyle underground diamonds mine). Ongoing capital projects include the second phase expansion of the Pilbara iron ore infrastructure to 360 Mt/a, due to come on-stream at the end of the first half of 2015, and the modernisation of the Kitimat aluminium smelter in British Columbia which is due to be commissioned in the first half of 2015.
Disposal of businesses of $1.0 billion in 2014 first half reflect the sale of the Group’s interests in the Clermont thermal coal mine which completed on 29 May 2014.
Dividends paid in 2014 first half of $2.0 billion reflected the 15 per cent increase in the 2013 final dividend paid in April 2014.
In January 2014, $1.2 billion from the Turquoise Hill rights offering was recognised as proceeds from issue of equity to holders of non-controlling interests. Statement of financial position Net debt (see page 36) decreased from $18.1 billion at 31 December 2013 to $16.1 billion at 30 June 2014 as operating cash inflows and proceeds from divestments and the Turquoise Hill rights offering more than compensated for the outflows relating to capital expenditure and the increase in the dividend. Net debt to total capital was 22 per cent at 30 June 2014 (31 December 2013: 25 per cent) and interest cover was 12 times, unchanged from 2013 first half.
Adjusted total borrowings at 30 June 2014 were $25.7 billion. The weighted average cost of total borrowings was approximately four per cent and the weighted average maturity was around nine years. The maximum amount, within non-current borrowings, maturing in any one calendar year was $3.3 billion. At 30 June 2014, approximately three quarters of Rio Tinto’s total borrowings were at fixed interest rates.
In 2014 first half, the group repaid a net $2.7 billion of borrowings including the maturity of $2.5 billion of bonds and $0.2 billion of commercial paper.
Cash and cash equivalents at 30 June 2014 were $9.6 billion (31 December 2013: $10.2 billion). Profit for the period Net earnings and underlying earnings, which are the focus of the commentary in this report, refer to amounts attributable to owners of Rio Tinto. Net earnings attributable to the owners of Rio Tinto in 2014 first half totalled $4,402 million (2013 first half: $1,720 million). The Group recorded a profit in 2014 first half of $4,285 million (2013 first half: $1,685 million) of which a loss of $117 million (2013 first half: loss of $35 million) was attributable to non-controlling interests.
Page 9 of 49
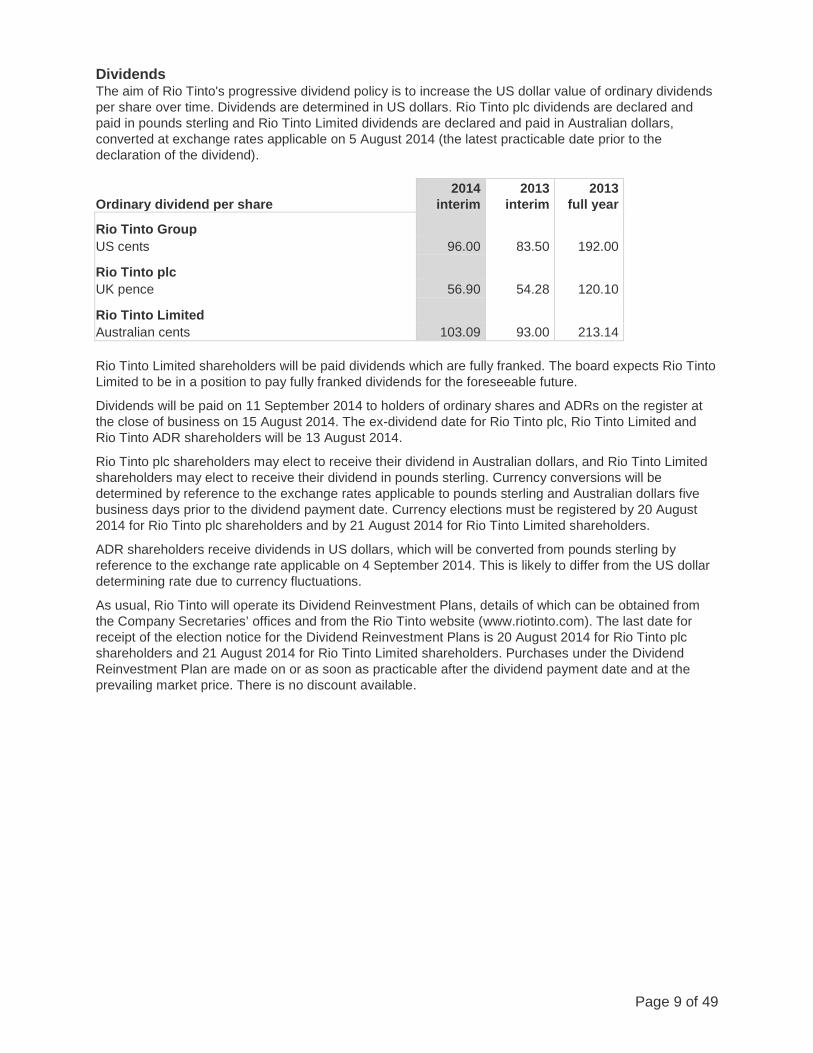
Dividends The aim of Rio Tinto's progressive dividend policy is to increase the US dollar value of ordinary dividends per share over time. Dividends are determined in US dollars. Rio Tinto plc dividends are declared and paid in pounds sterling and Rio Tinto Limited dividends are declared and paid in Australian dollars, converted at exchange rates applicable on 5 August 2014 (the latest practicable date prior to the declaration of the dividend). Ordinary dividend per share
2014 interim
2013 interim
2013 full year
Rio Tinto Group US cents 96.00 83.50 192.00
Rio Tinto plc UK pence 56.90 54.28 120.10
Rio Tinto Limited Australian cents 103.09 93.00 213.14 Rio Tinto Limited shareholders will be paid dividends which are fully franked. The board expects Rio Tinto Limited to be in a position to pay fully franked dividends for the foreseeable future.
Dividends will be paid on 11 September 2014 to holders of ordinary shares and ADRs on the register at the close of business on 15 August 2014. The ex-dividend date for Rio Tinto plc, Rio Tinto Limited and Rio Tinto ADR shareholders will be 13 August 2014.
Rio Tinto plc shareholders may elect to receive their dividend in Australian dollars, and Rio Tinto Limited shareholders may elect to receive their dividend in pounds sterling. Currency conversions will be determined by reference to the exchange rates applicable to pounds sterling and Australian dollars five business days prior to the dividend payment date. Currency elections must be registered by 20 August 2014 for Rio Tinto plc shareholders and by 21 August 2014 for Rio Tinto Limited shareholders.
ADR shareholders receive dividends in US dollars, which will be converted from pounds sterling by reference to the exchange rate applicable on 4 September 2014. This is likely to differ from the US dollar determining rate due to currency fluctuations.
As usual, Rio Tinto will operate its Dividend Reinvestment Plans, details of which can be obtained from the Company Secretaries’ offices and from the Rio Tinto website (www.riotinto.com). The last date for receipt of the election notice for the Dividend Reinvestment Plans is 20 August 2014 for Rio Tinto plc shareholders and 21 August 2014 for Rio Tinto Limited shareholders. Purchases under the Dividend Reinvestment Plan are made on or as soon as practicable after the dividend payment date and at the prevailing market price. There is no discount available.
Page 10 of 49
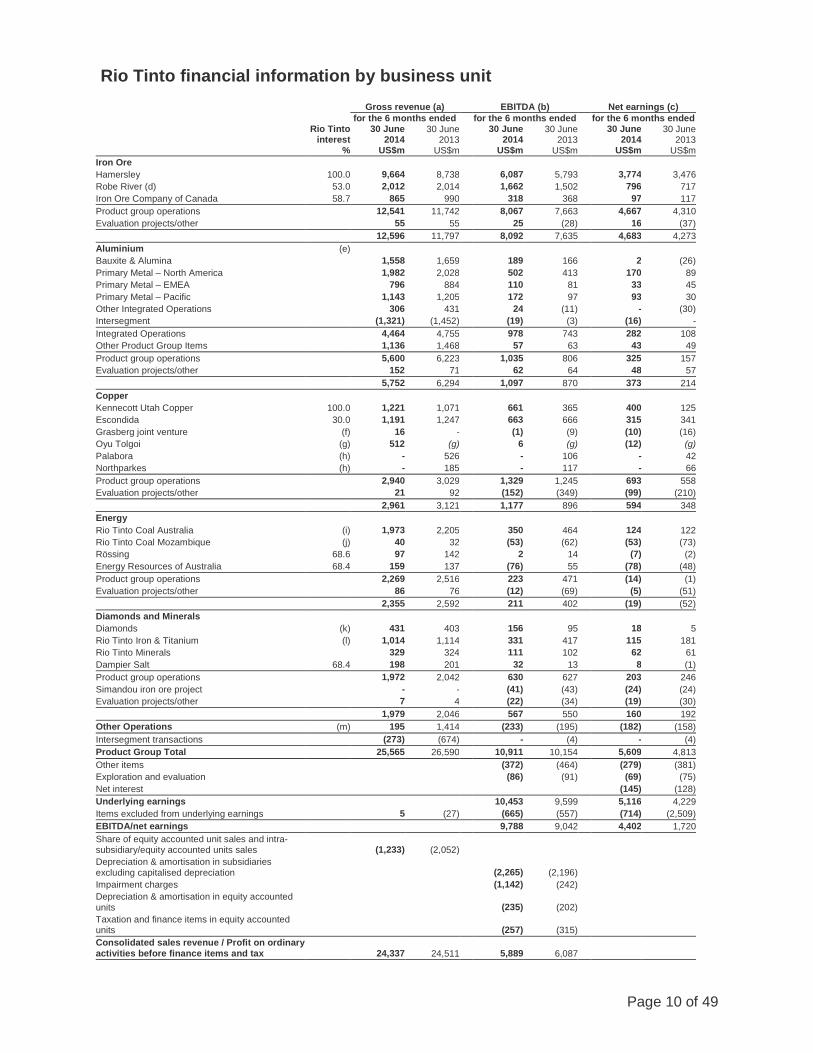
Rio Tinto financial information by business unit
Rio Tinto interest
%
Gross revenue (a) EBITDA (b) Net earnings (c) for the 6 months ended for the 6 months ended for the 6 months ended
30 June 2014
US$m
30 June 2013
US$m
30 June 2014
US$m
30 June 2013
US$m
30 June 2014
US$m
30 June 2013
US$m Iron Ore Hamersley 100.0 9,664 8,738 6,087 5,793 3,774 3,476 Robe River (d) 53.0 2,012 2,014 1,662 1,502 796 717 Iron Ore Company of Canada 58.7 865 990 318 368 97 117 Product group operations 12,541 11,742 8,067 7,663 4,667 4,310 Evaluation projects/other 55 55 25 (28) 16 (37) 12,596 11,797 8,092 7,635 4,683 4,273 Aluminium (e) Bauxite & Alumina 1,558 1,659 189 166 2 (26) Primary Metal – North America 1,982 2,028 502 413 170 89 Primary Metal – EMEA 796 884 110 81 33 45 Primary Metal – Pacific 1,143 1,205 172 97 93 30 Other Integrated Operations 306 431 24 (11) - (30) Intersegment (1,321) (1,452) (19) (3) (16) - Integrated Operations 4,464 4,755 978 743 282 108 Other Product Group Items 1,136 1,468 57 63 43 49 Product group operations 5,600 6,223 1,035 806 325 157 Evaluation projects/other 152 71 62 64 48 57 5,752 6,294 1,097 870 373 214 Copper Kennecott Utah Copper 100.0 1,221 1,071 661 365 400 125 Escondida 30.0 1,191 1,247 663 666 315 341 Grasberg joint venture (f) 16 - (1) (9) (10) (16) Oyu Tolgoi (g) 512 (g) 6 (g) (12) (g) Palabora (h) - 526 - 106 - 42 Northparkes (h) - 185 - 117 - 66 Product group operations 2,940 3,029 1,329 1,245 693 558 Evaluation projects/other 21 92 (152) (349) (99) (210) 2,961 3,121 1,177 896 594 348 Energy Rio Tinto Coal Australia (i) 1,973 2,205 350 464 124 122 Rio Tinto Coal Mozambique (j) 40 32 (53) (62) (53) (73) Rössing 68.6 97 142 2 14 (7) (2) Energy Resources of Australia 68.4 159 137 (76) 55 (78) (48) Product group operations 2,269 2,516 223 471 (14) (1) Evaluation projects/other 86 76 (12) (69) (5) (51) 2,355 2,592 211 402 (19) (52) Diamonds and Minerals Diamonds (k) 431 403 156 95 18 5 Rio Tinto Iron & Titanium (l) 1,014 1,114 331 417 115 181 Rio Tinto Minerals 329 324 111 102 62 61 Dampier Salt 68.4 198 201 32 13 8 (1) Product group operations 1,972 2,042 630 627 203 246 Simandou iron ore project - - (41) (43) (24) (24) Evaluation projects/other 7 4 (22) (34) (19) (30) 1,979 2,046 567 550 160 192 Other Operations (m) 195 1,414 (233) (195) (182) (158) Intersegment transactions (273) (674) - (4) - (4) Product Group Total 25,565 26,590 10,911 10,154 5,609 4,813 Other items (372) (464) (279) (381) Exploration and evaluation (86) (91) (69) (75) Net interest (145) (128) Underlying earnings 10,453 9,599 5,116 4,229 Items excluded from underlying earnings 5 (27) (665) (557) (714) (2,509) EBITDA/net earnings 9,788 9,042 4,402 1,720 Share of equity accounted unit sales and intra-subsidiary/equity accounted units sales (1,233) (2,052)
Depreciation & amortisation in subsidiaries excluding capitalised depreciation
(2,265) (2,196)
Impairment charges (1,142) (242) Depreciation & amortisation in equity accounted units
(235) (202)
Taxation and finance items in equity accounted units
(257) (315)
Consolidated sales revenue / Profit on ordinary activities before finance items and tax 24,337 24,511
5,889 6,087
Page 11 of 49
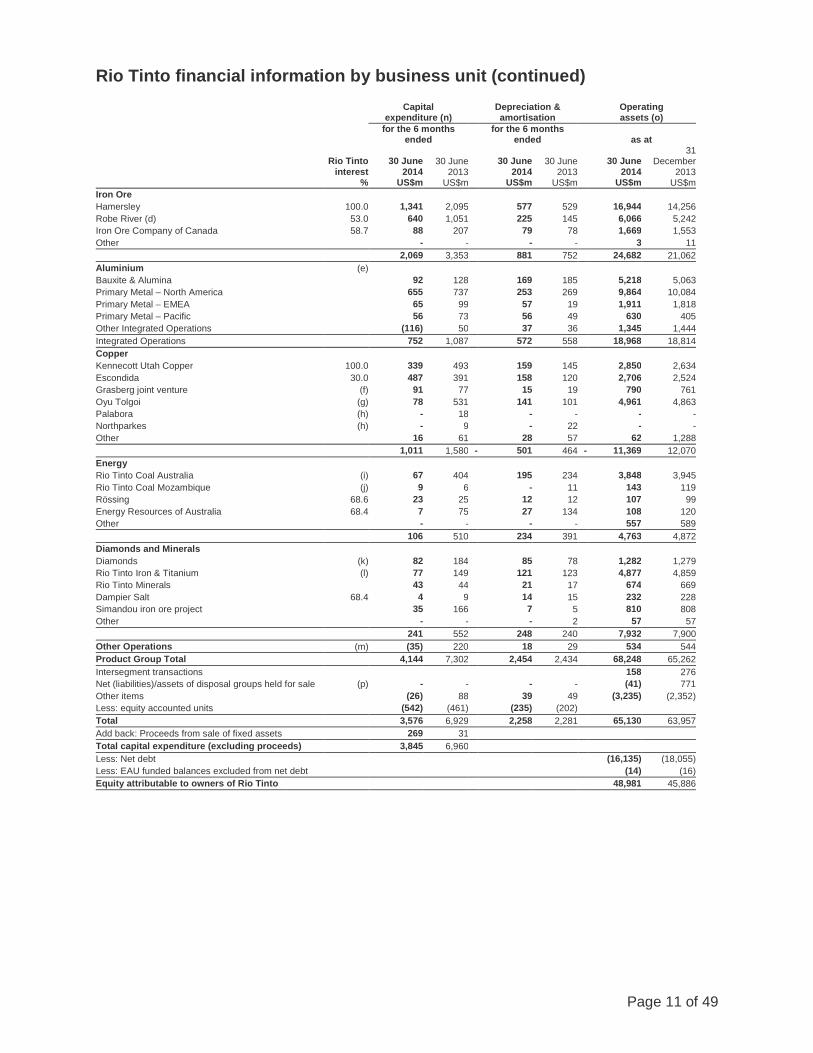
Rio Tinto financial information by business unit (continued)
Rio Tinto interest
%
Capital expenditure (n)
Depreciation & amortisation
Operating assets (o)
for the 6 months ended
for the 6 months ended as at
30 June 2014
US$m
30 June 2013
US$m
30 June 2014
US$m
30 June 2013
US$m
30 June 2014
US$m
31 December
2013 US$m
Iron Ore Hamersley 100.0 1,341 2,095 577 529 16,944 14,256 Robe River (d) 53.0 640 1,051 225 145 6,066 5,242 Iron Ore Company of Canada 58.7 88 207 79 78 1,669 1,553 Other - - - - 3 11
2,069 3,353 881 752 24,682 21,062 Aluminium (e) Bauxite & Alumina 92 128 169 185 5,218 5,063 Primary Metal – North America 655 737 253 269 9,864 10,084 Primary Metal – EMEA 65 99 57 19 1,911 1,818 Primary Metal – Pacific 56 73 56 49 630 405 Other Integrated Operations (116) 50 37 36 1,345 1,444 Integrated Operations 752 1,087 572 558 18,968 18,814 Copper Kennecott Utah Copper 100.0 339 493 159 145 2,850 2,634 Escondida 30.0 487 391 158 120 2,706 2,524 Grasberg joint venture (f) 91 77 15 19 790 761 Oyu Tolgoi (g) 78 531 141 101 4,961 4,863 Palabora (h) - 18 - - - - Northparkes (h) - 9 - 22 - - Other 16 61 28 57 62 1,288 1,011 1,580 - 501 464 - 11,369 12,070 Energy Rio Tinto Coal Australia (i) 67 404 195 234 3,848 3,945 Rio Tinto Coal Mozambique (j) 9 6 - 11 143 119 Rössing 68.6 23 25 12 12 107 99 Energy Resources of Australia 68.4 7 75 27 134 108 120 Other - - - - 557 589 106 510 234 391 4,763 4,872 Diamonds and Minerals Diamonds (k) 82 184 85 78 1,282 1,279 Rio Tinto Iron & Titanium (l) 77 149 121 123 4,877 4,859 Rio Tinto Minerals 43 44 21 17 674 669 Dampier Salt 68.4 4 9 14 15 232 228 Simandou iron ore project 35 166 7 5 810 808 Other - - - 2 57 57 241 552 248 240 7,932 7,900 Other Operations (m) (35) 220 18 29 534 544 Product Group Total 4,144 7,302 2,454 2,434 68,248 65,262 Intersegment transactions 158 276 Net (liabilities)/assets of disposal groups held for sale (p) - - - - (41) 771 Other items (26) 88 39 49 (3,235) (2,352) Less: equity accounted units (542) (461) (235) (202) Total 3,576 6,929 2,258 2,281 65,130 63,957 Add back: Proceeds from sale of fixed assets 269 31 Total capital expenditure (excluding proceeds) 3,845 6,960 Less: Net debt (16,135) (18,055) Less: EAU funded balances excluded from net debt (14) (16) Equity attributable to owners of Rio Tinto 48,981 45,886
Page 12 of 49
Notes to financial information by business unit Business units are classified according to the Group’s management structure. Where presentational revisions are made, comparative amounts are adjusted accordingly.
(a) Includes 100 per cent of subsidiaries' sales revenue and the Group's share of the sales revenue of equity accounted units (after adjusting for sales to subsidiaries).
(b) EBITDA of subsidiaries and the Group's share of EBITDA relating to equity accounted units represents profit before: tax, net finance items, depreciation and amortisation charged to the income statement in the year. Underlying EBITDA excludes the same items that are excluded from Underlying earnings.
(c) Represents profit after tax for the period attributable to the owners of Rio Tinto. Business unit earnings are stated before finance items but after the amortisation of discount related to provisions. Earnings attributed to business units do not include amounts that are excluded in arriving at Underlying earnings.
(d) The Group holds 65 per cent of Robe River Iron Associates, of which 30 per cent is held through a 60 per cent owned subsidiary. The Group's net beneficial interest is, therefore, 53 per cent.
(e) Presented on an integrated operations basis splitting activities between Bauxite and Alumina, Primary Metal and Other integrated operations (which in total reflect the results of the integrated production of aluminium) and Other product group items which relate to other commercial activities. Following reintegration in 2013, the four aluminium smelters and the Gove bauxite mine previously grouped within Pacific Aluminium in Other Operations are included within the Aluminium group. The Gove alumina refinery is reported within Other Operations.
(f) Under the terms of a contractual agreement, Rio Tinto is entitled to 40 per cent of additional material mined as a consequence of expansions and developments of the Grasberg facilities since 1998.
(g) Rio Tinto’s interest in Oyu Tolgoi LLC is held indirectly through its 50.8 per cent investment in Turquoise Hill which in turn owns 66 per cent of Oyu Tolgoi. The results of Oyu Tolgoi prior to commissioning are included within evaluation projects / other for the six months ended 30 June 2013.
(h) Rio Tinto completed the divestment of its 57.7 per cent interest in Palabora Mining Company on 31 July 2013 and of its 80 per cent interest in the Northparkes mine on 1 December 2013.
(i) Includes Rio Tinto's 80 per cent interest in Coal & Allied, through which Rio Tinto holds its beneficial interests in Bengalla, Mount Thorley and Warkworth of 32 per cent, 64 per cent and 44.5 per cent respectively.
(j) Principal interests are the Benga project, a 65:35 joint venture with Tata Steel Limited, which is equity accounted, and the wholly owned Zambeze coal project.
(k) Includes Rio Tinto's interests in Argyle (100 per cent), Diavik (60 per cent) and Murowa (77.8 per cent).
(l) Includes Rio Tinto's interests in Rio Tinto Fer et Titane (‘RTFT’) (100 per cent), QIT Madagascar Minerals (80 per cent) and Richards Bay Minerals (‘RBM’, attributable interest of 74 per cent).
(m) Other Operations include Rio Tinto’s 100 per cent interest in the Gove alumina refinery (refer to note e) and Rio Tinto Marine. During 2013, Rio Tinto completed the sale of Constellium and the Sebree aluminium smelter.
(n) Capital expenditure comprises the net cash outflow on purchases less disposals of property, plant and equipment, capitalised evaluation costs and purchases less disposals of other intangible assets. The details provided include 100 per cent of subsidiaries' capital expenditure and Rio Tinto's share of the capital expenditure of equity accounted units.
(o) Operating assets of subsidiaries comprise net assets excluding post retirement assets and liabilities, net of tax, and are before deducting net debt. Operating assets are stated after deduction of non-controlling interests, which are calculated by reference to the net assets of the relevant companies (i.e. inclusive of such companies' debt and amounts due to or from Rio Tinto Group companies). In addition, Oyu Tolgoi’s operating assets are shown net of Turquoise Hill’s public shareholders’ interest in intragroup receivables from Oyu Tolgoi, previously shown in Other Copper. Comparative amounts have been adjusted accordingly.
(p) Comprising Rio Tinto’s interests in the Blair Athol thermal coal mine and assets and liabilities relating to the anticipated disposal of Sør-Norge Aluminium. Net assets held for sale at 31 December 2013 comprised the Clermont and Blair Athol thermal coal mines, and the Zululand Anthracite Colliery (ZAC) which is no longer reported as held for sale. Amounts are presented after deducting non-controlling interests, including the non-controlling interests’ share of third party net debt and balances owed with Rio Tinto Group subsidiaries.
Page 13 of 49
Review of operations Iron Ore
First half 2014
First half 2013
Change
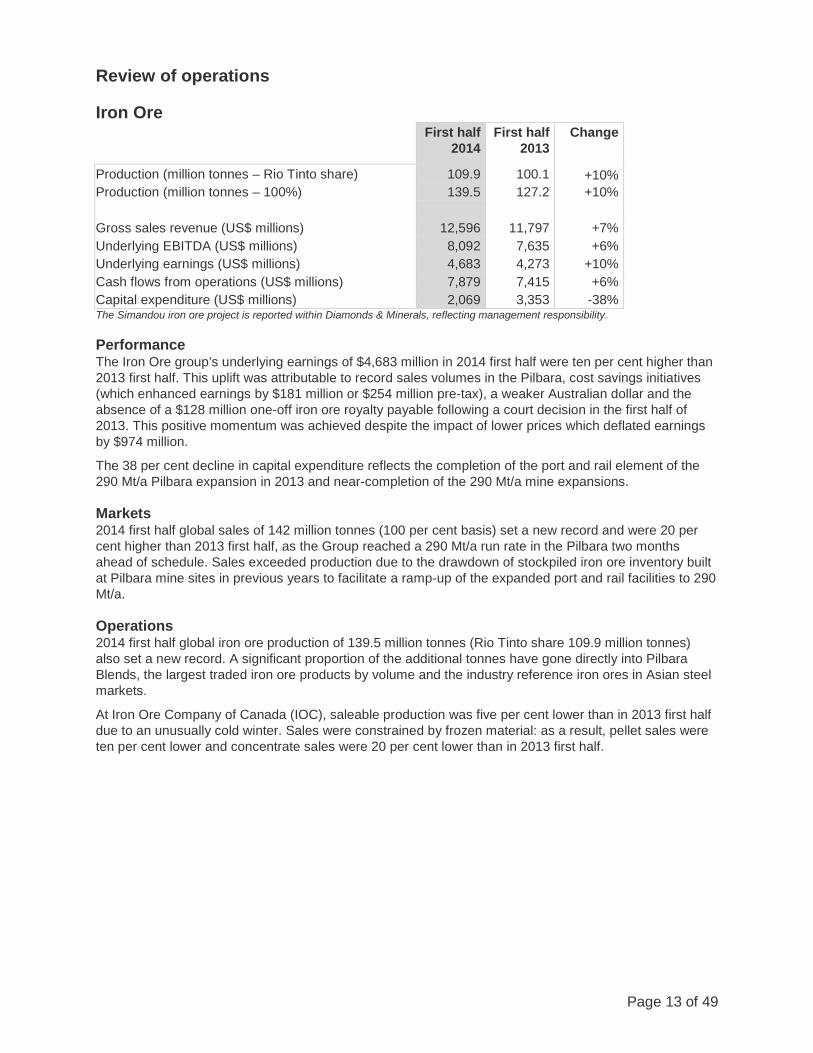
Production (million tonnes – Rio Tinto share) 109.9 100.1 +10% Production (million tonnes – 100%) 139.5 127.2 +10% Gross sales revenue (US$ millions) 12,596 11,797 +7% Underlying EBITDA (US$ millions) 8,092 7,635 +6% Underlying earnings (US$ millions) 4,683 4,273 +10% Cash flows from operations (US$ millions) 7,879 7,415 +6% Capital expenditure (US$ millions) 2,069 3,353 -38% The Simandou iron ore project is reported within Diamonds & Minerals, reflecting management responsibility. Performance The Iron Ore group’s underlying earnings of $4,683 million in 2014 first half were ten per cent higher than 2013 first half. This uplift was attributable to record sales volumes in the Pilbara, cost savings initiatives (which enhanced earnings by $181 million or $254 million pre-tax), a weaker Australian dollar and the absence of a $128 million one-off iron ore royalty payable following a court decision in the first half of 2013. This positive momentum was achieved despite the impact of lower prices which deflated earnings by $974 million.
The 38 per cent decline in capital expenditure reflects the completion of the port and rail element of the 290 Mt/a Pilbara expansion in 2013 and near-completion of the 290 Mt/a mine expansions. Markets 2014 first half global sales of 142 million tonnes (100 per cent basis) set a new record and were 20 per cent higher than 2013 first half, as the Group reached a 290 Mt/a run rate in the Pilbara two months ahead of schedule. Sales exceeded production due to the drawdown of stockpiled iron ore inventory built at Pilbara mine sites in previous years to facilitate a ramp-up of the expanded port and rail facilities to 290 Mt/a. Operations 2014 first half global iron ore production of 139.5 million tonnes (Rio Tinto share 109.9 million tonnes) also set a new record. A significant proportion of the additional tonnes have gone directly into Pilbara Blends, the largest traded iron ore products by volume and the industry reference iron ores in Asian steel markets.
At Iron Ore Company of Canada (IOC), saleable production was five per cent lower than in 2013 first half due to an unusually cold winter. Sales were constrained by frozen material: as a result, pellet sales were ten per cent lower and concentrate sales were 20 per cent lower than in 2013 first half.
Page 14 of 49
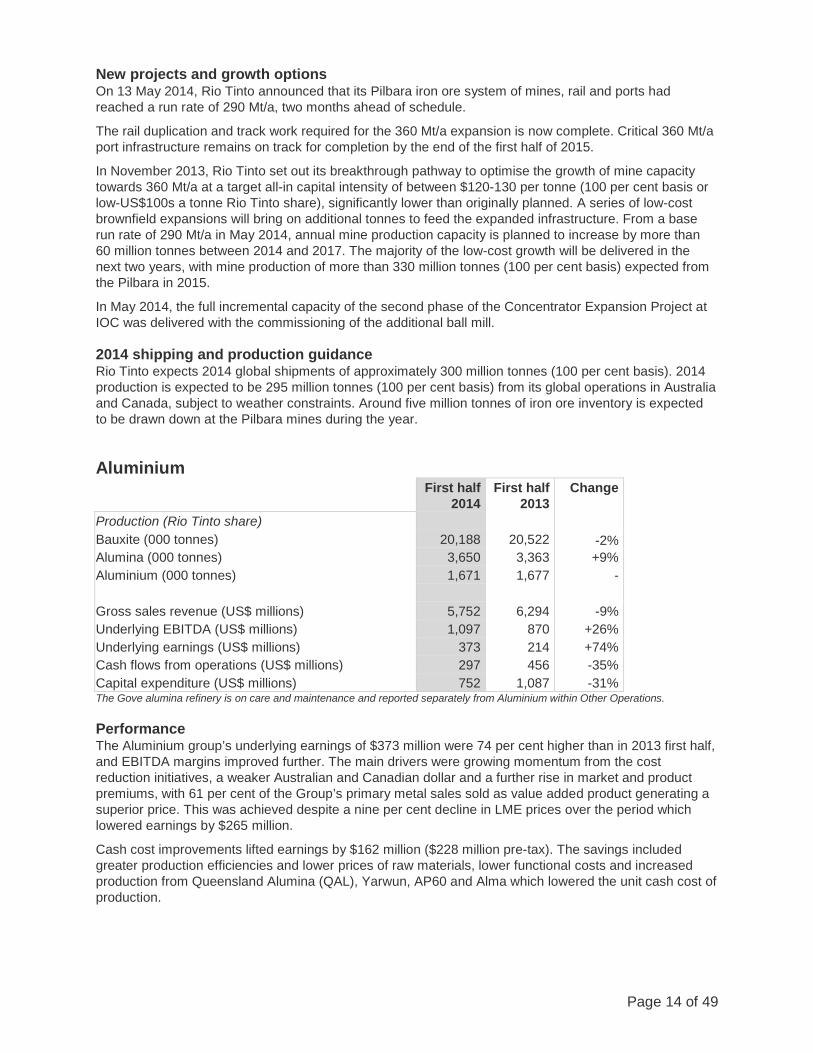
New projects and growth options On 13 May 2014, Rio Tinto announced that its Pilbara iron ore system of mines, rail and ports had reached a run rate of 290 Mt/a, two months ahead of schedule.
The rail duplication and track work required for the 360 Mt/a expansion is now complete. Critical 360 Mt/a port infrastructure remains on track for completion by the end of the first half of 2015.
In November 2013, Rio Tinto set out its breakthrough pathway to optimise the growth of mine capacity towards 360 Mt/a at a target all-in capital intensity of between $120-130 per tonne (100 per cent basis or low-US$100s a tonne Rio Tinto share), significantly lower than originally planned. A series of low-cost brownfield expansions will bring on additional tonnes to feed the expanded infrastructure. From a base run rate of 290 Mt/a in May 2014, annual mine production capacity is planned to increase by more than 60 million tonnes between 2014 and 2017. The majority of the low-cost growth will be delivered in the next two years, with mine production of more than 330 million tonnes (100 per cent basis) expected from the Pilbara in 2015.
In May 2014, the full incremental capacity of the second phase of the Concentrator Expansion Project at IOC was delivered with the commissioning of the additional ball mill. 2014 shipping and production guidance Rio Tinto expects 2014 global shipments of approximately 300 million tonnes (100 per cent basis). 2014 production is expected to be 295 million tonnes (100 per cent basis) from its global operations in Australia and Canada, subject to weather constraints. Around five million tonnes of iron ore inventory is expected to be drawn down at the Pilbara mines during the year. Aluminium
First half
2014 First half
2013 Change
Production (Rio Tinto share) Bauxite (000 tonnes) 20,188 20,522 -2% Alumina (000 tonnes) 3,650 3,363 +9% Aluminium (000 tonnes) 1,671 1,677 - Gross sales revenue (US$ millions) 5,752 6,294 -9% Underlying EBITDA (US$ millions) 1,097 870 +26% Underlying earnings (US$ millions) 373 214 +74% Cash flows from operations (US$ millions) 297 456 -35% Capital expenditure (US$ millions) 752 1,087 -31% The Gove alumina refinery is on care and maintenance and reported separately from Aluminium within Other Operations. Performance The Aluminium group’s underlying earnings of $373 million were 74 per cent higher than in 2013 first half, and EBITDA margins improved further. The main drivers were growing momentum from the cost reduction initiatives, a weaker Australian and Canadian dollar and a further rise in market and product premiums, with 61 per cent of the Group’s primary metal sales sold as value added product generating a superior price. This was achieved despite a nine per cent decline in LME prices over the period which lowered earnings by $265 million.
Cash cost improvements lifted earnings by $162 million ($228 million pre-tax). The savings included greater production efficiencies and lower prices of raw materials, lower functional costs and increased production from Queensland Alumina (QAL), Yarwun, AP60 and Alma which lowered the unit cash cost of production.
Page 15 of 49
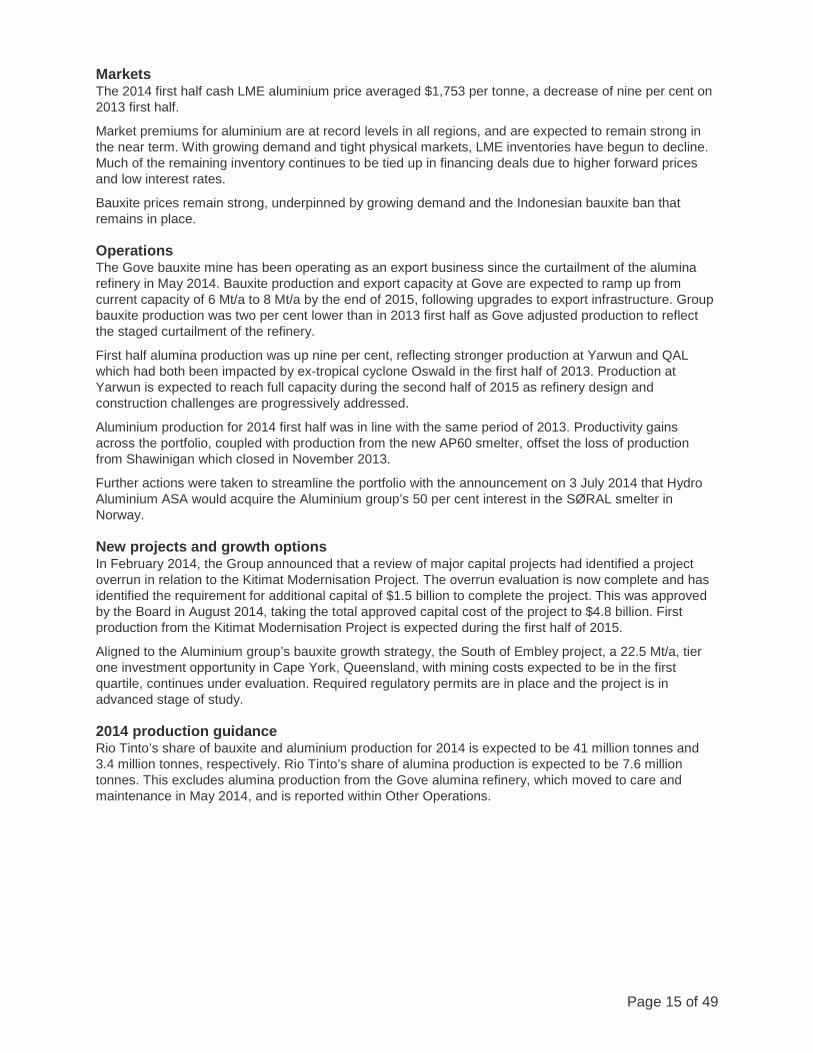
Markets The 2014 first half cash LME aluminium price averaged $1,753 per tonne, a decrease of nine per cent on 2013 first half.
Market premiums for aluminium are at record levels in all regions, and are expected to remain strong in the near term. With growing demand and tight physical markets, LME inventories have begun to decline. Much of the remaining inventory continues to be tied up in financing deals due to higher forward prices and low interest rates.
Bauxite prices remain strong, underpinned by growing demand and the Indonesian bauxite ban that remains in place. Operations The Gove bauxite mine has been operating as an export business since the curtailment of the alumina refinery in May 2014. Bauxite production and export capacity at Gove are expected to ramp up from current capacity of 6 Mt/a to 8 Mt/a by the end of 2015, following upgrades to export infrastructure. Group bauxite production was two per cent lower than in 2013 first half as Gove adjusted production to reflect the staged curtailment of the refinery.
First half alumina production was up nine per cent, reflecting stronger production at Yarwun and QAL which had both been impacted by ex-tropical cyclone Oswald in the first half of 2013. Production at Yarwun is expected to reach full capacity during the second half of 2015 as refinery design and construction challenges are progressively addressed.
Aluminium production for 2014 first half was in line with the same period of 2013. Productivity gains across the portfolio, coupled with production from the new AP60 smelter, offset the loss of production from Shawinigan which closed in November 2013.
Further actions were taken to streamline the portfolio with the announcement on 3 July 2014 that Hydro Aluminium ASA would acquire the Aluminium group’s 50 per cent interest in the SØRAL smelter in Norway. New projects and growth options In February 2014, the Group announced that a review of major capital projects had identified a project overrun in relation to the Kitimat Modernisation Project. The overrun evaluation is now complete and has identified the requirement for additional capital of $1.5 billion to complete the project. This was approved by the Board in August 2014, taking the total approved capital cost of the project to $4.8 billion. First production from the Kitimat Modernisation Project is expected during the first half of 2015.
Aligned to the Aluminium group’s bauxite growth strategy, the South of Embley project, a 22.5 Mt/a, tier one investment opportunity in Cape York, Queensland, with mining costs expected to be in the first quartile, continues under evaluation. Required regulatory permits are in place and the project is in advanced stage of study. 2014 production guidance Rio Tinto’s share of bauxite and aluminium production for 2014 is expected to be 41 million tonnes and 3.4 million tonnes, respectively. Rio Tinto’s share of alumina production is expected to be 7.6 million tonnes. This excludes alumina production from the Gove alumina refinery, which moved to care and maintenance in May 2014, and is reported within Other Operations.
Page 16 of 49
Copper
First half
2014 First half
2013 Change
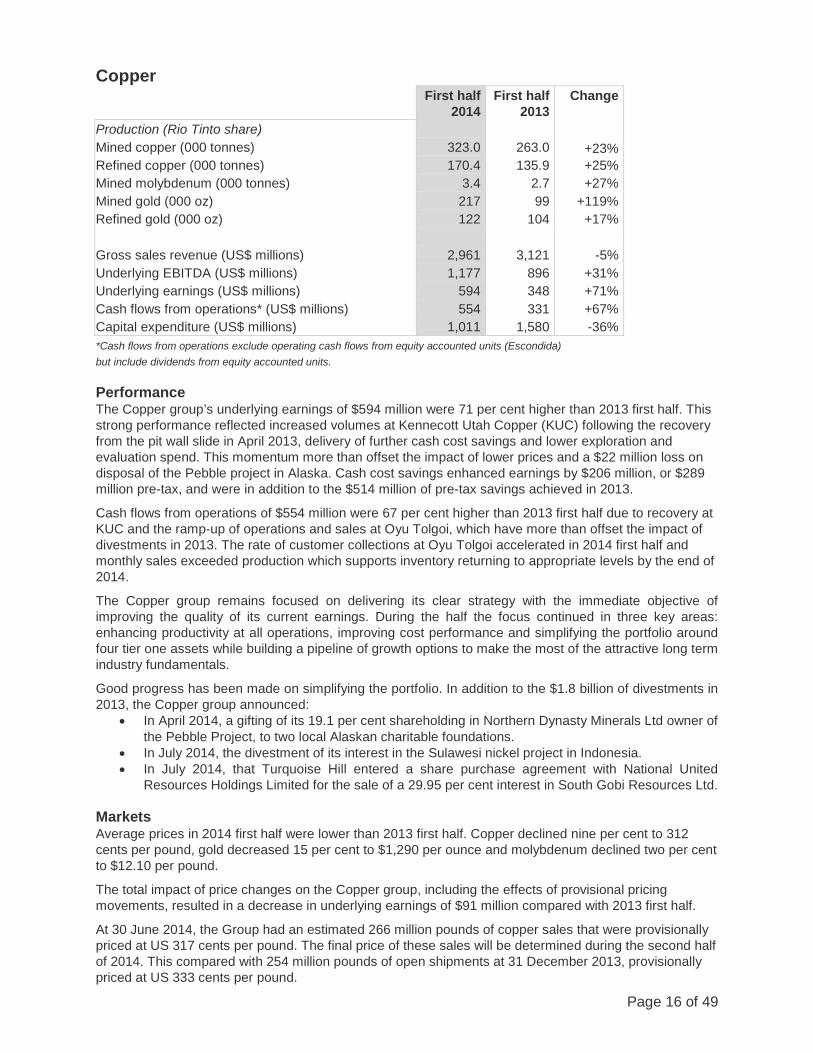
Production (Rio Tinto share) Mined copper (000 tonnes) 323.0 263.0 +23% Refined copper (000 tonnes) 170.4 135.9 +25% Mined molybdenum (000 tonnes) 3.4 2.7 +27% Mined gold (000 oz) 217 99 +119% Refined gold (000 oz) 122 104 +17% Gross sales revenue (US$ millions) 2,961 3,121 -5% Underlying EBITDA (US$ millions) 1,177 896 +31% Underlying earnings (US$ millions) 594 348 +71% Cash flows from operations* (US$ millions) 554 331 +67% Capital expenditure (US$ millions) 1,011 1,580 -36% *Cash flows from operations exclude operating cash flows from equity accounted units (Escondida) but include dividends from equity accounted units. Performance The Copper group’s underlying earnings of $594 million were 71 per cent higher than 2013 first half. This strong performance reflected increased volumes at Kennecott Utah Copper (KUC) following the recovery from the pit wall slide in April 2013, delivery of further cash cost savings and lower exploration and evaluation spend. This momentum more than offset the impact of lower prices and a $22 million loss on disposal of the Pebble project in Alaska. Cash cost savings enhanced earnings by $206 million, or $289 million pre-tax, and were in addition to the $514 million of pre-tax savings achieved in 2013.
Cash flows from operations of $554 million were 67 per cent higher than 2013 first half due to recovery at KUC and the ramp-up of operations and sales at Oyu Tolgoi, which have more than offset the impact of divestments in 2013. The rate of customer collections at Oyu Tolgoi accelerated in 2014 first half and monthly sales exceeded production which supports inventory returning to appropriate levels by the end of 2014.
The Copper group remains focused on delivering its clear strategy with the immediate objective of improving the quality of its current earnings. During the half the focus continued in three key areas: enhancing productivity at all operations, improving cost performance and simplifying the portfolio around four tier one assets while building a pipeline of growth options to make the most of the attractive long term industry fundamentals.
Good progress has been made on simplifying the portfolio. In addition to the $1.8 billion of divestments in 2013, the Copper group announced:
• In April 2014, a gifting of its 19.1 per cent shareholding in Northern Dynasty Minerals Ltd owner of the Pebble Project, to two local Alaskan charitable foundations.
• In July 2014, the divestment of its interest in the Sulawesi nickel project in Indonesia. • In July 2014, that Turquoise Hill entered a share purchase agreement with National United
Resources Holdings Limited for the sale of a 29.95 per cent interest in South Gobi Resources Ltd. Markets Average prices in 2014 first half were lower than 2013 first half. Copper declined nine per cent to 312 cents per pound, gold decreased 15 per cent to $1,290 per ounce and molybdenum declined two per cent to $12.10 per pound.
The total impact of price changes on the Copper group, including the effects of provisional pricing movements, resulted in a decrease in underlying earnings of $91 million compared with 2013 first half.
At 30 June 2014, the Group had an estimated 266 million pounds of copper sales that were provisionally priced at US 317 cents per pound. The final price of these sales will be determined during the second half of 2014. This compared with 254 million pounds of open shipments at 31 December 2013, provisionally priced at US 333 cents per pound.
Page 17 of 49
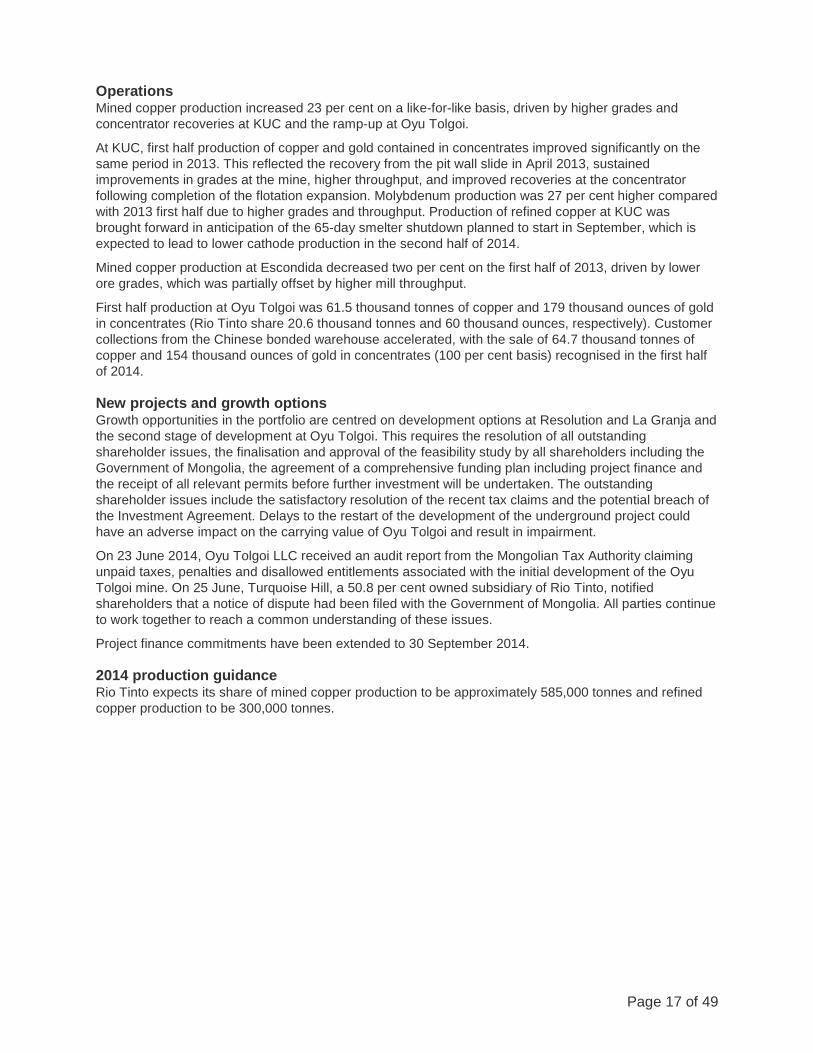
Operations Mined copper production increased 23 per cent on a like-for-like basis, driven by higher grades and concentrator recoveries at KUC and the ramp-up at Oyu Tolgoi.
At KUC, first half production of copper and gold contained in concentrates improved significantly on the same period in 2013. This reflected the recovery from the pit wall slide in April 2013, sustained improvements in grades at the mine, higher throughput, and improved recoveries at the concentrator following completion of the flotation expansion. Molybdenum production was 27 per cent higher compared with 2013 first half due to higher grades and throughput. Production of refined copper at KUC was brought forward in anticipation of the 65-day smelter shutdown planned to start in September, which is expected to lead to lower cathode production in the second half of 2014.
Mined copper production at Escondida decreased two per cent on the first half of 2013, driven by lower ore grades, which was partially offset by higher mill throughput.
First half production at Oyu Tolgoi was 61.5 thousand tonnes of copper and 179 thousand ounces of gold in concentrates (Rio Tinto share 20.6 thousand tonnes and 60 thousand ounces, respectively). Customer collections from the Chinese bonded warehouse accelerated, with the sale of 64.7 thousand tonnes of copper and 154 thousand ounces of gold in concentrates (100 per cent basis) recognised in the first half of 2014. New projects and growth options Growth opportunities in the portfolio are centred on development options at Resolution and La Granja and the second stage of development at Oyu Tolgoi. This requires the resolution of all outstanding shareholder issues, the finalisation and approval of the feasibility study by all shareholders including the Government of Mongolia, the agreement of a comprehensive funding plan including project finance and the receipt of all relevant permits before further investment will be undertaken. The outstanding shareholder issues include the satisfactory resolution of the recent tax claims and the potential breach of the Investment Agreement. Delays to the restart of the development of the underground project could have an adverse impact on the carrying value of Oyu Tolgoi and result in impairment.
On 23 June 2014, Oyu Tolgoi LLC received an audit report from the Mongolian Tax Authority claiming unpaid taxes, penalties and disallowed entitlements associated with the initial development of the Oyu Tolgoi mine. On 25 June, Turquoise Hill, a 50.8 per cent owned subsidiary of Rio Tinto, notified shareholders that a notice of dispute had been filed with the Government of Mongolia. All parties continue to work together to reach a common understanding of these issues.
Project finance commitments have been extended to 30 September 2014. 2014 production guidance Rio Tinto expects its share of mined copper production to be approximately 585,000 tonnes and refined copper production to be 300,000 tonnes.
Page 18 of 49
Energy
First half
2014 First half
2013 Change
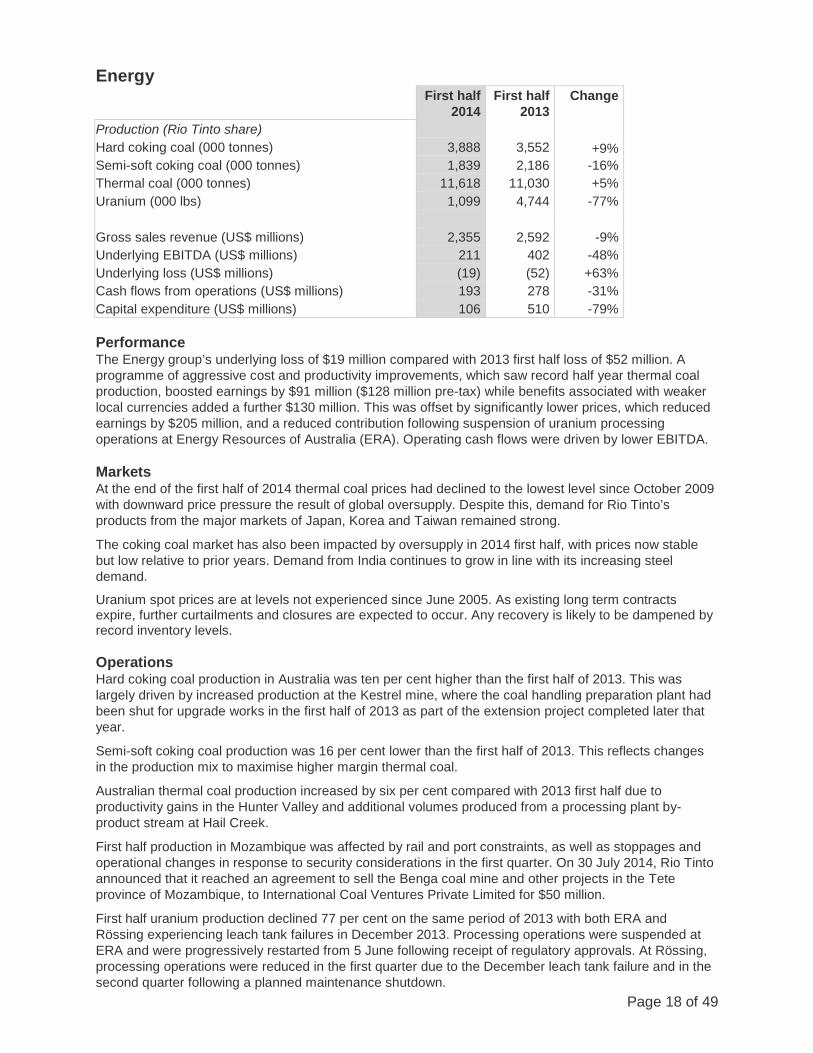
Production (Rio Tinto share) Hard coking coal (000 tonnes) 3,888 3,552 +9% Semi-soft coking coal (000 tonnes) 1,839 2,186 -16% Thermal coal (000 tonnes) 11,618 11,030 +5% Uranium (000 lbs) 1,099 4,744 -77% Gross sales revenue (US$ millions) 2,355 2,592 -9% Underlying EBITDA (US$ millions) 211 402 -48% Underlying loss (US$ millions) (19) (52) +63% Cash flows from operations (US$ millions) 193 278 -31% Capital expenditure (US$ millions) 106 510 -79% Performance The Energy group’s underlying loss of $19 million compared with 2013 first half loss of $52 million. A programme of aggressive cost and productivity improvements, which saw record half year thermal coal production, boosted earnings by $91 million ($128 million pre-tax) while benefits associated with weaker local currencies added a further $130 million. This was offset by significantly lower prices, which reduced earnings by $205 million, and a reduced contribution following suspension of uranium processing operations at Energy Resources of Australia (ERA). Operating cash flows were driven by lower EBITDA. Markets At the end of the first half of 2014 thermal coal prices had declined to the lowest level since October 2009 with downward price pressure the result of global oversupply. Despite this, demand for Rio Tinto’s products from the major markets of Japan, Korea and Taiwan remained strong.
The coking coal market has also been impacted by oversupply in 2014 first half, with prices now stable but low relative to prior years. Demand from India continues to grow in line with its increasing steel demand.
Uranium spot prices are at levels not experienced since June 2005. As existing long term contracts expire, further curtailments and closures are expected to occur. Any recovery is likely to be dampened by record inventory levels. Operations Hard coking coal production in Australia was ten per cent higher than the first half of 2013. This was largely driven by increased production at the Kestrel mine, where the coal handling preparation plant had been shut for upgrade works in the first half of 2013 as part of the extension project completed later that year.
Semi-soft coking coal production was 16 per cent lower than the first half of 2013. This reflects changes in the production mix to maximise higher margin thermal coal.
Australian thermal coal production increased by six per cent compared with 2013 first half due to productivity gains in the Hunter Valley and additional volumes produced from a processing plant by-product stream at Hail Creek.
First half production in Mozambique was affected by rail and port constraints, as well as stoppages and operational changes in response to security considerations in the first quarter. On 30 July 2014, Rio Tinto announced that it reached an agreement to sell the Benga coal mine and other projects in the Tete province of Mozambique, to International Coal Ventures Private Limited for $50 million.
First half uranium production declined 77 per cent on the same period of 2013 with both ERA and Rössing experiencing leach tank failures in December 2013. Processing operations were suspended at ERA and were progressively restarted from 5 June following receipt of regulatory approvals. At Rössing, processing operations were reduced in the first quarter due to the December leach tank failure and in the second quarter following a planned maintenance shutdown.
Page 19 of 49
2014 production guidance In 2014, Rio Tinto expects its share of thermal coal production to be 17.5 million tonnes which excludes 2.5 million tonnes of production from the Clermont mine prior to the divestment. Rio Tinto’s share of production of Australian hard coking coal and semi-soft coking coal is expected to be 7.4 million tonnes and 3.0 million tonnes, respectively.
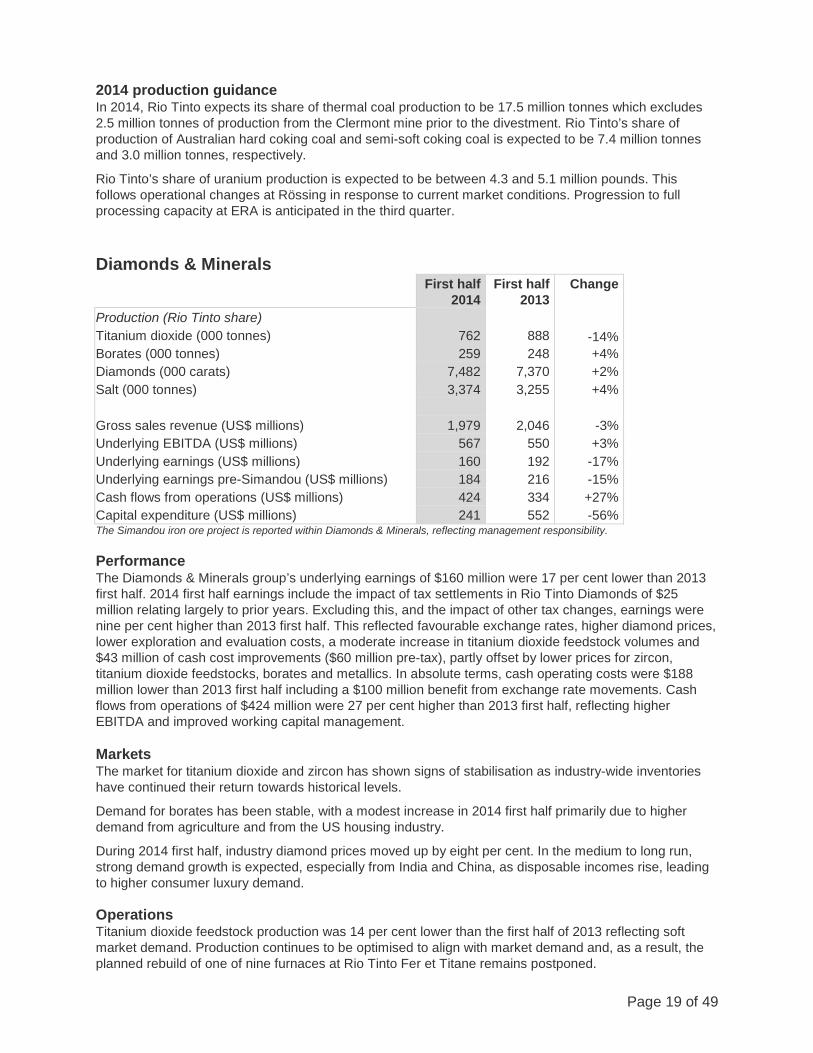
Rio Tinto’s share of uranium production is expected to be between 4.3 and 5.1 million pounds. This follows operational changes at Rössing in response to current market conditions. Progression to full processing capacity at ERA is anticipated in the third quarter. Diamonds & Minerals
First half
2014 First half
2013 Change
Production (Rio Tinto share) Titanium dioxide (000 tonnes) 762 888 -14% Borates (000 tonnes) 259 248 +4% Diamonds (000 carats) 7,482 7,370 +2% Salt (000 tonnes) 3,374 3,255 +4% Gross sales revenue (US$ millions) 1,979 2,046 -3% Underlying EBITDA (US$ millions) 567 550 +3% Underlying earnings (US$ millions) 160 192 -17% Underlying earnings pre-Simandou (US$ millions) 184 216 -15% Cash flows from operations (US$ millions) 424 334 +27% Capital expenditure (US$ millions) 241 552 -56% The Simandou iron ore project is reported within Diamonds & Minerals, reflecting management responsibility. Performance The Diamonds & Minerals group’s underlying earnings of $160 million were 17 per cent lower than 2013 first half. 2014 first half earnings include the impact of tax settlements in Rio Tinto Diamonds of $25 million relating largely to prior years. Excluding this, and the impact of other tax changes, earnings were nine per cent higher than 2013 first half. This reflected favourable exchange rates, higher diamond prices, lower exploration and evaluation costs, a moderate increase in titanium dioxide feedstock volumes and $43 million of cash cost improvements ($60 million pre-tax), partly offset by lower prices for zircon, titanium dioxide feedstocks, borates and metallics. In absolute terms, cash operating costs were $188 million lower than 2013 first half including a $100 million benefit from exchange rate movements. Cash flows from operations of $424 million were 27 per cent higher than 2013 first half, reflecting higher EBITDA and improved working capital management. Markets The market for titanium dioxide and zircon has shown signs of stabilisation as industry-wide inventories have continued their return towards historical levels.
Demand for borates has been stable, with a modest increase in 2014 first half primarily due to higher demand from agriculture and from the US housing industry.
During 2014 first half, industry diamond prices moved up by eight per cent. In the medium to long run, strong demand growth is expected, especially from India and China, as disposable incomes rise, leading to higher consumer luxury demand. Operations Titanium dioxide feedstock production was 14 per cent lower than the first half of 2013 reflecting soft market demand. Production continues to be optimised to align with market demand and, as a result, the planned rebuild of one of nine furnaces at Rio Tinto Fer et Titane remains postponed.
Page 20 of 49
Borates production was four per cent higher than in 2013 first half in response to higher sales demand and in preparation for commissioning of the new modified direct dissolving of kernite process plant in the third quarter of 2014. First half diamond production was two per cent higher than the same period of 2013 with a strong operational performance at Diavik offsetting marginally lower carats at Argyle, reflecting the move from open pit to underground mining and the processing of lower grade tailings in the first quarter of 2014 as underground production ramped up. New projects and growth options The feasibility study for the Zulti South extension at Richards Bay Minerals in South Africa is expected to be completed towards the end of 2014. If approved, commissioning is scheduled for 2017 with an anticipated capital cost of around $400 million.
The Argyle underground mine remains on track to reach full capacity in 2015, with the second crusher commissioned in July 2014. This is designed to extend the mine life of Argyle until at least 2020.
The feasibility study to develop the A21 kimberlite pipe at Diavik Diamond Mine is expected to be complete in 2014. If approved, production will commence in the fourth quarter of 2018.
On 26 May 2014, Rio Tinto and its partners, Chinalco and the International Finance Corporation, signed the Investment Framework with the Government of Guinea for blocks 3 and 4 of the Simandou iron ore project. This provides the legal and commercial foundation for the project. The Investment Framework was ratified by the Guinean National Assembly in June 2014, followed by Supreme Court review and the Presidential promulgation. The project partners are continuing to work towards the completion of a feasibility study and the establishment of a funding consortium to build the infrastructure. These two elements will provide the basis for disciplined capital allocation decisions. 2014 production guidance In 2014, Rio Tinto’s share of production is expected to be 1.5 million tonnes of titanium dioxide feedstocks, 0.5 million tonnes of boric oxide equivalent and 16 million carats of diamonds. Other Operations
First half 2014
First half 2013
Change
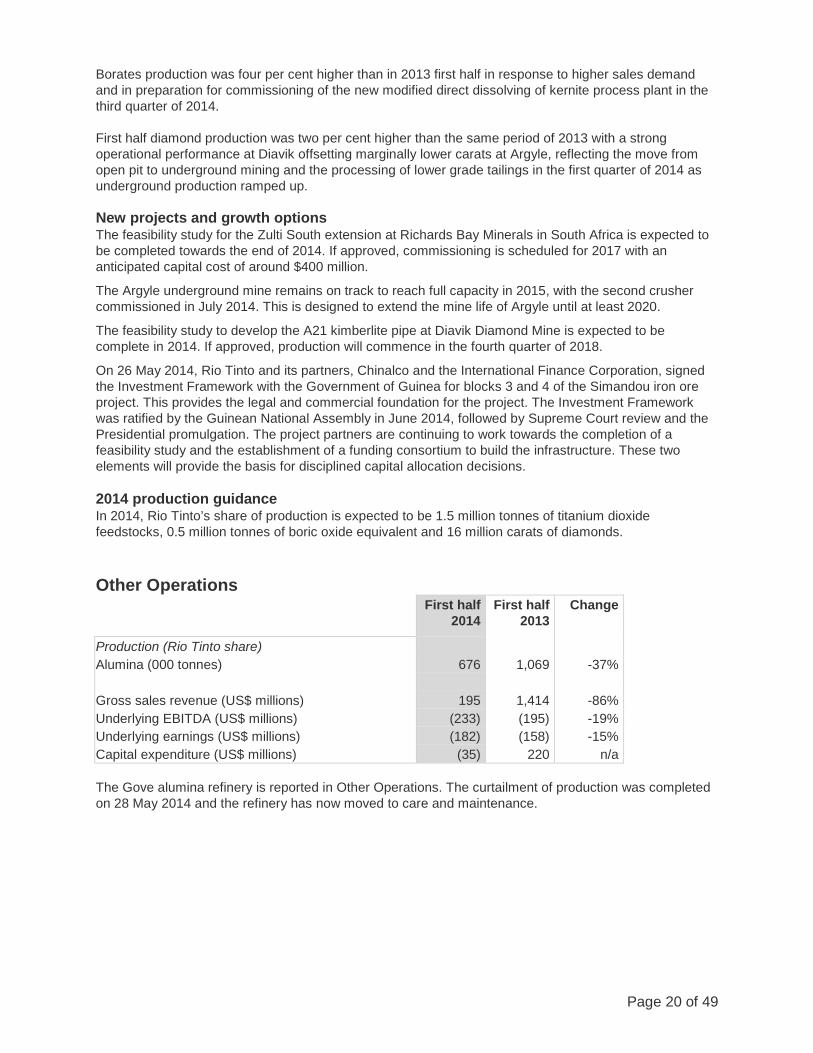
Production (Rio Tinto share) Alumina (000 tonnes) 676 1,069 -37% Gross sales revenue (US$ millions) 195 1,414 -86% Underlying EBITDA (US$ millions) (233) (195) -19% Underlying earnings (US$ millions) (182) (158) -15% Capital expenditure (US$ millions) (35) 220 n/a The Gove alumina refinery is reported in Other Operations. The curtailment of production was completed on 28 May 2014 and the refinery has now moved to care and maintenance.
Page 21 of 49
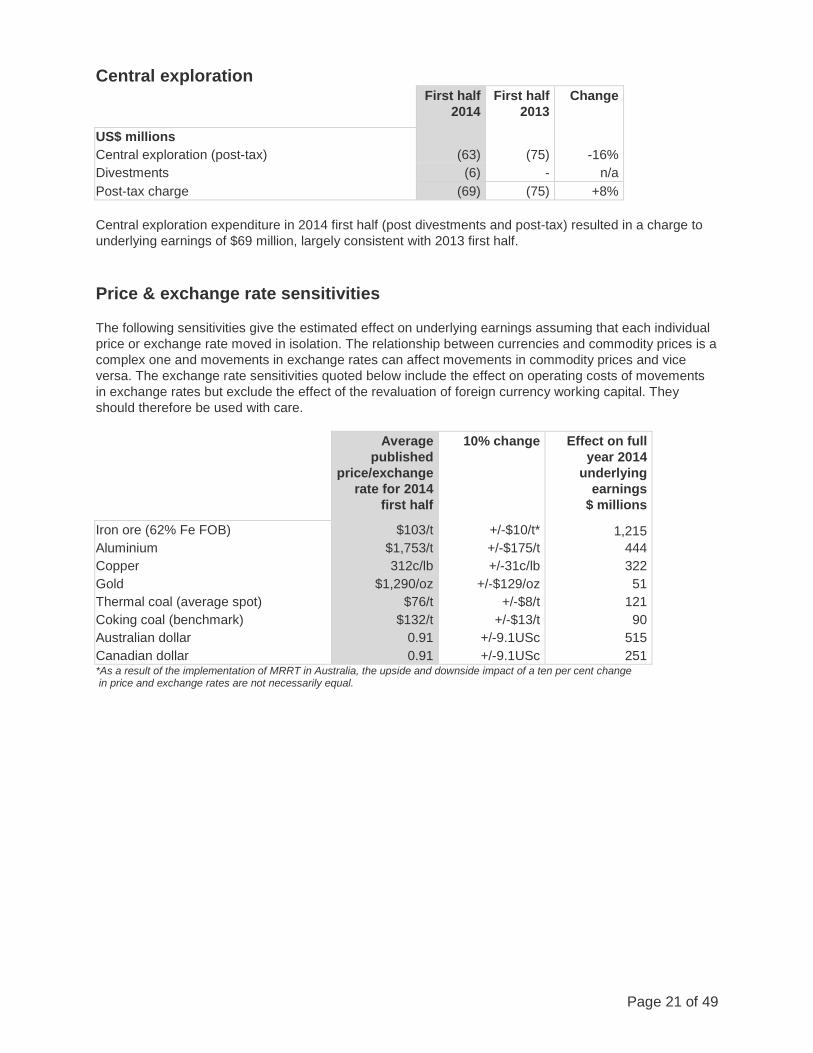
Central exploration
First half 2014
First half 2013
Change
US$ millions Central exploration (post-tax) (63) (75) -16% Divestments (6) - n/a Post-tax charge (69) (75) +8% Central exploration expenditure in 2014 first half (post divestments and post-tax) resulted in a charge to underlying earnings of $69 million, largely consistent with 2013 first half. Price & exchange rate sensitivities The following sensitivities give the estimated effect on underlying earnings assuming that each individual price or exchange rate moved in isolation. The relationship between currencies and commodity prices is a complex one and movements in exchange rates can affect movements in commodity prices and vice versa. The exchange rate sensitivities quoted below include the effect on operating costs of movements in exchange rates but exclude the effect of the revaluation of foreign currency working capital. They should therefore be used with care.
Average published
price/exchange rate for 2014
first half
10% change Effect on full year 2014
underlying earnings
$ millions
Iron ore (62% Fe FOB) $103/t +/-$10/t* 1,215 Aluminium $1,753/t +/-$175/t 444 Copper 312c/lb +/-31c/lb 322 Gold $1,290/oz +/-$129/oz 51 Thermal coal (average spot) $76/t +/-$8/t 121 Coking coal (benchmark) $132/t +/-$13/t 90 Australian dollar 0.91 +/-9.1USc 515 Canadian dollar 0.91 +/-9.1USc 251 *As a result of the implementation of MRRT in Australia, the upside and downside impact of a ten per cent change in price and exchange rates are not necessarily equal.
Page 22 of 49
DIRECTORS’ REPORT for the half year ended 30 June 2014 Review of operations and important events A detailed review of the Group’s operations, the results of those operations during the half year ended 30 June 2014 and likely future developments are given on pages 1 to 21. Important events that have occurred during the period and up until the date of this report are set out below.
On 13 January 2014, Rio Tinto acquired 510,983,220 common shares of Turquoise Hill under Turquoise Hill's rights offering at a total cost of C$1,292,787,546.60 or C$2.53 per share. The purchase represented approximately 50.8 per cent of the common shares offered under the rights offering. The rights offering was fully subscribed. Turquoise Hill used a portion of the funds it received under the rights offering to repay all amounts outstanding under the US$1.8 billion interim funding facility and the US$600 million secured bridge funding facility each provided to Turquoise Hill by Rio Tinto.
On 28 January 2014, Rio Tinto Mining and Exploration Limited (RTMEL) received 44,126,780 common shares of Minera IRL Limited (IRL), representing approximately 19.44 per cent of the issued and outstanding common shares of IRL. The shares formed part of the consideration agreed to in the 2006 option agreement on the Ollachea Gold Project between RTMEL and IRL. The consideration for each share was C$0.1790. The shares were issued from IRL's treasury and were not purchased by RTMEL via a market transaction. RTMEL may increase or decrease the investment in shares depending on its evaluation of the business, prospects and financial condition of IRL, the market for IRL's securities, general economic and tax conditions and other factors. Additionally, should RTMEL not sell any of the shares for a period of one year, RTMEL shall be entitled to a cash incentive payment.
On 12 February 2014, Rio Tinto entered into an option agreement with LNG Canada, a joint venture comprising Shell Canada Energy, Phoenix Energy Holdings Limited (an affiliate of Petro-China Investment (Hong Kong) Limited), Kogas Canada LNG Ltd. (an affiliate of Korea Gas Corporation) and Diamond LNG Canada Ltd. (an affiliate of Mitsubishi Corporation) to acquire or lease a wharf and associated land at its port facility at Kitimat, British Columbia, Canada. LNG Canada is proposing to construct and operate a natural gas liquefaction plant and marine terminal export facility at Kitimat. The agreement provides LNG Canada with a staged series of options payable against project milestones. The financial arrangements are commercially confidential.
On 7 April 2014, Rio Tinto announced its intention to gift its 19.1 per cent shareholding in Northern Dynasty Minerals Ltd (Northern Dynasty), owner of the Pebble Project, to two local Alaskan charitable foundations. The decision followed the strategic review announced last year of Rio Tinto's interest in Northern Dynasty which concluded the Pebble Project did not fit with Rio Tinto's strategy. The shares in Northern Dynasty were divided equally between the Alaska Community Foundation to fund educational and vocational training and the Bristol Bay Native Corporation Education Foundation, which supports educational and cultural programmes in the region.
On 30 April 2014, Rio Tinto filed a complaint in the United States District Court for the Southern District of New York against the following defendants: Vale, S.A., Beny Steinmetz, BSG Resources Limited, BSG Resources (Guinea) Ltd. aka BSG Resources Guinée Ltd, BSGR Guinea Ltd. BVI, BSG Resources Guinée SARL aka BSG Resources (Guinea) SARL aka VBG-Vale BSGR Guinea, Frederic Cilins, Michael Noy, Avraham Lev Ran, Mamadie Touré, and Mahmoud Thiam. The Complaint relates to the loss of half of Rio Tinto's mining concession in the Simandou region of south-east Guinea in 2008. Rio Tinto is asking the Court to award compensatory, consequential, exemplary and punitive damages to Rio Tinto in an amount to be determined at trial.
On 13 May 2014, Rio Tinto announced that its Pilbara iron ore system of mines, rail and ports had reached a run rate of 290 million tonnes a year (Mt/a), two months ahead of schedule.
Page 23 of 49
On 26 May 2014, the Government of Guinea and its partners, Rio Tinto, Chinalco and the IFC, signed the Investment Framework ("IF") for blocks 3 and 4 of Simandou. The signing provides the legal and commercial foundation for the project.
On 29 May 2014, Rio Tinto completed the sale of its 50.1 per cent interest in the Clermont Joint Venture to GS Coal Pty Ltd, a company jointly owned by Glencore and Sumitomo Corporation, for US$1.015 billion. Under the terms of the sale, Glencore has now taken over management of Clermont mine, which produces thermal coal in central Queensland.
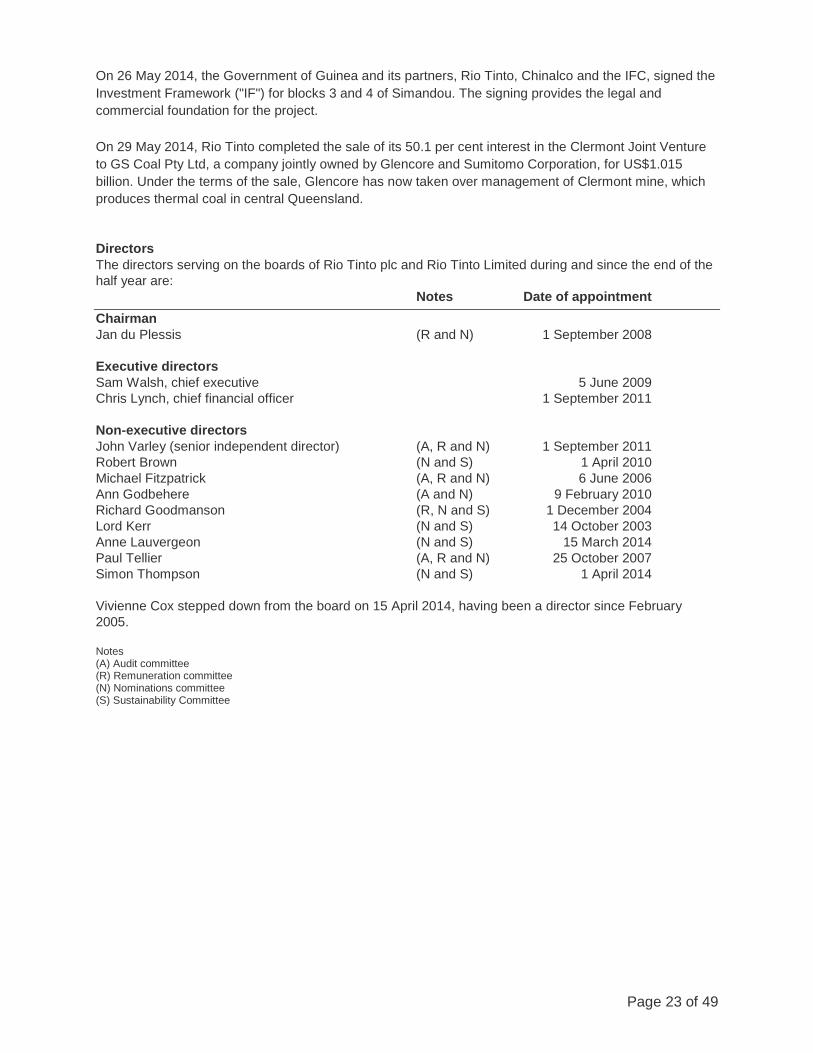
Directors The directors serving on the boards of Rio Tinto plc and Rio Tinto Limited during and since the end of the half year are: Notes Date of appointment Chairman Jan du Plessis (R and N) 1 September 2008 Executive directors Sam Walsh, chief executive 5 June 2009 Chris Lynch, chief financial officer 1 September 2011 Non-executive directors John Varley (senior independent director) (A, R and N) 1 September 2011 Robert Brown (N and S) 1 April 2010 Michael Fitzpatrick (A, R and N) 6 June 2006 Ann Godbehere (A and N) 9 February 2010 Richard Goodmanson (R, N and S) 1 December 2004 Lord Kerr (N and S) 14 October 2003 Anne Lauvergeon (N and S) 15 March 2014 Paul Tellier (A, R and N) 25 October 2007 Simon Thompson (N and S) 1 April 2014 Vivienne Cox stepped down from the board on 15 April 2014, having been a director since February 2005. Notes (A) Audit committee (R) Remuneration committee (N) Nominations committee (S) Sustainability Committee
Page 24 of 49
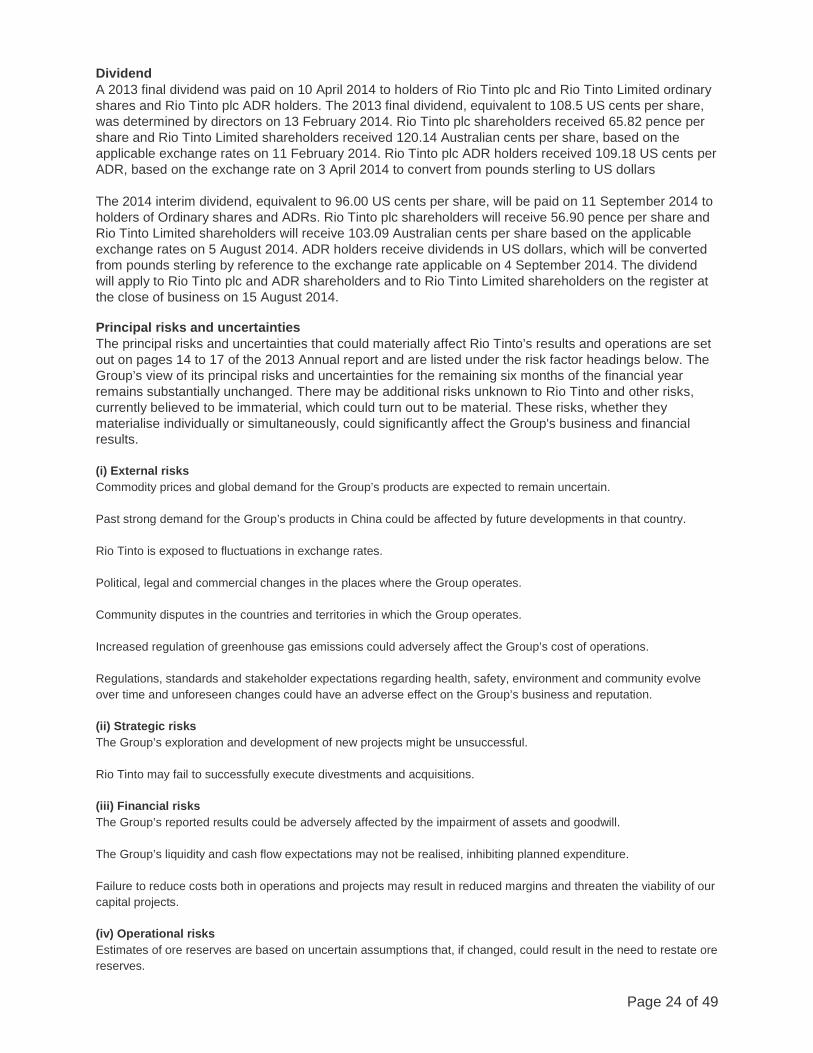
Dividend A 2013 final dividend was paid on 10 April 2014 to holders of Rio Tinto plc and Rio Tinto Limited ordinary shares and Rio Tinto plc ADR holders. The 2013 final dividend, equivalent to 108.5 US cents per share, was determined by directors on 13 February 2014. Rio Tinto plc shareholders received 65.82 pence per share and Rio Tinto Limited shareholders received 120.14 Australian cents per share, based on the applicable exchange rates on 11 February 2014. Rio Tinto plc ADR holders received 109.18 US cents per ADR, based on the exchange rate on 3 April 2014 to convert from pounds sterling to US dollars The 2014 interim dividend, equivalent to 96.00 US cents per share, will be paid on 11 September 2014 to holders of Ordinary shares and ADRs. Rio Tinto plc shareholders will receive 56.90 pence per share and Rio Tinto Limited shareholders will receive 103.09 Australian cents per share based on the applicable exchange rates on 5 August 2014. ADR holders receive dividends in US dollars, which will be converted from pounds sterling by reference to the exchange rate applicable on 4 September 2014. The dividend will apply to Rio Tinto plc and ADR shareholders and to Rio Tinto Limited shareholders on the register at the close of business on 15 August 2014. Principal risks and uncertainties The principal risks and uncertainties that could materially affect Rio Tinto’s results and operations are set out on pages 14 to 17 of the 2013 Annual report and are listed under the risk factor headings below. The Group’s view of its principal risks and uncertainties for the remaining six months of the financial year remains substantially unchanged. There may be additional risks unknown to Rio Tinto and other risks, currently believed to be immaterial, which could turn out to be material. These risks, whether they materialise individually or simultaneously, could significantly affect the Group's business and financial results.
(i) External risks Commodity prices and global demand for the Group’s products are expected to remain uncertain. Past strong demand for the Group’s products in China could be affected by future developments in that country. Rio Tinto is exposed to fluctuations in exchange rates. Political, legal and commercial changes in the places where the Group operates. Community disputes in the countries and territories in which the Group operates. Increased regulation of greenhouse gas emissions could adversely affect the Group’s cost of operations. Regulations, standards and stakeholder expectations regarding health, safety, environment and community evolve over time and unforeseen changes could have an adverse effect on the Group’s business and reputation. (ii) Strategic risks The Group’s exploration and development of new projects might be unsuccessful. Rio Tinto may fail to successfully execute divestments and acquisitions. (iii) Financial risks The Group’s reported results could be adversely affected by the impairment of assets and goodwill. The Group’s liquidity and cash flow expectations may not be realised, inhibiting planned expenditure. Failure to reduce costs both in operations and projects may result in reduced margins and threaten the viability of our capital projects. (iv) Operational risks Estimates of ore reserves are based on uncertain assumptions that, if changed, could result in the need to restate ore reserves.
Page 25 of 49
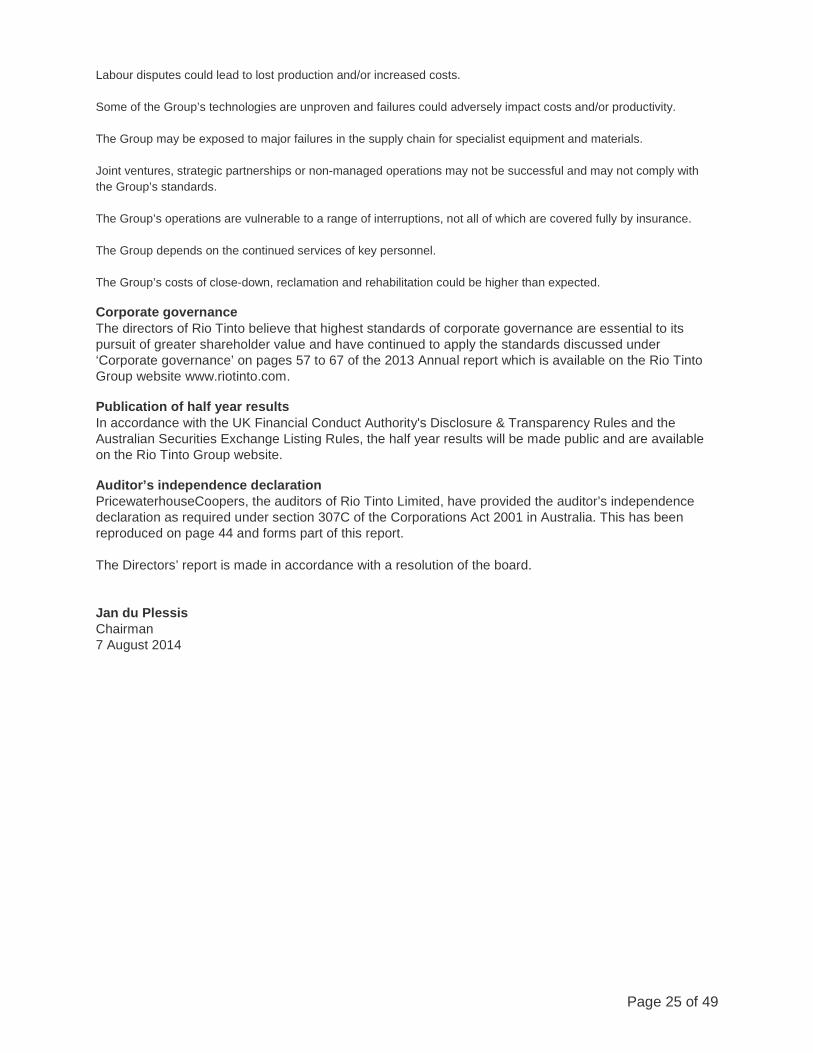
Labour disputes could lead to lost production and/or increased costs. Some of the Group’s technologies are unproven and failures could adversely impact costs and/or productivity. The Group may be exposed to major failures in the supply chain for specialist equipment and materials. Joint ventures, strategic partnerships or non-managed operations may not be successful and may not comply with the Group’s standards. The Group’s operations are vulnerable to a range of interruptions, not all of which are covered fully by insurance. The Group depends on the continued services of key personnel. The Group’s costs of close-down, reclamation and rehabilitation could be higher than expected. Corporate governance The directors of Rio Tinto believe that highest standards of corporate governance are essential to its pursuit of greater shareholder value and have continued to apply the standards discussed under ‘Corporate governance’ on pages 57 to 67 of the 2013 Annual report which is available on the Rio Tinto Group website www.riotinto.com. Publication of half year results In accordance with the UK Financial Conduct Authority's Disclosure & Transparency Rules and the Australian Securities Exchange Listing Rules, the half year results will be made public and are available on the Rio Tinto Group website. Auditor’s independence declaration PricewaterhouseCoopers, the auditors of Rio Tinto Limited, have provided the auditor’s independence declaration as required under section 307C of the Corporations Act 2001 in Australia. This has been reproduced on page 44 and forms part of this report. The Directors’ report is made in accordance with a resolution of the board. Jan du Plessis Chairman 7 August 2014
Page 26 of 49
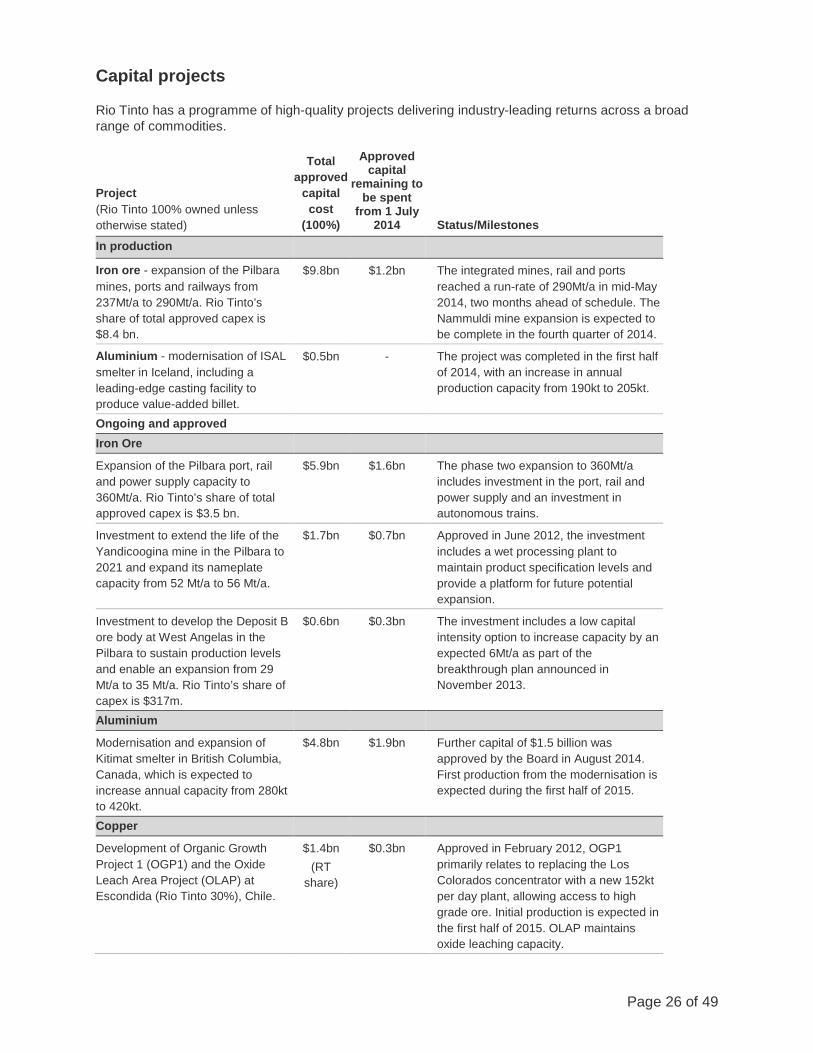
Capital projects Rio Tinto has a programme of high-quality projects delivering industry-leading returns across a broad range of commodities.
Project (Rio Tinto 100% owned unless otherwise stated)
Total approved
capital cost
(100%)
Approved capital
remaining to be spent
from 1 July 2014 Status/Milestones
In production
Iron ore - expansion of the Pilbara mines, ports and railways from 237Mt/a to 290Mt/a. Rio Tinto’s share of total approved capex is $8.4 bn.
$9.8bn $1.2bn The integrated mines, rail and ports reached a run-rate of 290Mt/a in mid-May 2014, two months ahead of schedule. The Nammuldi mine expansion is expected to be complete in the fourth quarter of 2014.
Aluminium - modernisation of ISAL smelter in Iceland, including a leading-edge casting facility to produce value-added billet.
$0.5bn - The project was completed in the first half of 2014, with an increase in annual production capacity from 190kt to 205kt.
Ongoing and approved Iron Ore
Expansion of the Pilbara port, rail and power supply capacity to 360Mt/a. Rio Tinto’s share of total approved capex is $3.5 bn.
$5.9bn $1.6bn The phase two expansion to 360Mt/a includes investment in the port, rail and power supply and an investment in autonomous trains.
Investment to extend the life of the Yandicoogina mine in the Pilbara to 2021 and expand its nameplate capacity from 52 Mt/a to 56 Mt/a.
$1.7bn $0.7bn Approved in June 2012, the investment includes a wet processing plant to maintain product specification levels and provide a platform for future potential expansion.
Investment to develop the Deposit B ore body at West Angelas in the Pilbara to sustain production levels and enable an expansion from 29 Mt/a to 35 Mt/a. Rio Tinto’s share of capex is $317m.
$0.6bn $0.3bn The investment includes a low capital intensity option to increase capacity by an expected 6Mt/a as part of the breakthrough plan announced in November 2013.
Aluminium
Modernisation and expansion of Kitimat smelter in British Columbia, Canada, which is expected to increase annual capacity from 280kt to 420kt.
$4.8bn $1.9bn Further capital of $1.5 billion was approved by the Board in August 2014. First production from the modernisation is expected during the first half of 2015.
Copper
Development of Organic Growth Project 1 (OGP1) and the Oxide Leach Area Project (OLAP) at Escondida (Rio Tinto 30%), Chile.
$1.4bn (RT
share)
$0.3bn Approved in February 2012, OGP1 primarily relates to replacing the Los Colorados concentrator with a new 152kt per day plant, allowing access to high grade ore. Initial production is expected in the first half of 2015. OLAP maintains oxide leaching capacity.
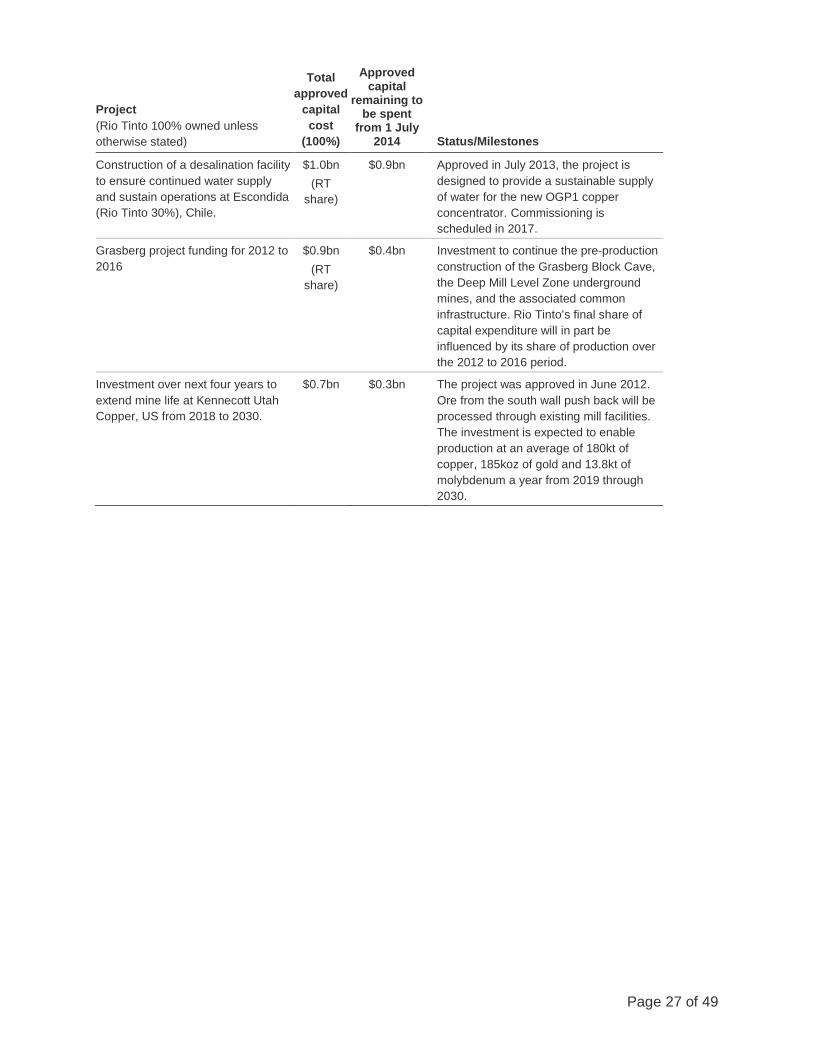
Page 27 of 49
Project (Rio Tinto 100% owned unless otherwise stated)
Total approved
capital cost
(100%)
Approved capital
remaining to be spent
from 1 July 2014 Status/Milestones
Construction of a desalination facility to ensure continued water supply and sustain operations at Escondida (Rio Tinto 30%), Chile.
$1.0bn (RT
share)
$0.9bn Approved in July 2013, the project is designed to provide a sustainable supply of water for the new OGP1 copper concentrator. Commissioning is scheduled in 2017.
Grasberg project funding for 2012 to 2016
$0.9bn (RT
share)
$0.4bn Investment to continue the pre-production construction of the Grasberg Block Cave, the Deep Mill Level Zone underground mines, and the associated common infrastructure. Rio Tinto’s final share of capital expenditure will in part be influenced by its share of production over the 2012 to 2016 period.
Investment over next four years to extend mine life at Kennecott Utah Copper, US from 2018 to 2030.
$0.7bn $0.3bn The project was approved in June 2012. Ore from the south wall push back will be processed through existing mill facilities. The investment is expected to enable production at an average of 180kt of copper, 185koz of gold and 13.8kt of molybdenum a year from 2019 through 2030.
Page 28 of 49
About Rio Tinto Rio Tinto is a leading international mining group headquartered in the UK, combining Rio Tinto plc, a London and New York Stock Exchange listed company, and Rio Tinto Limited, which is listed on the Australian Securities Exchange. Rio Tinto's business is finding, mining, and processing mineral resources. Major products are aluminium, copper, diamonds, gold, industrial minerals (borates, titanium dioxide and salt), iron ore, thermal and metallurgical coal and uranium. Activities span the world and are strongly represented in Australia and North America with significant businesses in Asia, Europe, Africa and South America.
Forward-looking statements This announcement includes "forward-looking statements" within the meaning of the Private Securities Litigation Reform Act of 1995. All statements other than statements of historical facts included in this announcement, including, without limitation, those regarding Rio Tinto’s financial position, business strategy, plans and objectives of management for future operations (including development plans and objectives relating to Rio Tinto’s products, production forecasts and reserve and resource positions), are forward-looking statements. Such forward-looking statements involve known and unknown risks, uncertainties and other factors which may cause the actual results, performance or achievements of Rio Tinto, or industry results, to be materially different from any future results, performance or achievements expressed or implied by such forward-looking statements. Such forward-looking statements are based on numerous assumptions regarding Rio Tinto’s present and future business strategies and the environment in which Rio Tinto will operate in the future. Among the important factors that could cause Rio Tinto’s actual results, performance or achievements to differ materially from those in the forward-looking statements are levels of actual production during any period, levels of demand and market prices, the ability to produce and transport products profitably, the impact of foreign currency exchange rates on market prices and operating costs, operational problems, political uncertainty and economic conditions in relevant areas of the world, the actions of competitors, activities by governmental authorities such as changes in taxation or regulation and such other risk factors identified in Rio Tinto's most recent Annual Report and Accounts in Australia and the United Kingdom and the most recent Annual Report on Form 20-F filed with the United States Securities and Exchange Commission (the "SEC") or Form 6-Ks furnished to, or filed with, the SEC. Forward-looking statements should, therefore, be construed in light of such risk factors and undue reliance should not be placed on forward-looking statements. These forward-looking statements speak only as of the date of this announcement. Rio Tinto expressly disclaims any obligation or undertaking (except as required by applicable law, the UK Listing Rules, the Disclosure and Transparency Rules of the Financial Conduct Authority and the Listing Rules of the Australian Securities Exchange) to release publicly any updates or revisions to any forward-looking statement contained herein to reflect any change in Rio Tinto’s expectations with regard thereto or any change in events, conditions or circumstances on which any such statement is based. Nothing in this announcement should be interpreted to mean that future earnings per share of Rio Tinto plc or Rio Tinto Limited will necessarily match or exceed its historical published earnings per share.
Page 29 of 49
Contacts [email protected] www.riotinto.com
Follow @riotinto on Twitter Media Relations, EMEA/Americas Illtud Harri T +44 20 7781 1152 M +44 7920 503 600 David Outhwaite T +44 20 7781 1623 M +44 7787 597 493 Investor Relations, EMEA/Americas Mark Shannon T +44 20 7781 1178 M +44 7917 576597 David Ovington T +44 20 7781 2051 M +44 7920 010 978 Grant Donald T +44 20 7781 1262 M +44 7920 587 805
Media Relations, Australia/Asia David Luff T +61 3 9283 3620 M +61 419 850 205 Bruce Tobin T +61 3 9283 3612 M +61 419 103 454 Investor Relations, Australia/Asia Christopher Maitland T +61 3 9283 3063 M +61 459 800 131 Rachel Storrs T +61 3 9283 3628 M +61 417 401 018 Galina Rogova T +852 2839 9208 M +852 6978 3011
Rio Tinto plc 2 Eastbourne Terrace London W2 6LG United Kingdom T +44 20 7781 2000 Registered in England No. 719885
Rio Tinto Limited 120 Collins Street Melbourne 3000 Australia T +61 3 9283 3333 Registered in Australia ABN 96 004 458 404
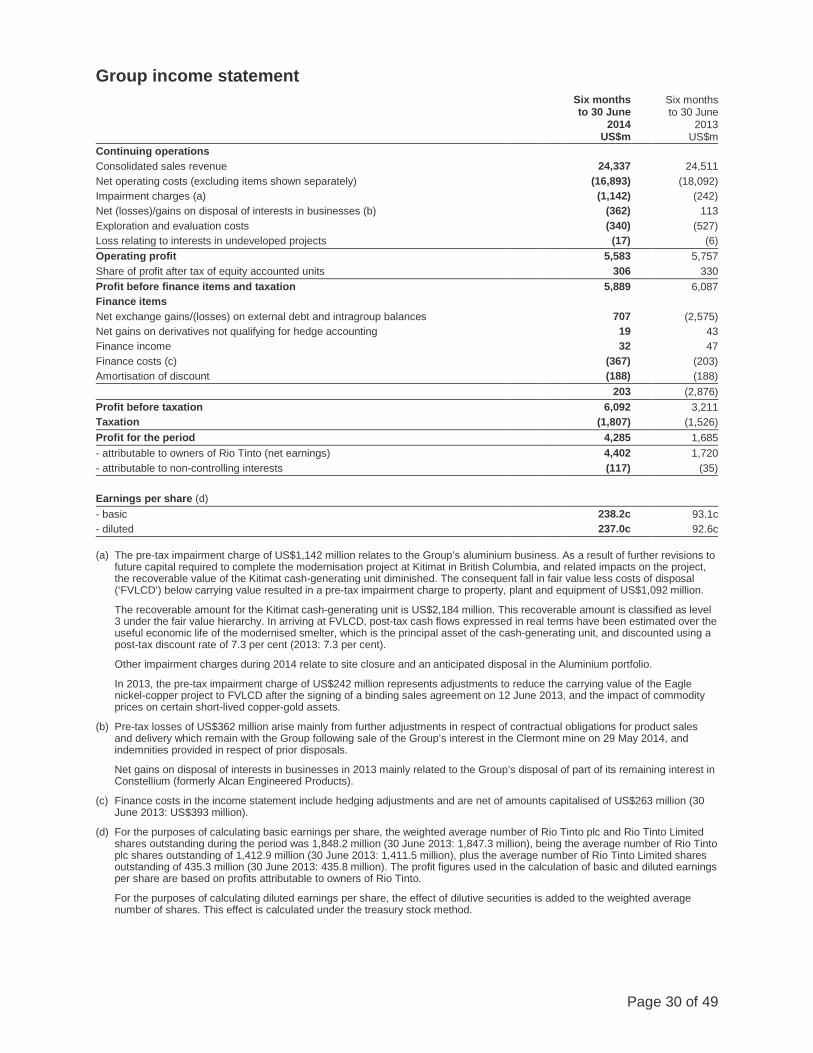
Page 30 of 49
Group income statement
Six months to 30 June
2014 US$m
Six months to 30 June
2013 US$m
Continuing operations Consolidated sales revenue 24,337 24,511 Net operating costs (excluding items shown separately) (16,893) (18,092) Impairment charges (a) (1,142) (242) Net (losses)/gains on disposal of interests in businesses (b) (362) 113 Exploration and evaluation costs (340) (527) Loss relating to interests in undeveloped projects (17) (6) Operating profit 5,583 5,757 Share of profit after tax of equity accounted units 306 330 Profit before finance items and taxation 5,889 6,087 Finance items Net exchange gains/(losses) on external debt and intragroup balances 707 (2,575) Net gains on derivatives not qualifying for hedge accounting 19 43 Finance income 32 47 Finance costs (c) (367) (203) Amortisation of discount (188) (188) 203 (2,876) Profit before taxation 6,092 3,211 Taxation (1,807) (1,526) Profit for the period 4,285 1,685 - attributable to owners of Rio Tinto (net earnings) 4,402 1,720 - attributable to non-controlling interests (117) (35) Earnings per share (d) - basic 238.2c 93.1c - diluted 237.0c 92.6c (a) The pre-tax impairment charge of US$1,142 million relates to the Group’s aluminium business. As a result of further revisions to
future capital required to complete the modernisation project at Kitimat in British Columbia, and related impacts on the project, the recoverable value of the Kitimat cash-generating unit diminished. The consequent fall in fair value less costs of disposal (‘FVLCD’) below carrying value resulted in a pre-tax impairment charge to property, plant and equipment of US$1,092 million.
The recoverable amount for the Kitimat cash-generating unit is US$2,184 million. This recoverable amount is classified as level 3 under the fair value hierarchy. In arriving at FVLCD, post-tax cash flows expressed in real terms have been estimated over the useful economic life of the modernised smelter, which is the principal asset of the cash-generating unit, and discounted using a post-tax discount rate of 7.3 per cent (2013: 7.3 per cent).
Other impairment charges during 2014 relate to site closure and an anticipated disposal in the Aluminium portfolio.
In 2013, the pre-tax impairment charge of US$242 million represents adjustments to reduce the carrying value of the Eagle nickel-copper project to FVLCD after the signing of a binding sales agreement on 12 June 2013, and the impact of commodity prices on certain short-lived copper-gold assets.
(b) Pre-tax losses of US$362 million arise mainly from further adjustments in respect of contractual obligations for product sales and delivery which remain with the Group following sale of the Group’s interest in the Clermont mine on 29 May 2014, and indemnities provided in respect of prior disposals.
Net gains on disposal of interests in businesses in 2013 mainly related to the Group’s disposal of part of its remaining interest in Constellium (formerly Alcan Engineered Products).
(c) Finance costs in the income statement include hedging adjustments and are net of amounts capitalised of US$263 million (30 June 2013: US$393 million).
(d) For the purposes of calculating basic earnings per share, the weighted average number of Rio Tinto plc and Rio Tinto Limited shares outstanding during the period was 1,848.2 million (30 June 2013: 1,847.3 million), being the average number of Rio Tinto plc shares outstanding of 1,412.9 million (30 June 2013: 1,411.5 million), plus the average number of Rio Tinto Limited shares outstanding of 435.3 million (30 June 2013: 435.8 million). The profit figures used in the calculation of basic and diluted earnings per share are based on profits attributable to owners of Rio Tinto.
For the purposes of calculating diluted earnings per share, the effect of dilutive securities is added to the weighted average number of shares. This effect is calculated under the treasury stock method.
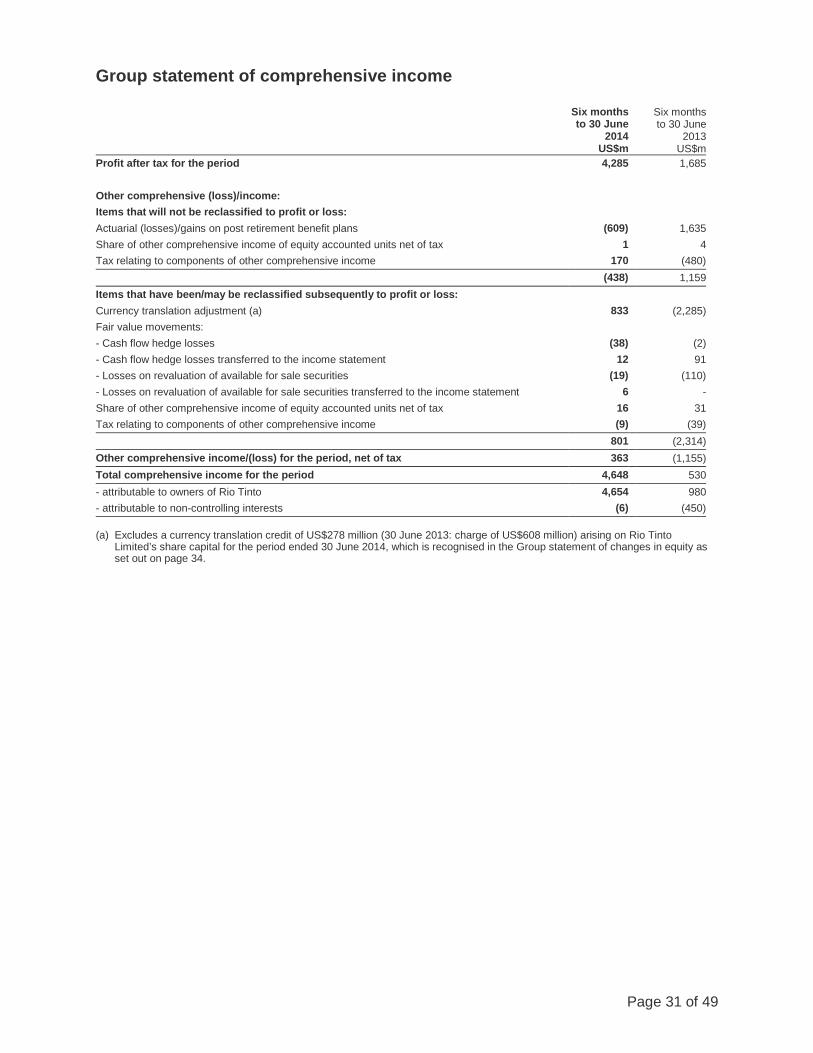
Page 31 of 49
Group statement of comprehensive income
Six months to 30 June
2014 US$m
Six months to 30 June
2013 US$m
Profit after tax for the period 4,285 1,685 Other comprehensive (loss)/income: Items that will not be reclassified to profit or loss: Actuarial (losses)/gains on post retirement benefit plans (609) 1,635 Share of other comprehensive income of equity accounted units net of tax 1 4 Tax relating to components of other comprehensive income 170 (480) (438) 1,159 Items that have been/may be reclassified subsequently to profit or loss: Currency translation adjustment (a) 833 (2,285) Fair value movements: - Cash flow hedge losses (38) (2) - Cash flow hedge losses transferred to the income statement 12 91 - Losses on revaluation of available for sale securities (19) (110) - Losses on revaluation of available for sale securities transferred to the income statement 6 - Share of other comprehensive income of equity accounted units net of tax 16 31 Tax relating to components of other comprehensive income (9) (39) 801 (2,314) Other comprehensive income/(loss) for the period, net of tax 363 (1,155) Total comprehensive income for the period 4,648 530 - attributable to owners of Rio Tinto 4,654 980 - attributable to non-controlling interests (6) (450) (a) Excludes a currency translation credit of US$278 million (30 June 2013: charge of US$608 million) arising on Rio Tinto
Limited’s share capital for the period ended 30 June 2014, which is recognised in the Group statement of changes in equity as set out on page 34.
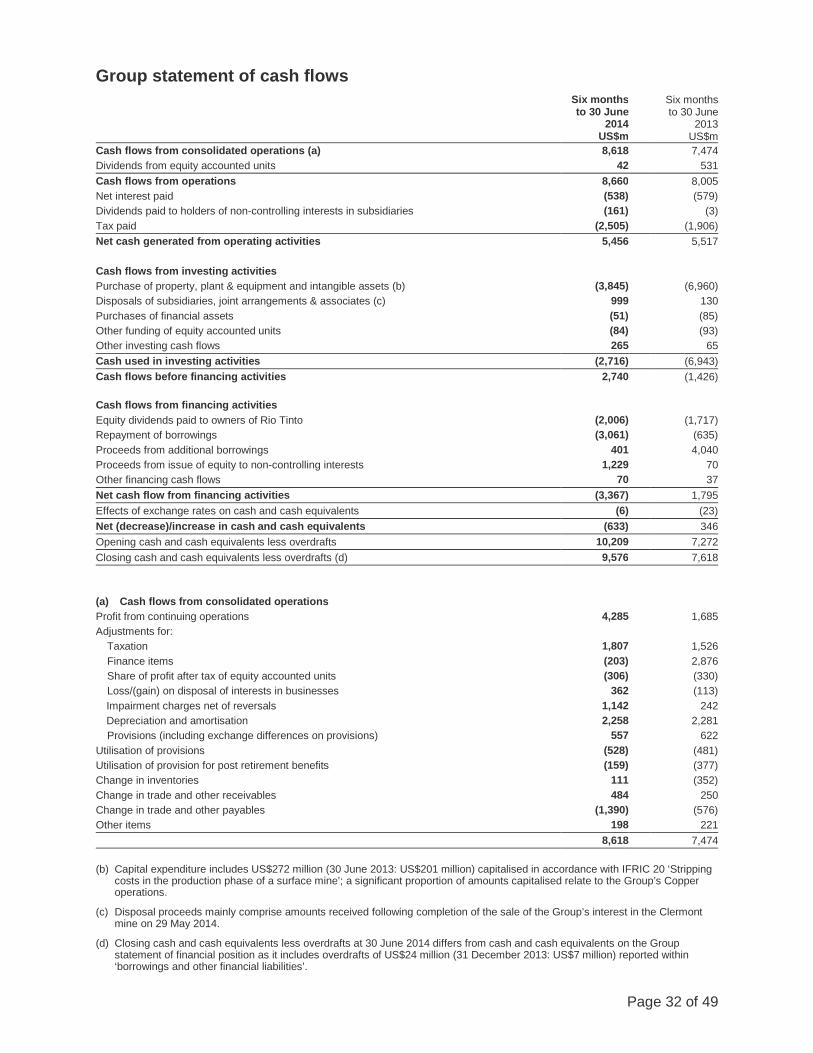
Page 32 of 49
Group statement of cash flows
Six months to 30 June
2014 US$m
Six months to 30 June
2013 US$m
Cash flows from consolidated operations (a) 8,618 7,474 Dividends from equity accounted units 42 531 Cash flows from operations 8,660 8,005 Net interest paid (538) (579) Dividends paid to holders of non-controlling interests in subsidiaries (161) (3) Tax paid (2,505) (1,906) Net cash generated from operating activities 5,456 5,517 Cash flows from investing activities Purchase of property, plant & equipment and intangible assets (b) (3,845) (6,960) Disposals of subsidiaries, joint arrangements & associates (c) 999 130 Purchases of financial assets (51) (85) Other funding of equity accounted units (84) (93) Other investing cash flows 265 65 Cash used in investing activities (2,716) (6,943) Cash flows before financing activities 2,740 (1,426) Cash flows from financing activities
Equity dividends paid to owners of Rio Tinto (2,006) (1,717) Repayment of borrowings (3,061) (635) Proceeds from additional borrowings 401 4,040 Proceeds from issue of equity to non-controlling interests 1,229 70 Other financing cash flows 70 37 Net cash flow from financing activities (3,367) 1,795 Effects of exchange rates on cash and cash equivalents (6) (23) Net (decrease)/increase in cash and cash equivalents (633) 346 Opening cash and cash equivalents less overdrafts 10,209 7,272 Closing cash and cash equivalents less overdrafts (d) 9,576 7,618
(a) Cash flows from consolidated operations Profit from continuing operations 4,285 1,685 Adjustments for:
Taxation 1,807 1,526 Finance items (203) 2,876 Share of profit after tax of equity accounted units (306) (330) Loss/(gain) on disposal of interests in businesses 362 (113) Impairment charges net of reversals 1,142 242 Depreciation and amortisation 2,258 2,281 Provisions (including exchange differences on provisions) 557 622
Utilisation of provisions (528) (481) Utilisation of provision for post retirement benefits (159) (377) Change in inventories 111 (352) Change in trade and other receivables 484 250 Change in trade and other payables (1,390) (576) Other items 198 221 8,618 7,474 (b) Capital expenditure includes US$272 million (30 June 2013: US$201 million) capitalised in accordance with IFRIC 20 ‘Stripping
costs in the production phase of a surface mine’; a significant proportion of amounts capitalised relate to the Group’s Copper operations.
(c) Disposal proceeds mainly comprise amounts received following completion of the sale of the Group’s interest in the Clermont mine on 29 May 2014.
(d) Closing cash and cash equivalents less overdrafts at 30 June 2014 differs from cash and cash equivalents on the Group statement of financial position as it includes overdrafts of US$24 million (31 December 2013: US$7 million) reported within ‘borrowings and other financial liabilities’.
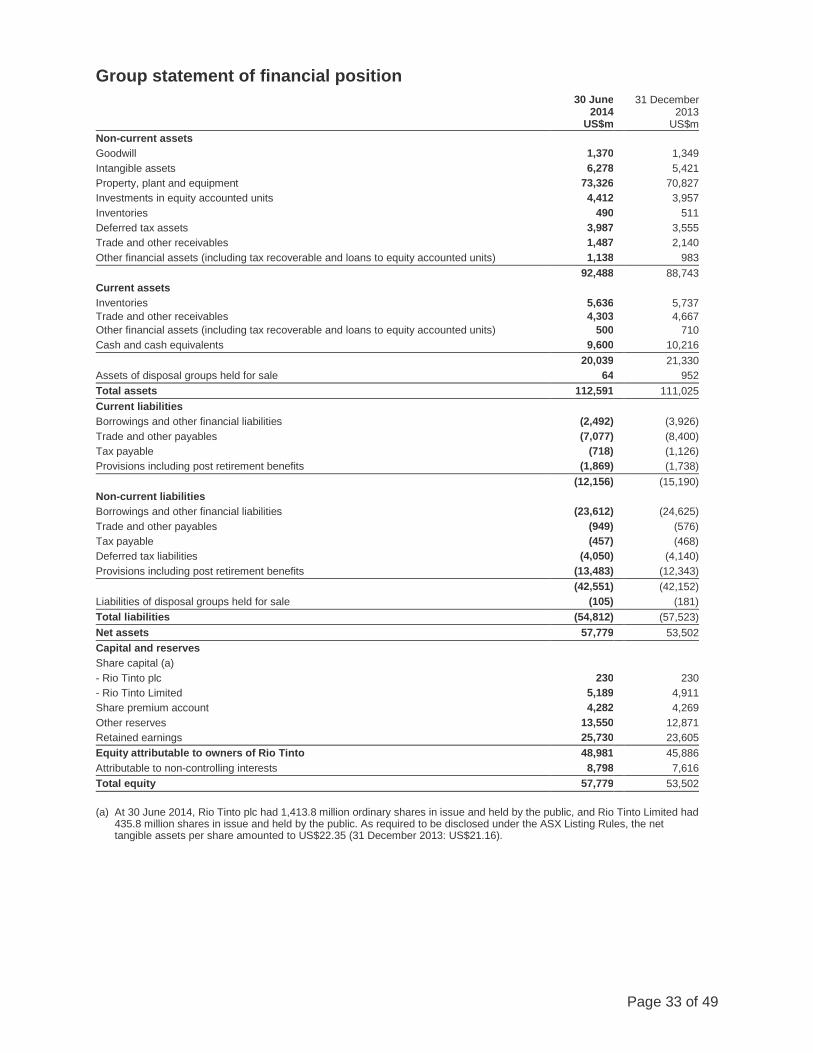
Page 33 of 49
Group statement of financial position
30 June 2014
US$m
31 December 2013
US$m Non-current assets Goodwill 1,370 1,349 Intangible assets 6,278 5,421 Property, plant and equipment 73,326 70,827 Investments in equity accounted units 4,412 3,957 Inventories 490 511 Deferred tax assets 3,987 3,555 Trade and other receivables 1,487 2,140 Other financial assets (including tax recoverable and loans to equity accounted units) 1,138 983 92,488 88,743 Current assets Inventories 5,636 5,737 Trade and other receivables 4,303 4,667 Other financial assets (including tax recoverable and loans to equity accounted units) 500 710 Cash and cash equivalents 9,600 10,216 20,039 21,330 Assets of disposal groups held for sale 64 952 Total assets 112,591 111,025 Current liabilities Borrowings and other financial liabilities (2,492) (3,926) Trade and other payables (7,077) (8,400) Tax payable (718) (1,126) Provisions including post retirement benefits (1,869) (1,738) (12,156) (15,190) Non-current liabilities Borrowings and other financial liabilities (23,612) (24,625) Trade and other payables (949) (576) Tax payable (457) (468) Deferred tax liabilities (4,050) (4,140) Provisions including post retirement benefits (13,483) (12,343) (42,551) (42,152) Liabilities of disposal groups held for sale (105) (181) Total liabilities (54,812) (57,523) Net assets 57,779 53,502 Capital and reserves Share capital (a) - Rio Tinto plc 230 230 - Rio Tinto Limited 5,189 4,911 Share premium account 4,282 4,269 Other reserves 13,550 12,871 Retained earnings 25,730 23,605 Equity attributable to owners of Rio Tinto 48,981 45,886 Attributable to non-controlling interests 8,798 7,616 Total equity 57,779 53,502 (a) At 30 June 2014, Rio Tinto plc had 1,413.8 million ordinary shares in issue and held by the public, and Rio Tinto Limited had
435.8 million shares in issue and held by the public. As required to be disclosed under the ASX Listing Rules, the net tangible assets per share amounted to US$22.35 (31 December 2013: US$21.16).
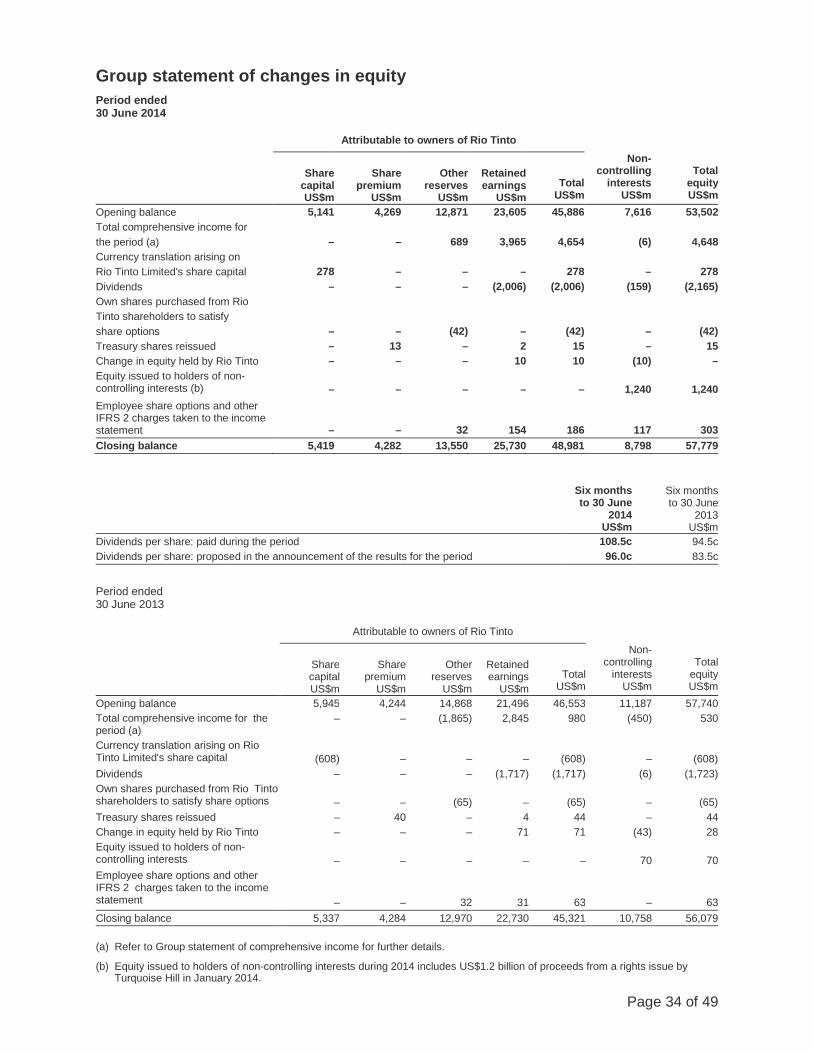
Page 34 of 49
Group statement of changes in equity Period ended 30 June 2014
Attributable to owners of Rio Tinto
Share
capital US$m
Share premium
US$m
Other reserves
US$m
Retained earnings
US$m
Total US$m
Non-controlling
interests US$m
Total equity US$m
Opening balance 5,141 4,269 12,871 23,605 45,886 7,616 53,502 Total comprehensive income for the period (a) – – 689 3,965 4,654 (6) 4,648 Currency translation arising on Rio Tinto Limited's share capital 278 – – – 278 – 278 Dividends – – – (2,006) (2,006) (159) (2,165) Own shares purchased from Rio Tinto shareholders to satisfy share options – – (42) – (42) – (42) Treasury shares reissued – 13 – 2 15 – 15 Change in equity held by Rio Tinto – – – 10 10 (10) – Equity issued to holders of non-controlling interests (b)
–
–
–
–
–
1,240
1,240
Employee share options and other IFRS 2 charges taken to the income statement
–
–
32
154
186
117
303 Closing balance 5,419 4,282 13,550 25,730 48,981 8,798 57,779
Six months to 30 June
2014 US$m
Six months to 30 June
2013 US$m
Dividends per share: paid during the period 108.5c 94.5c Dividends per share: proposed in the announcement of the results for the period 96.0c 83.5c Period ended 30 June 2013
Attributable to owners of Rio Tinto
Share capital US$m
Share premium
US$m
Other reserves
US$m
Retained earnings
US$m
Total US$m
Non-controlling
interests US$m
Total equity US$m
Opening balance 5,945 4,244 14,868 21,496 46,553 11,187 57,740 Total comprehensive income for the period (a)
– – (1,865) 2,845 980 (450) 530
Currency translation arising on Rio Tinto Limited's share capital
(608)
–
–
–
(608)
–
(608)
Dividends – – – (1,717) (1,717) (6) (1,723) Own shares purchased from Rio Tinto shareholders to satisfy share options
–
–
(65)
–
(65)
–
(65)
Treasury shares reissued – 40 – 4 44 – 44 Change in equity held by Rio Tinto – – – 71 71 (43) 28 Equity issued to holders of non-controlling interests
–
–
–
–
–
70
70
Employee share options and other IFRS 2 charges taken to the income statement
–
–
32
31
63
–
63 Closing balance 5,337 4,284 12,970 22,730 45,321 10,758 56,079 (a) Refer to Group statement of comprehensive income for further details.
(b) Equity issued to holders of non-controlling interests during 2014 includes US$1.2 billion of proceeds from a rights issue by Turquoise Hill in January 2014.
Page 35 of 49
Reconciliation with Australian Accounting Standards The Group’s financial statements have been prepared in accordance with IFRS as adopted by the European Union ('EU IFRS'), which differs in certain respects from the version of IFRS that is applicable in Australia, referred to as Australian Accounting Standards ('AAS').
Prior to 1 January 2004, the Group's financial statements were prepared in accordance with UK GAAP. Under EU IFRS goodwill on acquisitions prior to 1998, which was eliminated directly against equity in the Group's UK GAAP financial statements, has not been reinstated. This was permitted under the rules governing the transition to EU IFRS set out in IFRS 1. The equivalent Australian Standard, AASB 1, does not provide for the netting of goodwill against equity. As a consequence, shareholders' funds under AAS include the residue of such goodwill, which amounted to US$546 million at 30 June 2014 (31 December 2013: US$550 million).
Save for the exception described above, the Group's financial statements drawn up in accordance with EU IFRS are consistent with the requirements of AAS.
Page 36 of 49
Consolidated net debt
30 June 2014
US$m
31 December 2013
US$m Analysis of changes in consolidated net debt (a) Opening balance (18,055) (19,192) Adjustment on currency translation (679) 2,051 Exchange gains/(losses) charged to the income statement 634 (2,120) Cash movements excluding exchange movements 2,009 1,076 Other movements (44) 130 Closing balance (16,135) (18,055) Total borrowings in the statement of financial position (b) (26,025) (28,460) Derivatives related to net debt (included in 'Other financial assets/liabilities') 276 173 EAU funded balances excluded from net debt 14 16 Adjusted total borrowings (25,735) (28,271) Cash and cash equivalents 9,600 10,216 Consolidated net debt (16,135) (18,055)
(a) Consolidated net debt is stated net of the impact of certain funding arrangements between EAUs and partially owned subsidiaries (EAU funded balances). This adjustment is required in order to avoid showing borrowings twice in the net debt disclosure, where funding has been provided to an EAU by the Group and subsequently on lent by the EAU to a consolidated Group subsidiary.
(b) Total borrowings are combined with other current financial liabilities of US$12 million (31 December 2013: US$10 million) and non-current financial liabilities of US$67 million (31 December 2013: US$81 million) in the statement of financial position.
Geographical analysis (by destination)
Six months to 30 June
2014 %
Six months to 30 June
2013 %
Six months to 30 June
2014 US$m
Six months to 30 June
2013 US$m
Gross sales revenue by destination (a) China 37.8 33.2 9,665 8,812 Japan 16.2 15.4 4,155 4,080 Other Asia 14.9 15.9 3,801 4,234 United States of America 12.6 13.6 3,226 3,620 Other Europe (excluding United Kingdom) 8.4 11.4 2,149 3,017 Canada 2.7 2.5 701 661 Australia 2.5 2.1 652 570 United Kingdom 0.9 0.8 233 202 Other 4.0 5.1 988 1,367 Gross sales revenue 100.0 100.0 25,570 26,563 Share of equity accounted units' sales (1,233) (2,052) Consolidated sales revenue 24,337 24,511 The financial information by business unit and the geographic analysis of sales by destination satisfy the disclosure requirements of IFRS 8 ‘Operating Segments’ for interim financial statements and also provide additional voluntary disclosure which the Group considers is useful to the users of the financial statements.
(a) Gross sales revenue is used by the Group in monitoring business performance (refer to the financial information by Business Unit on page 10). Gross sales revenue includes the sales revenue of equity accounted units (after adjusting for sales to subsidiaries) in addition to consolidated sales. Consolidated sales revenue includes subsidiary sales to equity accounted units which are not included in gross sales revenue.
Page 37 of 49
Prima facie tax reconciliation
Six months to 30 June
2014 US$m
Six months to 30 June
2013 US$m
Profit before taxation 6,092 3,211 Deduct: share of profit after tax of equity accounted units (306) (330) Parent companies' and subsidiaries' profit before tax 5,786 2,881 Prima facie tax payable at UK rate of 21 per cent (2013: 23 per cent) 1,215 663 Higher rate of tax on Australian earnings at 30 per cent 630 562 Impact of items excluded from underlying earnings
Impairment charges (59) - Gains and losses on disposal of businesses (118) (28) Foreign exchange on intra-group balances 27 120 Foreign exchange on excluded finance items 66 (74) Other exclusions 69 (79)
Other tax rates applicable outside the UK and Australia 24 11 Resource depletion and other depreciation allowances (94) (10) Research, development and other investment allowances (14) (25) Recognition of previously unrecognised deferred tax assets (51) (4) Unrecognised current year operating losses 44 151 Other items (a) 68 239 Total taxation charge (b) 1,807 1,526
(a) Other items include various adjustments to provisions for taxation of prior periods.
(b) This tax reconciliation relates to the Group's parent companies, subsidiaries, joint operations, and excludes equity accounted units. The Group's share of profit of equity accounted units is net of tax charges of US$202 million (30 June 2013: US$221 million).
Page 38 of 49
Fair value disclosure for financial instruments Except where stated, the information given below relates to the financial instruments of the parent companies and their subsidiaries and joint operations, and excludes those of equity accounted units.
Fair values of financial instruments
The carrying amounts and fair values of all of the Group’s financial instruments which are not carried at an amount which approximates their fair value at 30 June 2014 and 31 December 2013 are shown in the following table. The fair values of the Group's cash and cash equivalents and loans to equity accounted units approximate their carrying values as a result of their short maturity or because they carry floating rates of interest.
30 June 2014 31 December 2013
Carrying value
US$m
Fair value
US$m
Carrying value
US$m
Fair value
US$m Short term borrowings (2,480) (2,515) (3,916) (3,924) Medium and long term borrowings (23,545) (24,557) (24,544) (25,746)
Valuation hierarchy of financial instruments carried at fair value on a recurring basis
The table below shows the financial instruments carried at fair value by valuation method at 30 June 2014:
Total (h)
Level 1 (a) (h)
Level 2 (b) (h)
Level 3 (c) (h)
Not held at fair value
Assets Listed and unlisted equity shares and quoted funds 226 105 65 14 42 Other investments, including loans (d) 540 129 - 222 189 Trade receivables (e) 2,682 13 34 - 2,635 3,448 247 99 236 2,866 Derivatives Forward contracts: designated as hedges (f) 17 - (2) 19 - Forward contracts and option contracts: not designated as hedges (f)
299
-
(11)
310
-
Derivatives related to net debt (g) 276 (2) 278 - - 4,040 245 364 565 2,866
The table below shows the financial instruments carried at fair value by valuation method at 31 December 2013:
Total (h)
Level 1 (a) (h)
Level 2 (b) (h)
Level 3 (c) (h)
Not held at fair value
Assets Listed and unlisted equity shares and quoted funds 279 139 79 15 46 Other investments, including loans (d) 506 106 1 215 184 785 245 80 230 230 Derivatives Forward contracts: designated as hedges (f) 21 - - 21 - Forward contracts and option contracts: not designated as hedges (f)
231
2
19
210
-
Derivatives related to net debt (g) 173 - 173 - - 1,210 247 272 461 230
Page 39 of 49
Fair value disclosure for financial instruments (continued)
(a) Valuation is based on unadjusted quoted prices in active markets for identical financial instruments. This category includes listed equity shares and other quoted funds.
(b) Valuation is based on inputs that are observable for the financial instruments; these include quoted prices for similar instruments or identical instruments in markets which are not considered to be active, or inputs, either directly or indirectly based on observable market data.
(c) Valuation is based on inputs for the asset or liability that are not based on observable market data (unobservable inputs).
(d) Other Investments, including loans, comprise: Cash deposits in rehabilitation funds, government bonds, contingent consideration receivable from divested businesses, and royalty amounts receivable. The royalty receivables are valued based on an estimate of forward sales subject to the royalty agreement.
(e) Trade receivables includes provisionally priced receivables relating to sales contracts where selling price is determined after delivery to the customer, based on the market price at the relevant quotation point stipulated in the contract. Revenue is recognised on provisionally priced sales based on the forward selling price for the period stipulated in the contract. Not included within the balance above are provisionally priced trade payables of US$11 million, wherein the fair value of the expected final price has fallen below the initial consideration received.
(f) Level 3 derivatives consist of derivatives embedded in electricity purchase contracts linked to the LME with terms expiring between 2014 and 2040. The embedded derivatives are measured using discounted cash flows and option model valuation techniques. Long-term embedded derivatives with a fair value of US$299 million at 30 June 2014 are valued using significant unobservable inputs as the term of the derivative extends beyond the forward curve for aluminium.
Aluminium prices are flatlined beyond the market forward curve and increased by projected inflation up to the date of expiry of the contract.
The range of market prices is between US$2,356 per metric tonne in 2024 to US$3,156 in 2040.
The other contracts with a fair value of US$30 million at 30 June 2014 are categorised as level 3 as the market premium assumptions used represent unobservable inputs.
(g) Interest rate and currency interest rate swaps are valued using applicable market quoted swap yield curves adjusted for relevant basis and credit default spreads. Currency interest rate swap valuations also use market quoted foreign exchange rates. A discounted cash flow approach is applied to the cash flows derived from the inputs to determine fair value.
(h) There were no transfers between Level 1 and Level 2 or between Level 2 and Level 3 during the six months to 30 June 2014 or the year ended 31 December 2013.
Page 40 of 49
Fair value disclosure for financial instruments (continued)
Level 3 Financial instruments
The table below shows the summary of changes in the fair value of the Group's level 3 financial assets and financial liabilities for the six months to 30 June 2014 (year ended 31 December 2013).
Level 3 Financial assets and liabilities 30 June
2014 31 December
2013 Opening balance 461 189 Currency translation adjustments 7 (8) (Losses)/gains (realised) included in: – Consolidated sales revenue - (20) – Net operating costs (10) 150 Gains (unrealised) included in: – Consolidated sales revenue - 2 – Net operating costs 106 127 (Losses)/gains transferred into other comprehensive income (3) 21 Additions 4 - Closing balance 565 461 Total (losses)/gains included in the income statement for assets and liabilities (10) 130
Sensitivity analysis in respect of level 3 derivatives
Forward contracts and options whose carrying value are valued using unobservable inputs are calculated using appropriate discounted cash flow and option model valuation techniques.
The most significant of these assumptions relates to long term pricing wherein internal pricing assumptions are used after the ten year LME curve. A ten per cent increase in long term metal pricing assumptions would result in a US$124 million (31 December 2013: US$165 million) decrease in carrying value. A ten per cent decrease in long term metal pricing assumptions would result in a US$69 million (31 December 2013: US$94 million) increase in carrying value.
Acquisitions and disposals 30 June 2014
Acquisitions
There were no material acquisitions during the six months ended 30 June 2014.
Disposals
On 29 May 2014, Rio Tinto completed the sale of its 50.1 per cent interest in the Clermont Joint Venture to GS Coal for US$1,015 million subject to finalisation of net debt and working capital adjustments. The net assets and liabilities of Clermont were included within assets and liabilities of disposal groups held for sale in the Group statement of financial position at 31 December 2013.
30 June 2013
There were no material acquisitions or disposals during the six months ended 30 June 2013.
Page 41 of 49
Other disclosures
Simandou Investment Framework
On 26 May 2014, Rio Tinto and its Simandou project partners signed an Investment Framework with the Government of Guinea and agreed to transfer an equity interest in Simfer S.A., to the state. The arrangement allows the Government of Guinea to acquire equity interests of up to 25 per cent of Simfer S.A. at a discount to fair value and a further ten per cent at full fair value. Arrangements to transfer an interest in a subsidiary undertaking at a discount to fair value are considered to be a share-based payment. The discount provided or value given on the 25 per cent interest in Simfer S.A. has been calculated in accordance with IFRS 2 'Share-based payment' as a charge of US$230 million.
The first tranche of shares comprising 7.5 per cent Non-Contributory Shares was transferred free of charge to the Government of Guinea on 26 May 2014. A second tranche comprising ten per cent Ordinary Contributory Shares may be acquired at any time for a pro rata share of historical mining cost. The third tranche of shares comprising 7.5 per cent Non-Contributory Shares may be transferred at any time after 22 April 2016 free of charge. The remaining two tranches of five per cent Ordinary Contributing Shares may be acquired by the Government of Guinea at market value at any time after 22 April 2026 and 22 April 2031 respectively.
Oyu Tolgoi cash generating unit
An impairment review of the Oyu Tolgoi cash-generating unit at 31 December 2013 resulted in a pre-tax impairment of US$1,149 million to goodwill and US$3,567 million to property, plant and equipment, primarily as a result of the delay in developing the underground mine. No goodwill remains in the Group’s statement of financial position following the 2013 impairment, however in accordance with IAS 36 ‘Impairment of Assets’, the Group is required at each reporting date to assess whether there are any indicators that an asset may be impaired.
A consideration of external and internal sources of information impacting the valuation of the Oyu Tolgoi cash-generating unit at 30 June 2014 did not indicate that Oyu Tolgoi was impaired.
The restart of the underground development is dependent upon approval by the shareholders of Oyu Tolgoi LLC of the feasibility study. Rio Tinto continues to engage with the Government of Mongolia with the aim of resolving a number of outstanding shareholder issues which have delayed the distribution of the feasibility study. Lender commitments for project financing are currently scheduled to expire on 30 September 2014. Delays to the relative timing of cash flows for restart of the development of the underground could have an adverse impact on the recoverable amount of the Oyu Tolgoi cash-generating unit and result in impairment.
Capital commitments
Capital commitments, excluding the Group’s share of joint venture capital commitments, were US$4,411 million (31 December 2013: US$5,499 million).
The Group’s share of joint venture capital commitments contracted for at 30 June 2014 but not yet incurred were US$1,302 million (31 December 2013: US$1,747 million).
Contingent liabilities (subsidiaries and joint operations)
Contingent liabilities, indemnities and other performance guarantees were US$354 million at 30 June 2014 (31 December 2013: US$489 million).
Indemnities and other performance guarantees represent the potential outflow of funds from the Group for the satisfaction of obligations including those under contractual arrangements (for example undertakings related to rehabilitation activities and supplier agreements) not provided for in the statement of financial position, where the likelihood of the guarantees or indemnities being called is assessed as possible rather than probable or remote. There were no contingent liabilities arising in relation to the Group’s joint ventures and associates.
There are a number of legal claims currently outstanding against the Group. No material loss to the Group is expected to result from these claims.
Page 42 of 49
Other disclosures (continued)
Contingent assets
The Group has various insurance claims outstanding with reinsurers including claims relating to the Manefay slide at Kennecott Utah Copper in April 2013. An interim progress payment was received on this claim in 2013 and engagement with insurers continues.
Related party matters
Purchases relate largely to amounts charged by equity accounted units for toll processing of alumina and purchases of bauxite and aluminium. Sales relate largely to charges for supply of coal to jointly controlled marketing entities for onward sale to third party customers. Details of the Group's principal equity accounted units are given in the 2013 Annual report.
Income statement items
Six months to 30 June
2014 US$m
Six months to 30 June
2013 US$m
Purchases from equity accounted units (1,051) (963) Sales to equity accounted units 422 858 Cash flow statement items
Dividends from equity accounted units 42 531 Net funding of equity accounted units (84) (93)
Balance sheet items
30 June 2014
US$m
31 December 2013
US$m Investments in equity accounted units 4,412 3,957 Loans to equity accounted units 91 94 Loans from equity accounted units (51) (86) Trade and other receivables: amounts due from equity accounted units 638 615 Trade and other payables: amounts due to equity accounted units (275) (290) Rio Tinto plc guarantees to pay the Rio Tinto Pension Fund (UK) any contributions due from Group companies participating in that fund, pro rata to its ownership of those companies and subject to certain conditions, in the event that the companies fail to meet their contribution requirements. Furthermore, Rio Tinto plc has in place a guarantee for the Rio Tinto Pension Fund, in the standard form required by the Pension Protection Fund ('PPF'), to cover 105 per cent of the Fund's liabilities measured on the PPF's prescribed assumptions. Other similar guarantees in place include a Rio Tinto plc guarantee to the Rio Tinto 2009 pension fund, with no limit on liabilities.
In February 2011 an agreement between Alcan Holdings Switzerland and the Alcan Schweiz pension fund was executed whereby the funding deficit as at 31 December 2010 in relation to the pensioner population will be funded by Alcan Holdings Switzerland over a six year period.
Events after the statement of financial position date
Rio Tinto Coal Mozambique
On 30 July 2014, Rio Tinto announced that it had reached an agreement to sell Rio Tinto Coal Mozambique, which comprises the Benga coal mine and other projects in the Tete province of Mozambique, to International Coal Ventures Private Limited for US$50 million. The sale is subject to certain conditions precedent and regulatory approvals. The transaction is expected to close in the third quarter of 2014.
SouthGobi Resources Ltd
On 29 July 2014, Turquoise Hill announced that it had entered into a share purchase agreement with National United Resources Holdings Limited, for the sale of a 29.95 per cent stake in SouthGobi Resources Ltd. (‘SouthGobi’). Turquoise Hill has a 55.95 per cent interest in SouthGobi and Rio Tinto has 50.8 per cent ownership of Turquoise Hill. The transaction is expected to close during the second half of 2014.
Page 43 of 49
Basis of preparation The condensed consolidated interim financial statements included in this report have been prepared in accordance with International Accounting Standard ('IAS') 34 'Interim financial reporting' as adopted by the European Union ('EU'), the Disclosure and Transparency Rules ('DTR') of the Financial Conduct Authority ('FCA') applicable to interim financial reporting and an Order under section 340 of the Australian Corporations Act 2001 issued by the Australian Securities and Investments Commission on 22 December 2010 (as amended on 17 February 2012).
These condensed interim financial statements represent a ‘condensed set of financial statements’ as referred to in the DTR issued by the FCA. Accordingly, they do not include all of the information required for a full annual financial report and are to be read in conjunction with the Group’s annual financial statements for the year ended 31 December 2013. These annual financial statements were prepared in accordance with International Financial Reporting Standards (‘IFRS’) and interpretations issued from time to time by the IFRS Interpretations Committee and adopted by the EU that were mandatory for calendar year 2013 or, in certain cases permitted to be early adopted.
The condensed financial statements are unaudited and do not constitute statutory accounts as defined in Section 434 of the United Kingdom Companies Act 2006. The financial information for the year to 31 December 2013 included in this report has been extracted from the full financial statements filed with the Registrar of Companies and does not constitute statutory accounts as defined in section 434 of the Companies Act 2006. The Auditors' report on these full financial statements was unqualified, did not include a reference to any matters to which the auditor drew attention by way of emphasis of matter and did not contain statements under section 498 (2) (regarding adequacy of accounting records and returns), or under section 498 (3) (regarding provision of necessary information and explanations) of the Companies Act 2006.
Accounting policies The EU IFRS condensed consolidated interim financial statements have been drawn up on the basis of accounting policies, methods of computation and presentation consistent with those applied in the financial statements for the year ended 31 December 2013 except that the Group has early adopted IFRIC 21 'Levies' which has been endorsed by the EU and a number of amendments issued by the International Accounting Standards Board ('IASB') which apply for the first time in 2014. These new pronouncements do not have a significant impact on the accounting policies, methods of computation or presentation applied by the Group and therefore the prior period consolidated financial statements have not been restated. The Group has not early adopted any other amendments, standards or interpretations that have been issued but are not yet effective.
The critical accounting judgements and key sources of estimation uncertainty for the half year are the same as those disclosed in the Group's consolidated financial statements for the year ended 31 December 2013.
In the interim financial statements for the six months ended 30 June 2013, a balance of US$1,080 million was included in Trade and other receivables which should have been offset against an amount of US$1,080 million included in Trade and other payables to comply with the group’s accounting policies.
The financial information by business unit and the geographic analysis of sales by destination provided on pages 10 to 12 and 36 of this press release respectively, satisfy the disclosure requirements of IFRS 8 'Operating Segments' for interim financial statements and also provide additional voluntary disclosure which the Group considers is useful to the users of the financial statements.
Going Concern After making enquiries, the directors have a reasonable expectation that the Group has adequate resources to continue in operational existence for the foreseeable future. The Group therefore continues to adopt the going concern basis in preparing its condensed consolidated interim financial statements.
Non-GAAP measures The Group presents certain non-GAAP financial measures, including underlying earnings, which are reconciled to directly comparable IFRS financial measures on page 49 of this report. These non-GAAP measures are used internally by management to assess the performance of the business. They are not a substitute for the IFRS measures and should be considered alongside those measures.
Page 44 of 49
Directors' statement of responsibility In the directors' opinion:
The condensed consolidated interim financial statements on pages 30 to 43 including the notes have been prepared in accordance with IAS 34 'Interim Financial Reporting' as adopted by the European Union, the Disclosure and Transparency Rules ('DTR') of the Financial Conduct Authority in the United Kingdom, applicable accounting standards and the Australian Corporations Act 2001 as modified by an order of the Australian Securities and Investments Commission issued on 22 December 2010 (as amended on 17 February 2012), using the most appropriate accounting policies for Rio Tinto's business and supported by reasonable and prudent judgements.
The condensed consolidated interim financial statements give a true and fair view of the Rio Tinto Group's financial position as at 30 June 2014 and of its performance, as represented by the results of its operations, comprehensive income and expense and its cash flows for the six months then ended.
There are reasonable grounds to believe that each of the Rio Tinto Group, Rio Tinto Limited and Rio Tinto plc will be able to pay its debts as and when they become due and payable.
The interim management report includes a fair review of the information required by DTR 4.2.7 and DTR 4.2.8, namely:
− an indication of important events that have occurred during the first six months and their impact on the condensed set of consolidated financial statements, and a description of the principal risks and uncertainties for the remaining six months of the financial year; and
− material related-party transactions in the first six months and any material changes in the related-party transactions described in the last annual report.
Signed in accordance with a resolution of the Board of Directors.
Sam Walsh Chief executive 7 August 2014
Jan du Plessis Chairman 7 August 2014
Auditor's Independence Declaration As lead auditor for the review of Rio Tinto Limited for the period ended 30 June 2014, I declare that to the best of my knowledge and belief, there have been:
a) no contraventions of the auditor independence requirements of the Corporations Act 2001 in relation to the review; and
b) no contraventions of any applicable code of professional conduct in relation to the review.
This declaration is in respect of Rio Tinto Limited and the entities it controlled during the period.
Paul Bendall Partner
PricewaterhouseCoopers Melbourne 7 August 2014
Liability limited by a scheme approved under Professional Standards Legislation
Page 45 of 49
Independent review report of PricewaterhouseCoopers LLP to the members of Rio Tinto plc and PricewaterhouseCoopers to the members of Rio Tinto Limited
Introduction
For the purpose of this report, the terms 'we' and 'our' denote PricewaterhouseCoopers LLP in relation to UK legal, professional and regulatory responsibilities and reporting obligations to Rio Tinto plc and PricewaterhouseCoopers in relation to Australian legal, professional and regulatory responsibilities and reporting obligations to Rio Tinto Limited.
We have been engaged by Rio Tinto plc and Rio Tinto Limited (the 'Companies') to review the interim financial information in the interim report of the Rio Tinto Group comprising the Companies and their subsidiaries, associates and joint ventures (the 'Group') for the six months ended 30 June 2014, which comprises the Group income statement, Group statement of comprehensive income, Group statement of cash flows, Group statement of financial position, Group statement of changes in equity and related notes (including the financial information by business unit). We have read the other information contained in the interim report and considered whether it contains any apparent misstatements or material inconsistencies with the information in the interim financial information.
Directors' responsibilities
The interim report is the responsibility of, and has been approved by, the directors of the Companies. The directors are responsible for preparing the interim report in accordance with the Disclosure and Transparency Rules of the United Kingdom's Financial Conduct Authority and Corporations Act 2001 in Australia as amended by the Australian Securities and Investments Commission Order dated 22 December 2010, as amended on 17 February 2012 (the 'ASIC Order' described in the Australian Corporations Act – Summary of ASIC relief) and for such internal control as the directors determine necessary to enable the preparation of the interim report that gives a true and fair view and is free from material misstatement, whether due to fraud or error.
As disclosed in Note 1 Principal Accounting Policies of the 2013 Annual Report, the financial statements of the Group are prepared in accordance with International Financial Reporting Standards (‘IFRS’) as adopted by the European Union. The interim financial information included in this interim report has been prepared in accordance with International Accounting Standard IAS 34, Interim Financial Reporting, as adopted by the European Union.
Our responsibility
Our responsibility is to express a conclusion on the interim financial information in the interim report based on our review. PricewaterhouseCoopers LLP have prepared this review report, including the conclusion, for and only for Rio Tinto plc for the purpose of the Disclosure and Transparency Rules of the Financial Conduct Authority and PricewaterhouseCoopers have prepared this review report, including the conclusion, for and only for Rio Tinto Limited for the purpose of the Corporations Act 2001 in Australia as amended by the ASIC Order and for no other purpose. We do not, in producing this report, accept or assume responsibility for any other purpose or to any other person to whom this report is shown or into whose hands it may come save where expressly agreed by our prior consent in writing.
Scope of review
We conducted our review in accordance with International Standard on Review Engagements (UK and Ireland) ISRE 2410, Review of Interim Financial Information Performed by the Independent Auditor of the Entity issued by the Auditing Practices Board for use in the United Kingdom and the Auditing Standard on Review Engagements ASRE 2410 Review of a Financial Report Performed by the Independent Auditor of the Entity. As the auditor of the Group, ISRE 2410 and ASRE 2410 require that we comply with the ethical requirements relevant to the audit of the annual financial report.
A review of interim financial information consists of making enquiries, primarily of persons responsible for financial and accounting matters, and applying analytical and other review procedures. A review is substantially less in scope than an audit conducted in accordance with International Standards on Auditing (UK and Ireland) or Australian Auditing Standards and consequently does not enable us to obtain assurance that we would become aware of all significant matters that might be identified in an audit. Accordingly, we do not express an audit opinion.
Page 46 of 49
Independence
In conducting our review, we have complied with the independence requirements of the Corporations Act 2001 in Australia.
Conclusion of PricewaterhouseCoopers LLP for Rio Tinto plc
Based on our review, nothing has come to our attention that causes us to believe that the interim information in the interim financial report of the Group for the six months ended 30 June 2014 is not prepared, in all material respects, in accordance with International Accounting Standard IAS 34 Interim Financial Reporting as adopted by the European Union and the Disclosure and Transparency Rules of the United Kingdom's Financial Conduct Authority.
Conclusion of PricewaterhouseCoopers for Rio Tinto Limited
Based on our review, which is not an audit, we have not become aware of any matter that makes us believe that the interim financial report of Rio Tinto Limited is not in accordance with the Corporations Act 2001 in Australia as amended by the ASIC Order, including:
a) giving a true and fair view of the Group's financial position as at 30 June 2014 and of its performance for the half year ended on that date; and
b) complying with International Accounting Standard IAS 34 Interim Financial Reporting as adopted by the European Union and the Corporations Regulations 2001 in Australia.
Paul Bendall Partner
PricewaterhouseCoopers LLP PricewaterhouseCoopers Chartered Accountants Chartered Accountants London Melbourne 7 August 2014 7 August 2014
in respect of Rio Tinto plc in respect of Rio Tinto Limited Liability limited by a scheme approved under Professional Standards Legislation
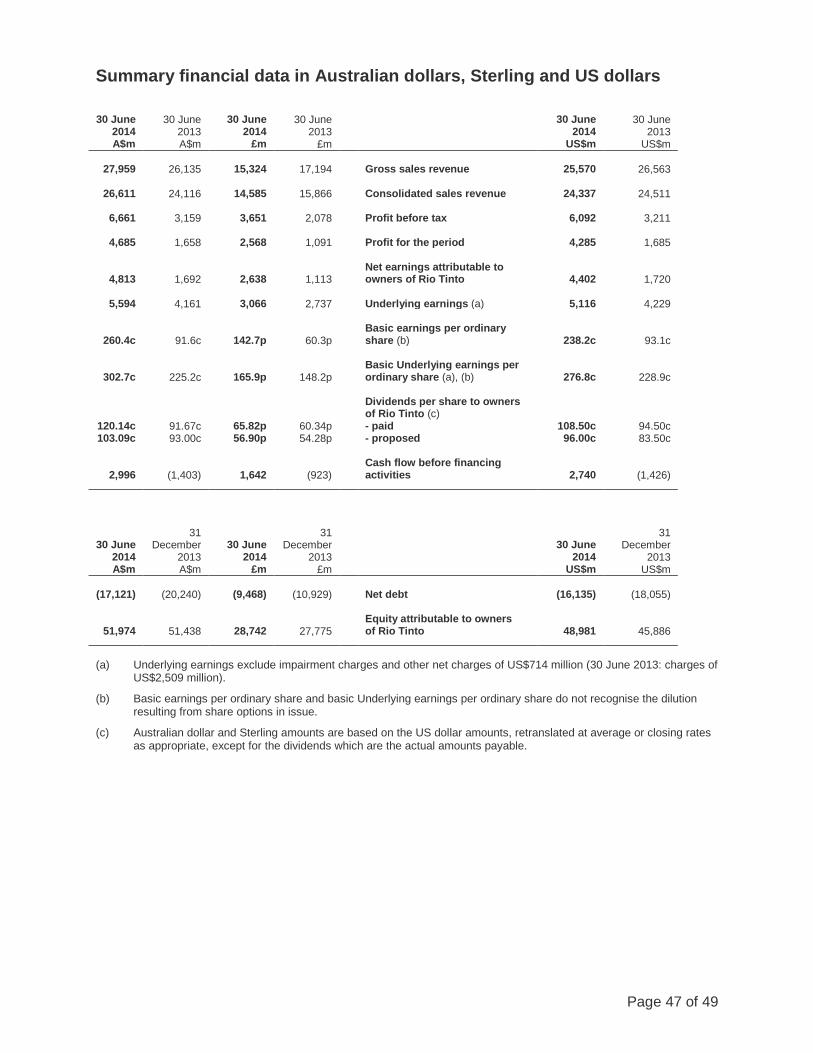
Page 47 of 49
Summary financial data in Australian dollars, Sterling and US dollars 30 June
2014 A$m
30 June 2013 A$m
30 June 2014
£m
30 June 2013
£m
30 June 2014
US$m
30 June 2013
US$m
27,959 26,135 15,324 17,194 Gross sales revenue 25,570 26,563
26,611 24,116 14,585 15,866 Consolidated sales revenue 24,337 24,511
6,661 3,159 3,651 2,078 Profit before tax 6,092 3,211
4,685 1,658 2,568 1,091 Profit for the period 4,285 1,685 Net earnings attributable to
4,813 1,692 2,638 1,113 owners of Rio Tinto 4,402 1,720
5,594 4,161 3,066 2,737 Underlying earnings (a) 5,116 4,229
260.4c 91.6c 142.7p 60.3p Basic earnings per ordinary share (b) 238.2c 93.1c
302.7c 225.2c 165.9p 148.2p Basic Underlying earnings per ordinary share (a), (b) 276.8c 228.9c
Dividends per share to owners of Rio Tinto (c)
120.14c 91.67c 65.82p 60.34p - paid 108.50c 94.50c 103.09c 93.00c 56.90p 54.28p - proposed 96.00c 83.50c
2,996 (1,403) 1,642 (923) Cash flow before financing activities 2,740 (1,426)
30 June 31
December 30 June 31
December 30 June 31
December 2014 2013 2014 2013 2014 2013 A$m A$m £m £m US$m US$m
(17,121) (20,240) (9,468) (10,929) Net debt (16,135) (18,055)
51,974 51,438 28,742 27,775 Equity attributable to owners of Rio Tinto 48,981 45,886
(a) Underlying earnings exclude impairment charges and other net charges of US$714 million (30 June 2013: charges of
US$2,509 million).
(b) Basic earnings per ordinary share and basic Underlying earnings per ordinary share do not recognise the dilution resulting from share options in issue.
(c) Australian dollar and Sterling amounts are based on the US dollar amounts, retranslated at average or closing rates as appropriate, except for the dividends which are the actual amounts payable.
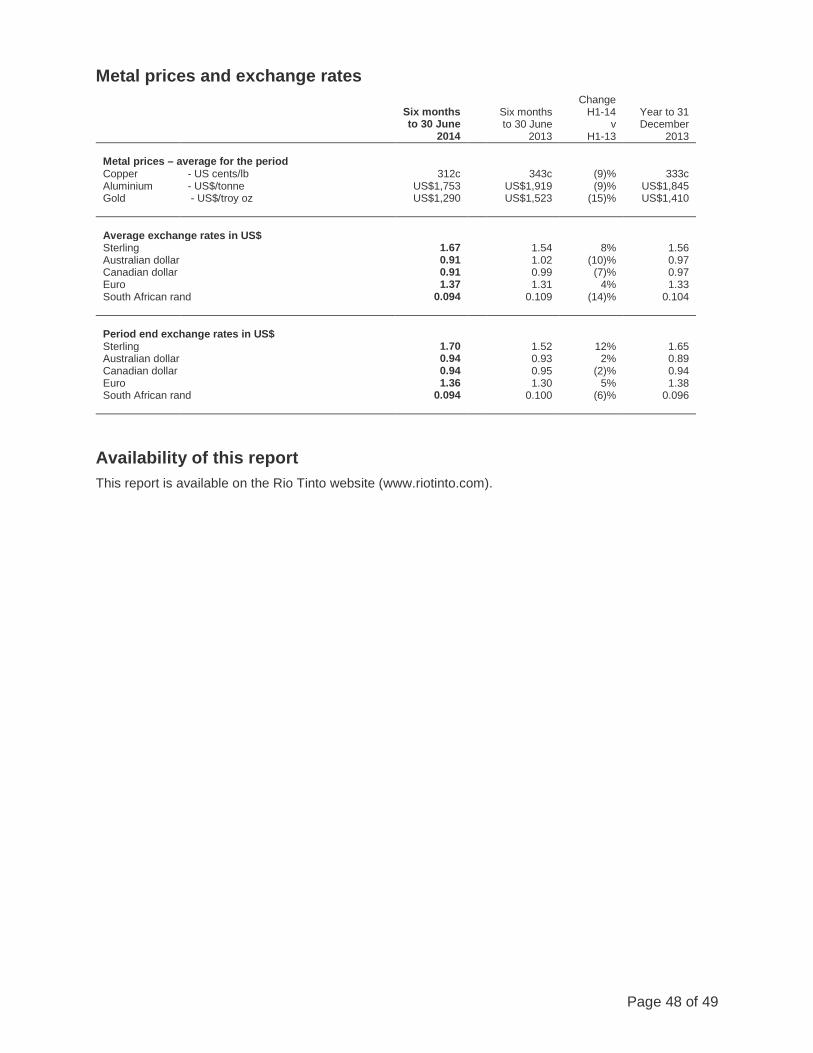
Page 48 of 49
Metal prices and exchange rates
Six months to 30 June
2014
Six months to 30 June
2013
Change H1-14
v H1-13
Year to 31 December
2013 Metal prices – average for the period Copper - US cents/lb 312c 343c (9)% 333c Aluminium - US$/tonne US$1,753 US$1,919 (9)% US$1,845 Gold - US$/troy oz US$1,290 US$1,523 (15)% US$1,410 Average exchange rates in US$ Sterling 1.67 1.54 8% 1.56 Australian dollar 0.91 1.02 (10)% 0.97 Canadian dollar 0.91 0.99 (7)% 0.97 Euro 1.37 1.31 4% 1.33 South African rand
0.094 0.109 (14)% 0.104
Period end exchange rates in US$ Sterling 1.70 1.52 12% 1.65 Australian dollar 0.94 0.93 2% 0.89 Canadian dollar 0.94 0.95 (2)% 0.94 Euro 1.36 1.30 5% 1.38 South African rand
0.094 0.100 (6)% 0.096
Availability of this report This report is available on the Rio Tinto website (www.riotinto.com).
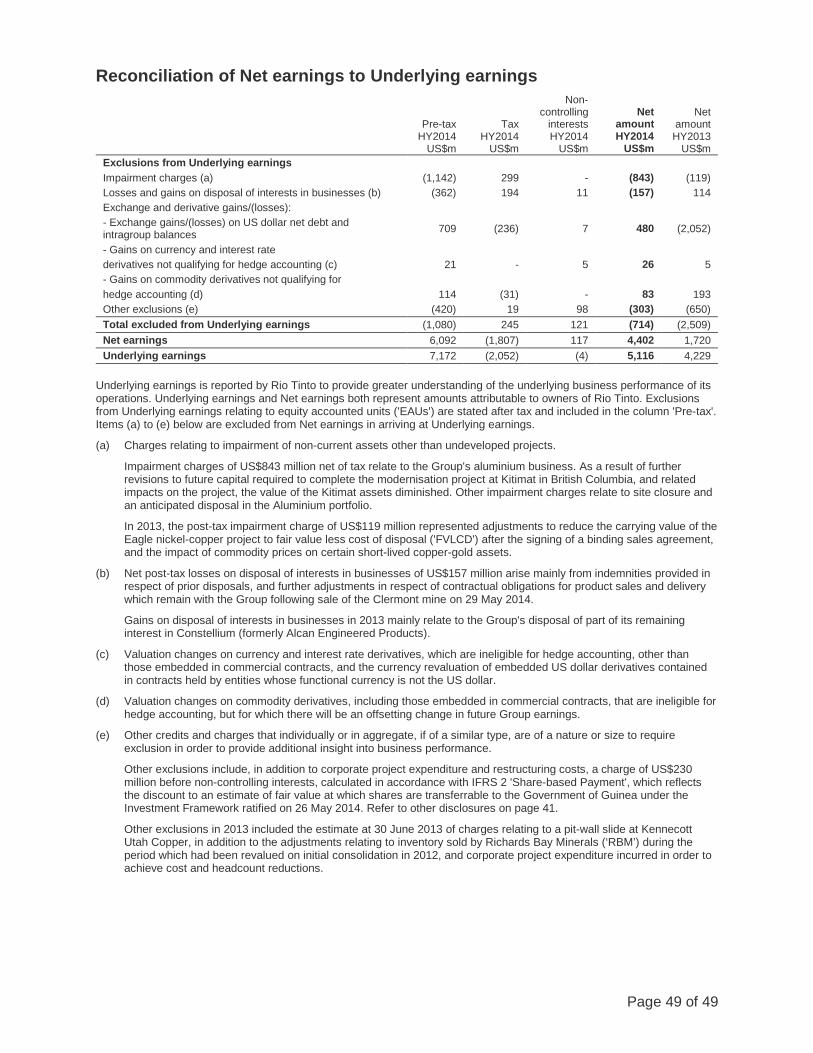
Page 49 of 49
Reconciliation of Net earnings to Underlying earnings
Pre-tax HY2014
US$m
Tax HY2014
US$m
Non-controlling
interests HY2014
US$m
Net amount HY2014
US$m
Net amount HY2013
US$m Exclusions from Underlying earnings Impairment charges (a) (1,142) 299 - (843) (119) Losses and gains on disposal of interests in businesses (b) (362) 194 11 (157) 114 Exchange and derivative gains/(losses): - Exchange gains/(losses) on US dollar net debt and intragroup balances 709 (236) 7 480 (2,052)
- Gains on currency and interest rate derivatives not qualifying for hedge accounting (c) 21 - 5 26 5 - Gains on commodity derivatives not qualifying for hedge accounting (d) 114 (31) - 83 193 Other exclusions (e) (420) 19 98 (303) (650) Total excluded from Underlying earnings (1,080) 245 121 (714) (2,509) Net earnings 6,092 (1,807) 117 4,402 1,720 Underlying earnings 7,172 (2,052) (4) 5,116 4,229
Underlying earnings is reported by Rio Tinto to provide greater understanding of the underlying business performance of its operations. Underlying earnings and Net earnings both represent amounts attributable to owners of Rio Tinto. Exclusions from Underlying earnings relating to equity accounted units ('EAUs') are stated after tax and included in the column 'Pre-tax'. Items (a) to (e) below are excluded from Net earnings in arriving at Underlying earnings.
(a) Charges relating to impairment of non-current assets other than undeveloped projects.
Impairment charges of US$843 million net of tax relate to the Group's aluminium business. As a result of further revisions to future capital required to complete the modernisation project at Kitimat in British Columbia, and related impacts on the project, the value of the Kitimat assets diminished. Other impairment charges relate to site closure and an anticipated disposal in the Aluminium portfolio.
In 2013, the post-tax impairment charge of US$119 million represented adjustments to reduce the carrying value of the Eagle nickel-copper project to fair value less cost of disposal ('FVLCD') after the signing of a binding sales agreement, and the impact of commodity prices on certain short-lived copper-gold assets.
(b) Net post-tax losses on disposal of interests in businesses of US$157 million arise mainly from indemnities provided in respect of prior disposals, and further adjustments in respect of contractual obligations for product sales and delivery which remain with the Group following sale of the Clermont mine on 29 May 2014.
Gains on disposal of interests in businesses in 2013 mainly relate to the Group's disposal of part of its remaining interest in Constellium (formerly Alcan Engineered Products).
(c) Valuation changes on currency and interest rate derivatives, which are ineligible for hedge accounting, other than those embedded in commercial contracts, and the currency revaluation of embedded US dollar derivatives contained in contracts held by entities whose functional currency is not the US dollar.
(d) Valuation changes on commodity derivatives, including those embedded in commercial contracts, that are ineligible for hedge accounting, but for which there will be an offsetting change in future Group earnings.
(e) Other credits and charges that individually or in aggregate, if of a similar type, are of a nature or size to require exclusion in order to provide additional insight into business performance.
Other exclusions include, in addition to corporate project expenditure and restructuring costs, a charge of US$230 million before non-controlling interests, calculated in accordance with IFRS 2 'Share-based Payment', which reflects the discount to an estimate of fair value at which shares are transferrable to the Government of Guinea under the Investment Framework ratified on 26 May 2014. Refer to other disclosures on page 41.
Other exclusions in 2013 included the estimate at 30 June 2013 of charges relating to a pit-wall slide at Kennecott Utah Copper, in addition to the adjustments relating to inventory sold by Richards Bay Minerals (‘RBM’) during the period which had been revalued on initial consolidation in 2012, and corporate project expenditure incurred in order to achieve cost and headcount reductions.