Embed Size (px)
Citation preview
MEDIA USE, AND ATTITUDES TOWARDS MEDIA, IN SIERRA LEONE A Comprehensive Baseline Study BBC World Service Trust and Search for Common Ground June 2007 Funded through the UK Government Department for International Development (DfID) programme of work on Promoting Information and Voice for Transparency on Elections (PIVOT)
CONTENTS SUMMARY OF KEY FINDINGS 1. INTRODUCTION 1 2. METHODOLOGY 2 • Sampling approach 2 • Demographics of sample 3 3. ACCESS TO RADIO AND LISTENING PATTERNS 5 • Access to radio across all sample Districts/Areas 5 • Access to radio among men and women 5 • Access to radio across age groups 7 • Listening patterns throughout the day: weekdays and weekends 9 4. FREQUENCY OF LISTENING AND STATIONS LISTENED TO ACROSS EIGHT SAMPLE DISTRICTS/AREAS 11 • Western Area 11 • Northern Province 13 • Southern Province 15 • Eastern Province 17 • Appeal of different programme types 19 5. LITERACY LEVELS AND NEWSPAPER CONSUMPTION 22 • Literacy levels 22 • Frequency of newspaper readership 24 • Readership of specific newspaper titles 26 • Readership of specific newspapers: Western Area 26 6. SOURCES OF INFORMATION ON ELECTIONS AND LEVELS OF TRUST IN MEDIA 28 • Sources of information about what is happening in Sierra Leone and
about forthcoming elections 28 • Trust in media sources 30 • Relevance of election information heard through the radio 32
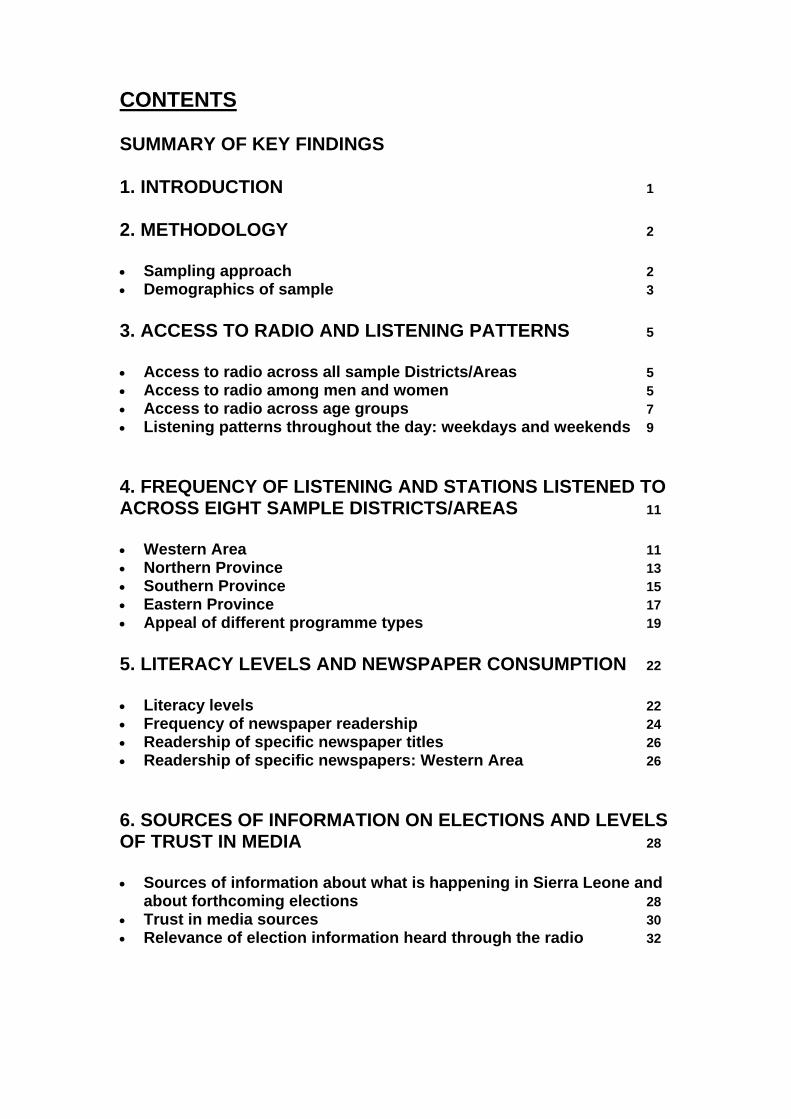
KEY FINDINGS 1) Radio is an effective way of getting information to many
people across Sierra Leone
Access to radio is high (over 80% of people have access to radio), and the majority of those with access report listening to the radio every day or almost every day.
Radio is the most commonly mentioned source of information about
what is happening across Sierra Leone, and, more specifically, for information relating to national elections.
Radio is the most trusted source of information about national
elections (higher than newspapers, TV, and friends, family and community members)
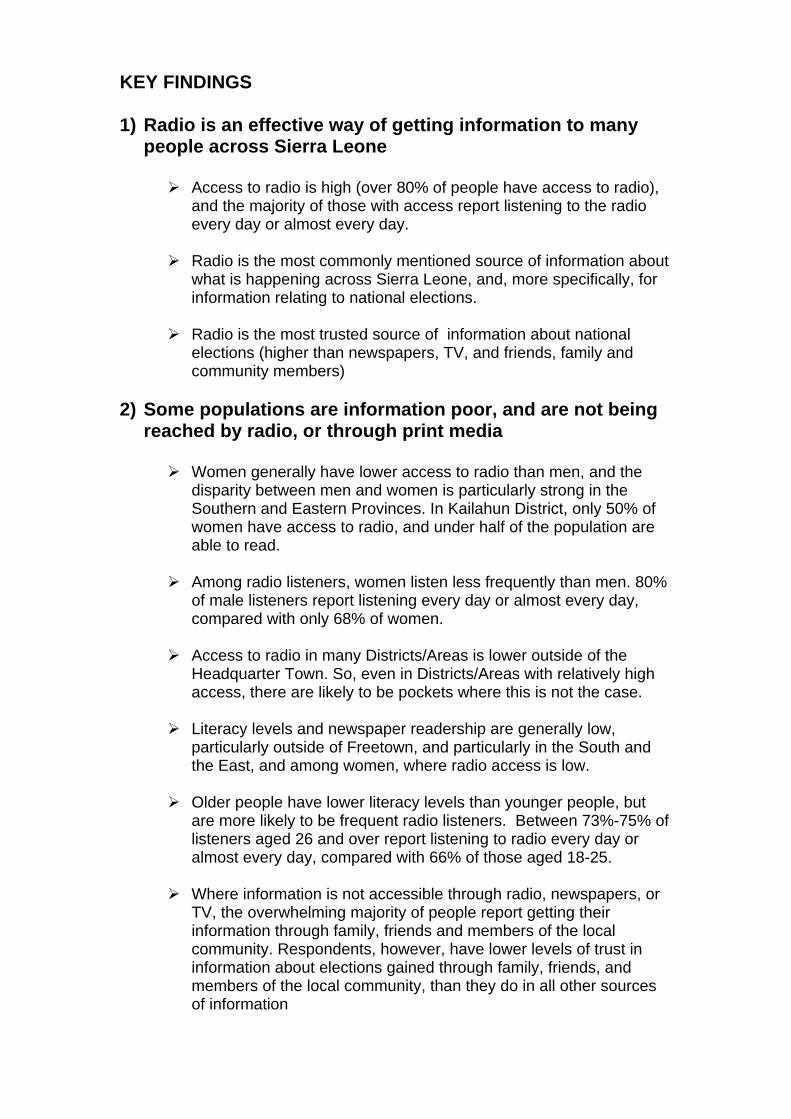
2) Some populations are information poor, and are not being
reached by radio, or through print media
Women generally have lower access to radio than men, and the disparity between men and women is particularly strong in the Southern and Eastern Provinces. In Kailahun District, only 50% of women have access to radio, and under half of the population are able to read.
Among radio listeners, women listen less frequently than men. 80%
of male listeners report listening every day or almost every day, compared with only 68% of women.
Access to radio in many Districts/Areas is lower outside of the
Headquarter Town. So, even in Districts/Areas with relatively high access, there are likely to be pockets where this is not the case.
Literacy levels and newspaper readership are generally low,
particularly outside of Freetown, and particularly in the South and the East, and among women, where radio access is low.
Older people have lower literacy levels than younger people, but
are more likely to be frequent radio listeners. Between 73%-75% of listeners aged 26 and over report listening to radio every day or almost every day, compared with 66% of those aged 18-25.
Where information is not accessible through radio, newspapers, or
TV, the overwhelming majority of people report getting their information through family, friends and members of the local community. Respondents, however, have lower levels of trust in information about elections gained through family, friends, and members of the local community, than they do in all other sources of information
3) Although the radio market is crowded, relatively few stations in each District/Area have substantial reach.
In all sample Districts/Areas, there are between 8 and 17 radio
stations mentioned by respondents
In all Districts outside of Freetown, there are no more than four stations which more than 30% of respondents reported listening to in the previous six months. In Freetown, where choice is highest, six stations (out of a total of 17) were mentioned by more than 30% of respondents.
Boosting the information on elections on the 2-4 most listened to
stations in each District/Area is likely to have the most substantial impact.
4) Peak times for listening to radio are between 6am-10am
and 6pm-10pm on both weekdays and weekends
There are variations across Districts and Areas but early morning and early evening broadcasts have the highest proportion of people reporting listening.
Broadcasts between 10am-2pm have the lowest proportion of
people reporting listening.
Understanding local listening patterns is important in targeting information. For example, in the Western Rural Area, there are a far higher proportion of people listening to radio during the day compared with other parts of the country sampled. In Freetown, the peak evening time is later than elsewhere.
5) Newspapers and television are very poor ways of
communicating with most populations across Sierra Leone, particularly those living outside of Freetown
There are low levels of literacy across the country, particularly
outside of Freetown, among older people, and among women.
People have lower levels of trust in newspapers and TV than radio as sources of information about elections.
6) The majority of respondents place a high level of
importance in radio news being unbiased, accurate, and trustworthy source of information. News and music are the most frequently mentioned programme types that are listened to by all people.
Over 80% of respondents placed high value on radio news being
unbiased, accurate and a trustworthy source of information
Women are more likely to mention programmes on health, programmes targeted specifically at women, children’s programme and those with a religious content.
Men are more likely to mention programmes dealing with political
events and sport
Programmes on music, phone discussions and sports are mentioned less often by older than younger age groups
1
1. INTRODUCTION This report presents findings from a survey of 2,600 18-59 year olds, carried out across eight Districts across the Western Area and Northern, Southern, and Eastern Provinces of Sierra Leone. The survey was carried out over February and March 2007. The survey explored five key themes:
i. Media consumption and levels of trust in sources of information
ii. Knowledge & attitudes in relation to forthcoming and previous elections
iii. Political knowledge and attitudes towards political process and institutions
iv. Political priorities
v. Participation in social and politically motivated activities, and
membership of voluntary community groups (church, sports etc) Findings from the survey are presented in two separate reports. This report presents information on media consumption patterns across the eight sample Districts/Areas. It explores the following issues: • access to radio and patterns of radio consumption; • literacy levels and newspaper readership; • self-reported levels of trust in different sources of information; and • the self-reported relevance of information on elections which people have
received through the media
2
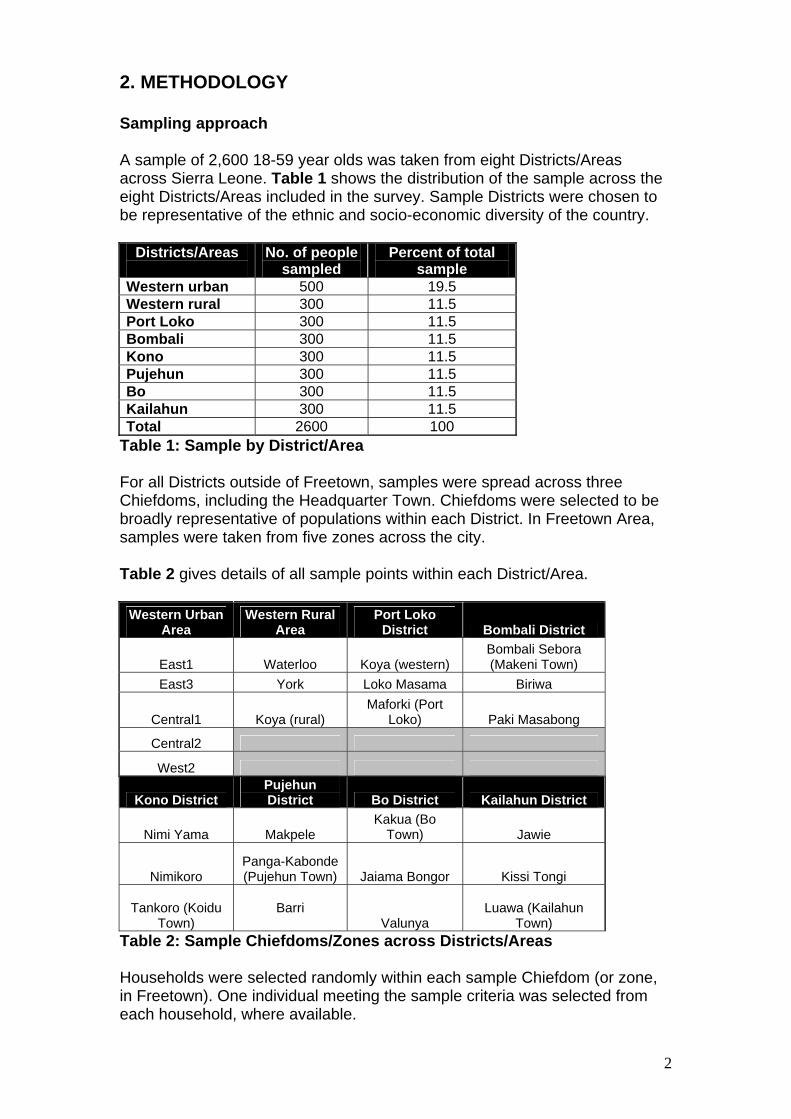
2. METHODOLOGY Sampling approach A sample of 2,600 18-59 year olds was taken from eight Districts/Areas across Sierra Leone. Table 1 shows the distribution of the sample across the eight Districts/Areas included in the survey. Sample Districts were chosen to be representative of the ethnic and socio-economic diversity of the country.
Districts/Areas
No. of people sampled
Percent of total sample
Western urban 500 19.5 Western rural 300 11.5 Port Loko 300 11.5 Bombali 300 11.5 Kono 300 11.5 Pujehun 300 11.5 Bo 300 11.5 Kailahun 300 11.5 Total 2600 100
Table 1: Sample by District/Area For all Districts outside of Freetown, samples were spread across three Chiefdoms, including the Headquarter Town. Chiefdoms were selected to be broadly representative of populations within each District. In Freetown Area, samples were taken from five zones across the city. Table 2 gives details of all sample points within each District/Area.
Western Urban Area
Western Rural Area
Port Loko District Bombali District
East1 Waterloo Koya (western) Bombali Sebora (Makeni Town)
East3 York Loko Masama Biriwa
Central1 Koya (rural) Maforki (Port
Loko) Paki Masabong
Central2
West2
Kono District Pujehun District Bo District Kailahun District
Nimi Yama Makpele Kakua (Bo
Town) Jawie
Nimikoro Panga-Kabonde (Pujehun Town) Jaiama Bongor Kissi Tongi
Tankoro (Koidu Town)
Barri
Valunya Luawa (Kailahun
Town) Table 2: Sample Chiefdoms/Zones across Districts/Areas Households were selected randomly within each sample Chiefdom (or zone, in Freetown). One individual meeting the sample criteria was selected from each household, where available.
3
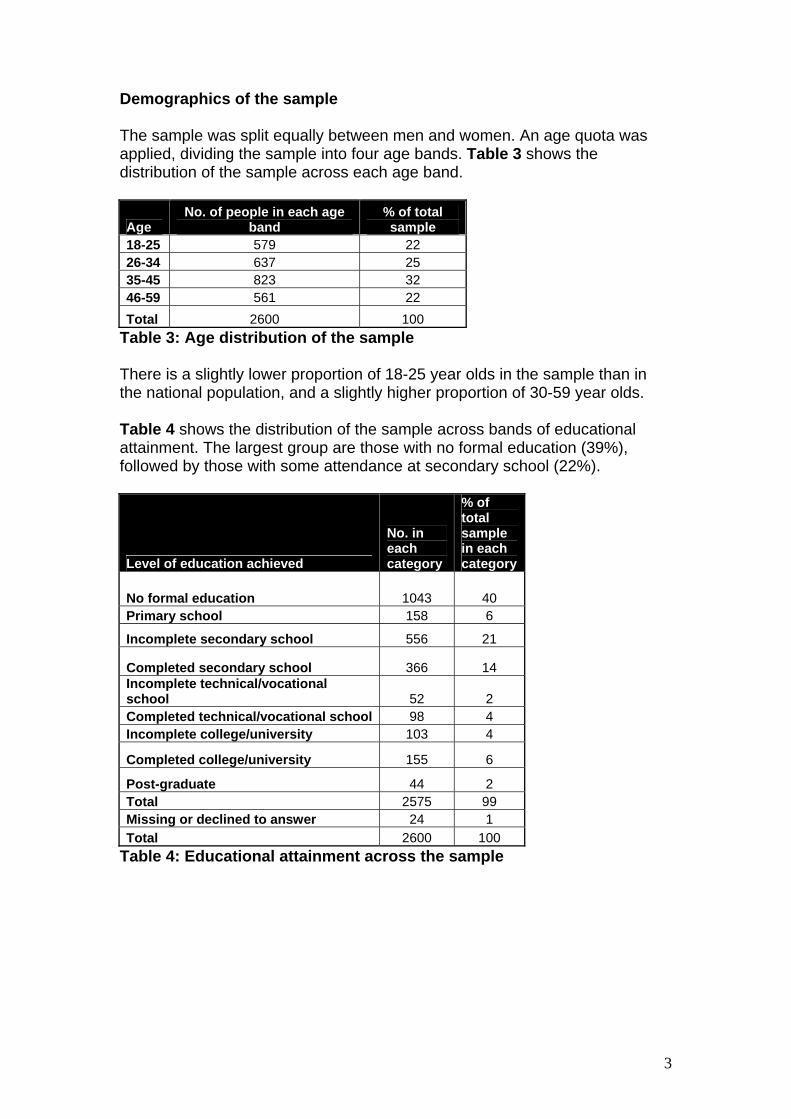
Demographics of the sample The sample was split equally between men and women. An age quota was applied, dividing the sample into four age bands. Table 3 shows the distribution of the sample across each age band.
Age No. of people in each age
band % of total sample
18-25 579 22 26-34 637 25 35-45 823 32 46-59 561 22 Total 2600 100
Table 3: Age distribution of the sample There is a slightly lower proportion of 18-25 year olds in the sample than in the national population, and a slightly higher proportion of 30-59 year olds. Table 4 shows the distribution of the sample across bands of educational attainment. The largest group are those with no formal education (39%), followed by those with some attendance at secondary school (22%).
Level of education achieved
No. in each category
% of total sample in each category
No formal education 1043 40 Primary school 158 6
Incomplete secondary school 556 21
Completed secondary school 366 14 Incomplete technical/vocational school 52 2 Completed technical/vocational school 98 4 Incomplete college/university 103 4
Completed college/university 155 6
Post-graduate 44 2 Total 2575 99 Missing or declined to answer 24 1 Total 2600 100
Table 4: Educational attainment across the sample
4
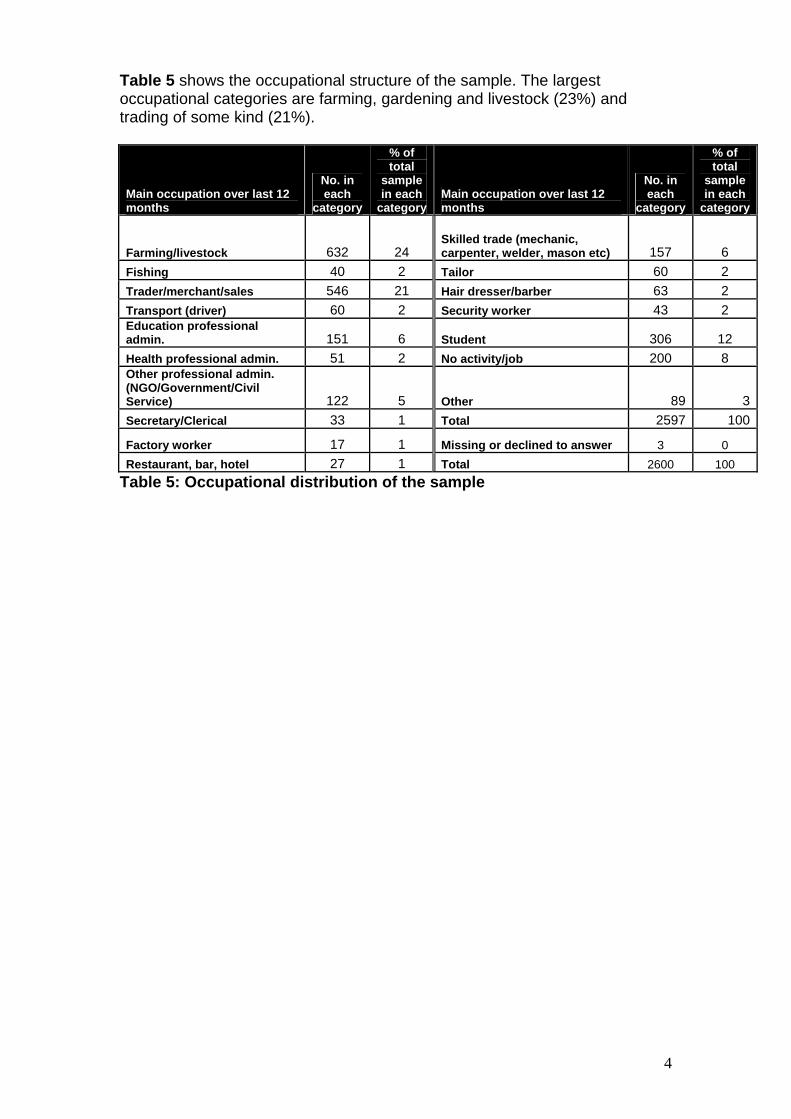
Table 5 shows the occupational structure of the sample. The largest occupational categories are farming, gardening and livestock (23%) and trading of some kind (21%).
Main occupation over last 12 months
No. in each
category
% of total
sample in each
categoryMain occupation over last 12 months
No. in each
category
% of total
sample in each
category
Farming/livestock 632 24 Skilled trade (mechanic, carpenter, welder, mason etc) 157 6
Fishing 40 2 Tailor 60 2 Trader/merchant/sales 546 21 Hair dresser/barber 63 2 Transport (driver) 60 2 Security worker 43 2 Education professional admin. 151 6 Student 306 12 Health professional admin. 51 2 No activity/job 200 8 Other professional admin. (NGO/Government/Civil Service) 122 5 Other 89 3Secretary/Clerical 33 1 Total 2597 100
Factory worker 17 1 Missing or declined to answer 3 0 Restaurant, bar, hotel 27 1 Total 2600 100
Table 5: Occupational distribution of the sample
5
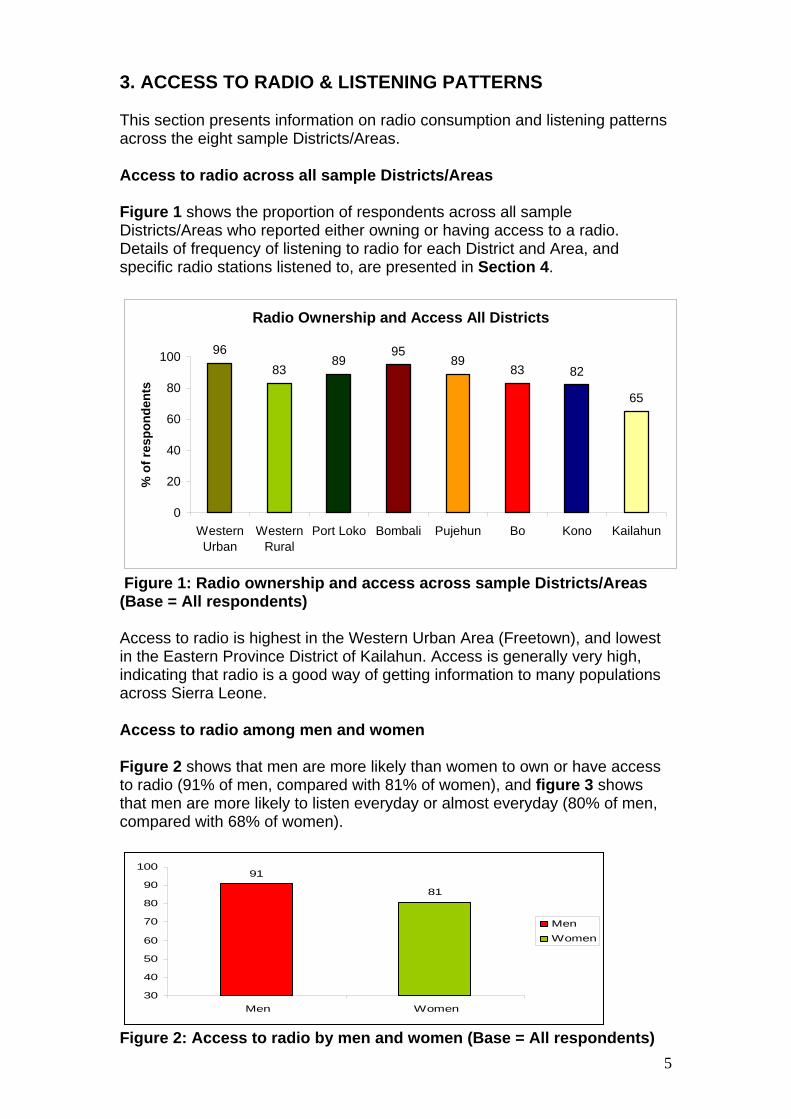
3. ACCESS TO RADIO & LISTENING PATTERNS This section presents information on radio consumption and listening patterns across the eight sample Districts/Areas. Access to radio across all sample Districts/Areas Figure 1 shows the proportion of respondents across all sample Districts/Areas who reported either owning or having access to a radio. Details of frequency of listening to radio for each District and Area, and specific radio stations listened to, are presented in Section 4.
Radio Ownership and Access All Districts
9683
8995
8983 82
65
0
20
40
60
80
100
WesternUrban
WesternRural
Port Loko Bombali Pujehun Bo Kono Kailahun
% o
f res
pond
ents
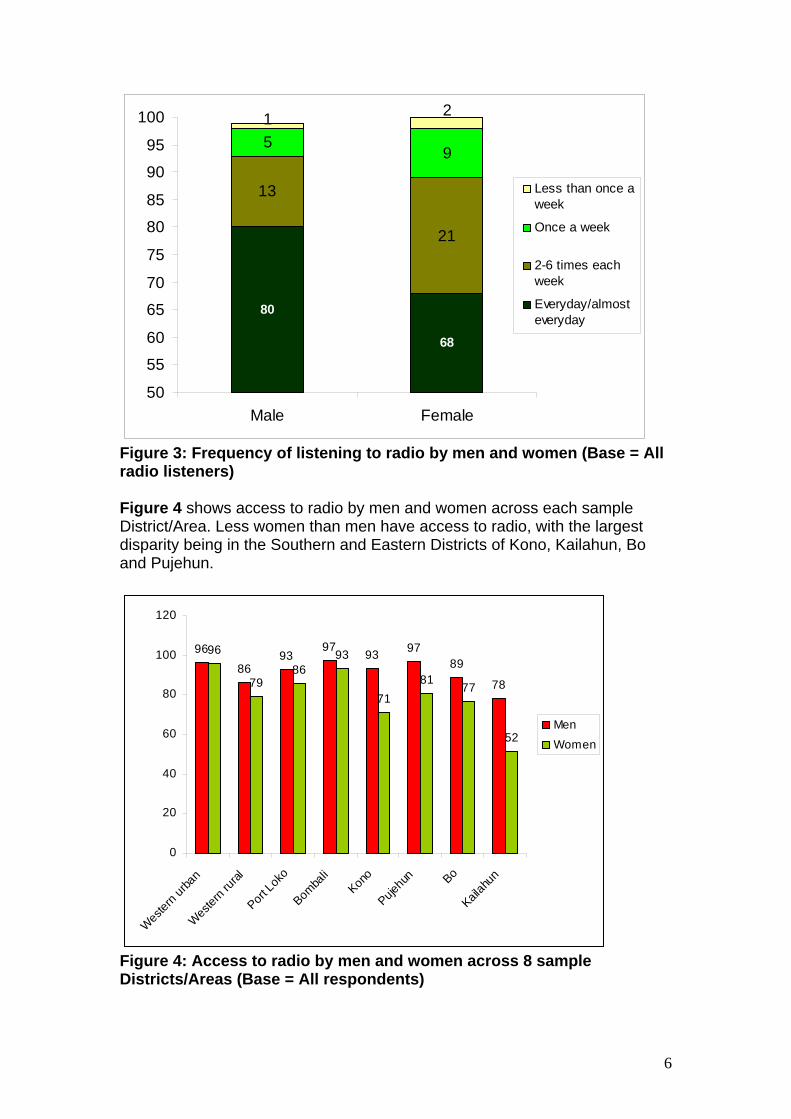
Figure 1: Radio ownership and access across sample Districts/Areas (Base = All respondents) Access to radio is highest in the Western Urban Area (Freetown), and lowest in the Eastern Province District of Kailahun. Access is generally very high, indicating that radio is a good way of getting information to many populations across Sierra Leone. Access to radio among men and women Figure 2 shows that men are more likely than women to own or have access to radio (91% of men, compared with 81% of women), and figure 3 shows that men are more likely to listen everyday or almost everyday (80% of men, compared with 68% of women).
91
81
30
40
50
60
70
80
90
100
Men Women
MenWomen
Figure 2: Access to radio by men and women (Base = All respondents)
6
80
68
13
21
59
21
50
55
60
65
70
75
80
85
90
95
100
Male Female
Less than once aweek
Once a week
2-6 times eachweek
Everyday/almosteveryday
Figure 3: Frequency of listening to radio by men and women (Base = All radio listeners) Figure 4 shows access to radio by men and women across each sample District/Area. Less women than men have access to radio, with the largest disparity being in the Southern and Eastern Districts of Kono, Kailahun, Bo and Pujehun.
96
8693
9793 97
89
78
96
7986
93
7181
77
52
0
20
40
60
80
100
120
Wester
n urba
n
Wester
n rura
l
Port Lo
ko
Bomba
liKon
o
Pujehu
n Bo
Kailah
un
Men
Women
Figure 4: Access to radio by men and women across 8 sample Districts/Areas (Base = All respondents)
7
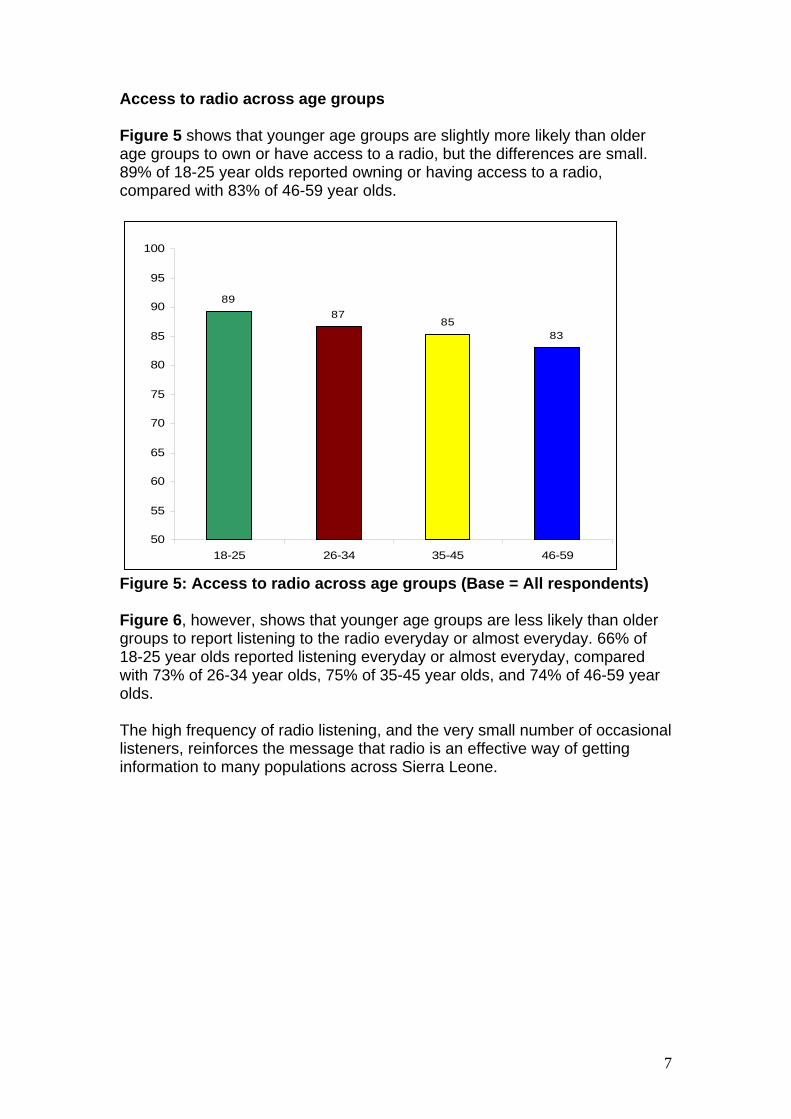
Access to radio across age groups Figure 5 shows that younger age groups are slightly more likely than older age groups to own or have access to a radio, but the differences are small. 89% of 18-25 year olds reported owning or having access to a radio, compared with 83% of 46-59 year olds.
8987
8583
50
55
60
65
70
75
80
85
90
95
100
18-25 26-34 35-45 46-59
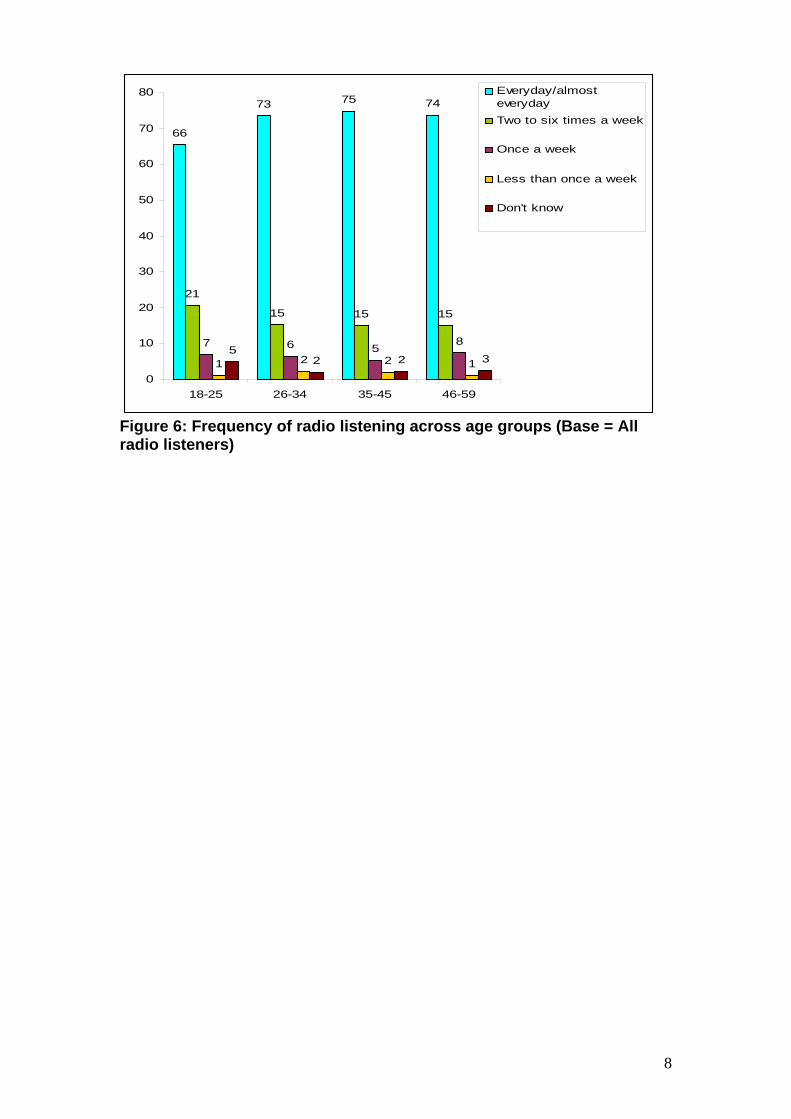
Figure 5: Access to radio across age groups (Base = All respondents) Figure 6, however, shows that younger age groups are less likely than older groups to report listening to the radio everyday or almost everyday. 66% of 18-25 year olds reported listening everyday or almost everyday, compared with 73% of 26-34 year olds, 75% of 35-45 year olds, and 74% of 46-59 year olds. The high frequency of radio listening, and the very small number of occasional listeners, reinforces the message that radio is an effective way of getting information to many populations across Sierra Leone.
8
66
73 75 74
21
15 15 15
7 6 58
1 2 2 15
2 2 3
0
10
20
30
40
50
60
70
80
18-25 26-34 35-45 46-59
Everyday/almosteverydayTwo to six times a week
Once a week
Less than once a week
Don't know
Figure 6: Frequency of radio listening across age groups (Base = All radio listeners)
9
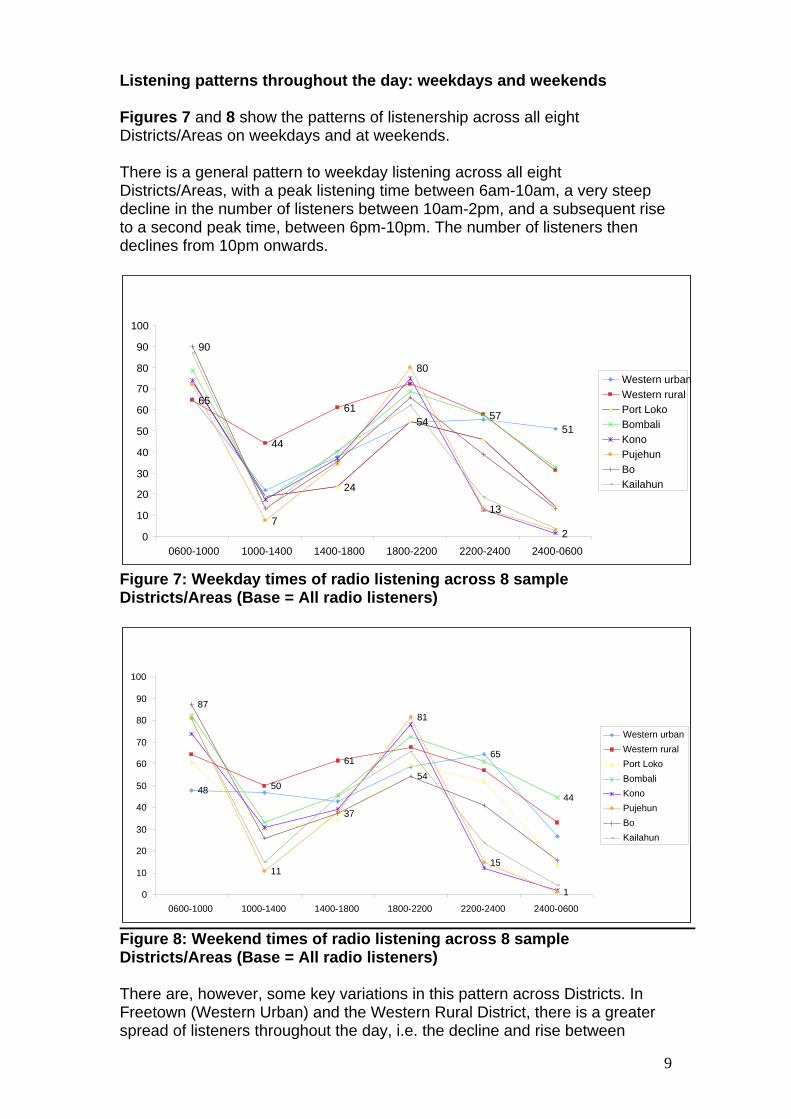
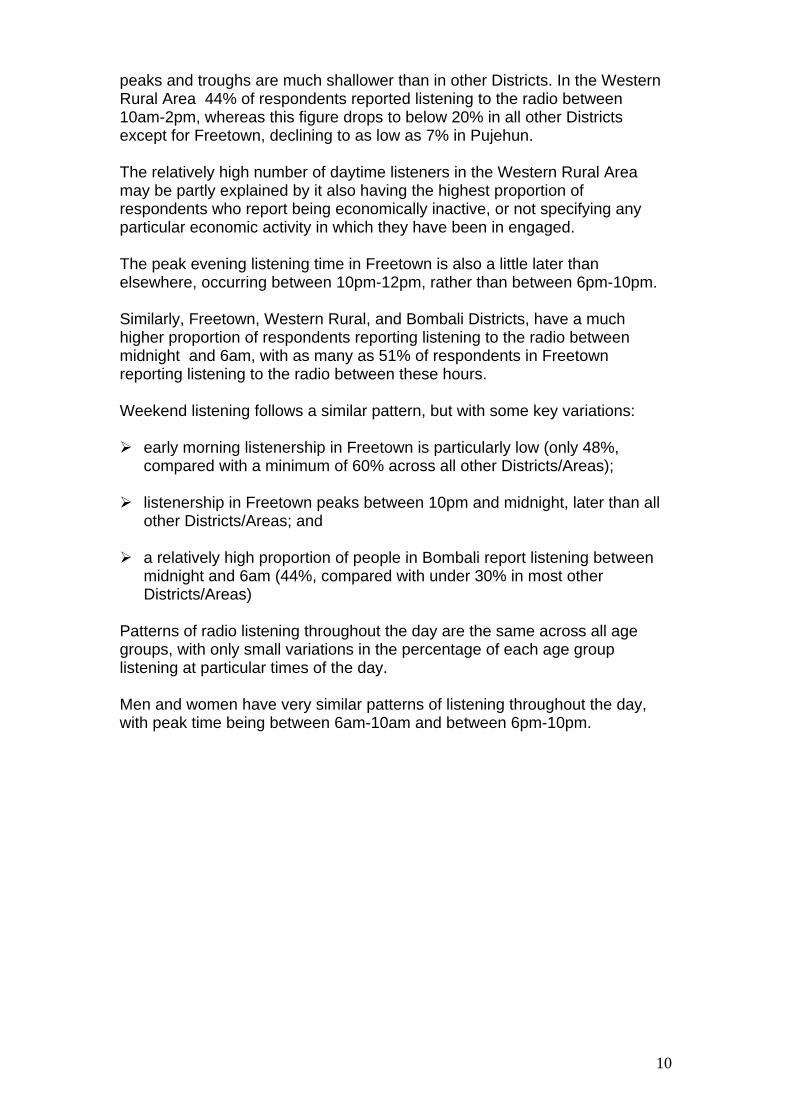
Listening patterns throughout the day: weekdays and weekends Figures 7 and 8 show the patterns of listenership across all eight Districts/Areas on weekdays and at weekends. There is a general pattern to weekday listening across all eight Districts/Areas, with a peak listening time between 6am-10am, a very steep decline in the number of listeners between 10am-2pm, and a subsequent rise to a second peak time, between 6pm-10pm. The number of listeners then declines from 10pm onwards.
Figure 7: Weekday times of radio listening across 8 sample Districts/Areas (Base = All radio listeners)
Figure 8: Weekend times of radio listening across 8 sample Districts/Areas (Base = All radio listeners) There are, however, some key variations in this pattern across Districts. In Freetown (Western Urban) and the Western Rural District, there is a greater spread of listeners throughout the day, i.e. the decline and rise between
51
65
44
6154
24
57
2 13
80
7
90
0 10 20 30 40 50 60 70 80 90
100
0600-1000 1000-1400 1400-1800 1800-2200 2200-2400 2400-0600
Western urbanWestern ruralPort LokoBombaliKono PujehunBo Kailahun
65
48
61
50 44
1
15
81
11
54
37
87
0 10 20 30 40 50 60 70 80 90
100
0600-1000 1000-1400 1400-1800 1800-2200 2200-2400 2400-0600
Western urbanWestern ruralPort LokoBombaliKonoPujehunBo Kailahun
10
peaks and troughs are much shallower than in other Districts. In the Western Rural Area 44% of respondents reported listening to the radio between 10am-2pm, whereas this figure drops to below 20% in all other Districts except for Freetown, declining to as low as 7% in Pujehun. The relatively high number of daytime listeners in the Western Rural Area may be partly explained by it also having the highest proportion of respondents who report being economically inactive, or not specifying any particular economic activity in which they have been in engaged. The peak evening listening time in Freetown is also a little later than elsewhere, occurring between 10pm-12pm, rather than between 6pm-10pm. Similarly, Freetown, Western Rural, and Bombali Districts, have a much higher proportion of respondents reporting listening to the radio between midnight and 6am, with as many as 51% of respondents in Freetown reporting listening to the radio between these hours. Weekend listening follows a similar pattern, but with some key variations:
early morning listenership in Freetown is particularly low (only 48%, compared with a minimum of 60% across all other Districts/Areas);
listenership in Freetown peaks between 10pm and midnight, later than all
other Districts/Areas; and
a relatively high proportion of people in Bombali report listening between midnight and 6am (44%, compared with under 30% in most other Districts/Areas)
Patterns of radio listening throughout the day are the same across all age groups, with only small variations in the percentage of each age group listening at particular times of the day. Men and women have very similar patterns of listening throughout the day, with peak time being between 6am-10am and between 6pm-10pm.
11
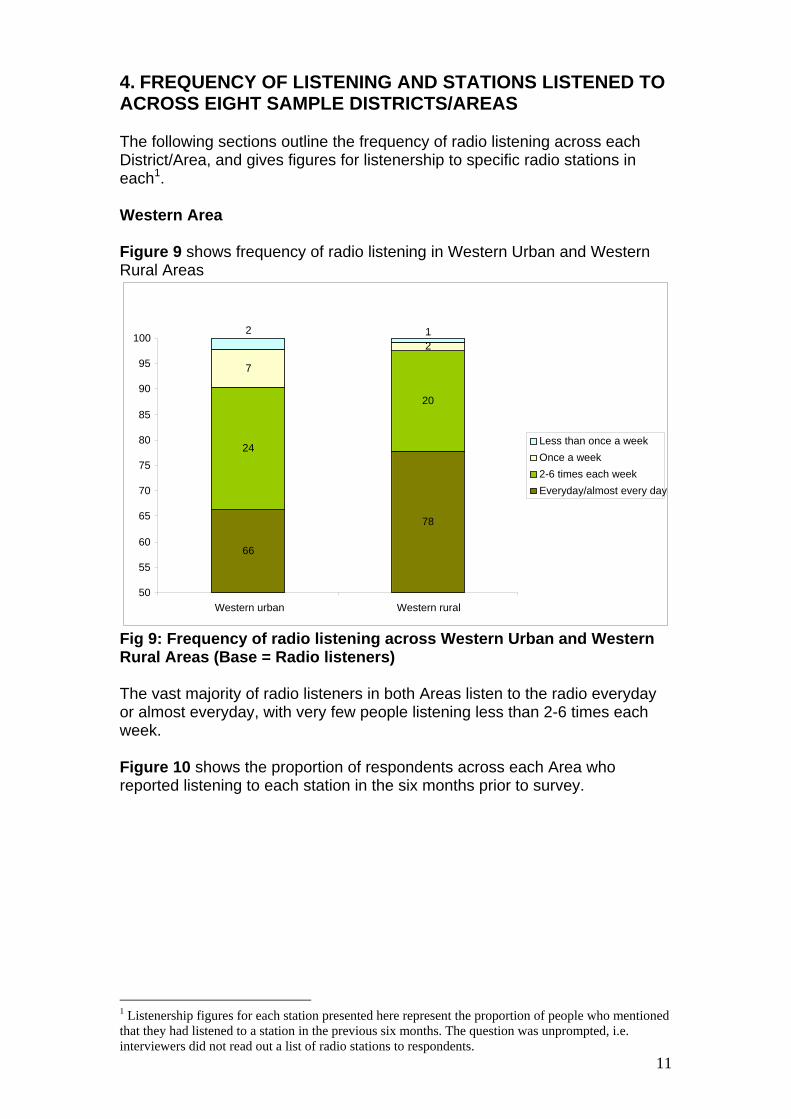
4. FREQUENCY OF LISTENING AND STATIONS LISTENED TO ACROSS EIGHT SAMPLE DISTRICTS/AREAS The following sections outline the frequency of radio listening across each District/Area, and gives figures for listenership to specific radio stations in each1. Western Area Figure 9 shows frequency of radio listening in Western Urban and Western Rural Areas
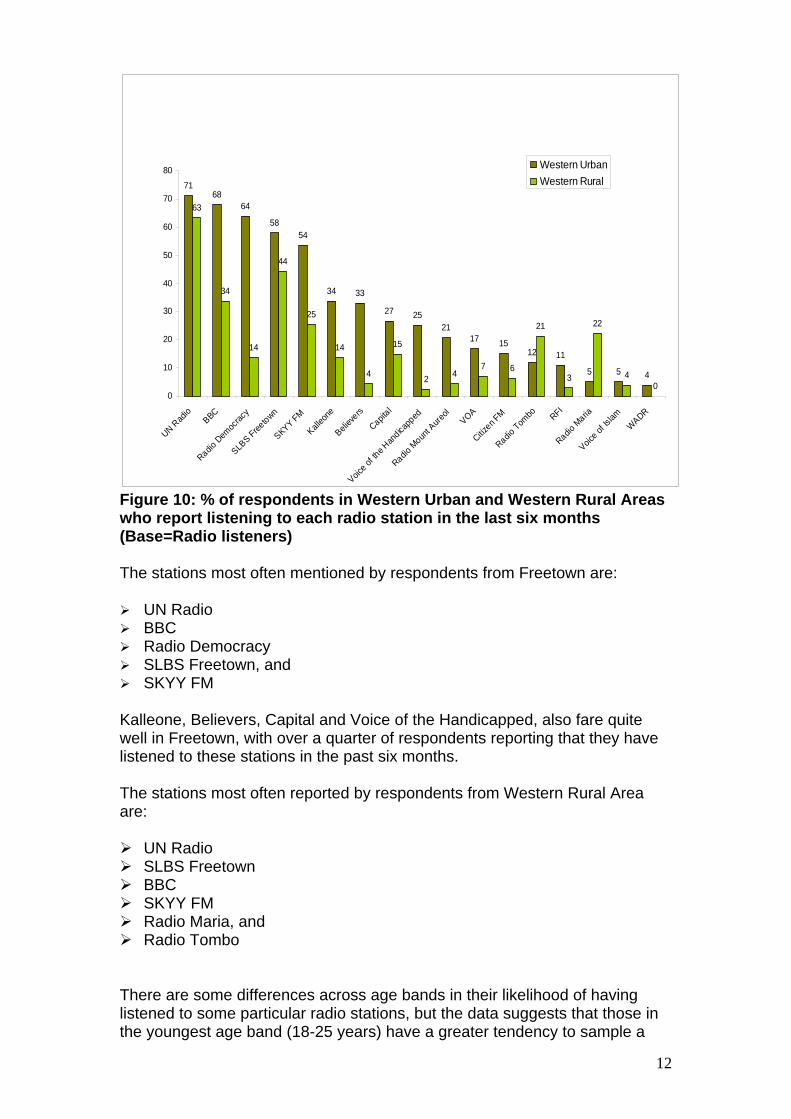
Fig 9: Frequency of radio listening across Western Urban and Western Rural Areas (Base = Radio listeners) The vast majority of radio listeners in both Areas listen to the radio everyday or almost everyday, with very few people listening less than 2-6 times each week. Figure 10 shows the proportion of respondents across each Area who reported listening to each station in the six months prior to survey.
1 Listenership figures for each station presented here represent the proportion of people who mentioned that they had listened to a station in the previous six months. The question was unprompted, i.e. interviewers did not read out a list of radio stations to respondents.
66
78
24
20
7 2
2 1
50 55 60 65 70 75 80 85 90 95
100
Western urban Western rural
Less than once a week Once a week 2-6 times each week Everyday/almost every day
12
7168
64
5854
34 33
27 2521
17 1512 11
5 5 4
63
34
14
44
25
14
4
15
2 47 6
21
3
22
40
0
10
20
30
40
50
60
70
80
UN Rad
ioBBC
Radio D
emoc
racy
SLBS Free
town
SKYY FM
Kalleo
ne
Believ
ers
Capital
Voice of
the H
andica
pped
Radio M
ount A
ureol
VOA
Citizen F
M
Radio Tom
bo RFI
Radio M
aria
Voice of
Islam
WADR
Western UrbanWestern Rural
Figure 10: % of respondents in Western Urban and Western Rural Areas who report listening to each radio station in the last six months (Base=Radio listeners) The stations most often mentioned by respondents from Freetown are:
UN Radio BBC Radio Democracy SLBS Freetown, and SKYY FM
Kalleone, Believers, Capital and Voice of the Handicapped, also fare quite well in Freetown, with over a quarter of respondents reporting that they have listened to these stations in the past six months. The stations most often reported by respondents from Western Rural Area are:
UN Radio SLBS Freetown BBC SKYY FM Radio Maria, and Radio Tombo
There are some differences across age bands in their likelihood of having listened to some particular radio stations, but the data suggests that those in the youngest age band (18-25 years) have a greater tendency to sample a
13
wider range of stations, rather than remaining ‘loyal’ to a smaller number of stations. In the Western Urban area, there are two stations which show substantial variation in listenership across the four age bands.
Radio Kalleone is mentioned by a greater proportion of younger respondents (aged 34 and under) than older respondents
SKYY FM is mentioned less by respondents aged 46-59 than it is by all
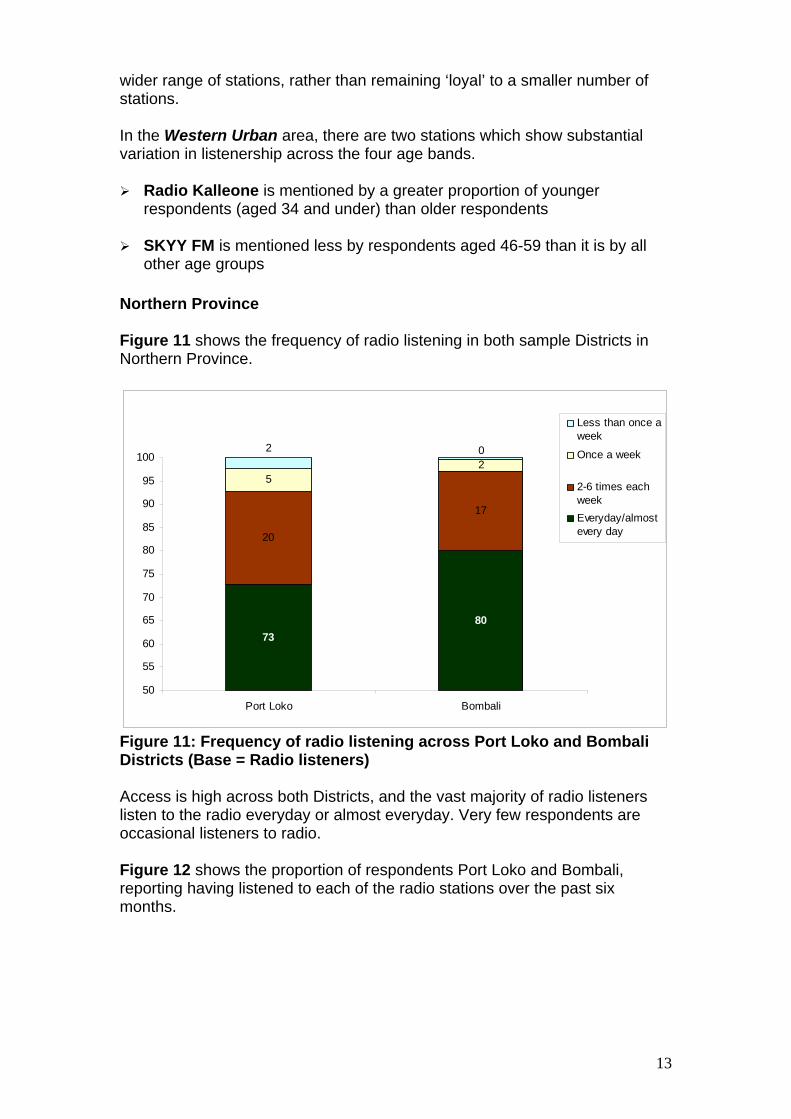
other age groups Northern Province Figure 11 shows the frequency of radio listening in both sample Districts in Northern Province.
7380
20
17
5202
50
55
60
65
70
75
80
85
90
95
100
Port Loko Bombali
Less than once aweek
Once a week
2-6 times eachweekEveryday/almostevery day
Figure 11: Frequency of radio listening across Port Loko and Bombali Districts (Base = Radio listeners) Access is high across both Districts, and the vast majority of radio listeners listen to the radio everyday or almost everyday. Very few respondents are occasional listeners to radio. Figure 12 shows the proportion of respondents Port Loko and Bombali, reporting having listened to each of the radio stations over the past six months.
14
10
2
17
62
53 51
32 31
24
13
6 6 52 1 3 1
77 77
6765
29
1924
2
10
0 2 2 14 4
0 10
10
20
30
40
50
60
70
80
90
Radio M
ankneh
SLBS M
aken
i
Radio M
aria
UN Radio
SKYY FM
SLBS Free
townBBC
Capital
Radio Dem
ocrac
y
Radio M
ount A
ureol RFI
Radio Tom
bo
Eastern
Radio
Radio M
oa
Radio M
odcar
Radio Ko lente
hWADR
Port LokoBombali
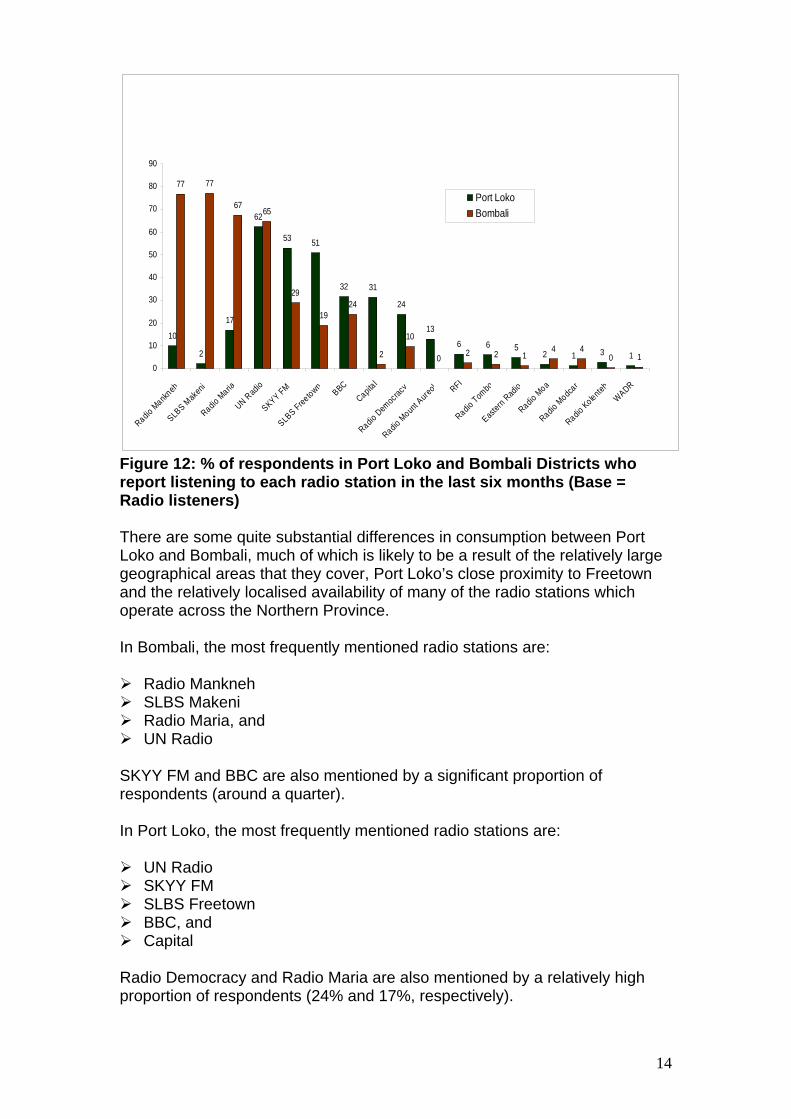
Figure 12: % of respondents in Port Loko and Bombali Districts who report listening to each radio station in the last six months (Base = Radio listeners) There are some quite substantial differences in consumption between Port Loko and Bombali, much of which is likely to be a result of the relatively large geographical areas that they cover, Port Loko’s close proximity to Freetown and the relatively localised availability of many of the radio stations which operate across the Northern Province. In Bombali, the most frequently mentioned radio stations are:
Radio Mankneh SLBS Makeni Radio Maria, and UN Radio
SKYY FM and BBC are also mentioned by a significant proportion of respondents (around a quarter). In Port Loko, the most frequently mentioned radio stations are:
UN Radio SKYY FM SLBS Freetown BBC, and Capital
Radio Democracy and Radio Maria are also mentioned by a relatively high proportion of respondents (24% and 17%, respectively).
15
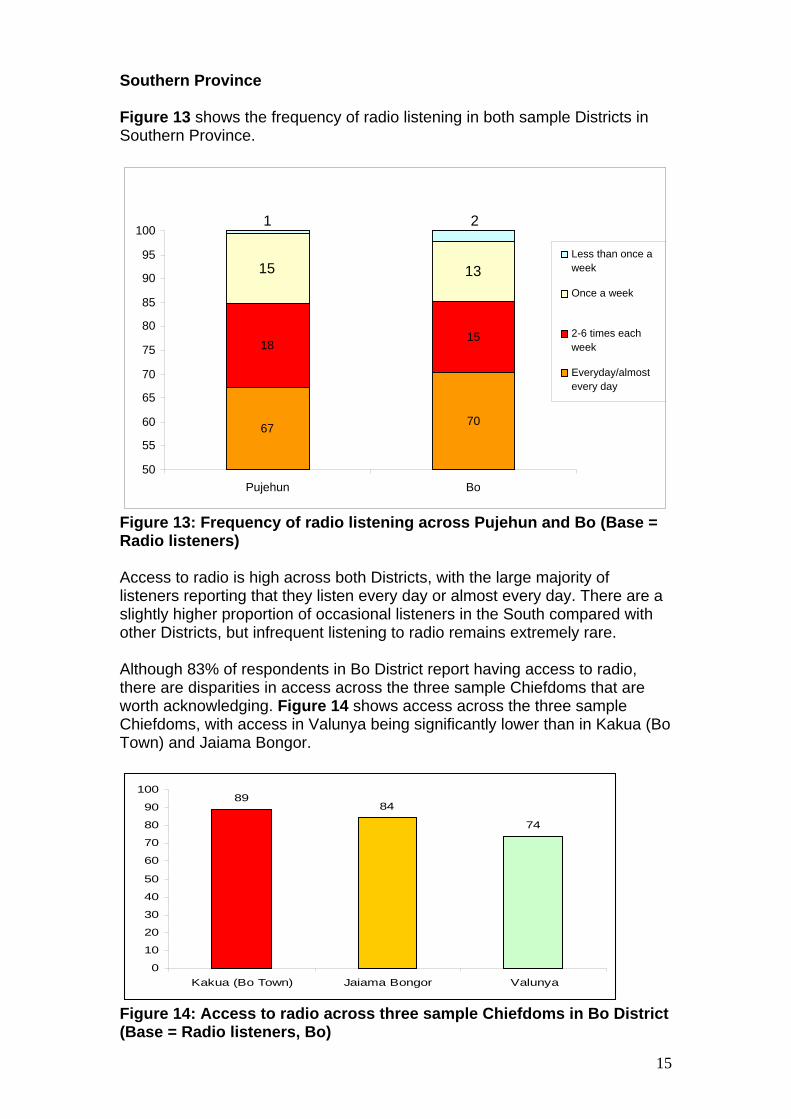
Southern Province Figure 13 shows the frequency of radio listening in both sample Districts in Southern Province.
Figure 13: Frequency of radio listening across Pujehun and Bo (Base = Radio listeners) Access to radio is high across both Districts, with the large majority of listeners reporting that they listen every day or almost every day. There are a slightly higher proportion of occasional listeners in the South compared with other Districts, but infrequent listening to radio remains extremely rare. Although 83% of respondents in Bo District report having access to radio, there are disparities in access across the three sample Chiefdoms that are worth acknowledging. Figure 14 shows access across the three sample Chiefdoms, with access in Valunya being significantly lower than in Kakua (Bo Town) and Jaiama Bongor.
8984
74
0
10
20
30
40
50
60
70
80
90
100
Kakua (Bo Town) Jaiama Bongor Valunya
Figure 14: Access to radio across three sample Chiefdoms in Bo District (Base = Radio listeners, Bo)
67 70
18 15
15 13
21
50 55 60 65 70 75 80 85 90 95
100
Pujehun Bo
Less than once a week Once a week
2-6 times each week Everyday/almost every day
16
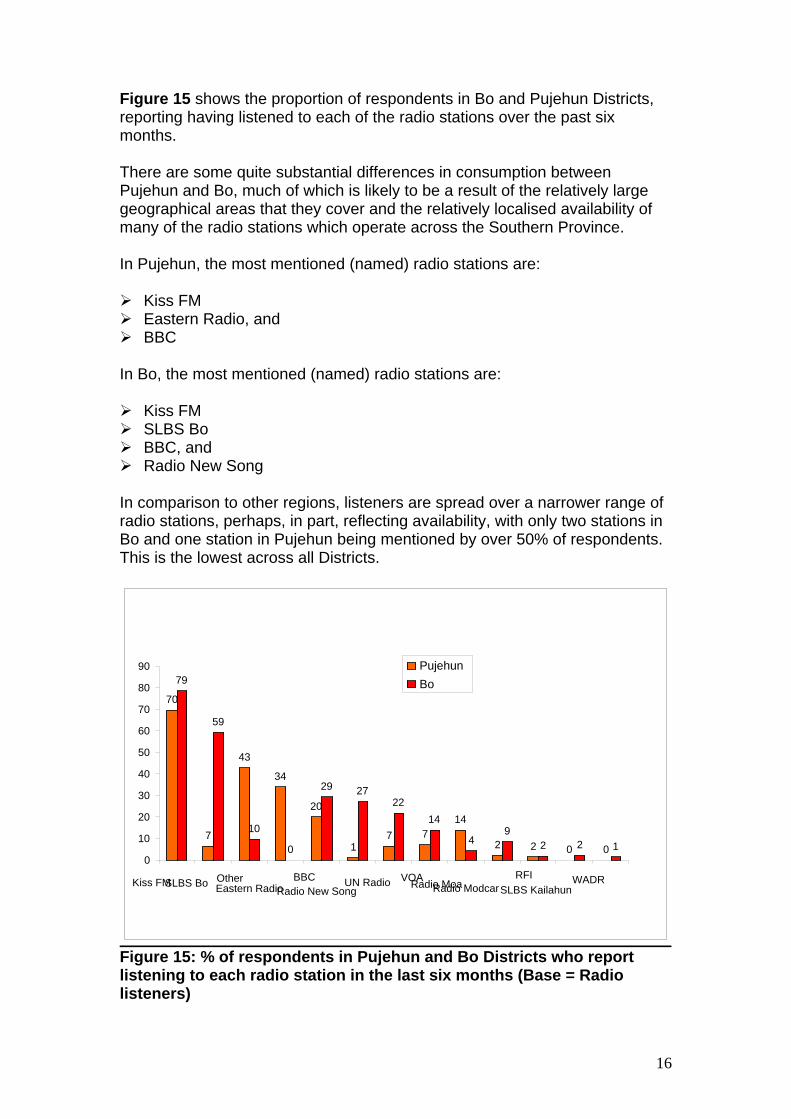
Figure 15 shows the proportion of respondents in Bo and Pujehun Districts, reporting having listened to each of the radio stations over the past six months. There are some quite substantial differences in consumption between Pujehun and Bo, much of which is likely to be a result of the relatively large geographical areas that they cover and the relatively localised availability of many of the radio stations which operate across the Southern Province. In Pujehun, the most mentioned (named) radio stations are:
Kiss FM Eastern Radio, and BBC
In Bo, the most mentioned (named) radio stations are:
Kiss FM SLBS Bo BBC, and Radio New Song
In comparison to other regions, listeners are spread over a narrower range of radio stations, perhaps, in part, reflecting availability, with only two stations in Bo and one station in Pujehun being mentioned by over 50% of respondents. This is the lowest across all Districts.
Figure 15: % of respondents in Pujehun and Bo Districts who report listening to each radio station in the last six months (Base = Radio listeners)
70
7
43 34
20
17 7
14
2 2 0 0
79
59
10 0
29 2722
14
49
2 2 1 0
10 20 30 40 50 60 70 80 90
Kiss FM SLBS Bo OtherEastern Radio
BBC Radio New Song
UN Radio VOARadio MoaRadio ModcarRFI
SLBS Kailahun WADR
PujehunBo
17
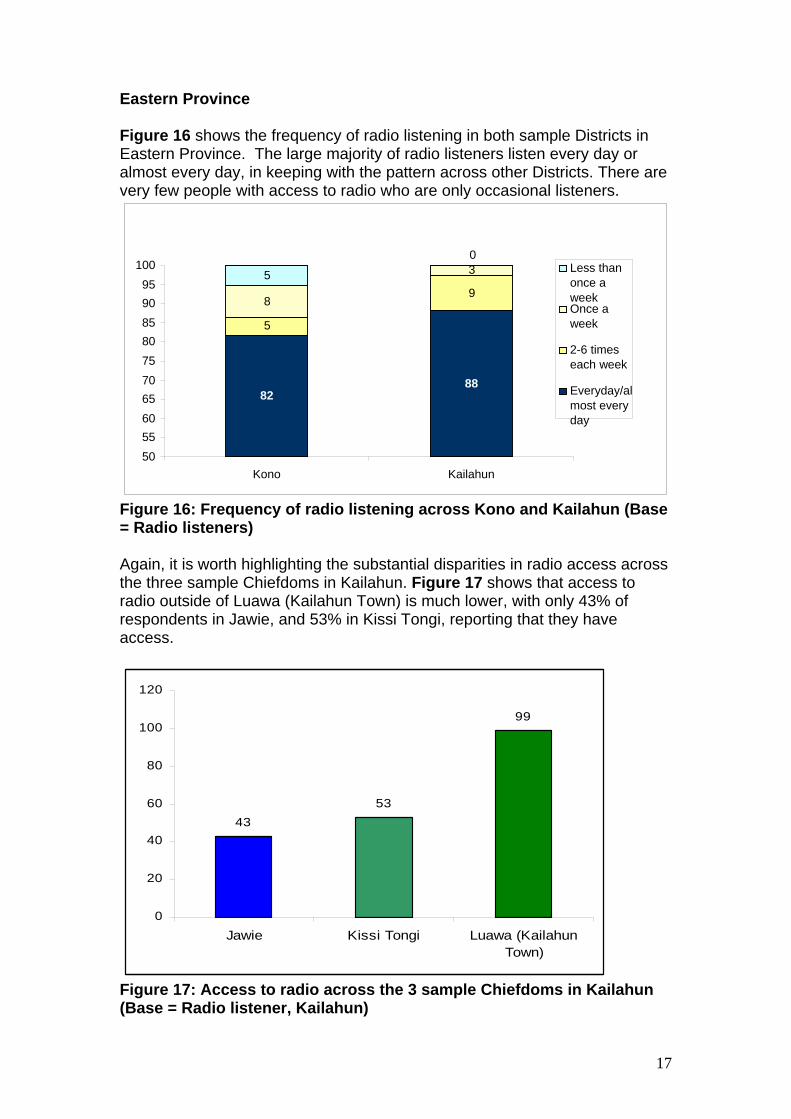
Eastern Province Figure 16 shows the frequency of radio listening in both sample Districts in Eastern Province. The large majority of radio listeners listen every day or almost every day, in keeping with the pattern across other Districts. There are very few people with access to radio who are only occasional listeners.
Figure 16: Frequency of radio listening across Kono and Kailahun (Base = Radio listeners) Again, it is worth highlighting the substantial disparities in radio access across the three sample Chiefdoms in Kailahun. Figure 17 shows that access to radio outside of Luawa (Kailahun Town) is much lower, with only 43% of respondents in Jawie, and 53% in Kissi Tongi, reporting that they have access.
4353
99
0
20
40
60
80
100
120
Jawie Kissi Tongi Luawa (KailahunTown)
Figure 17: Access to radio across the 3 sample Chiefdoms in Kailahun (Base = Radio listener, Kailahun)
82 88
5
98
35 0
50 55 60 65 70 75 80 85 90 95
100
Kono Kailahun
Less than once a week Once a week 2-6 times each week Everyday/al most every day
18
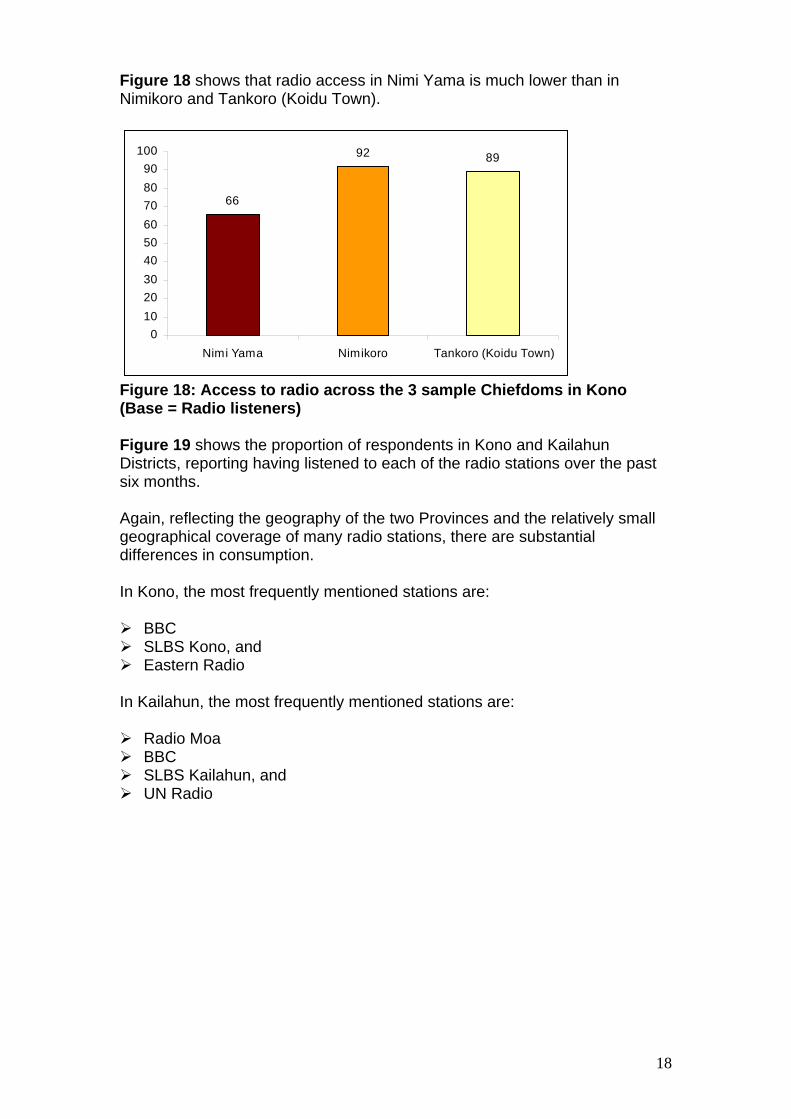
Figure 18 shows that radio access in Nimi Yama is much lower than in Nimikoro and Tankoro (Koidu Town).
66
92 89
0102030405060708090
100
Nimi Yama Nimikoro Tankoro (Koidu Town)
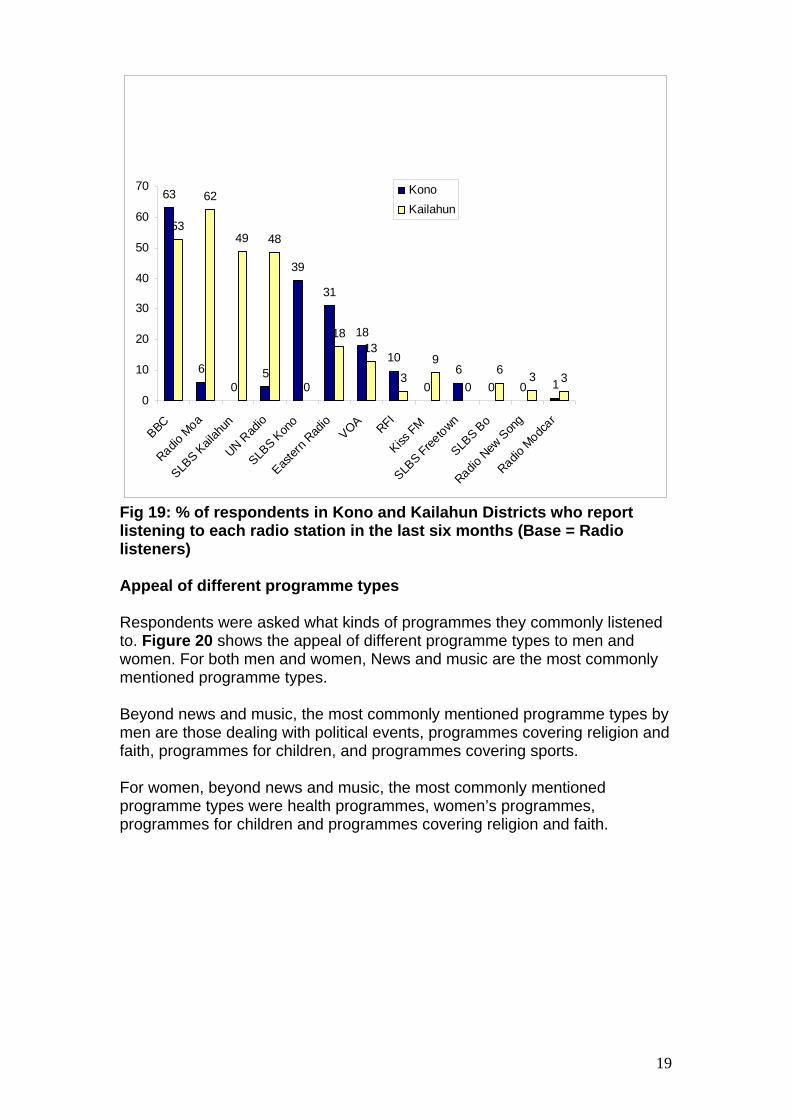
Figure 18: Access to radio across the 3 sample Chiefdoms in Kono (Base = Radio listeners) Figure 19 shows the proportion of respondents in Kono and Kailahun Districts, reporting having listened to each of the radio stations over the past six months. Again, reflecting the geography of the two Provinces and the relatively small geographical coverage of many radio stations, there are substantial differences in consumption. In Kono, the most frequently mentioned stations are:
BBC SLBS Kono, and Eastern Radio
In Kailahun, the most frequently mentioned stations are:
Radio Moa BBC SLBS Kailahun, and UN Radio
19
63
60
5
39
31
18
10
06
0 0 1
53
62
49 48
0
1813
39
06 3 3
0
10
20
30
40
50
60
70
BBC
Radio M
oa
SLBS K
ailah
un
UN Rad
io
SLBS K
ono
Easter
n Rad
ioVOA RFI
Kiss FM
SLBS Free
town
SLBS B
o
Radio N
ew Son
g
Radio M
odcar
KonoKailahun
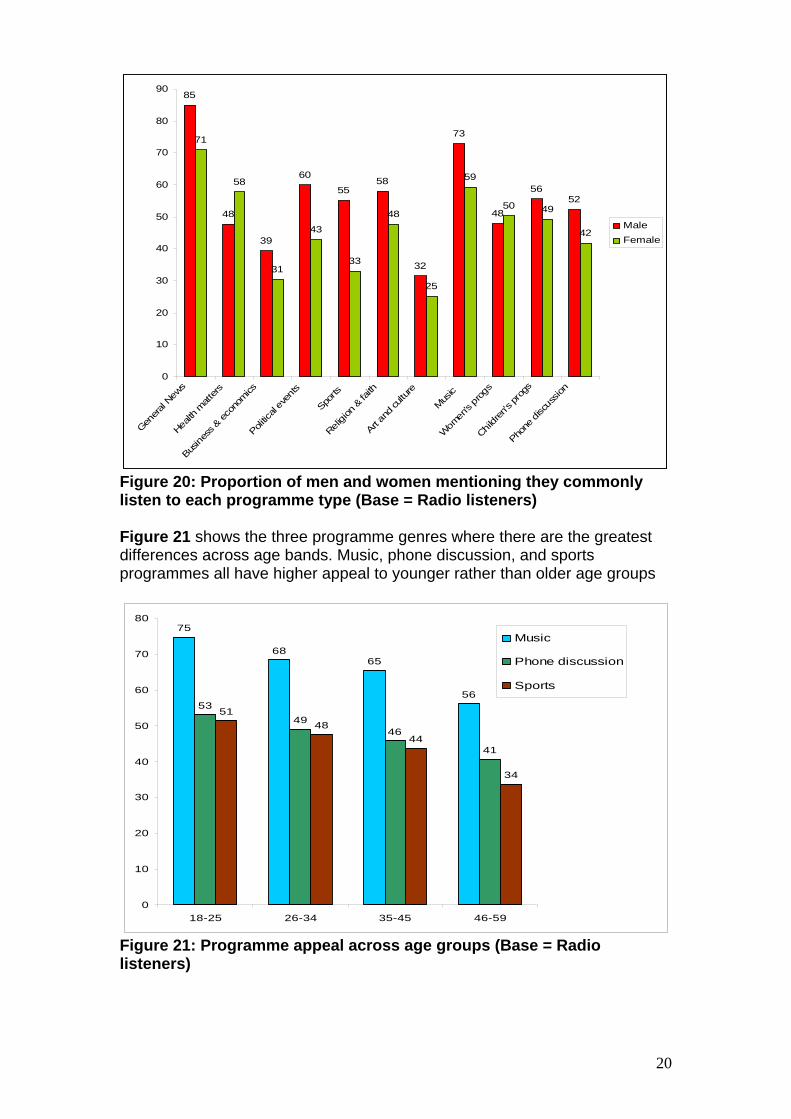
Fig 19: % of respondents in Kono and Kailahun Districts who report listening to each radio station in the last six months (Base = Radio listeners) Appeal of different programme types Respondents were asked what kinds of programmes they commonly listened to. Figure 20 shows the appeal of different programme types to men and women. For both men and women, News and music are the most commonly mentioned programme types. Beyond news and music, the most commonly mentioned programme types by men are those dealing with political events, programmes covering religion and faith, programmes for children, and programmes covering sports. For women, beyond news and music, the most commonly mentioned programme types were health programmes, women’s programmes, programmes for children and programmes covering religion and faith.
20
85
48
39
60
5558
32
73
48
5652
71
58
31
43
33
48
25
59
50 49
42
0
10
20
30
40
50
60
70
80
90
Genera
l New
s
Health
matt
ers
Busine
ss &
econ
omics
Politic
al ev
ents
Sports
Religio
n & fa
ith
Art and
cultu
re
Music
Wom
en's
prog
s
Childr
en's
prog
s
Phone
disc
ussio
n
MaleFemale
Figure 20: Proportion of men and women mentioning they commonly listen to each programme type (Base = Radio listeners) Figure 21 shows the three programme genres where there are the greatest differences across age bands. Music, phone discussion, and sports programmes all have higher appeal to younger rather than older age groups
75
6865
5653
4946
41
5148
44
34
0
10
20
30
40
50
60
70
80
18-25 26-34 35-45 46-59
Music
Phone discussion
Sports
Figure 21: Programme appeal across age groups (Base = Radio listeners)
21
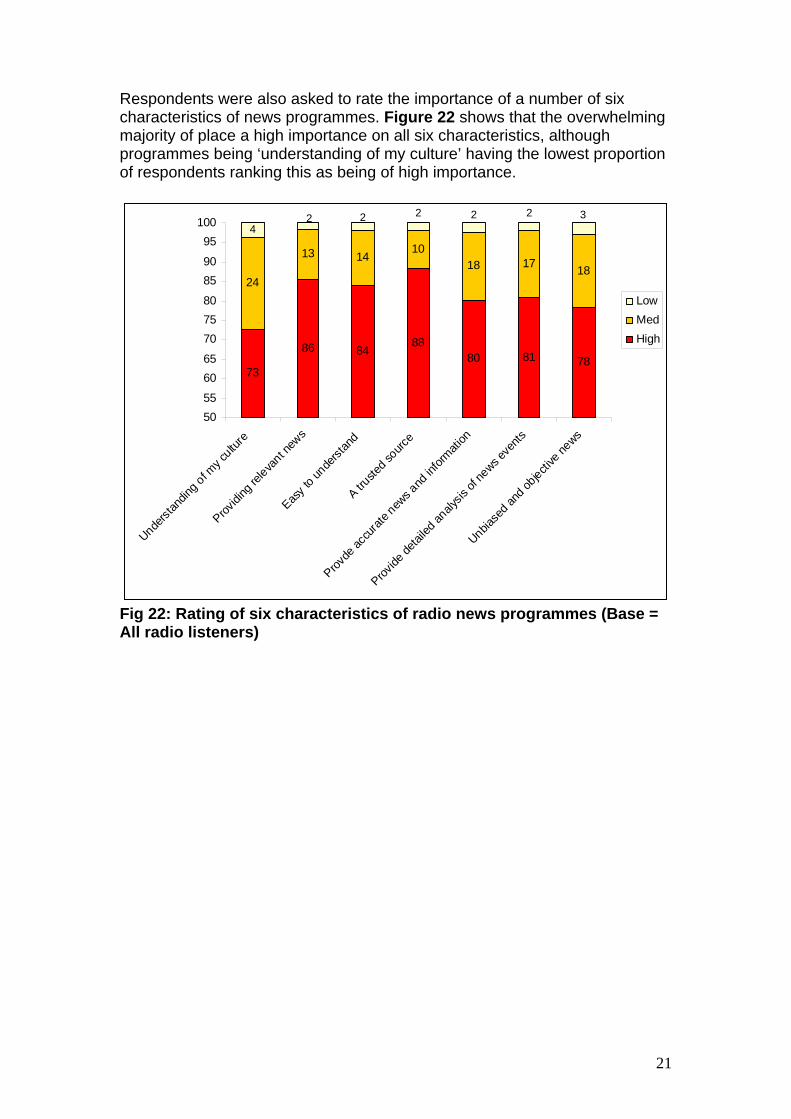
Respondents were also asked to rate the importance of a number of six characteristics of news programmes. Figure 22 shows that the overwhelming majority of place a high importance on all six characteristics, although programmes being ‘understanding of my culture’ having the lowest proportion of respondents ranking this as being of high importance.
73
86 8488
80 81 78
24
13 1410
18 17 18
4322222
5055
6065
707580
8590
95100
Underst
andin
g of my c
ulture
Providi
ng re
levant n
ews
Easy t
o unde
rstan
d
A truste
d sourc
e
Provde
accu
rate n
ews a
nd in
formati
on
Provide
detai
led an
alysis
of ne
ws eve
nts
Unbiase
d and
objecti
ve ne
ws
LowMedHigh
Fig 22: Rating of six characteristics of radio news programmes (Base = All radio listeners)
22
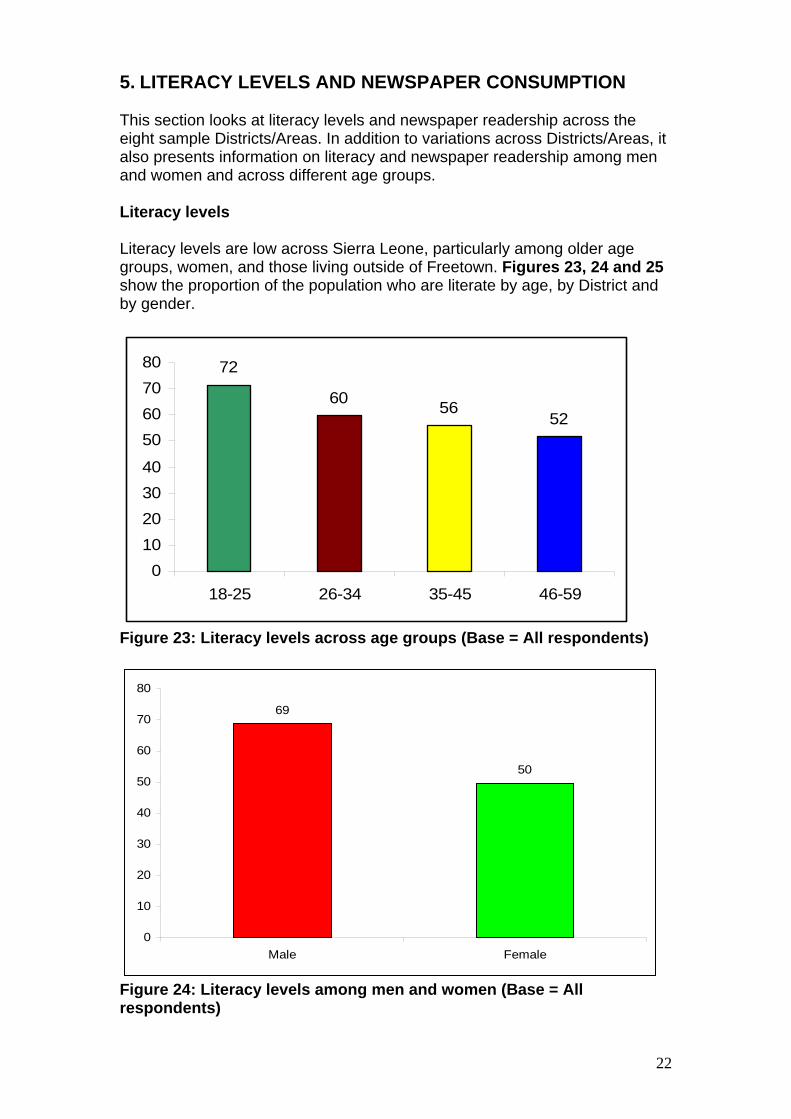
5. LITERACY LEVELS AND NEWSPAPER CONSUMPTION This section looks at literacy levels and newspaper readership across the eight sample Districts/Areas. In addition to variations across Districts/Areas, it also presents information on literacy and newspaper readership among men and women and across different age groups. Literacy levels Literacy levels are low across Sierra Leone, particularly among older age groups, women, and those living outside of Freetown. Figures 23, 24 and 25 show the proportion of the population who are literate by age, by District and by gender.
72
60 5652
010203040
50607080
18-25 26-34 35-45 46-59
Figure 23: Literacy levels across age groups (Base = All respondents)
69
50
0
10
20
30
40
50
60
70
80
Male Female
Figure 24: Literacy levels among men and women (Base = All respondents)
23
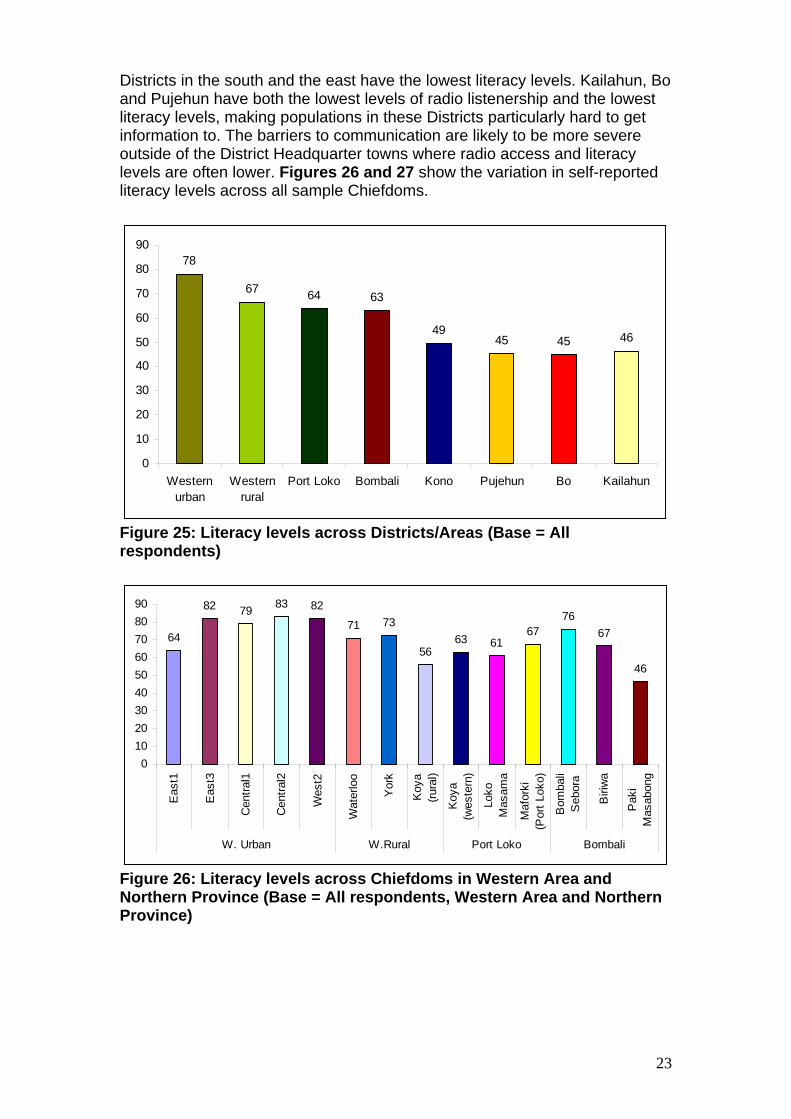
Districts in the south and the east have the lowest literacy levels. Kailahun, Bo and Pujehun have both the lowest levels of radio listenership and the lowest literacy levels, making populations in these Districts particularly hard to get information to. The barriers to communication are likely to be more severe outside of the District Headquarter towns where radio access and literacy levels are often lower. Figures 26 and 27 show the variation in self-reported literacy levels across all sample Chiefdoms.
78
67 64 63
4945 45 46
0
10
20
30
40
50
60
70
80
90
Westernurban
Westernrural
Port Loko Bombali Kono Pujehun Bo Kailahun
Figure 25: Literacy levels across Districts/Areas (Base = All respondents)
64
82 79 83 82
71 73
5663 61
6776
67
46
0102030405060708090
Eas
t1
Eas
t3
Cen
tral1
Cen
tral2
Wes
t2
Wat
erlo
o
Yor
k
Koy
a(ru
ral)
Koy
a(w
este
rn)
Loko
Mas
ama
Maf
orki
(Por
t Lok
o)
Bom
bali
Seb
ora
Biri
wa
Pak
iM
asab
ong
W. Urban W.Rural Port Loko Bombali
Figure 26: Literacy levels across Chiefdoms in Western Area and Northern Province (Base = All respondents, Western Area and Northern Province)
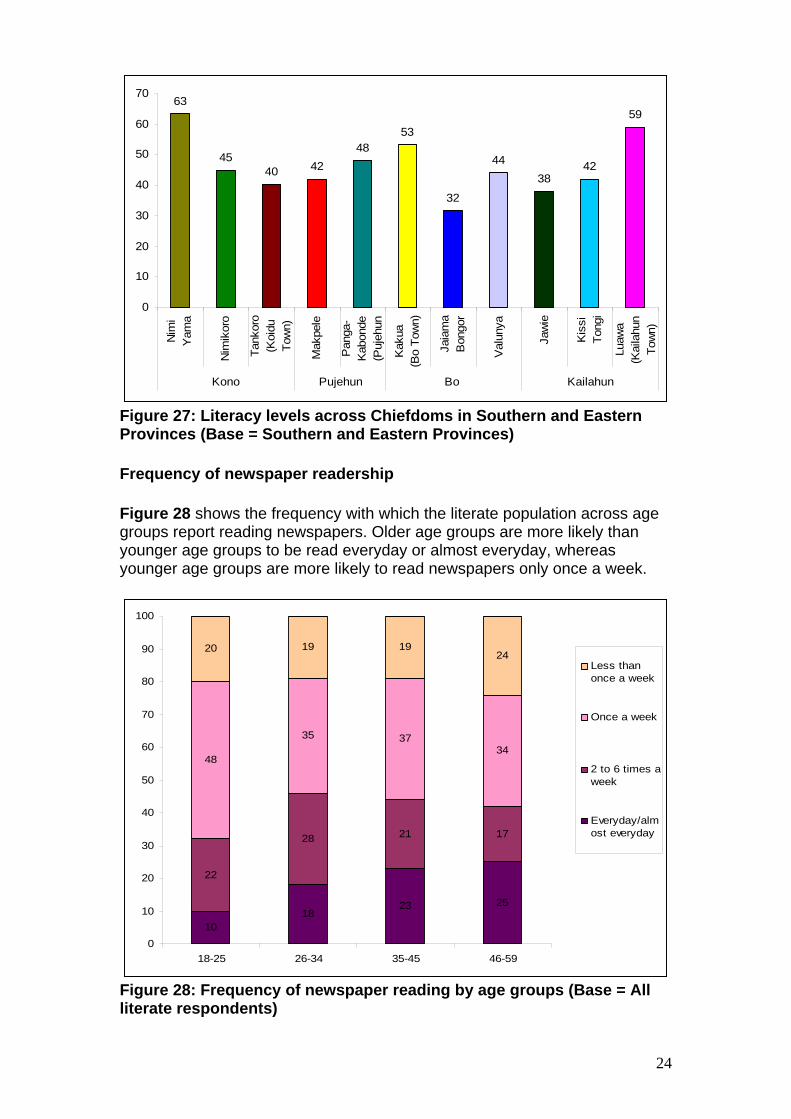
24
63
4540 42
4853
32
4438
42
59
0
10
20
30
40
50
60
70
Nim
iY
ama
Nim
ikor
o
Tank
oro
(Koi
duTo
wn)
Mak
pele
Pan
ga-
Kab
onde
(Puj
ehun
Kak
ua(B
o To
wn)
Jaia
ma
Bon
gor
Val
unya
Jaw
ie
Kis
siTo
ngi
Luaw
a(K
aila
hun
Tow
n)
Kono Pujehun Bo Kailahun
Figure 27: Literacy levels across Chiefdoms in Southern and Eastern Provinces (Base = Southern and Eastern Provinces) Frequency of newspaper readership Figure 28 shows the frequency with which the literate population across age groups report reading newspapers. Older age groups are more likely than younger age groups to be read everyday or almost everyday, whereas younger age groups are more likely to read newspapers only once a week.
1018
23 25
22
28 21 17
48
35 3734
20 19 1924
0
10
20
30
40
50
60
70
80
90
100
18-25 26-34 35-45 46-59
Less thanonce a week
Once a week
2 to 6 times aweek
Everyday/almost everyday
Figure 28: Frequency of newspaper reading by age groups (Base = All literate respondents)
25
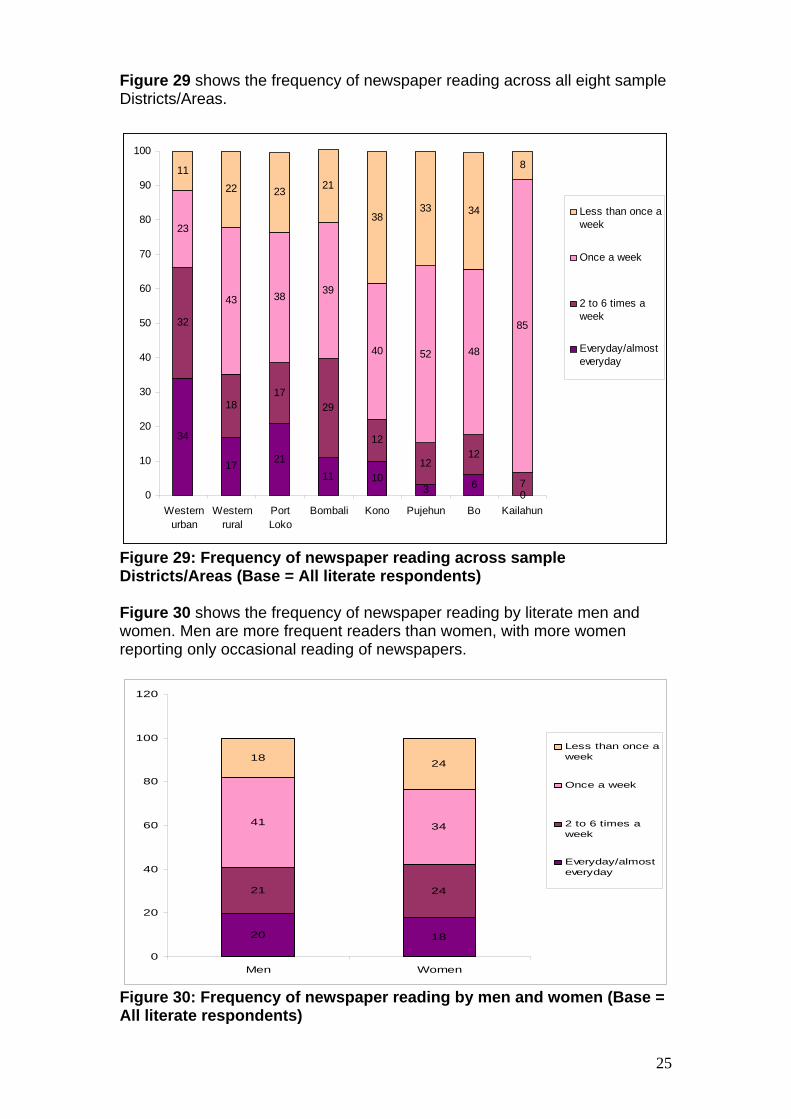
Figure 29 shows the frequency of newspaper reading across all eight sample Districts/Areas.
34
17 2111 10
3 60
32
1817
29
12
1212
7
23
43 38 39
40 52 48
85
11
22 23 21
3833 34
8
0
10
20
30
40
50
60
70
80
90
100
Westernurban
Westernrural
PortLoko
Bombali Kono Pujehun Bo Kailahun
Less than once aweek
Once a week
2 to 6 times aweek
Everyday/almosteveryday
Figure 29: Frequency of newspaper reading across sample Districts/Areas (Base = All literate respondents) Figure 30 shows the frequency of newspaper reading by literate men and women. Men are more frequent readers than women, with more women reporting only occasional reading of newspapers.
20 18
21 24
41 34
18 24
0
20
40
60
80
100
120
Men Women
Less than once aweek
Once a week
2 to 6 times aweek
Everyday/almosteveryday
Figure 30: Frequency of newspaper reading by men and women (Base = All literate respondents)
26
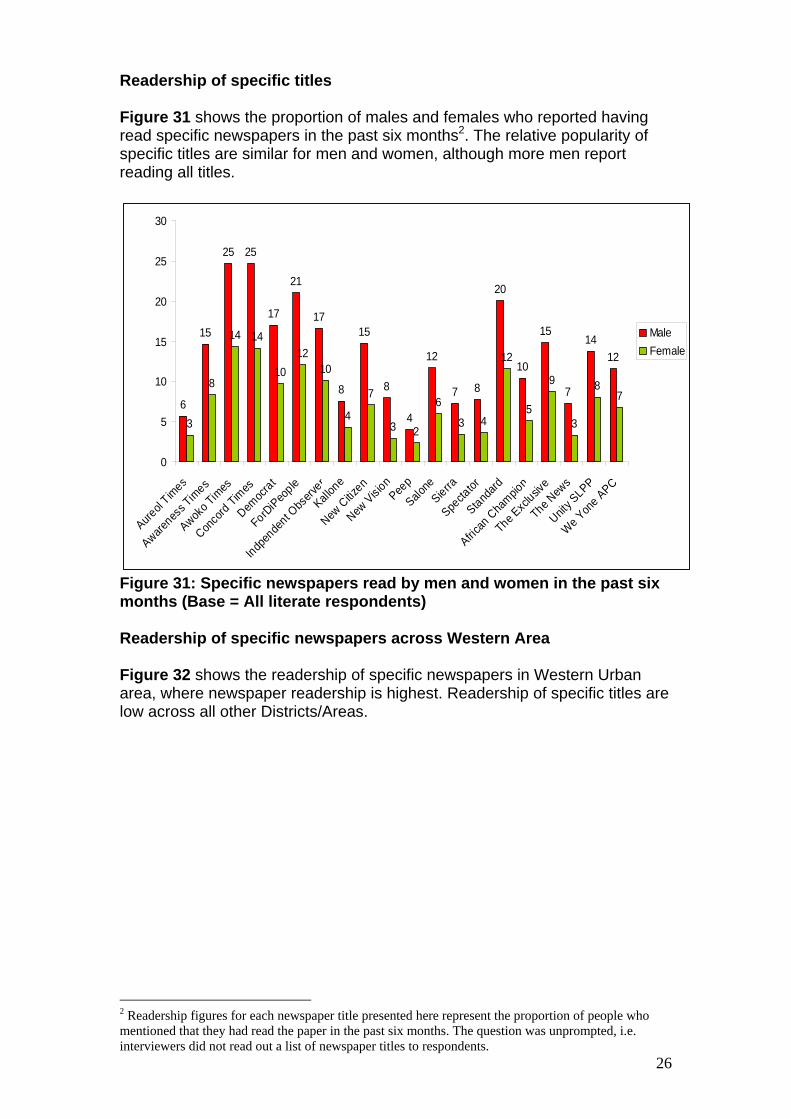
Readership of specific titles Figure 31 shows the proportion of males and females who reported having read specific newspapers in the past six months2. The relative popularity of specific titles are similar for men and women, although more men report reading all titles.
6
15
25 25
17
21
17
8
15
8
4
12
7 8
20
10
15
7
1412
3
8
14 14
1012
10
4
7
3 2
6
3 4
12
5
9
3
87
0
5
10
15
20
25
30
Aureol
Times
Awarenes
s Tim
es
Awoko T
imes
Conco
rd Times
Democ
rat
ForDiPeo
ple
Indpen
dent O
bserv
er
Kallon
e
New C
itizen
New Visio
nPee
p
Salone
Sierra
Specta
tor
Standard
African
Cha
mpion
The Exc
lusive
The New
s
Unity S
LPP
We Yone APC
MaleFemale
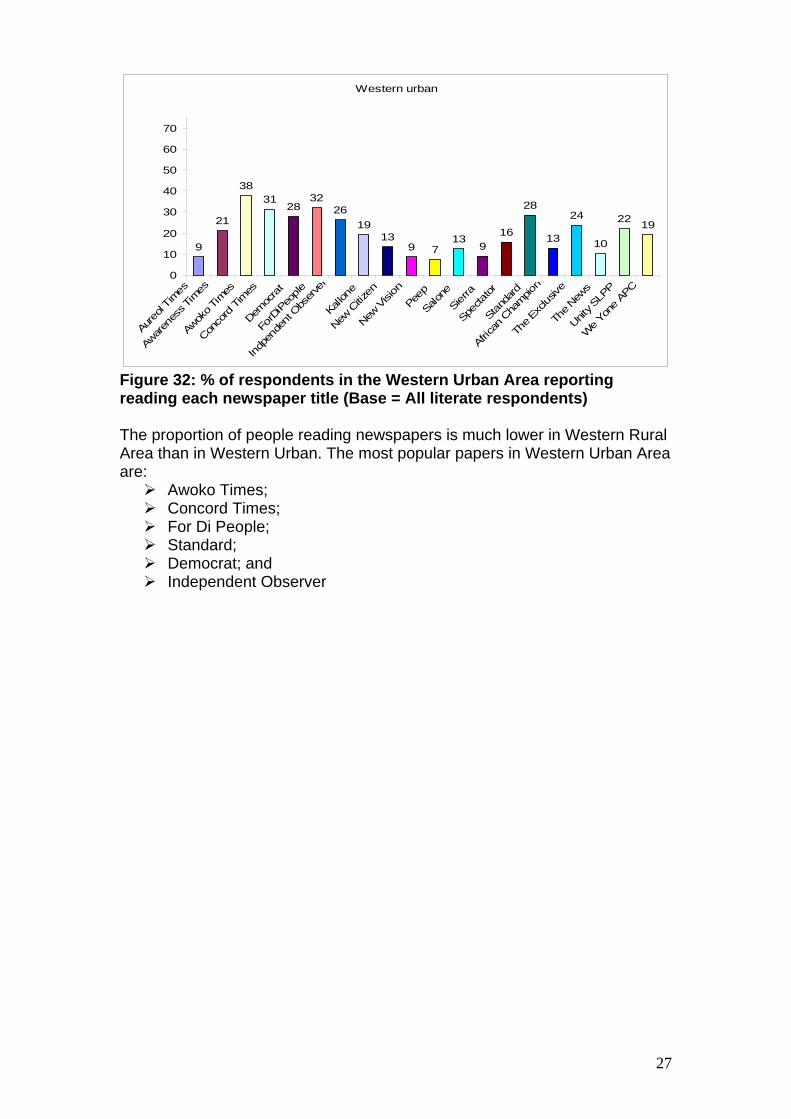
Figure 31: Specific newspapers read by men and women in the past six months (Base = All literate respondents) Readership of specific newspapers across Western Area Figure 32 shows the readership of specific newspapers in Western Urban area, where newspaper readership is highest. Readership of specific titles are low across all other Districts/Areas.
2 Readership figures for each newspaper title presented here represent the proportion of people who mentioned that they had read the paper in the past six months. The question was unprompted, i.e. interviewers did not read out a list of newspaper titles to respondents.
27
Western urban
9
21
3831
2832
2619
139 7
139
16
28
13
24
10
22 19
0
10
20
30
40
50
60
70
Aure
ol Times
Awaren
ess T
imes
Awok
o Tim
es
Conco
rd Tim
es
Democ
rat
ForD
iPeo
ple
Indp
ende
nt O
bserve
r
Kallo
ne
New C
itizen
New V
ision
Peep
Salon
e
Sier
ra
Spec
tator
Stan
dard
Africa
n Cha
mpio
n
The E
xclus
ive
The N
ews
Unity S
LPP
We Yo
ne A
PC
Figure 32: % of respondents in the Western Urban Area reporting reading each newspaper title (Base = All literate respondents) The proportion of people reading newspapers is much lower in Western Rural Area than in Western Urban. The most popular papers in Western Urban Area are:
Awoko Times; Concord Times; For Di People; Standard; Democrat; and Independent Observer
28
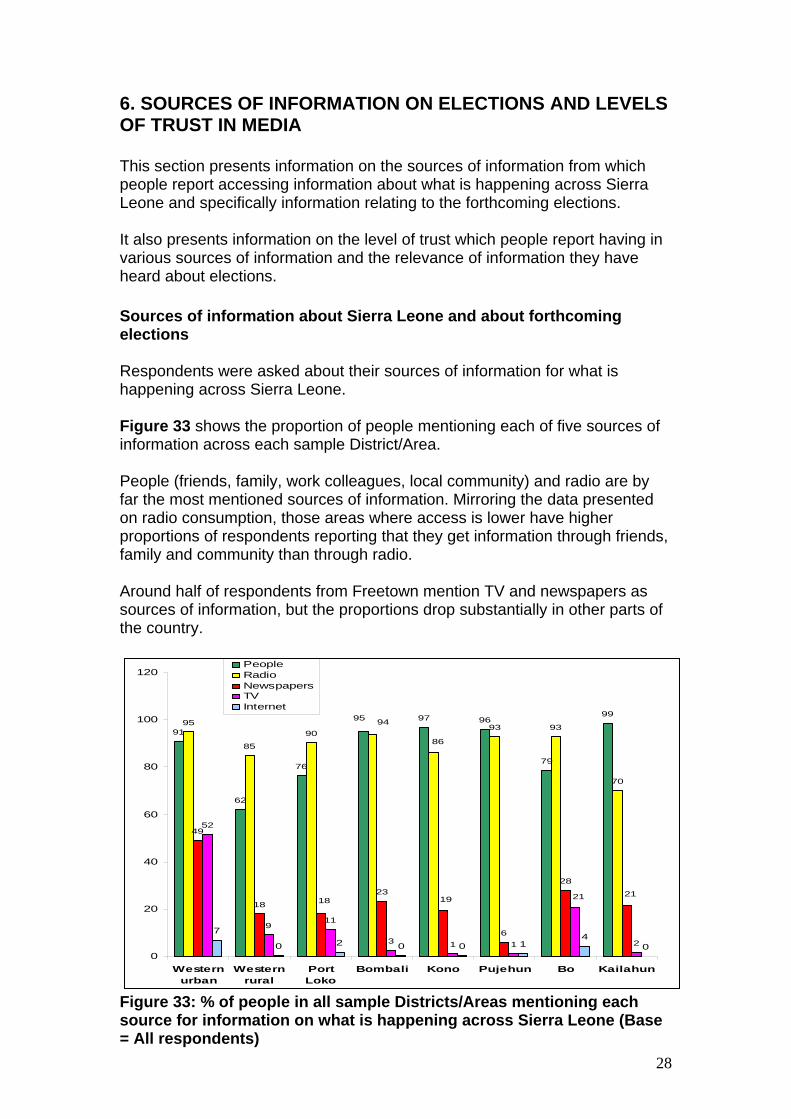
6. SOURCES OF INFORMATION ON ELECTIONS AND LEVELS OF TRUST IN MEDIA This section presents information on the sources of information from which people report accessing information about what is happening across Sierra Leone and specifically information relating to the forthcoming elections. It also presents information on the level of trust which people report having in various sources of information and the relevance of information they have heard about elections. Sources of information about Sierra Leone and about forthcoming elections Respondents were asked about their sources of information for what is happening across Sierra Leone. Figure 33 shows the proportion of people mentioning each of five sources of information across each sample District/Area. People (friends, family, work colleagues, local community) and radio are by far the most mentioned sources of information. Mirroring the data presented on radio consumption, those areas where access is lower have higher proportions of respondents reporting that they get information through friends, family and community than through radio. Around half of respondents from Freetown mention TV and newspapers as sources of information, but the proportions drop substantially in other parts of the country.
91
62
76
97 96
79
9995
85
9093 93
70
49
18
23
6
28
52
911
3 1 1 27
0 2 0 0 14
0
95
86
94
211918 21
0
20
40
60
80
100
120
Westernurban
Westernrural
PortLoko
Bombali Kono Pujehun Bo Kailahun
PeopleRadioNewspapersTVInternet
Figure 33: % of people in all sample Districts/Areas mentioning each source for information on what is happening across Sierra Leone (Base = All respondents)
29
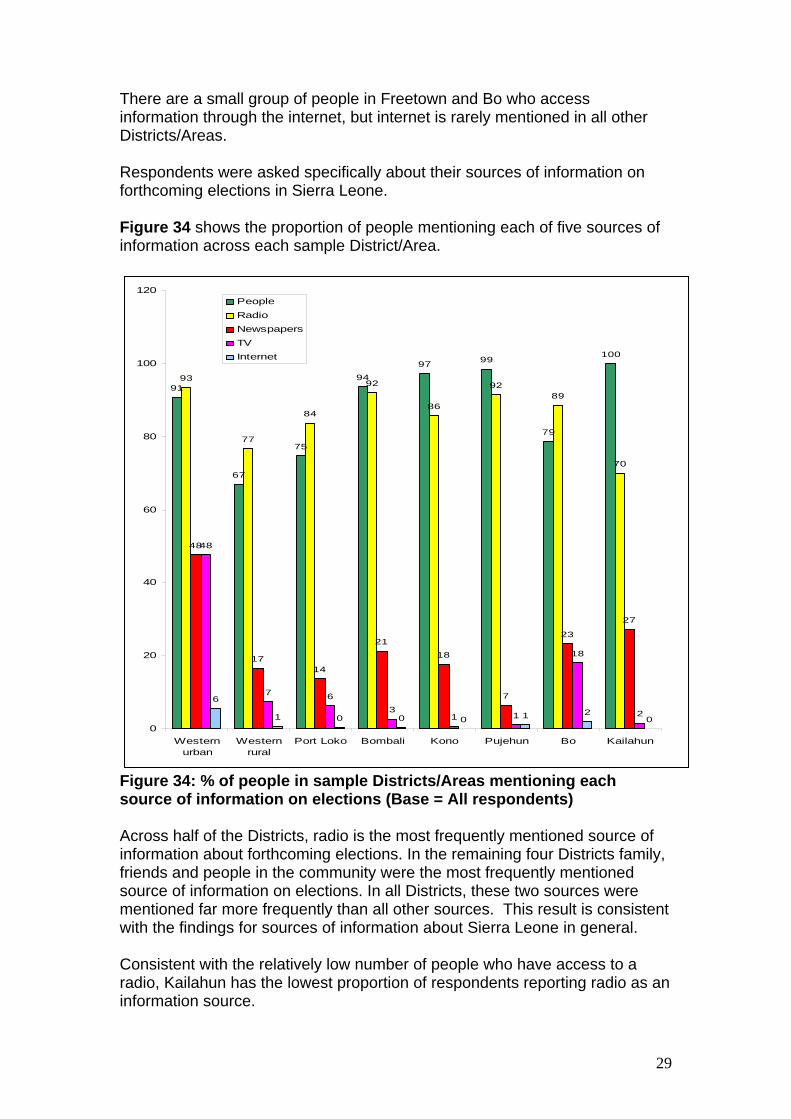
There are a small group of people in Freetown and Bo who access information through the internet, but internet is rarely mentioned in all other Districts/Areas. Respondents were asked specifically about their sources of information on forthcoming elections in Sierra Leone. Figure 34 shows the proportion of people mentioning each of five sources of information across each sample District/Area.
91
67
75
94
97 99
79
100
93
77
84
92
86
9289
70
48
1714
21
18
7
23
27
48
7 6
31 1
18
2
6
1 0 0 0 1 20
0
20
40
60
80
100
120
Westernurban
Westernrural
Port Loko Bombali Kono Pujehun Bo Kailahun
PeopleRadioNewspapersTVInternet
Figure 34: % of people in sample Districts/Areas mentioning each source of information on elections (Base = All respondents) Across half of the Districts, radio is the most frequently mentioned source of information about forthcoming elections. In the remaining four Districts family, friends and people in the community were the most frequently mentioned source of information on elections. In all Districts, these two sources were mentioned far more frequently than all other sources. This result is consistent with the findings for sources of information about Sierra Leone in general. Consistent with the relatively low number of people who have access to a radio, Kailahun has the lowest proportion of respondents reporting radio as an information source.
30
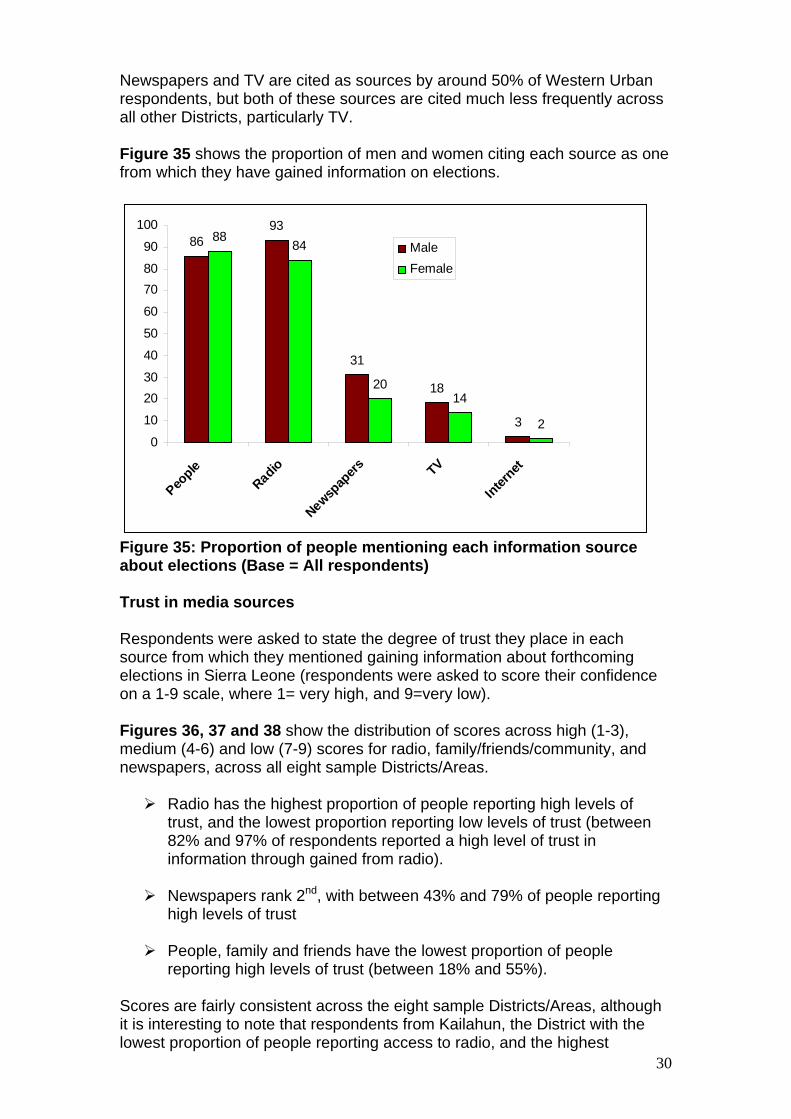
Newspapers and TV are cited as sources by around 50% of Western Urban respondents, but both of these sources are cited much less frequently across all other Districts, particularly TV. Figure 35 shows the proportion of men and women citing each source as one from which they have gained information on elections.
8693
31
18
3
8884
2014
20
10
2030
40
50
60
7080
90
100
People
Radio
Newspap
ers TV
Internet
MaleFemale
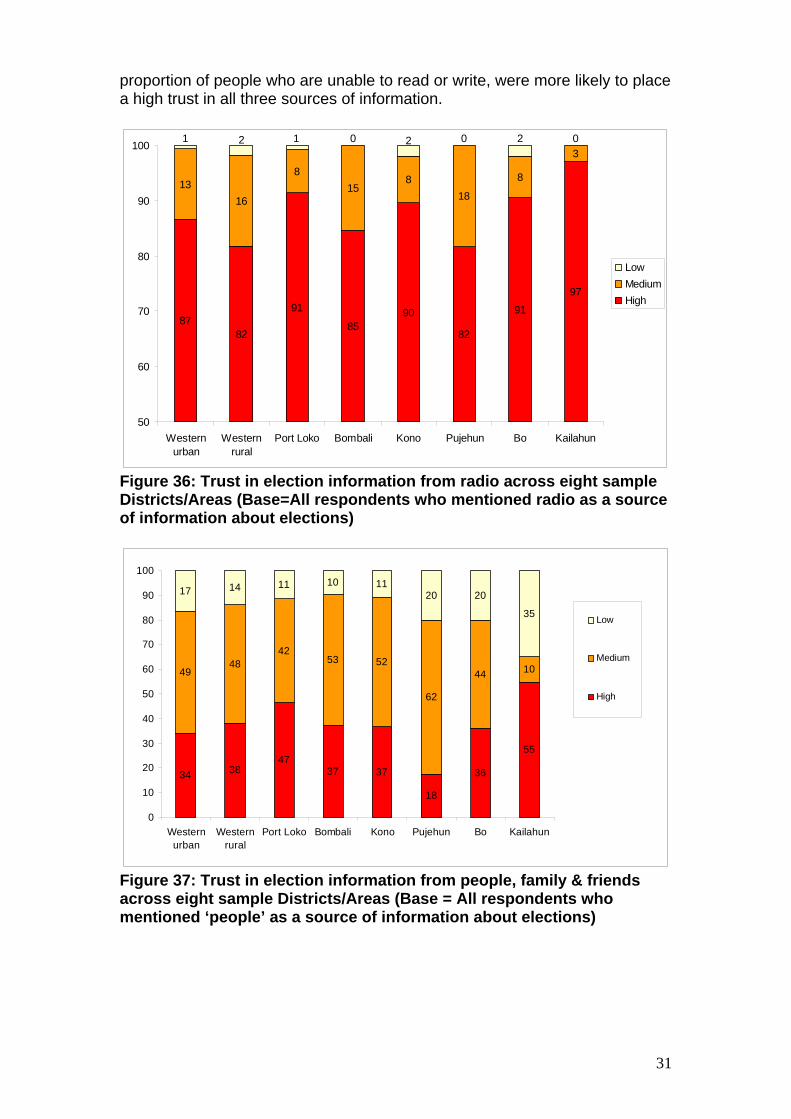
Figure 35: Proportion of people mentioning each information source about elections (Base = All respondents) Trust in media sources Respondents were asked to state the degree of trust they place in each source from which they mentioned gaining information about forthcoming elections in Sierra Leone (respondents were asked to score their confidence on a 1-9 scale, where 1= very high, and 9=very low). Figures 36, 37 and 38 show the distribution of scores across high (1-3), medium (4-6) and low (7-9) scores for radio, family/friends/community, and newspapers, across all eight sample Districts/Areas.
Radio has the highest proportion of people reporting high levels of trust, and the lowest proportion reporting low levels of trust (between 82% and 97% of respondents reported a high level of trust in information through gained from radio).
Newspapers rank 2nd, with between 43% and 79% of people reporting
high levels of trust
People, family and friends have the lowest proportion of people reporting high levels of trust (between 18% and 55%).
Scores are fairly consistent across the eight sample Districts/Areas, although it is interesting to note that respondents from Kailahun, the District with the lowest proportion of people reporting access to radio, and the highest
31
proportion of people who are unable to read or write, were more likely to place a high trust in all three sources of information.
8782
91
8590
82
91
97
1316
815
818
8
3202012 01
50
60
70
80
90
100
Westernurban
Westernrural
Port Loko Bombali Kono Pujehun Bo Kailahun
LowMediumHigh
Figure 36: Trust in election information from radio across eight sample Districts/Areas (Base=All respondents who mentioned radio as a source of information about elections)
34 3847
37 37
18
36
55
4948
4253 52
62
44 10
17 14 11 10 1120 20
35
0
10
20
30
40
50
60
70
80
90
100
Westernurban
Westernrural
Port Loko Bombali Kono Pujehun Bo Kailahun
Low
Medium
High
Figure 37: Trust in election information from people, family & friends across eight sample Districts/Areas (Base = All respondents who mentioned ‘people’ as a source of information about elections)
32
44 43
7866 68 69
61
79
45 51
2031 26
31
27
2112 6 6
12
0033
0
10
20
30
40
50
60
70
80
90
100
Westernurban
Westernrural
Port Loko Bombali Kono Pujehun Bo Kailahun
LowMediumHigh
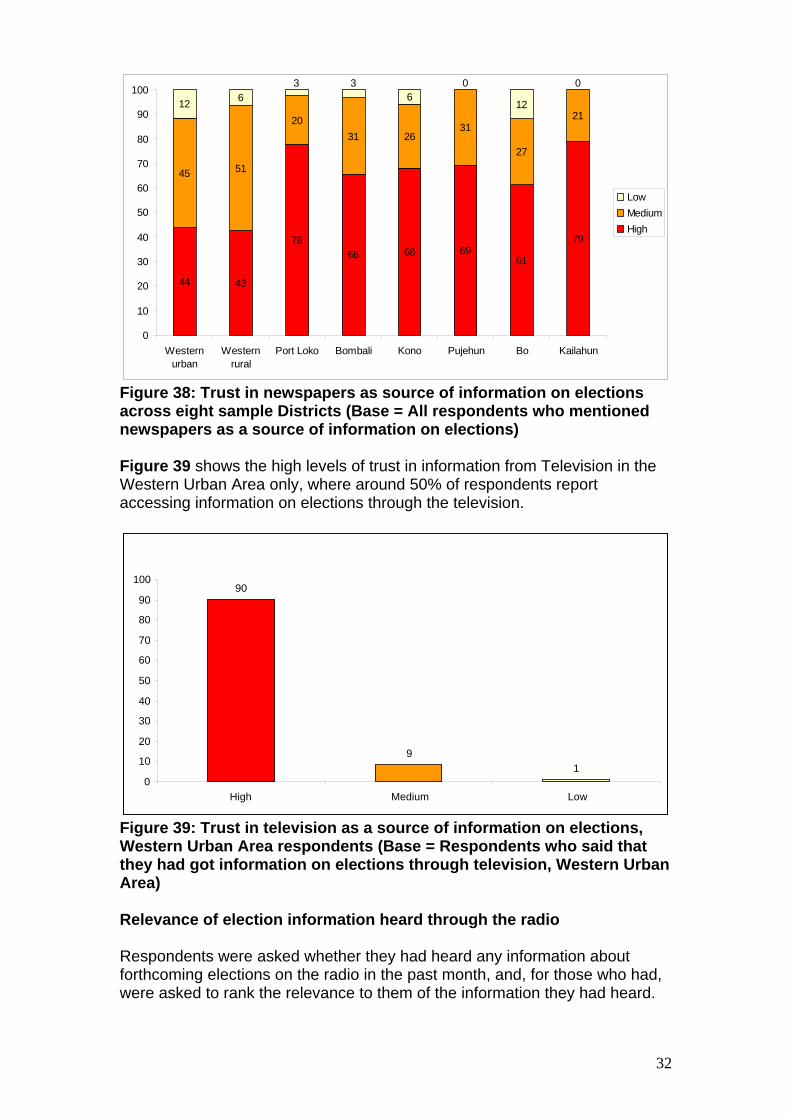
Figure 38: Trust in newspapers as source of information on elections across eight sample Districts (Base = All respondents who mentioned newspapers as a source of information on elections) Figure 39 shows the high levels of trust in information from Television in the Western Urban Area only, where around 50% of respondents report accessing information on elections through the television.
Figure 39: Trust in television as a source of information on elections, Western Urban Area respondents (Base = Respondents who said that they had got information on elections through television, Western Urban Area) Relevance of election information heard through the radio Respondents were asked whether they had heard any information about forthcoming elections on the radio in the past month, and, for those who had, were asked to rank the relevance to them of the information they had heard.
90
91
0 10 20 30 40 50 60 70 80 90
100
High Medium Low
33
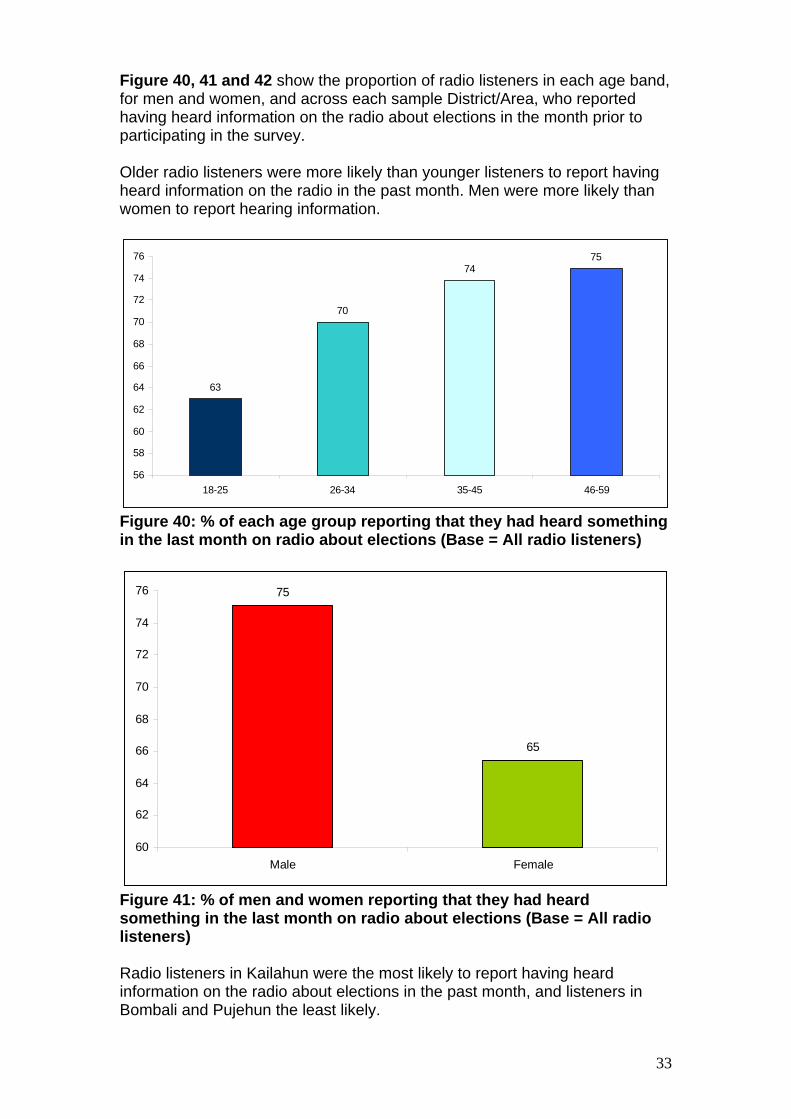
Figure 40, 41 and 42 show the proportion of radio listeners in each age band, for men and women, and across each sample District/Area, who reported having heard information on the radio about elections in the month prior to participating in the survey. Older radio listeners were more likely than younger listeners to report having heard information on the radio in the past month. Men were more likely than women to report hearing information.
63
70
7475
56
58
60
62
64
66
68
70
72
74
76
18-25 26-34 35-45 46-59
Figure 40: % of each age group reporting that they had heard something in the last month on radio about elections (Base = All radio listeners)
75
65
60
62
64
66
68
70
72
74
76
Male Female
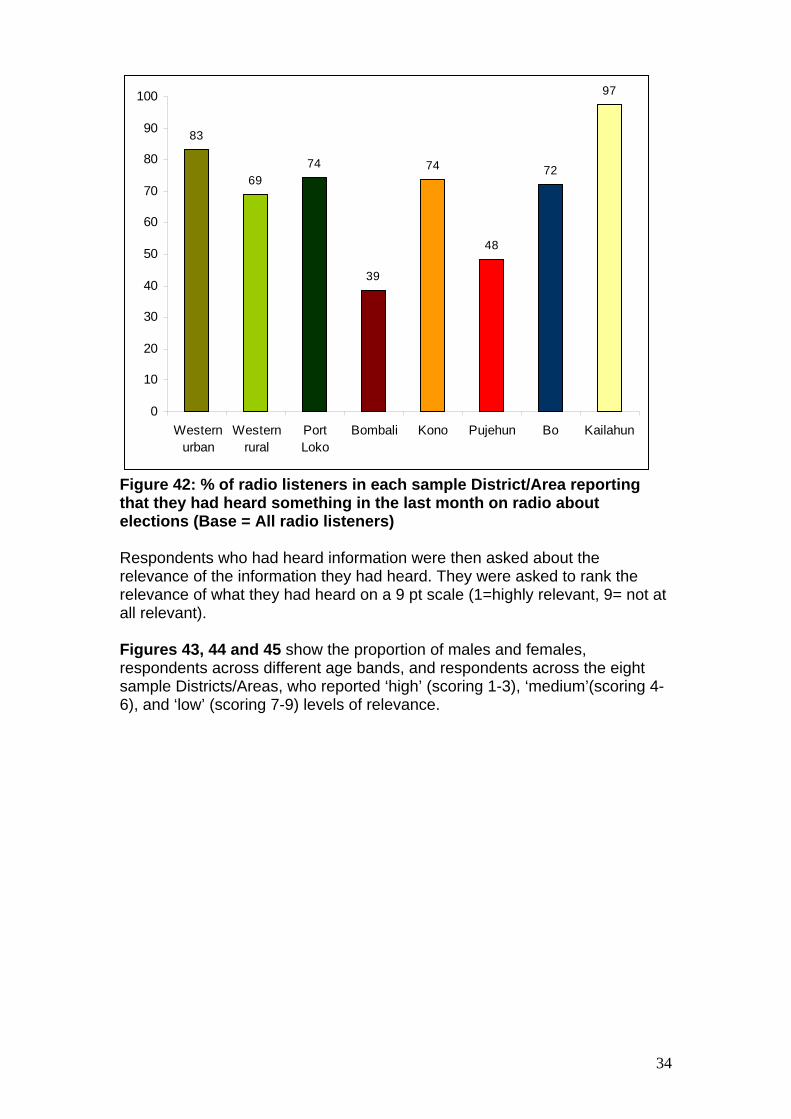
Figure 41: % of men and women reporting that they had heard something in the last month on radio about elections (Base = All radio listeners) Radio listeners in Kailahun were the most likely to report having heard information on the radio about elections in the past month, and listeners in Bombali and Pujehun the least likely.
34
83
6974
39
74
48
72
97
0
10
20
30
40
50
60
70
80
90
100
Westernurban
Westernrural
PortLoko
Bombali Kono Pujehun Bo Kailahun
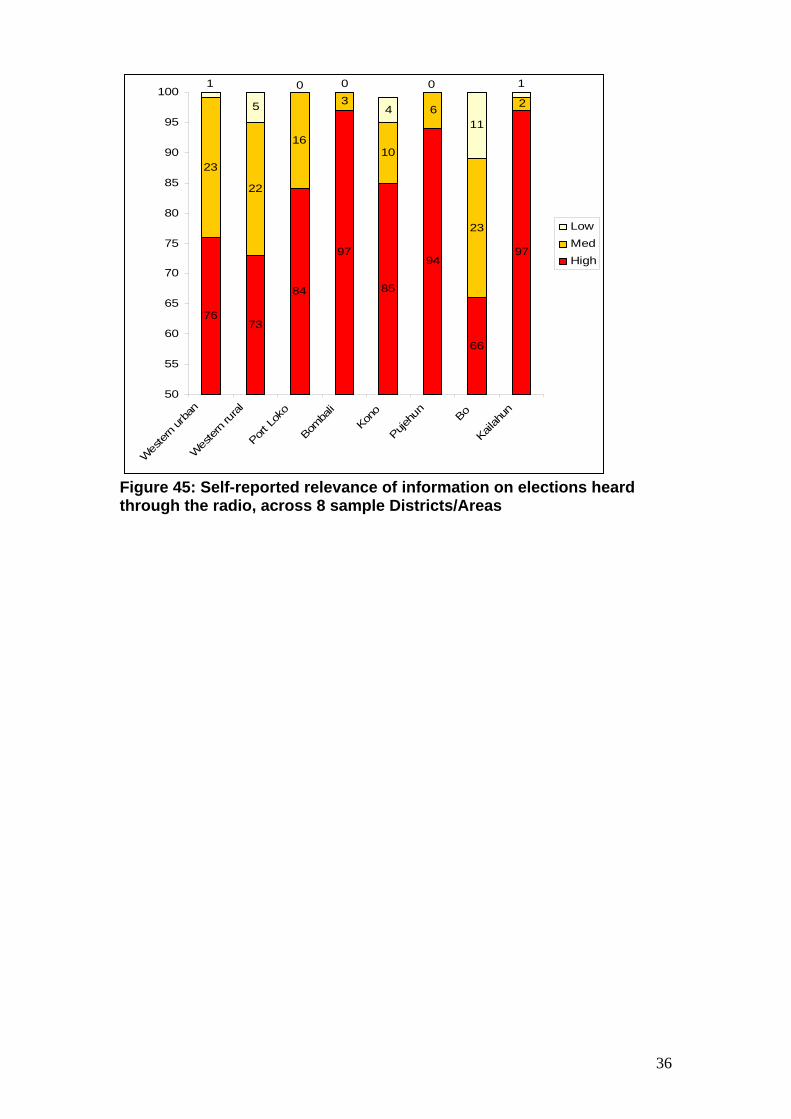
Figure 42: % of radio listeners in each sample District/Area reporting that they had heard something in the last month on radio about elections (Base = All radio listeners) Respondents who had heard information were then asked about the relevance of the information they had heard. They were asked to rank the relevance of what they had heard on a 9 pt scale (1=highly relevant, 9= not at all relevant). Figures 43, 44 and 45 show the proportion of males and females, respondents across different age bands, and respondents across the eight sample Districts/Areas, who reported ‘high’ (scoring 1-3), ‘medium’(scoring 4-6), and ‘low’ (scoring 7-9) levels of relevance.
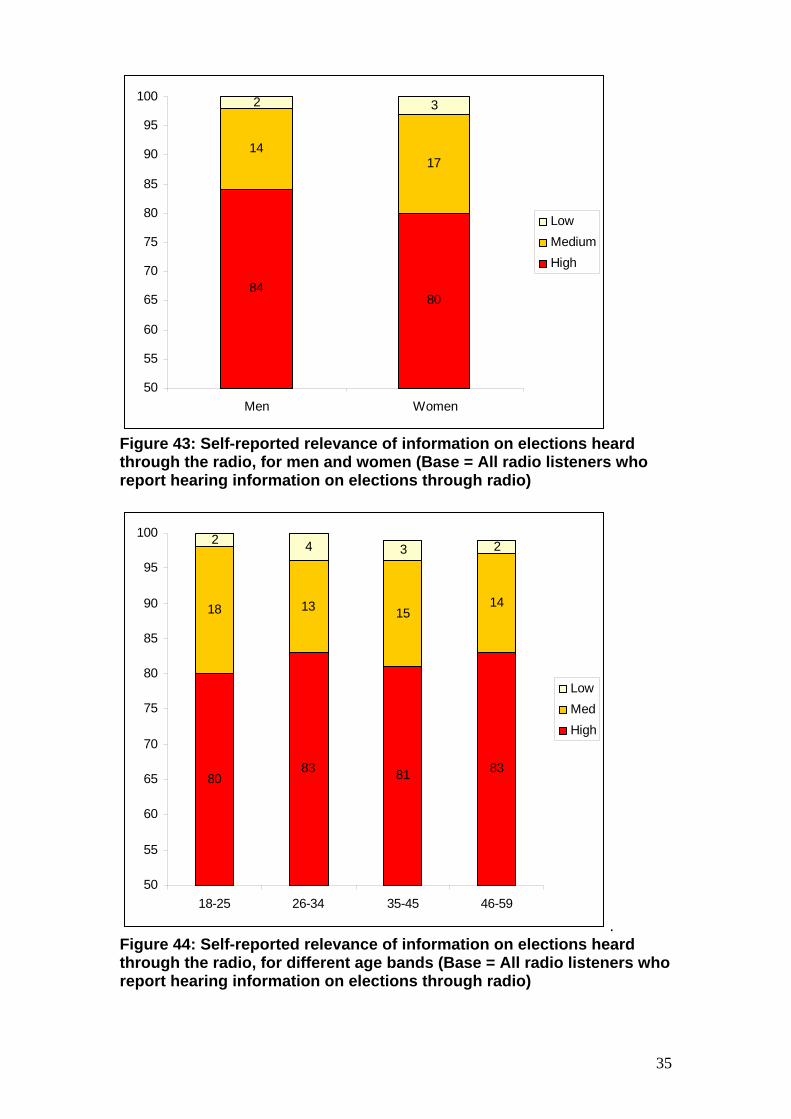
35
8480
1417
2 3
50
55
60
65
70
75
80
85
90
95
100
Men Women
LowMediumHigh
Figure 43: Self-reported relevance of information on elections heard through the radio, for men and women (Base = All radio listeners who report hearing information on elections through radio)
8083 81 83
18 13 1514
2 4 3 2
50
55
60
65
70
75
80
85
90
95
100
18-25 26-34 35-45 46-59
LowMedHigh
. Figure 44: Self-reported relevance of information on elections heard through the radio, for different age bands (Base = All radio listeners who report hearing information on elections through radio)
36
7673
84
97
85
94
66
97
23
22
16
3
10
6
23
25 411
10001
50
55
60
65
70
75
80
85
90
95
100
Wes
tern u
rban
Wes
tern r
ural
Port Lo
ko
Bomba
li
Kono
Pujehu
nBo
Kailah
un
LowMedHigh
Figure 45: Self-reported relevance of information on elections heard through the radio, across 8 sample Districts/Areas