Embed Size (px)
Citation preview
Supplemental Information: Cortical thickness and subcortical gray matter volume in pediatric
anxiety disorders
Supplemental Methods
Participants
Patients were recruited when they sought treatment for an anxiety disorder; healthy
volunteers (HVs) were recruited using standard protocols employed throughout the National
Institute of Mental Health (NIMH). All patients in the anxiety group had to suffer from
generalized anxiety, social anxiety, and/or separation anxiety disorders as their major source of
psychiatric impairment and need for treatment. Prior to scheduling magnetic resonance imaging
(MRI) scans, patients’ psychiatric symptoms and commitment to seeking treatment were
assessed on three separate occasions via (1) an initial telephone screen with a psychiatric nurse,
(2) an in-person, standardized diagnostic assessment (KSADS-PL) with a clinician, and (3) an
independent assessment and confirmation of diagnosis by a senior psychiatrist. As part of these
three psychiatric screening and assessment sessions, clinicians assessed patients’ willingness and
motivation to engage in psychotherapy and/or pharmacotherapy. Given that all patients agreed to
enter treatment for their anxiety, the morphometry data reported herein are relevant to treatment-
seeking populations of children and adolescents with anxiety.
Patients with anxiety were permitted to have additional anxiety disorders and attention-
deficit/hyperactivity disorder if presenting as a secondary, minor problem, relative to anxiety
(Table 1). All patients were required to be free of major depressive disorder, bipolar disorder,
obsessive compulsive disorder, disruptive mood dysregulation disorder, and posttraumatic stress
disorder. Importantly, all patients were free of medication at the time of the MRI scan.

Handedness was not exclusionary, but was assessed upon enrollment to the study. Using
the Edinburgh Inventory (Oldfield, 1971), handedness was determined to be left-handed (scores
< -40), ambidextrous (scores between or equal to -40 and +40), or right-handed (scores >40). All
participants with available data (N=128) were either right-handed (45 HV, 51 anxious) or
ambidextrous (12 HV, 20 anxious); groups did not differ in number of right-handed versus
ambidextrous participants, χ2(1, N=128)=.85, p=.36.
2

Treatment
Patients with anxiety disorders received individual cognitive behavioral therapy (CBT)
based one of two treatment manuals from the Child and Adolescent Multimodal Study (CAMS):
children ages 13 or younger followed the “The Coping Cat Workbook” and adolescents ages 14
or older followed the “The C.A.T. Project” workbook (Compton et al, 2010; Kendall and
Hedtke, 2006; Walkup et al, 2008). Parents were involved at the end of each session with a brief
check-in. Patients received up to 12 weeks of treatment based on attendance, and timing was not
extended for missed sessions. The three initial weeks consisted of diagnostic assessments,
consent procedures for the neuroimaging and treatment studies, psychoeducation, and orientation
to CBT treatment. In the fourth session, clinicians continued orientation to CBT and collected
baseline ratings. The active, behavioral and cognitive component of CBT, including exposure-
based techniques, began in the fifth session and spanned eight weeks. In the final treatment
sample (n=53), scans ranged from 38 days before to 16 days after the baseline clinician ratings
session.
3

A subset of 40 of the 53 patients included in the treatment analyses concurrently received
either placebo or active forms of attention bias modification therapy (ABMT), immediately
preceding and following each CBT visit and beginning in the fifth week [see (White et al, In
Press) for further details]. The individual treatment covered psychoeducation, self-monitoring,
cognitive restructuring, relaxation training, and exposure and relapse prevention. Treatment
included imaginal, in-office exposure tasks, as well as actual, in vivo exposures, in which
patients approached, rather than avoided, anxiety-provoking situations. Training strategies, such
as coping modeling by clinicians, role-play, and homework assignments were used. Treatment
was provided by one of two licensed clinical psychologists with at least five years CBT
experience with pediatric anxiety disorders. One of the treatment providers (EMB) was a
supervising CBT clinician in the CAMS study and provided consultation as needed regarding
implementation of the treatment manuals.
MRI Acquisition Parameters
Participants underwent MRI scanning at the National Institute of Mental Health (NIMH)
Functional Magnetic Resonance Imaging Core Facility between September 2011 and January
2016. Participants completed a high-resolution, T1-weighted magnetization-prepared rapid-
acquisition gradient-echo scan (MPRAGE) with the following parameters: sagittal acquisition;
176 slices; 256x256 matrix; 1mm3 isotropic voxels; flip angle = 7°; repetition time [TR] = 7.7ms,
echo time [TE] = 3.42ms).
4
Image Processing
Images were processed using standard, automated procedures in the FreeSurfer image
analysis software suite (Version 5.3, http://surfer.nmr.mgh.harvard.edu). For details, see prior
reports (Dale et al, 1999; Fischl and Dale, 2000). Cortical thickness measurements in FreeSurfer
show good test-retest reliability across scanner manufacturers and field strengths (Han et al,
2006; Reuter et al, 2012) and have been validated in previous studies using histological analysis
(Rosas et al, 2002) and manual measurements (Kuperberg et al, 2003). FreeSurfer methods for
obtaining cortical thickness and subcortical gray matter volume measurements have been used in
prior psychiatric research on pediatric populations (McLaughlin et al, 2014; Ostby et al, 2009;
Sheridan et al, 2012; Strawn et al, 2014; Sylvester et al, 2016). Standard processing procedures
included removal of non-brain tissue (Ségonne et al, 2004), image intensity normalization (Sled
et al, 1998), and construction of boundaries between white and gray matter and between gray
matter and cerebrospinal fluid (CSF), which utilized intensity gradients to optimally place the
boundary at the location where the greatest shift in intensity defines the transition to the other
tissue class (Dale et al, 1999; Fischl and Dale, 2000). Subcortical white matter and deep grey
matter structures were then identified by an automated segmentation process (Fischl et al, 2002,
2004b). Following cortical reconstruction, automated procedures parcellate the cerebral cortex
into regions based on gyral and sulcal structure (Desikan et al, 2006; Fischl et al, 2004a). As
needed, manual edits were made to optimize accurate placement of boundaries between white
and gray matter and between gray matter and cerebrospinal fluid (CSF)(Dale et al, 1999; Fischl
and Dale, 2000). Finally, using both intensity and continuity information, cortical thickness
measurements were defined as the closest distance from the gray/white matter boundary to the
gray matter/CSF boundary at each vertex on the tessellated surface (Fischl and Dale, 2000).
5

Exploratory anxiety subscale analyses
Secondary, exploratory analyses tested associations of structural brain measures with the
generalized and social anxiety subscales from the Screen for Child Anxiety Related Emotional
Disorders (SCARED)(Birmaher et al, 1997) in the N=108 participants (37 healthy, 71 anxious)
with available SCARED data. The generalized and social anxiety subscales were highly
correlated with each other (r=.62, p<.001) and with the total anxiety scale (generalized: r=.90,
p<.001; social: r=.73, p<.001). Given these high inter-correlations (all rs>.6, p<.001) and
concerns regarding multi-collinearity, each scale was analyzed separately. The generalized and
social anxiety analyses were considered to be secondary to the primary analyses that relied on
the total score. Severity measures were based on the average of parent and child reports, which
were correlated for each of the subscales (generalized anxiety subscale: r=.52, p<.001; and social
anxiety subscale: r=.60, p<.001).
Post-hoc analyses of anxiety disorder specificity
Post-hoc analyses tested for specificity of anxiety disorder type using 2-by-2 analyses of
variance (ANOVAs) for generalized anxiety disorder (GAD: 55 yes, 91 no) and social anxiety
disorder (SoPH: 41 yes, 105 no) diagnoses. The n=5 patients with only separation anxiety were
excluded from this analysis due to small cell size, resulting in the following four cells: 29
GAD+/SoPH-, 15 GAD-/SoPh+, 26 GAD+/SoPh+, 76 GAD-/SoPH-. Analyses of covariance
(ANCOVAs) were conducted for subcortical GMV, to additionally control for estimated total
intracranial volume (ICV). These post-hoc specificity analyses utilized KSADS diagnoses, rather
than SCARED scores, given that the diagnoses were available in all N=151 participants and were
6

based on clinician interviews, rather than self-report, reflecting more careful clinical
phenotyping.
ABMT-specific treatment response analyses
Post-hoc analyses tested whether ABMT moderated treatment response in the 40 patients
(17 active ABMT, 23 placebo ABMT) who participated in the ABMT trial reported by White
and colleagues (In Press). Of the N=53 patients included in the overall treatment response
analyses, 13 patients were excluded from this analysis: n=12 patients were not randomized to
ABMT, one patient was randomized to ABMT but did not receive any ABMT sessions. Cortical
thickness and subcortical GMV analyses testing associations of post-treatment PARS,
controlling for pre-treatment PARS, were repeated with the addition of the ABMT-by-post-
treatment PARS interaction term.
Supplemental Results
Exploratory anxiety subscale analyses
Cortical thickness. Social anxiety severity was inversely related to thickness in the
ventrolateral PFC, with the peak coordinate in the right rostral middle frontal gyrus (MFG; Peak
Talairach Coordinates [XYZ]: 19.0, 58.4, 3.9; 1372.78mm2; 1819 vertices; Figure S2), based on
the whole-brain correction. The PFC-corrected threshold also resulted in the same right
hemisphere cluster, as well as a left hemisphere cluster in rostral middle frontal gyrus (Peak
Talairach Coordinates [XYZ]: -23.6, 48.1, -0.6; 874.23mm2; 1206 vertices). When tested in the
anxious group only (n=71), there were similar ventrolateral PFC clusters in both hemispheres,
with a left hemisphere cluster that included rostral MFG and extended to a peak in the rostral
anterior cingulate cortex, and a right hemisphere cluster that again included the rostral MFG and
7

extended to both the insula and anterior cingulate cortex (whole-brain corrected p<.05). No
significant clusters emerged using either threshold for generalized anxiety severity.
Subcortical GMV. Greater generalized anxiety severity was related to smaller right
hippocampal GMV, but not left hippocampal or left or right amygdala GMV (Table S2). The
association of generalized anxiety severity with right hippocampal GMV was non-significant
when tested in the anxious group only. Social anxiety severity was not associated with either
hippocampal or amygdala GMV.
Post-hoc analyses of anxiety disorder specificity
Cortical thickness. No significant clusters emerged using either the whole-brain-
corrected or PFC-corrected thresholds for the main effects or interaction analyses.
Subcortical GMV. The right hippocampus showed a main effect of GAD
[F(1,141)=8.93, p=.003], but no main effect of SoPH [F(1,141)=1.18, p=.28] or interaction effect
[F(1,141)=.09, p=.76]. Smaller GMV in the right hippocampus was observed in the GAD
patients (n=55, estimated marginal mean = 3991.0 mm3, s.e. = 50.62 mm3) relative to participants
without GAD (n=91, estimated marginal mean = 4209.47 mm3, s.e. = 52.73 mm3). The effect
size was medium (Cohen’s d = .49, controlling for ICV). The main effect of GAD did not
survive Bonferroni correction for two hemispheres for the left hippocampus [F(1,141)=4.97,
p=.027], left amygdala [F(1,141)=4.62, p=.03], or right amygdala [F(1,141)=.89, p=.35]. The
main effect of SoPH and interaction effect were non-significant for both regions (all ps>.36).
8
ABMT-specific treatment response analyses
Cortical thickness. ABMT group moderated the association between anxiety treatment
response and cortical thickness in the left superior frontal cortex, extending to the rostral anterior
cingulate cortex (Peak Talairach Coordinates [XYZ]: -11.7, 53.3, 4.4; 737.45mm2; 1185 vertices;
Figure S3), based on the PFC-corrected threshold (p<.05, corrected). In the placebo group,
thinner cortex was associated with worse treatment response, i.e., higher continuous anxiety
symptom ratings post-treatment controlling for baseline (β=-.63, p=.002). However, the active
group showed no such association (β=.25, p=.35). No clusters emerged for the right hemisphere
using the PFC-corrected threshold or for either hemisphere using the whole-brain corrected
threshold.
Subcortical GMV. ABMT did not moderate the association of treatment response with
hippocampal (left: p=.97; right: p=.98) or amygdala GMV (left: p=.80; right: p=.96).
9

References
Birmaher B, Khetarpal S, Brent D, Cully M, Balach L, Kaufman J, et al (1997). The Screen for
Child Anxiety Related Emotional Disorders (SCARED): scale construction and
psychometric characteristics. J Am Acad Child Adolesc Psychiatry 36: 545–553.
Compton SN, Walkup JT, Albano AM, Piacentini JC, Birmaher B, Sherrill JT, et al (2010).
Child/Adolescent Anxiety Multimodal Study (CAMS): rationale, design, and methods.
Child Adolesc Psychiatry Ment Health 4: 1–15.
Dale AM, Fischl B, Sereno MI (1999). Cortical surface-based analysis. I. Segmentation and
surface reconstruction. Neuroimage 9: 179–94.
Desikan RS, Ségonne F, Fischl B, Quinn BT, Dickerson BC, Blacker D, et al (2006). An
automated labeling system for subdividing the human cerebral cortex on MRI scans into
gyral based regions of interest. Neuroimage 31: 968–80.
Fischl B, Dale AM (2000). Measuring the thickness of the human cerebral cortex from magnetic
resonance images. Proc Natl Acad Sci U S A 97: 11050–5.
Fischl B, Kouwe A van der, Destrieux C, Halgren E, Ségonne F, Salat DH, et al (2004a).
Automatically parcellating the human cerebral cortex. Cereb Cortex 14: 11–22.
Fischl B, Salat DH, Busa E, Albert MS, Dieterich M, Haselgrove C, et al (2002). Whole brain
segmentation: automated labeling of neuroanatomical structures in the human brain. Neuron
33: 341–55.
Fischl B, Salat DH, Kouwe AJW van der, Makris N, Ségonne F, Quinn BT, et al (2004b).
10

Sequence-independent segmentation of magnetic resonance images. Neuroimage 23 Suppl
1: S69-84.
Han X, Jovicich J, Salat D, Kouwe A van der, Quinn B, Czanner S, et al (2006). Reliability of
MRI-derived measurements of human cerebral cortical thickness: the effects of field
strength, scanner upgrade and manufacturer. Neuroimage 32: 180–94.
Kendall P, Hedtke K (2006). The coping cat program workbook. Workbook Publishing:
Ardmore, PA.
Kuperberg GR, Broome MR, McGuire PK, David AS, Eddy M, Ozawa F, et al (2003).
Regionally localized thinning of the cerebral cortex in schizophrenia. Arch Gen Psychiatry
60: 878–88.
McLaughlin KA, Sheridan MA, Winter W, Fox NA, Zeanah CH, Nelson CA (2014).
Widespread reductions in cortical thickness following severe early-life deprivation: a
neurodevelopmental pathway to attention-deficit/hyperactivity disorder. Biol Psychiatry 76:
629–38.
Oldfield RC (1971). The assessment and analysis of handedness: The Edinburgh inventory.
Neuropsychologia 9: 97–113.
Ostby Y, Tamnes CK, Fjell AM, Westlye LT, Due-Tønnessen P, Walhovd KB (2009).
Heterogeneity in subcortical brain development: A structural magnetic resonance imaging
study of brain maturation from 8 to 30 years. J Neurosci 29: 11772–82.
Reuter M, Schmansky NJ, Rosas HD, Fischl B (2012). Within-subject template estimation for
unbiased longitudinal image analysis. Neuroimage 61: 1402–18.
11

Rosas HD, Liu AK, Hersch S, Glessner M, Ferrante RJ, Salat DH, et al (2002). Regional and
progressive thinning of the cortical ribbon in Huntington’s disease. Neurology 58: 695–701.
Ségonne F, Dale AM, Busa E, Glessner M, Salat D, Hahn HK, et al (2004). A hybrid approach
to the skull stripping problem in MRI. Neuroimage 22: 1060–75.
Sheridan MA, Fox NA, Zeanah CH, McLaughlin KA, Nelson CA (2012). Variation in neural
development as a result of exposure to institutionalization early in childhood. Proc Natl
Acad Sci U S A 109: 12927–32.
Sled JG, Zijdenbos AP, Evans AC (1998). A nonparametric method for automatic correction of
intensity nonuniformity in MRI data. IEEE Trans Med Imaging 17: 87–97.
Strawn JR, John Wegman C, Dominick KC, Swartz MS, Wehry AM, Patino LR, et al (2014).
Cortical surface anatomy in pediatric patients with generalized anxiety disorder. J Anxiety
Disord 28: 717–23.
Sylvester CM, Barch DM, Harms MP, Belden AC, Oakberg TJ, Gold AL, et al (2016). Early
Childhood Behavioral Inhibition Predicts Cortical Thickness in Adulthood. J Am Acad
Child Adolesc Psychiatry 55: 122–129e1.
Walkup JT, Albano AM, Piacentini J, Birmaher B, Compton SN, Sherrill JT, et al (2008).
Cognitive behavioral therapy, sertraline, or a combination in childhood anxiety. N Engl J
Med 359: 2753–66.
White LK, Sequeira S, Britton JC., Brotman MA., Gold AL., Berman E, et al (In Press).
Complementary Features of Attention Bias Modification Therapy and Cognitive Behavioral
Therapy in Pediatric Anxiety Disorders. Am J Psychiatry
12
Supplemental Figure Legends.
Figure S1. Prefrontal cortex (PFC) region-of-interest (ROI) mask.
A PFC mask was created for the left and right hemispheres, separately, for use in the a priori
PFC cortical thickness analyses. The following twelve regions in the Desikan-Killiany Atlas
(Desikan et al, 2006; Fischl et al, 2004a) were combined to create the mask: medial and lateral
orbitofrontal cortices, pars orbitalis, pars triangularis, pars opercularis, rostral and caudal anterior
cingulate cortices, rostral and caudal middle frontal cortices, superior frontal cortex, frontal pole,
and insular cortex. The PFC mask is shown here on the inflated surface from the lateral (A) and
medial (B) views for the left hemisphere, and from the inferior view for the right (C) and left (D)
hemispheres.
Figure S2. Association of cortical thickness and social anxiety severity.
Based on the whole-brain vertex-wise correction (p<.05, corrected), cortical thickness in the
right ventrolateral prefrontal cortex, with a peak in the rostral middle frontal gyrus, was inversely
related to social anxiety symptoms (β=-.30), i.e., higher severity was related to thinner cortex.
Results are shown on both the inflated and pial surfaces. The scatterplot shows the average
cortical thickness of this cluster on the x-axis and continuous social anxiety symptom scores on
the y-axis.
Figure S3. ABMT-specific treatment response.
Based on the PFC-corrected threshold (p<.05, corrected), attention bias modification therapy
(ABMT) group moderated the association between anxiety treatment response and cortical
13

thickness in the medial PFC, with a peak in the left superior frontal cortex, extending to the
rostral anterior cingulate cortex. This interaction effect was driven by an association of thinner
cortex with worse treatment response, i.e., higher continuous anxiety symptom ratings post-
treatment controlling for baseline, in the placebo group (β=-.63, p=.002) compared to no
association in the active group (β=.25, p=.35). This cluster is shown on both the inflated (top
row) and pial surfaces (bottom row) of the left hemisphere. The scatterplot shows average
cortical thickness of this cluster on the x-axis and continuous treatment response (i.e., post-
treatment Pediatric Anxiety Rating Scale [PARS] scores, residualized for pre-treatment PARS
scores) on the y-axis for the placebo (green; n=23) and active groups (blue; n=17).
14

Table S1. Structural MRI studies of pediatric anxiety
First Author(Year)
Age range; Mean age
(yrs)
Between subjects compar-
ison
ANXtype
Comorbid dx in ANX group
Method
ROI and/or
WB approach
Associations with anxiety?
PFC Hipp Amyg Insula Other regions
DICHOTOMOUS ANXIETY MEASURE: ANXIOUS VS. NON-ANXIOUS YOUTHS
De Bellis(2000)a
8-16;ANX: 12.7, HV: 12.5
12 ANX vs.
24 HVGAD
MDD, DEP-NOS,
Panic, SoPh
Manual Tracing;
1.5T MRI
ROI only (hipp, amyg, basal ganglia,
temporal lobe, global measures)
n/a n.s↑ R & total amyg
n/a n.s.
De Bellis(2002)a
8-16;ANX: 12.5, HV: 12.0
13 ANX vs.
98 HVGAD
MDD, DEP-NOS,
Panic, SoPh
Manual Tracing;
1.5T MRI
ROI only (STG,
thalamus, PFC, global measures)
n.s. n/a n/a n/a ↑ STG
Jones(2015)
8-18; Epilepsy w/ ANX: 12.1,
Epilepsy w/o ANX:
12.9,HV: 13.2
25 Epilepsy w/ANX;
63 Epilepsy
w/o ANX;49 HV
SP, SAD, SoPh, GAD, ANX-NOS
MDD, ADHD
FS (GMV & CT);
1.5T MRI
ROI only (GMV: amyg,
hipp; CT: medial OFC, lateral OFC, frontal pole)
↓ L vmPFC/medial
OFC,R lateral OFC &
R frontal pole
n.s. ↑ L amyg n/a n/a
Liao(2014)
16-18;ANX: 16.8,
16.9,HV: 16.9,
16.5 b
26 ANX vs.
25 HVGAD None VBM;
3T MRI WB n.s. n.s. n.s. n.s. ↑ R putamen
Milham(2005)
ANX: 12.9, HV: 12.4
17 ANX vs.
34 HV
SoPh, GAD, SAD
MDD VBM;3T MRI
ROI (amyg, ACC, hipp,
OFC) & exploratory
WB
n.s. n.s. ↓ L amyg n.s. n.s.
15
Mueller(2013)
ANX:11.3, 13.7,
HV: 13.5, 13.9c
39 ANX vs.
63 HV
SoPh, GAD, SAD
SP, MDD, ADHD, ODD,Tic dx,
Enuresis
VBM; 3T MRI
ROI only (amyg, hipp, ACC, insula)
n.s. ↓ R ant. hipp.
↓ R amyg
↑ R & L insula n/a
Strawn(2014)d
ANX: 14.0, HV: 14.0
13 ANX vs.
19 HVGAD SoPh, SP
FS (CT);
4T MRIWB
↑ R rostral middle frontal, spanning vmPFC & IFG
n/a n/a n.s. ↑ R occipital, L MTG & L ITG
Strawn(2013)d
10-18; ANX: 13.0, HV: 13.0
15 ANX vs.
28 HVGAD SoPh, SP,
ADHDVBM;
4T MRI WB ↓ L OFC n.s. n.s. n.s.↓ R PCC;
↑ R precuneus, R precentral gyrus
Strawn(2015)
7-19; ANX: 14.4, HV: 14.8
38 ANX vs.
27 HV
GAD, SoPh, SAD
SP, ADHD VBM;3T MRI
WB & ROI (amyg only)
↑ L dACC;↓ L IFG/vlPFC n/a ↓ L & R
amyg. n/a↓ L postcentral
gyrus & L cuneus/precuneus
CONTINUOUS ANXIETY MEASURE IN HV YOUTHS
Ducharme (2014)e
4.9-18.0; 11.9
300 HV w/
anx/dep CBCL sx
n/a n/a
CIVET (CT);1.5T MRI
ROI only (ACC,
sgACC, OFC)
n.s. collapsing across age;
age-by-anx/dep interaction in
R vmPFC(↓ in ages 5-8,
↑ ages 15+)
n/a n/a n/a n/a
Koolschijn(2013) 8-17
179 HV w/CBCL internal-izing sx
n/a n/aFS
(GMV);3T MRI
ROI only (hipp, amyg) n/a ↓ L & Total
hipp. n.s. n/a n/a
aThese studies contain overlapping samples; 12 of the 13 GAD patients in de Bellis et al. (2000) were included in de Bellis et al. (2002).
bMean ages reported separately for male and female subgroups, respectively.
cMean ages reported separately for Met and Val genotype subgroups, respectively.
dThese studies contain overlapping samples; 10 of the 13 GAD patients in Strawn et al. (2014) were included in Strawn et al. (2013).
eResults summarized for Visit 1 data only.
Abbreviations: ACC, anterior cingulate cortex; ADHD, attention-deficit/hyperactivity disorder; ant, anterior; amyg, amygdala; ANX, anxious; ANX-NOS, anxiety disorder not otherwise specified; CBCL, Child Behavior Checklist; CT, cortical thickness; dACC, dorsal anterior cingulate cortex; dep, depressed; DEP-NOS, depressive disorder not otherwise specified; dx, disorder; FS, FreeSurfer; GAD, generalized anxiety disorder; GM, grey matter; GMV, grey matter volume; hipp, hippocampus; HV, healthy volunteers; IFG, inferior
16

frontal gyrus; ITG, inferior temporal gyrus; L, left; MDD, major depressive disorder; MTG, middle temporal gyrus; n/a, not applicable; n.s., non-significant; ODD, oppositional defiant disorder; OFC, orbitofrontal cortex; PCC, posterior cingulate cortex; PFC, prefrontal cortex; R, right; ROI, region-of-interest; SAD, separation anxiety disorder; sgACC, subgenual anterior cingulate cortex; SoPh, social anxiety disorder; sx, symptoms; STG, superior temporal gyrus; SP, specific phobia; VBM, voxel-based morphometry; vlPFC, ventrolateral prefrontal cortex; vmPFC, ventromedial prefrontal cortex; WB, whole-brain; w/, with; w/o, without; WM, white matter; yrs, years
17
Table S2. Associations of anxiety subscale severity with subcortical gray matter volumes.a
Continuous associations with anxiety severity (N=108)b
Generalized anxiety Social anxiety
Region Β t p Β t p
Hippocampus
Left -0.15 -1.81 0.07 -0.12 -1.47 0.15
Right -0.20 -2.41 0.017 -0.12 -1.50 0.14
Amygdala
Left -0.12 -1.58 0.12 -0.04 -0.47 0.64
Right -0.10 -1.32 0.19 -0.05 -0.68 0.50
aAnalyses control for controlled for estimated total intracranial volume (ICV) to examine regional GMV (independent of total brain size).bAnxiety severity scores measured by the SCARED (Birmaher et al, 1997) and based on the average of child and parent reports within 60 days of scan; data available for 108 participants (37 HV, 71 anxious).
Abbreviations: Gen, generalized; HV, healthy volunteer; SCARED, Screen for Child Anxiety Related Emotional Disorders; SD, standard deviation.
18
Table S3. Associations of treatment response with subcortical gray matter volumes. a
Continuous treatment response:
Post-treatment anxiety, controlling for baseline anxiety (N=53)
Region Β t p
Hippocampus
Left -0.01 -0.10 0.92
Right -0.02 -0.16 0.88
Amygdala
Left -0.02 -0.17 0.87
Right -0.02 -0.14 0.89
aAnalyses controlled for estimated total intracranial volume (ICV) to examine regional GMV (independent of total brain size).
Abbreviations: HV, healthy volunteer; SD, standard deviation.
19
Table S4. Region-of-interest analysis: Associations of anxiety diagnosis with PFC thickness
Anxiety diagnosis group differences (N=151)
Region
Anxious (N=75) Healthy (N=76) Bootstrapped95% CI β Cohen’s
d t pMean (SD) (mm) Mean (SD) (mm)
L caudal ACC 2.71 (0.17) 2.69 (0.20) -0.21, 0.44 0.12 0.12 0.71 0.48
R caudal ACC 2.68 (0.23) 2.58 (0.20) 0.17, 0.79 0.47 0.48 2.97 0.003
L caudal middle frontal 2.81 (0.14) 2.81 (0.17) -0.30, 0.35 0.02 0.02 0.14 0.89
R caudal middle frontal 2.75 (0.15) 2.75 (0.17) -0.32, 0.32 -0.001 0.001 -0.004 .997
L lateral OFC 2.81 (0.15) 2.76 (0.18) 0.02, 0.64 0.32 0.32 2.00 0.05
R lateral OFC 2.84 (0.16) 2.81 (0.17) -0.14, 0.50 0.18 0.18 1.08 0.28
L medial OFC 2.67 (0.16) 2.62 (0.18) -0.03, 0.60 0.28 0.28 1.72 0.09
R medial OFC 2.64 (0.18) 2.58 (0.16) 0.05, 0.66 0.35 0.36 2.19 0.03
L pars opercularis 2.87 (0.12) 2.84 (0.15) -0.10, 0.52 0.21 0.21 1.31 0.19
R pars opercularis 2.80 (0.15) 2.79 (0.16) -0.31, 0.32 0.01 0.02 0.09 0.93
L pars orbitalis 3.00 (0.20) 2.97 (0.22) -0.21, 0.43 0.12 0.12 0.73 0.46
R pars orbitalis 3.01 (0.22) 2.93 (0.23) 0.08, 0.70 0.38 0.38 2.34 0.02
L pars triangularis 2.74 (0.17) 2.70 (0.14) -0.05, 0.58 0.26 0.26 1.60 0.11
R pars triangularis 2.69 (0.16) 2.69 (0.17) -0.29, 0.34 0.03 0.03 0.18 0.86
L rostral ACC 3.03 (0.25) 2.96 (0.24) -0.01, 0.62 0.29 0.29 1.81 0.07
R rostral ACC 3.04 (0.25) 2.99 (0.25) -0.15, 0.50 0.17 0.17 1.07 0.29
L rostral middle frontal 2.67 (0.16) 2.64 (0.15) -0.11, 0.52 0.21 0.21 1.31 0.19
R rostral middle frontal 2.61 (0.16) 2.60 (0.17) -0.24, 0.40 0.09 0.09 0.53 0.60
L superior frontal 3.06 (0.15) 3.01 (0.15) 0.02, 0.66 0.34 0.34 2.10 0.04
R superior frontal 3.00 (0.17) 2.98 (0.15) -0.17, 0.46 0.15 0.15 0.94 0.35
L frontal pole 3.09 (0.30) 3.09 (0.33) -0.35, 0.29 -0.03 0.03 -0.18 0.86
R frontal pole 3.00 (0.29) 3.02 (0.27) -0.38, 0.27 -0.05 0.05 -0.29 0.77
L insula 3.26 (0.14) 3.20 (0.15) 0.05, 0.69 0.37 0.38 2.33 0.02
R insula 3.17 (0.15) 3.13 (0.17) -0.04, 0.60 0.28 0.28 1.74 0.08
20
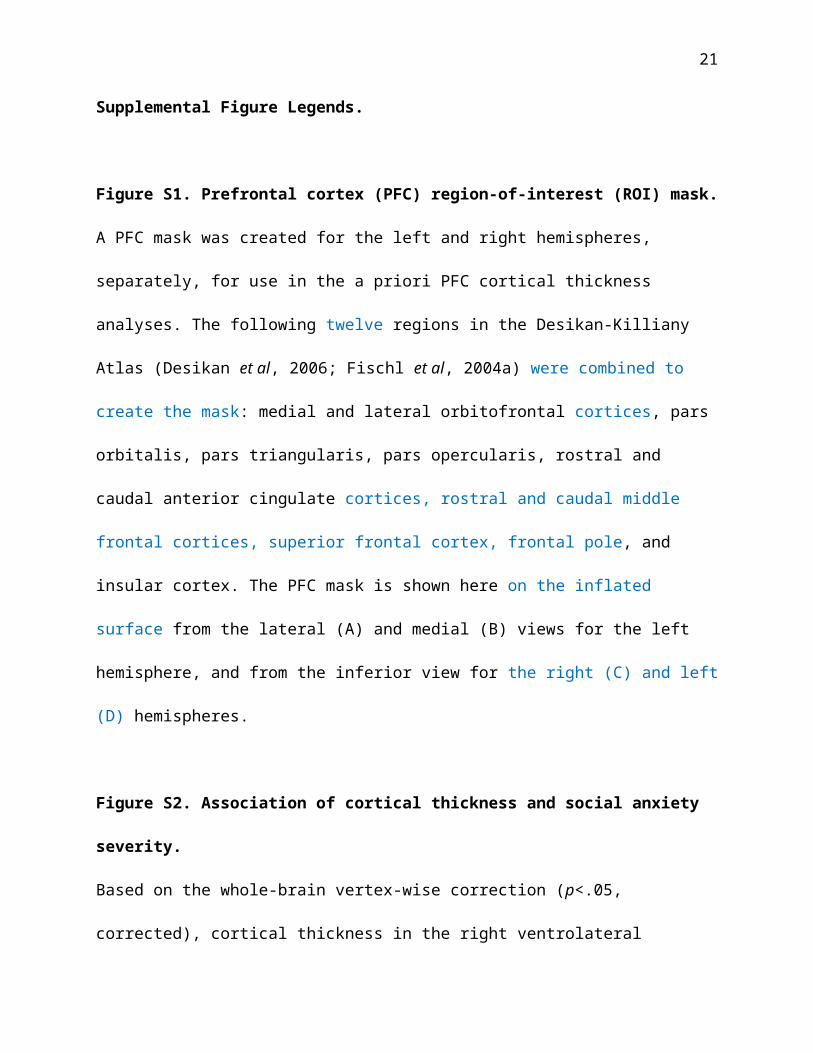
Table S5. Region-of-interest analysis: Associations of anxiety severity with PFC thickness
RegionBootstrapped
95% CI β t p
L caudal ACC -0.19, 0.19 -0.001 -0.01 0.99
R caudal ACC -0.07, 0.27 0.09 0.97 0.33
L caudal middle frontal -0.25, 0.14 -0.06 -0.60 0.55
R caudal middle frontal -0.24, 0.19 -0.03 -0.32 0.75
L lateral OFC -0.20, 0.19 -0.02 -0.20 0.85
R lateral OFC -0.29, 0.09 -0.10 -1.08 0.28
L medial OFC -0.20, 0.19 -0.01 -0.11 0.91
R medial OFC -0.19, 0.17 -0.02 -0.17 0.87
L pars opercularis -0.27, 0.14 -0.06 -0.66 0.51
R pars opercularis -0.30, 0.10 -0.09 -0.98 0.33
L pars orbitalis -0.24, 0.16 -0.05 -0.51 0.61
R pars orbitalis -0.14, 0.20 0.02 0.17 0.87
L pars triangularis -0.28, 0.10 -0.09 -0.97 0.34
R pars triangularis -0.30, 0.08 -0.10 -1.08 0.28
L rostral ACC -0.19, 0.15 -0.01 -0.14 0.89
R rostral ACC -0.13, 0.21 0.04 0.37 0.72
L rostral middle frontal -0.25, 0.13 -0.06 -0.66 0.51
R rostral middle frontal -0.30, 0.08 -0.13 -1.31 0.19
L superior frontal -0.19, 0.20 0.01 0.13 0.90
R superior frontal -0.21, 0.17 -0.01 -0.14 0.89
L frontal pole -0.29, 0.12 -0.08 -0.86 0.39
R frontal pole -0.36, 0.002 -0.18 -1.84 0.07
L insula -0.14, 0.23 0.03 0.36 0.72
R insula -0.10, 0.27 0.07 0.77 0.44
21