Embed Size (px)
Citation preview
Mediating effect of tourists’emotional involvement on the
relationship between destinationattributes and tourist satisfaction
Chhanda BiswasSchool of Tourism, Hospitality and Event Management, Universiti Utara Malaysia,
Sintok, Malaysia
Santus Kumar DebTourism and Hospitality Management, Faculty of Business Studies,
University of Dhaka, Dhaka, Bangladesh
Abdulla Al-Towfiq HasanDepartment ofMarketing, Patuakhali Science andTechnologyUniversity, Patuakhali,
Bangladesh, and
Md. Shariful Alam KhandakarTourism and Hospitality Management, Faculty of Business Studies,
University of Dhaka, Dhaka, Bangladesh
Abstract
Purpose – The study aims to examine the relationship between destination attributes and tourist satisfactionas well as the extent to which emotional involvement mediates between destination attributes and touristsatisfaction.Design/methodology/approach – Data were collected from a sample of 600 domestic tourists by usinga purposive sampling technique where 382 samples were useable, and the response rate was 63.67%.The structural equation modeling (SmartPLS 3.0.) was used to test the hypothesized relationship amongvariables.Findings – Among the 16 hypothesized paths, 13 were supported. Destination attributes (accommodation,attraction, food and beverages and transportation) except safety significantly influence tourist satisfaction;herein accommodation has the greatest effect on tourist satisfaction. Similarly, destination attributes exceptsafety significantly influence tourists’ emotional involvement. This study also reveals that tourists’ emotionalinvolvement partially mediates in the link between destination attributes except for safety and customersatisfaction.Research limitations/implications – The results of the study will assist the hospitality researchers andmanagers to understand the roles of destination attributes and emotional involvement on tourist satisfaction inthe tourism industry.Originality/value –The study is the first to explore themediating relationship in the link between destinationattributes and tourist satisfaction in the tourism industry.
Keywords Destination attributes, Perception, Emotional involvement, Tourist satisfaction
Paper type Research paper
1. IntroductionA place with a combination of attributes that meets tourists’ wants, desires and ultimatelyaffects their satisfaction level is called a tourist destination (Chahal and Devi, 2015). A touristdestination is regarded as central to tourism because destination attributes involvingaccommodation, transportation, attractions, amenities and other facilities reflect tourists’overall satisfaction (Jani et al., 2009). Hence, the standard and performance of thesedestination attributes are crucial to ensure tourist satisfaction. Pestana et al. (2019) mentioned
The effect oftourist
emotionalinvolvement
The current issue and full text archive of this journal is available on Emerald Insight at:
https://www.emerald.com/insight/2514-9792.htm
Received 9 May 2020Revised 20 June 2020
16 July 2020Accepted 16 July 2020
Journal of Hospitality and TourismInsights
© Emerald Publishing Limited2514-9792
DOI 10.1108/JHTI-05-2020-0075
that satisfaction is the emotional state of tourists once they expose their experience ondestination attributes.
In the service industry, consumers evaluate the performance of products or servicescognitively and affectively that influences their satisfaction level (Swan and Combs, 1976).Similarly, in the tourism industry, tourists evaluate destination attribute performance thatmay eventually evoke emotions and satisfaction as responses. Hence, Jing and Rashid (2018)depicted a series of steps of the process of tourist responses’ evaluation involving:(1) cognitive appraisal and (2) emotional response framework. In this way, Patwary andRashid (2016) showed the positive impact of destination attribute performance on touristemotions in their study. In addition, Tlili and Amara (2016) showed a significant impact oftourists’ emotional involvement in their satisfaction level.
However, several authors measured tourist satisfaction in their studies by focussing onthe comparison of tourist experience and expectation (Tribe and Snaith, 1998), service quality(Parasuraman et al., 1988), product/service performance (Tse and Wilton, 1988) andperception of destination attributes (Jayasinghe et al., 2015; Ragavan et al., 2014). Therefore,past investigations likewise uncovered that there is a noteworthy impact of the destinationattribute performance on the visitors’ positive or negative emotions (Jing and Rashid, 2018;Sthapit et al., 2017; Han et al., 2010; Lee, 2014). But very few literature studies have shown theeffects of destination attribute performance on tourists’ emotional involvement andeventually their satisfaction level.
Hence, this paper expects to exactly test the intellectual and full of feeling postvisitexperience evaluation for estimating visitor satisfaction on account of Bangladesh. Theprocedure includes surveying vacationers’ apparent destination quality executionassessment for understanding their emotional engagement with the goal that visitorsatisfaction level can be resolved. In doing as such, a far-reaching survey of the writing hasbeen completed to build up a conceptual framework for this present investigation. The modelis in this way tried to survey the impact of destination attributes on visitors’ emotionalinvolvement and afterwards, on their overall satisfaction level.
2. Literature review2.1 Destination attribute performance and tourist satisfactionThe literature suggests that tourists’ evaluation regarding their travelling experience startsfrom the cognitive evaluation of tourists encounter with the various destinations’ attributes(Sharma and Nayak, 2019). Hence, destination management organizations (DMOs) becomemore concerned to provide and maintain attributes accordingly to the tourists, so that theycan make their tour more memorable (Jing and Rashid, 2018). In addition, the standardperformance of destination attributes can attract more tourists that can ensure theirsatisfaction (Sangpikul, 2018; Dmitrovic et al., 2009). Previously, numerous authors havedistinguished a few destinations attributes that can be commonly arranged into items andservices.
May-Chiun et al. (2013), for example, categorized the destination attributes into fourdimensions which include cultural/heritage, social, economic and environmental attributes.Guzel (2017) identified some attributes as the pull factors for attracting and satisfyingtourists. Sukiman et al. (2013) and Sangpikul (2018) found the relationship between travelexperience and tourist satisfaction. Moreover, Ragavan et al. (2014) and Valduga et al. (2019)determined tourist perception and satisfaction towards a tourist destination by assessingnumerous destination attributes involving accommodations and foods, attractions, climateand image, products, accessibility, culture, communities and price
But Vengesayi et al. (2010) argued andmentioned that destination relies on attractiveness.The authors, thus, focused on natural and historical beauty, environment, resources and
JHTI
other attractions that are major components of a tourist destination. Similarly, Ghosh andSofique (2012) mentioned that cultural/heritage attractions are called an important part of thetourism product. On the other side, Tasci and Boylu (2010) emphasized on the safety issueduring tourist travelling to measure tourist satisfaction. Supporting this statement, ManuiandWongsai (2017) investigated that international tourists’ feeling about safety and securitywhile visiting the island. Furthermore, Lee (2015) identified the core of destination attributesdesigned to fulfil the desires of the tourists and consequently measured tourist satisfaction.These core attributes include accommodation, accessibility, attractions, restaurants andsafety.
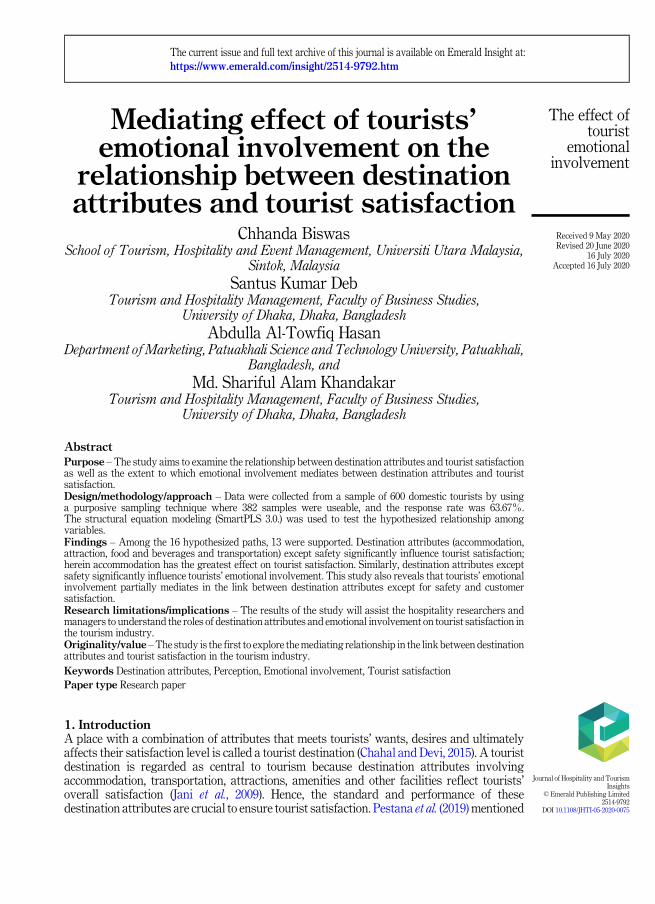
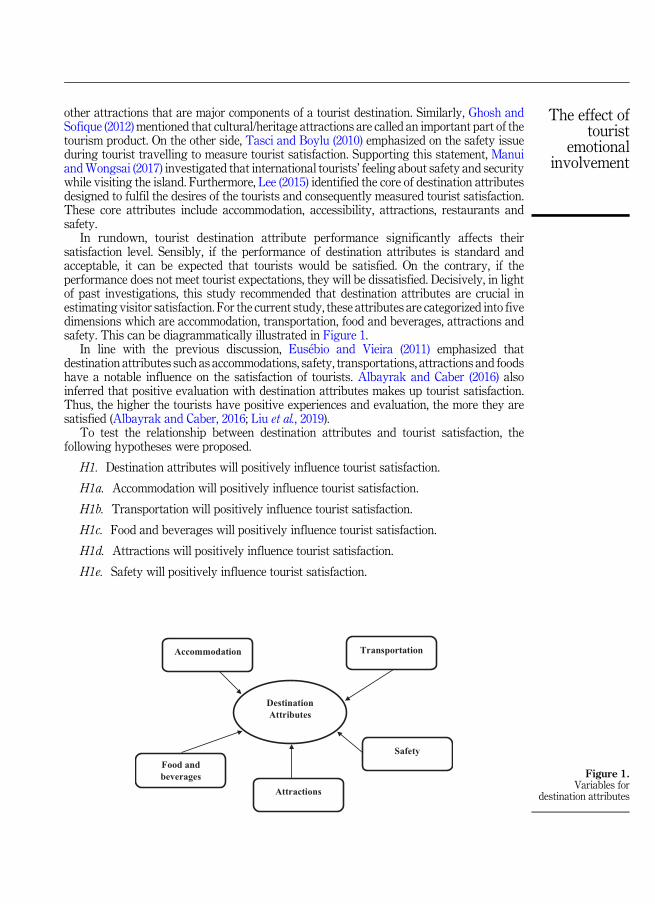
In rundown, tourist destination attribute performance significantly affects theirsatisfaction level. Sensibly, if the performance of destination attributes is standard andacceptable, it can be expected that tourists would be satisfied. On the contrary, if theperformance does not meet tourist expectations, they will be dissatisfied. Decisively, in lightof past investigations, this study recommended that destination attributes are crucial inestimating visitor satisfaction. For the current study, these attributes are categorized into fivedimensions which are accommodation, transportation, food and beverages, attractions andsafety. This can be diagrammatically illustrated in Figure 1.
In line with the previous discussion, Eus�ebio and Vieira (2011) emphasized thatdestination attributes such as accommodations, safety, transportations, attractions and foodshave a notable influence on the satisfaction of tourists. Albayrak and Caber (2016) alsoinferred that positive evaluation with destination attributes makes up tourist satisfaction.Thus, the higher the tourists have positive experiences and evaluation, the more they aresatisfied (Albayrak and Caber, 2016; Liu et al., 2019).
To test the relationship between destination attributes and tourist satisfaction, thefollowing hypotheses were proposed.
H1. Destination attributes will positively influence tourist satisfaction.
H1a. Accommodation will positively influence tourist satisfaction.
H1b. Transportation will positively influence tourist satisfaction.
H1c. Food and beverages will positively influence tourist satisfaction.
H1d. Attractions will positively influence tourist satisfaction.
H1e. Safety will positively influence tourist satisfaction.
Destination Attributes
Accommodation Transportation
Food and beverages
Attractions
Safety
Figure 1.Variables for
destination attributes
The effect oftourist
emotionalinvolvement
2.2 Destination attributes and emotional involvementConsumers’ emotional involvement generally occurs right after consumption and beforecustomer satisfaction judgements (Sthapit et al., 2017). Consumption emotions or utilizationfeelings that are known as the full of feeling or enthusiastic reactions are inspired explicitlyduring an item’s use or after utilization. Utilization feelings, for the most part, comprisedifferent feelings and can be conceptualized as discrete feelings including interest, euphoria,misery, dread, scorn, disgrace, blame, appal, outrage and shock. These are clarified aspositive and negative feelings (Sharma and Nayak, 2019).
Jing and Rashid (2018) analyzed positive and negative consumption emotions andreferenced in their study that travellers’ emotional reactions are firmly connected with thepost-consumption periods of experiences with the destination attribute performance. Theresearchers built up a theoretical structure for surveying the impacts of destination attributeperformance (intellectual) on passionate reactions (full of feeling). The investigation wasrecognized as six components to measure destination attribute performance. Theseincorporate attractions, activities, service and friendliness, nearby culture and perceivedtrip esteem. The outcomes demonstrated that activities, service and hospitality and facilitiesare significantly influential for indicating negative emotions. On the other side, attractions,local culture and trip value predict positive emotions (Jing and Rashid, 2018).
Apart from these, prior studies focused on tourists’ positive or negative emotionsassociated with different destination attributes. Han et al. (2010) investigated theconsumption of emotional states in a full-service restaurant. The study findingsdemonstrated that knowing consumption emotions with these four dimensions involvingexcitement, comfort, annoyance and romance are important for a full-service restaurantsetting. Sthapit et al. (2017) examined tourists’ emotions which are elicited by local foodconsumption. Several authors also explained the relationship of destination attractions withtourists’ emotional responses. Grappi and Montanari (2011) focused on festivals and eventsof the tourist destination to identify tourists’ positive or negative emotions. The studyresults showed negative emotions because of staff behaviour whereas positive emotionshappened in the case of locations, atmosphere, hotels, restaurant offers and souvenirs.Moreover, Lee (2014) investigated visitors’ emotional responses for the festival environment,and results revealed that festival atmospherics had a positive indirect effect on the positiveemotion.
Prayag et al. (2013) explored tourists’ emotional responses in the heritage sites. Faullantet al. (2011) identified tourists’ emotions on their mountaineering experience. In addition,many authors previously examined tourists’ emotional responses towards holidaydestinations including Liu et al. (2019), Sharma and Nayak (2019), Hosany and Prayag(2013), Lin et al. (2014), Su et al. (2018). Eventually, it is expressed that tourists’ emotionalreaction creates particular kinds of feelings which are called consumption emotion (Ma et al.(2018)). This consumption emotion is the outcome of the cognitive evaluation of destinationattributes. Thus, it can be said that destination attribute performance can induce emotionsthat influence consumer responses (Jing and Rashid, 2018). These consumers’ responses mayinclude their satisfaction level. For this reason, researching tourists’ emotional involvementwith the destination attribute performance has become important for examining touristsatisfaction. Therefore, it was postulated that
H2. Destination attributes will positively affect tourists’ emotional involvement.
H2a. Accommodation will positively affect tourists’ emotional involvement.
H2b. Transportation will positively affect tourists’ emotional involvement.
H2c. Food and beverages will positively affect tourists’ emotional involvement.
JHTI
H2d. Attractions will positively affect tourists’ emotional involvement.
H2e. Safety will positively affect tourists’ emotional involvement.
2.3 Emotional involvement and tourist satisfactionAdestination is a complex and integrated service portfolio. It is muchmore than a geographiclocation. A destination is considered an amalgam of products and services that providepositive or negative emotions to tourists. For this reason, tourists’ emotions have been takeninto account in examining tourist satisfaction. Xu et al. (2019) explored the role of positive andnegative emotions in examining tourist satisfaction from the context of tourists’ visits tomuseums and tourist destinations. Tlili and Amara (2016) suggested a conceptual structurethat implied positive emotions during the travelling process, while negative emotions wouldminimize satisfaction.
Similarly, Liu (2016) found that tourist dissatisfaction at a destination or an attraction isaffected by the tourists’ negative emotions that in turn create tourists’ complaints, switch andnegative word-of-mouth (WOM) communication. Thus, tourists’ positive emotions have asignificant impact on tourist satisfaction, and the negative emotion has a direct impact on thesearch for alternatives. For this reason,HosanyandPrayag (2013) focused on tourists’ emotionalassociations towards destinations for post-consumption evaluation of satisfaction. The authorsmeasured tourist satisfaction/dissatisfaction with four emotional dimensions such as joy, love,positive surprise and unpleasantness. The result demonstrated that emotional responses arepowerful indicators of satisfaction. Because of the higher level of pleasantness shows anincreased level of satisfaction. The findings further revealed that joy and surprise generate theemotion of delight that in turn contributes to satisfying tourists (Hosany and Prayag, 2013).
Ma et al. (2018) underlined on tourist consumption emotion to identify visitors’satisfaction. The paper was directed with the recognizable proof of positive emotionalmeasurements, for example excitement, happiness and relaxation, and negative emotionaldimensions including irate, exhausted and irritated. It was eventually discovered thatvisitors’ emotional responses positively affect their satisfaction (Ma et al. (2018)).Furthermore, the emotional involvement of tourists with destination attributes ispositively correlated with tourist satisfaction (Prayag and Ryan, 2012). Prayag et al. (2013)also indicated that the more the tourists have positive emotional involvement, the more thetourists are satisfied. Consequently, it was hypothesized that
H3. Tourists’ emotional involvement will positively affect tourist satisfaction.
2.4 Mediating effect of tourists’ emotional involvementYao (2013) demonstrated the mediating effects of tourists’ emotional involvement with thedestination to assess the association between tourist motivation and satisfaction. The studywas conducted from the cognitive and affective dimensions to measure tourist satisfaction.Tourists’ emotional involvement is considered the affective dimension, as well as destinationattributes are considered as the cognitive dimension. These two types of dimensions wereused as mediators to measure tourist satisfaction (Yao, 2013). After the above discussions, ittends to be said that the affective measurement has become a significant research zoneidentified with the post-consumption assessment of satisfaction (Liu, 2016; Prayag and Ryan,2012; Xu et al., 2019; Prayag et al., 2013).
In linewith the previous discussion, Liu (2016) argued that destination attributes influencetourist’s emotions of memory, attention and reasoning that eventually lead to satisfaction.Conversely, Xu et al. (2019) noted that destination attributes have no direct effects on touristsatisfaction. Hence, destination attributes make tourists emotionally attached, and thentourists gradually become satisfied (Xu et al., 2019). Hence, it was postulated that
The effect oftourist
emotionalinvolvement
H4. Tourists’ emotional involvement will mediate the relationship between destinationattributes and tourist satisfaction.
H4a. Tourists’ emotional involvement will mediate the relationship betweenaccommodation and tourist satisfaction.
H4b. Tourists’ emotional involvement will mediate the relationship betweentransportation and tourist satisfaction.
H4c. Tourists’ emotional involvement will mediate the relationship between food andbeverages and tourist satisfaction.
H4d. Tourists’ emotional involvement will mediate the relationship between attractionsand tourist satisfaction.
H4e. Tourists’ emotional involvement will mediate the relationship between safety andtourist satisfaction.
2.5 Theoretical considerationOliva et al. (1995) described and tested three key constructs involving product attributeperformance, product involvement and customer overall satisfaction or dissatisfaction.The study found that high-involvement products with minor output improvements hadno impact on consumer satisfaction compared to low-involvement products. The authorsmostly portrayed that the impacts of high involvement can keep up the conditions ofpost-choice assessment (satisfaction or disappointment) over a wide scope of serviceattribute performance (Oliva et al., 1995). According to Ghafelehbashi et al. (2011),involvement can be defined as the mental feeling of an individual about affection,importance and personal dependency or about a conception or a subject or activity orperformance.
Regarding these product attribute performance, involvement and customer satisfactionissue, the cognitive–affective approach was proposed by Oliver (1993). This approachindicated that both types of involvement, namely cognitive involvement and affectiveinvolvement, can be used for assessing customer satisfaction information. Cognitiveinvolvement is an evaluation of the entity that constitutes people’s opinion about an object(Chowdhury and Salam, 2015). On the other side, affect is described as the internal emotionalstate of people, and affective involvement is emotional involvement with affective factors(Caro and Garc�ıa, 2007).
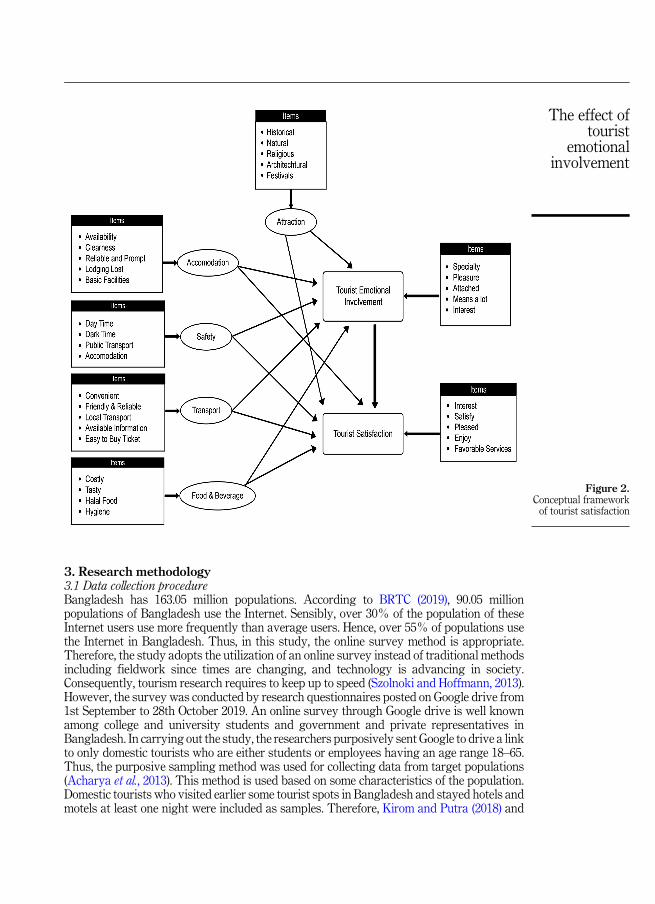
The cognitive–affective approach states that what one knows and thinks about an objectis called cognitive whereas how one feels about objects is called affective (Agapito et al.,2013). This cognitive–affective approach has been acknowledged in the literature forattaining satisfaction information. Oliver (1993) suggested that not just subjectiveassessment from client desire, disconfirmation and execution yet additionally affectiveassessment from positive or negative emotions can assume a significant role in decidingconsumer satisfaction. Hence, Yao (2013) claimed that cognition and affect influence travelsatisfaction simultaneously. In this way, the cognitive–affective approach has becomepopular in the tourism literature (Agapito et al., 2013; Yao, 2013; Bosque and Martı�n, 2008;Jing and Rashid, 2018); (San Mart�ın et al., 2019). Ultimately, it is considered that cognitive isthe evaluation of the destination attributes that tourists gather after visiting a destination(Yao, 2013). Affect represents the emotions that tourists can attain from the destinationattributes performance (Jing and Rashid, 2018). Bringing this concept, the current study willbe conducted with the cognition and affect derived from the destination attributesperformance and tourists’ emotional involvement for determining tourists’ satisfaction level(see Figure 2).
JHTI
3. Research methodology3.1 Data collection procedureBangladesh has 163.05 million populations. According to BRTC (2019), 90.05 millionpopulations of Bangladesh use the Internet. Sensibly, over 30% of the population of theseInternet users use more frequently than average users. Hence, over 55% of populations usethe Internet in Bangladesh. Thus, in this study, the online survey method is appropriate.Therefore, the study adopts the utilization of an online survey instead of traditional methodsincluding fieldwork since times are changing, and technology is advancing in society.Consequently, tourism research requires to keep up to speed (Szolnoki and Hoffmann, 2013).However, the survey was conducted by research questionnaires posted on Google drive from1st September to 28th October 2019. An online survey through Google drive is well knownamong college and university students and government and private representatives inBangladesh. In carrying out the study, the researchers purposively sent Google to drive a linkto only domestic tourists who are either students or employees having an age range 18–65.Thus, the purposive sampling method was used for collecting data from target populations(Acharya et al., 2013). This method is used based on some characteristics of the population.Domestic tourists who visited earlier some tourist spots in Bangladesh and stayed hotels andmotels at least one night were included as samples. Therefore, Kirom and Putra (2018) and
Figure 2.Conceptual frameworkof tourist satisfaction
The effect oftourist
emotionalinvolvement
Bhat and Darzi (2018) collected data adopting the purposive sampling method for measuringtourist satisfaction.
However, 600 questionnaires were distributed, and the amount of total valid surveyreturns was 489. Among the participants, 403 had visited any tourist destination at least oncein a life but the rest had not. Therefore, there were above 15% missing data. According toLamb et al. (2014), if exploring the dataset and 15% or a greater amount of the observation ismissing, it ought to be removed, yet if just 5%or less is absent from the dataset, at that point itought to be kept and mean replacement ought to be utilized. However, 382 participants hadanswered all questions properly but rest had not. In total, 382 participants are consideredappropriate sample sizes for representing population because Roscoe (1975) suggested that30–500 can be an appropriate sample size for conducting research work. McQuitty (2004)moreover recommended 200–400 sample size. However, among 382 valid respondents, 183were male and 199 were female. Most of the participants were aged in line between 26 and 40(over 65%). According to the report of Bangladesh TourismBoard (2020), citizens aged in linebetween 26 and 55 are the main domestic tourists in the last decade. In addition, the resultsfound that a single factor is extracting 32.517% of the total variance since it is far less than50% (Garger et al., 2019). Hence, it can be concluded that there is no threat of commonmethod bias.
3.2 MeasuresIn previous studies, the studied constructs of measurement scales for this study werevalidated. The present study was conducted by a slight modification of originalquestionnaires developed by several authors to measure all constructs in the context ofBangladesh for predicting tourist destination attributes, emotional involvement andsatisfaction. All items of each construct were measured by a five-point Likert scale from“strongly disagree” to “strongly agree”. All items which were used for collecting data areprovided in the below table.
4. Data analysis and interpretationThe study uses 382 respondents; among them, 39.30% of respondents has travelled by anagency, and 60.70% of respondents has travelled independently. However, the demographicfeatures are presented in Table 1.
4.1 Measurement modelResearchers followed two approaches developed by Kline (2015) to conduct Structuralequation modeling (SEM) data analysis and to propose a theoretical model throughverification of fitness of collected data by using the Smart PLS 3.0 software package. First, theadequacy and quality of the measurement model were tested by conducting confirmatoryfactor analysis (CFA) to ensure constructs’ reliability, discriminant validity and convergentvalidity of this study. Second, the SEM was adopted to test the hypotheses to make out thecasual relationships among the latent variables of the study. However, Figure 3 shows that allthe values of the studied constructs’ factor loadings are from 0.743 to 0.919. This indicatesthat all constructs’ factor loadings are greater than 0.7 because Jobson (2012) indicated thatfactor loading greater than 0.7 is reliable to measure indices.
Themost commonmethod of testing the internal consistency among the indicators of eachconstruct is to compute the Cronbach’s alpha of each construct (Dunn et al., 2014). Accordingto Cronbach (1951), when Cronbach’s alpha results show that the value is greater than 0.7, itimplies that measurement scales have high internal consistency. Table 2 shows that thevalues of Cronbach’s alpha of studied constructs are from 0.838 to 0.912. This means that
JHTI
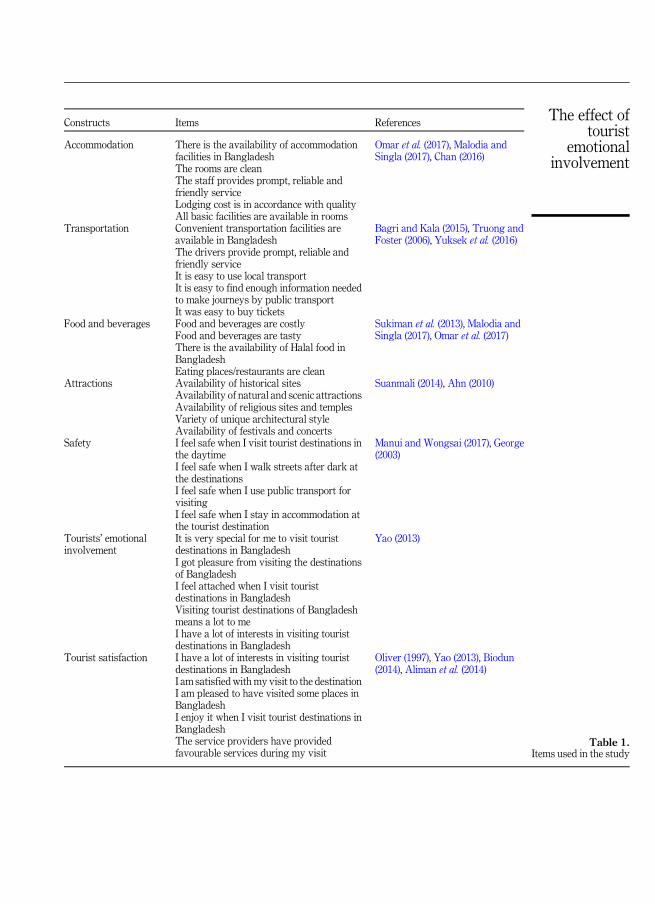
Constructs Items References
Accommodation There is the availability of accommodationfacilities in Bangladesh
Omar et al. (2017), Malodia andSingla (2017), Chan (2016)
The rooms are cleanThe staff provides prompt, reliable andfriendly serviceLodging cost is in accordance with qualityAll basic facilities are available in rooms
Transportation Convenient transportation facilities areavailable in Bangladesh
Bagri and Kala (2015), Truong andFoster (2006), Yuksek et al. (2016)
The drivers provide prompt, reliable andfriendly serviceIt is easy to use local transportIt is easy to find enough information neededto make journeys by public transportIt was easy to buy tickets
Food and beverages Food and beverages are costly Sukiman et al. (2013), Malodia andSingla (2017), Omar et al. (2017)Food and beverages are tasty
There is the availability of Halal food inBangladeshEating places/restaurants are clean
Attractions Availability of historical sites Suanmali (2014), Ahn (2010)Availability of natural and scenic attractionsAvailability of religious sites and templesVariety of unique architectural styleAvailability of festivals and concerts
Safety I feel safe when I visit tourist destinations inthe daytime
Manui and Wongsai (2017), George(2003)
I feel safe when I walk streets after dark atthe destinationsI feel safe when I use public transport forvisitingI feel safe when I stay in accommodation atthe tourist destination
Tourists’ emotionalinvolvement
It is very special for me to visit touristdestinations in Bangladesh
Yao (2013)
I got pleasure from visiting the destinationsof BangladeshI feel attached when I visit touristdestinations in BangladeshVisiting tourist destinations of Bangladeshmeans a lot to meI have a lot of interests in visiting touristdestinations in Bangladesh
Tourist satisfaction I have a lot of interests in visiting touristdestinations in Bangladesh
Oliver (1997), Yao (2013), Biodun(2014), Aliman et al. (2014)
I am satisfiedwithmy visit to the destinationI am pleased to have visited some places inBangladeshI enjoy it when I visit tourist destinations inBangladeshThe service providers have providedfavourable services during my visit
Table 1.Items used in the study
The effect oftourist
emotionalinvolvement
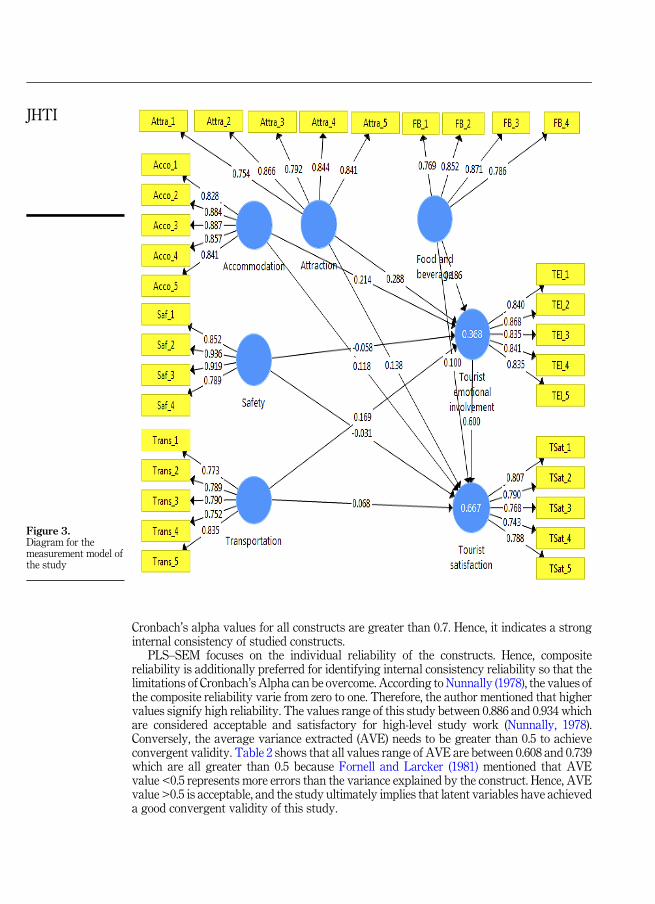
Cronbach’s alpha values for all constructs are greater than 0.7. Hence, it indicates a stronginternal consistency of studied constructs.
PLS–SEM focuses on the individual reliability of the constructs. Hence, compositereliability is additionally preferred for identifying internal consistency reliability so that thelimitations of Cronbach’s Alpha can be overcome. According to Nunnally (1978), the values ofthe composite reliability varie from zero to one. Therefore, the author mentioned that highervalues signify high reliability. The values range of this study between 0.886 and 0.934 whichare considered acceptable and satisfactory for high-level study work (Nunnally, 1978).Conversely, the average variance extracted (AVE) needs to be greater than 0.5 to achieveconvergent validity. Table 2 shows that all values range of AVE are between 0.608 and 0.739which are all greater than 0.5 because Fornell and Larcker (1981) mentioned that AVEvalue <0.5 represents more errors than the variance explained by the construct. Hence, AVEvalue >0.5 is acceptable, and the study ultimately implies that latent variables have achieveda good convergent validity of this study.
Figure 3.Diagram for themeasurement model ofthe study
JHTI
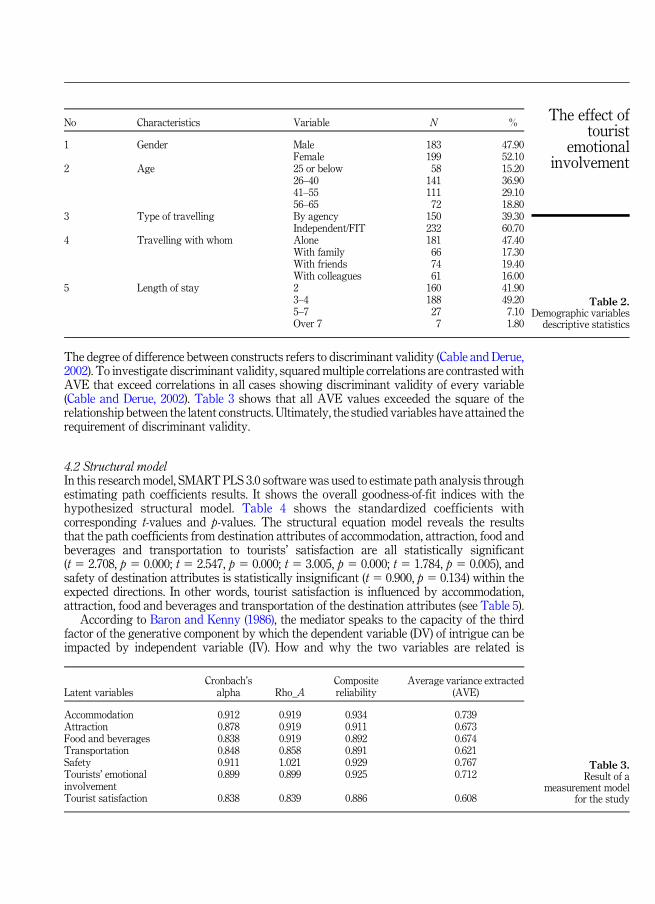
The degree of difference between constructs refers to discriminant validity (Cable and Derue,2002). To investigate discriminant validity, squaredmultiple correlations are contrasted withAVE that exceed correlations in all cases showing discriminant validity of every variable(Cable and Derue, 2002). Table 3 shows that all AVE values exceeded the square of therelationship between the latent constructs. Ultimately, the studied variables have attained therequirement of discriminant validity.
4.2 Structural modelIn this researchmodel, SMART PLS 3.0 software was used to estimate path analysis throughestimating path coefficients results. It shows the overall goodness-of-fit indices with thehypothesized structural model. Table 4 shows the standardized coefficients withcorresponding t-values and p-values. The structural equation model reveals the resultsthat the path coefficients from destination attributes of accommodation, attraction, food andbeverages and transportation to tourists’ satisfaction are all statistically significant(t 5 2.708, p 5 0.000; t 5 2.547, p 5 0.000; t 5 3.005, p 5 0.000; t 5 1.784, p 5 0.005), andsafety of destination attributes is statistically insignificant (t 5 0.900, p 5 0.134) within theexpected directions. In other words, tourist satisfaction is influenced by accommodation,attraction, food and beverages and transportation of the destination attributes (see Table 5).
According to Baron and Kenny (1986), the mediator speaks to the capacity of the thirdfactor of the generative component by which the dependent variable (DV) of intrigue can beimpacted by independent variable (IV). How and why the two variables are related is
No Characteristics Variable N %
1 Gender Male 183 47.90Female 199 52.10
2 Age 25 or below 58 15.2026–40 141 36.9041–55 111 29.1056–65 72 18.80
3 Type of travelling By agency 150 39.30Independent/FIT 232 60.70
4 Travelling with whom Alone 181 47.40With family 66 17.30With friends 74 19.40With colleagues 61 16.00
5 Length of stay 2 160 41.903–4 188 49.205–7 27 7.10Over 7 7 1.80
Latent variablesCronbach’s
alpha Rho_ACompositereliability
Average variance extracted(AVE)
Accommodation 0.912 0.919 0.934 0.739Attraction 0.878 0.919 0.911 0.673Food and beverages 0.838 0.919 0.892 0.674Transportation 0.848 0.858 0.891 0.621Safety 0.911 1.021 0.929 0.767Tourists’ emotionalinvolvement
0.899 0.899 0.925 0.712
Tourist satisfaction 0.838 0.839 0.886 0.608
Table 2.Demographic variables
descriptive statistics
Table 3.Result of a
measurement modelfor the study
The effect oftourist
emotionalinvolvement
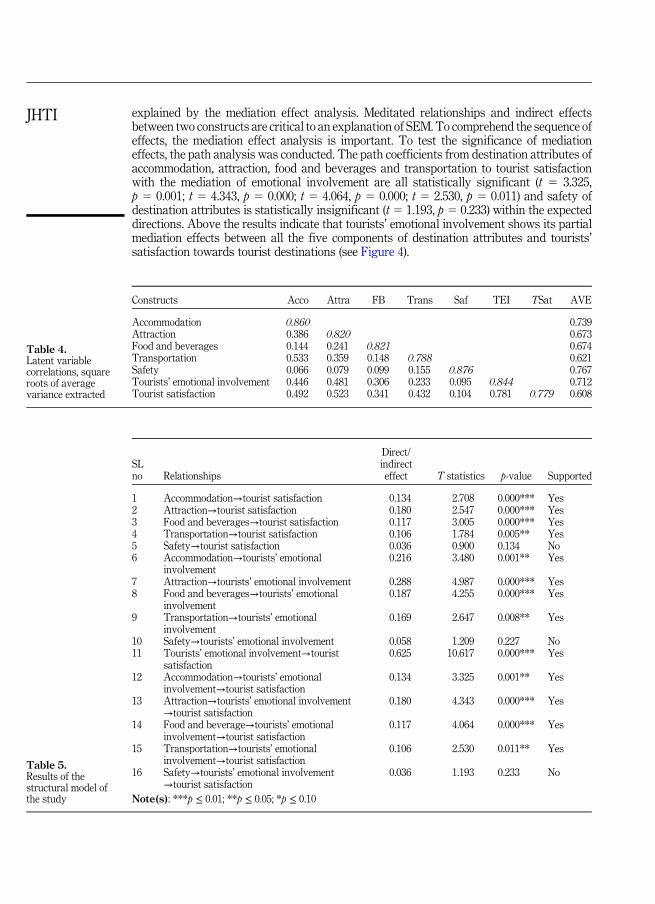
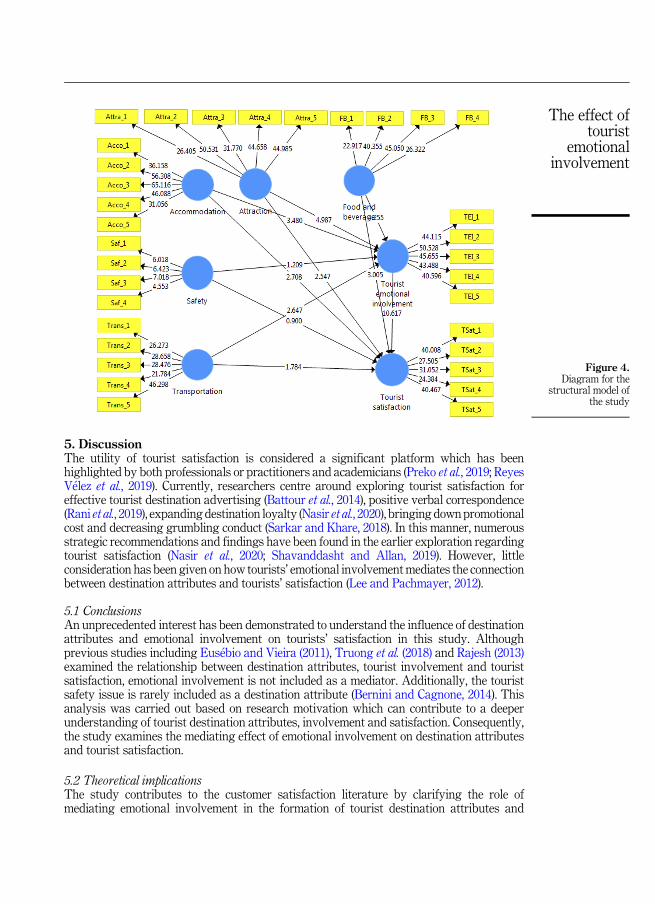
explained by the mediation effect analysis. Meditated relationships and indirect effectsbetween two constructs are critical to an explanation of SEM. To comprehend the sequence ofeffects, the mediation effect analysis is important. To test the significance of mediationeffects, the path analysis was conducted. The path coefficients from destination attributes ofaccommodation, attraction, food and beverages and transportation to tourist satisfactionwith the mediation of emotional involvement are all statistically significant (t 5 3.325,p 5 0.001; t 5 4.343, p 5 0.000; t 5 4.064, p 5 0.000; t 5 2.530, p 5 0.011) and safety ofdestination attributes is statistically insignificant (t 5 1.193, p 5 0.233) within the expecteddirections. Above the results indicate that tourists’ emotional involvement shows its partialmediation effects between all the five components of destination attributes and tourists’satisfaction towards tourist destinations (see Figure 4).
SLno Relationships
Direct/indirecteffect T statistics p-value Supported
1 Accommodation→tourist satisfaction 0.134 2.708 0.000*** Yes2 Attraction→tourist satisfaction 0.180 2.547 0.000*** Yes3 Food and beverages→tourist satisfaction 0.117 3.005 0.000*** Yes4 Transportation→tourist satisfaction 0.106 1.784 0.005** Yes5 Safety→tourist satisfaction �0.036 0.900 0.134 No6 Accommodation→tourists’ emotional
involvement0.216 3.480 0.001** Yes
7 Attraction→tourists’ emotional involvement 0.288 4.987 0.000*** Yes8 Food and beverages→tourists’ emotional
involvement0.187 4.255 0.000*** Yes
9 Transportation→tourists’ emotionalinvolvement
0.169 2.647 0.008** Yes
10 Safety→tourists’ emotional involvement �0.058 1.209 0.227 No11 Tourists’ emotional involvement→tourist
satisfaction0.625 10.617 0.000*** Yes
12 Accommodation→tourists’ emotionalinvolvement→tourist satisfaction
0.134 3.325 0.001** Yes
13 Attraction→tourists’ emotional involvement→tourist satisfaction
0.180 4.343 0.000*** Yes
14 Food and beverage→tourists’ emotionalinvolvement→tourist satisfaction
0.117 4.064 0.000*** Yes
15 Transportation→tourists’ emotionalinvolvement→tourist satisfaction
0.106 2.530 0.011** Yes
16 Safety→tourists’ emotional involvement→tourist satisfaction
�0.036 1.193 0.233 No
Note(s): ***p ≤ 0.01; **p ≤ 0.05; *p ≤ 0.10
Constructs Acco Attra FB Trans Saf TEI TSat AVE
Accommodation 0.860 0.739Attraction 0.386 0.820 0.673Food and beverages 0.144 0.241 0.821 0.674Transportation 0.533 0.359 0.148 0.788 0.621Safety 0.066 0.079 0.099 0.155 0.876 0.767Tourists’ emotional involvement 0.446 0.481 0.306 0.233 0.095 0.844 0.712Tourist satisfaction 0.492 0.523 0.341 0.432 0.104 0.781 0.779 0.608
Table 5.Results of thestructural model ofthe study
Table 4.Latent variablecorrelations, squareroots of averagevariance extracted
JHTI
5. DiscussionThe utility of tourist satisfaction is considered a significant platform which has beenhighlighted by both professionals or practitioners and academicians (Preko et al., 2019; ReyesV�elez et al., 2019). Currently, researchers centre around exploring tourist satisfaction foreffective tourist destination advertising (Battour et al., 2014), positive verbal correspondence(Rani et al., 2019), expanding destination loyalty (Nasir et al., 2020), bringing downpromotionalcost and decreasing grumbling conduct (Sarkar and Khare, 2018). In this manner, numerousstrategic recommendations and findings have been found in the earlier exploration regardingtourist satisfaction (Nasir et al., 2020; Shavanddasht and Allan, 2019). However, littleconsideration has been given on how tourists’ emotional involvementmediates the connectionbetween destination attributes and tourists’ satisfaction (Lee and Pachmayer, 2012).
5.1 ConclusionsAn unprecedented interest has been demonstrated to understand the influence of destinationattributes and emotional involvement on tourists’ satisfaction in this study. Althoughprevious studies including Eus�ebio and Vieira (2011), Truong et al. (2018) and Rajesh (2013)examined the relationship between destination attributes, tourist involvement and touristsatisfaction, emotional involvement is not included as a mediator. Additionally, the touristsafety issue is rarely included as a destination attribute (Bernini and Cagnone, 2014). Thisanalysis was carried out based on research motivation which can contribute to a deeperunderstanding of tourist destination attributes, involvement and satisfaction. Consequently,the study examines the mediating effect of emotional involvement on destination attributesand tourist satisfaction.
5.2 Theoretical implicationsThe study contributes to the customer satisfaction literature by clarifying the role ofmediating emotional involvement in the formation of tourist destination attributes and
Figure 4.Diagram for the
structural model ofthe study
The effect oftourist
emotionalinvolvement
satisfaction relationships. Albeit the earlier literature recommended that destinationattributes can bring about tourist satisfaction or dissatisfaction in the reality (Kwanisaiand Vengesayi, 2016; Ghose and Johann, 2018), it provides little confirmations on howtourists’ emotional involvement affects tourist destination attributes and satisfactionrelationship. The findings underpin the hypothesis made by Lee and Pachmayer (2012) thatthere is a mediating impact of tourist spot attachment on the link between tourist attractionincluding festival and satisfaction. Specifically, the study exerts destination attributes(accommodations, transportation, food and beverages, attraction and safety) to have asignificant positive relationship with tourist satisfaction. The findings are consistent withthe model proposed by Ghose and Johann (2018) and Vareiro et al. (2017) in which destinationattributes and tourist satisfaction are the major antecedents. Moreover, Eus�ebio andVieira (2011) found that destination attributes have a strong association with touristsatisfaction.
On the other hand, the study demonstrates a statistically insignificant relationshipbetween safety and tourist satisfaction. The finding is contrary to Hermawan et al.’s (2019)suggestions that safety is related to tourist satisfaction. Unfortunately, the present studyfound no connection between safety and tourist satisfaction. One potential explanation forthis finding is that as Bangladesh is a developing country, and the tourist safety condition isnot satisfactory. But it possesses attractive sights and scenarios for tourists’ enjoyment.Consequently, tourists may not expect a satisfactory safety condition in Bangladesh. Hence,the study adds to the tourist satisfaction literature in the case of the study outcome of therelationships between destination attributes and tourist satisfaction. This study alsodemonstrates that destination attributes (accommodations, attraction, food and beveragesand transportations) have a significant positive relationship with tourists’ emotionalinvolvement. There are limited previous studies in the tourism literature examining the directrelationship between destination attributes and tourists’ emotional involvement. Hence,Carneiro and Crompton (2010) and Jing and Rashid (2018) showed that destination attributeshave a strong relationship with tourist involvement.
This study additionally examined the relationship between tourists’ emotionalinvolvement and tourist satisfaction and found that there is a strong significantrelationship between these two factors. Rasoolimanesh et al. (2019) and Xu et al. (2019)examined that tourist involvement has a strong influence on tourist satisfaction. Conversely,this study exerts an insignificant relationship between safety and tourists’ emotionalinvolvement. Although the present study finding is contrary to Seabra et al.’s (2014) study, itadditionally adds the existing literature. Moreover, this paper adds to the existing theories inthe context of tourism, marketing as well as hospitality literature. The conceptualframework contributes to the existing cognitive–affective theory by depicting therelationships among destination attributes, tourists’ emotional involvement and touristsatisfaction.
5.3 Practical implicationsApart from the theoretical contributions, the study findings provide important practicalimplications for the destination marketers, who are supposed not only to pay close attentionto tourist’s involvement but also to identify factors that lead to satisfaction. First, destinationmanagers can increase better idea about destination attributes. This study assumes thattourist satisfaction is influenced by accommodations, attraction corners, food and beveragefacilities, transportation facilities and safety. In this study, the statistical results show that allhave a significant effect on tourist satisfaction except safety issue; among them, food andbeverages have the most significant effect on tourist satisfaction. That implies destinationmanagers can focus on those factors (accommodations, attraction, food and beverages andtransportation) which affect tourist satisfaction.
JHTI
Second, the study assists to understand that destination attributes should be in such away that it can increase tourist’s emotional attachment. According to the statistical results ofthis study, accommodations, attraction, food and beverages and transportations have asignificant effect on tourists’ emotional involvement. For this reason, the more theattractiveness of a destination, the more tourists are involved. Finally, based on theaforementioned observations, tourists are found very likely to discuss destination attributeswith each other (Prayag and Ryan, 2012), and this may lead to a higher level of involvementwhich may lead to tourists’ satisfaction.
The statistical results of this study show a significant mediating impact on theconnection between destination attributes and tourist satisfaction except for safety issues.That implies that destination marketers should pay more focus on those attributes whichmay lead to high involvement and high satisfaction. Moreover, destination managers canconsider analyzing big data that can provide a deeper understanding of the tourist’s likesand dislikes in case of destination marketing (Hahm and Severt, 2018). In addition,destination marketers can consider the demographic profile of tourists so that more tailor-made attributes targeting this segment can be introduced. Apart from these, this study isconducted on domestic tourists; thus, it is also beneficial for Bangladesh tourism authoritiesbecause Bangladesh Tourism Board (2020) recorded that the country generated morerevenue from domestic tourists. The total revenue was US$ 357 from tourism in Bangladeshwhereas it made only US$ 97.05 revenue from foreign tourists. Consequently, the study addsa contribution to the practitioners to know the present status of domestic tourism inBangladesh.
5.4 Limitations and future researchAlthough the study can contribute to practitioners and academicians on tourism, it has somelimitations. First, this was a causal study, but a longitudinal field study could better interpretthe causal relationship in our model. Second, familiar domestic visitors and the small samplesize were selected. Hence, the study findingsmight not be appropriate to generalizewith othertourism literature studies. Several directions should be considered in future research such asan experimental study that could be conducted, where the name of different destinationattributes can be presented to visitors and investigate which elicits favourable touristresponses (e.g. emotional involvement and tourist satisfaction). Another direction would be across-sectional study of domestic and international tourists.
References
Acharya, A.S., Anupam, P., Pikee, S. and Aruna, N. (2013), “Sampling: why and how of it?”, IndianJournal of Medical Specialities, Vol. 4 No. 2, pp. 3-7, doi: 10.7713/ijms.2013.0032.
Agapito, D., Valle, P.O.D. and Mendesda, J.C. (2013), “The cognitive-affective-conative model ofdestination image: a confirmatory analysis”, Journal of Travel and Tourism Marketing, Vol. 30No. 5, pp. 471-481, doi: 10.1080/10548408.2013.803393.
Ahn, T. (2010), “An investigation of the impact of symbolic image congruence and functional-imagecongruence on tourists destination choice”, Doctoral dissertation, University of Surrey,Guildford, available at: https://search-proquest-com.eserv.uum.edu.my/docview/1805285279/4B7926837CB7429APQ/59?accountid542599.
Albayrak, T. and Caber, M. (2016), “Destination attribute effects on rock climbing tourist satisfaction:an asymmetric impact-performance analysis”, Tourism Geographies, Vol. 18 No. 3, pp. 280-296,doi: 10.1080/14616688.2016.1172663.
Aliman, N.K., Hashim, S.M., Wahid, S.D.M. and Harudin, S. (2014), “Tourist expectations, perceivedquality and destination image: effects on perceived value and satisfaction of tourists visiting
The effect oftourist
emotionalinvolvement
Langkawi Island, Malaysia”, Asian Journal of Business and Management, Vol. 2 No. 3,pp. 212-222.
Bagri, S.C. and Kala, D. (2015), “Tourists’ satisfaction at, India: an importance-performance analysis”,Advances in Hospitality and Tourism Research, Vol. 3 No. 2, pp. 89-115.
Bangladesh Tourism Board (2020), “Bangladesh tourism board”, Tourist attractions, available at:http://www.tourismboard.gov.bd/ (accessed 17 June 2020).
Baron, R.M. and Kenny, D.A. (1986), “The moderator–mediator variable distinction in socialpsychological research: conceptual, strategic, and statistical considerations”, Journal ofPersonality and Social Psychology, Vol. 51 No. 6, pp. 1173-1182.
Battour, M., Battor, M. and Bhatti, M.A. (2014), “Islamic attributes of destination: constructdevelopment and measurement validation, and their impact on tourist satisfaction”,International Journal of Tourism Research, Vol. 16 No. 6, pp. 556-564, doi: 10.1002/jtr.
Bernini, C. and Cagnone, S. (2014), “Analysing tourist satisfaction at a mature and multi-productdestination”, Current Issues in Tourism, Vol. 17 No. 1, pp. 1-20, doi: 10.1080/13683500.2012.702737.
Bhat, S.A. and Darzi, M.A. (2018), “Antecedents of tourist loyalty to tourist destinations: amediated-moderation study”, International Journal of Tourism Cities, Vol. 4 No. 2, pp. 261-278.doi: 10.1108/IJTC-12-2017-0079.
Biodun, A.B. (2014), “Expectation, perceived quality and satisfaction of nigerian tourist in Malaysia”,Master’s dissertation, Universiti Utara Malaysia, Kedah, available at: http://etd.uum.edu.my/4449/1/s806478.pdf.
Bosque, I.R.D. and Martı�n, H.S. (2008), “Tourist satisfaction: a cognitive-affective model”, Annals ofTourism Research, Vol. 35 No. 2, pp. 551-573, doi: 10.1016/j.annals.2008.02.006.
BRTC (2019), 90.05 Million Internet Users in Bangladesh, DhakaTribune, available at: https://www.dhakatribune.com/technology/2018/09/21/btrc-90-05-million-internet-users-in-bangladesh.
Cable, D.M. and Derue, D.S. (2002), “The convergent and discriminant validity of subjective fitperceptions”, Journal of Applied Psychology, Vol. 87 No. 5, pp. 875-884, doi: 10.1037//0021-9010.87.5.875.
Carneiro, M.J. and Crompton, J.L. (2010), “The influence of involvement, familiarity, and constraints onthe search for information about destinations”, Journal of Travel Research, Vol. 49 No. 4,pp. 451-470, doi: 10.1177/0047287509346798.
Caro, L.M. and Garc�ıa, J.A.M. (2007), “Cognitive-affective model of consumer satisfaction. Anexploratory study within the framework of a sporting event”, Journal of Business Research,Vol. 60 No. 2, pp. 108-114, doi: 10.1016/j.jbusres.2006.10.008.
Chahal, H. and Devi, A. (2015), “Destination attributes and destination image relationship in volatiletourist destination: role of perceived risk”, Metamorphosis, Vol. 4 No. 2, pp. 1-19, doi: 10.1177/0972622520150203.
Chan, S. (2016), “Evaluation of international tourist satisfaction in Weh Island Indonesia usingHOLSAT model”, International Journal of Scientific and Technology Research, Vol. 5 No. 5,pp. 246-252.
Chowdhury, S.K. and Salam, M. (2015), “Predicting attitude based on cognitive, affective and conativecomponents: an online shopping perspective”, Stamford Journal of Business Studies, Vol. 6No. 7, pp. 101-115.
Cronbach, L.J. (1951), “Coefficient alpha and the internal structure of tests”, Psychometrika, Vol. 16No. 3, pp. 291-334.
Dmitrovic, T., Cvelbar, L.K., Kolar, T., Brencic, M.M., Ograjen�sek, I. and �Zabkar, V. (2009),“Conceptualizing tourist satisfaction at the destination level”, International Journal of Culture,Tourism and Hospitality Research, Vol. 3 No. 2, pp. 116-126, doi: 10.1108/17506180910962122.
JHTI
Dunn, T.J., Baguley, T. and Brunsden, V. (2014), “From alpha to omega: a practical solution to thepervasive problem of internal consistency estimation”, British Journal of Psychology, Vol. 105No. 3, pp. 399-412, doi: 10.1111/bjo2046.
Eus�ebio, C. and Vieira, A.L. (2011), “Destination attributes’ evaluation, satisfaction and behaviouralintentions: a structural modelling approach”, International Journal of Tourism Research, Vol. 15No. 1, pp. 66-80, doi: 10.1002/jtr.
Faullant, R., Matzler, K. and Mooradian, T.A. (2011), “Personality, basic emotions, and satisfaction:primary emotions in the mountaineering experience”, Tourism Management, Vol. 32 No. 6,pp. 1423-1430, doi: 10.1016/j.tourman.2011.01.004, Elsevier.
Fornell, C. and Larcker, D.F. (1981), “Evaluating structural equation models with unobservablevariables and measurement error”, Journal of Marketing Research, Vol. 18 No. 1, p. 39, doi: 10.2307/3151312.
Garger, J., Jacques, P.H., Gastle, B.W. and Connolly, C.M. (2019), “Threats of common method variancein student assessment of instruction instruments”, Higher Education Evaluation andDevelopment, Vol. 13 No. 1, pp. 2-17, doi: 10.1108/heed-05-2018-0012.
George, R. (2003), “Tourist’s perceptions of safety and security while visiting Cape Town”, TourismManagement, Vol. 24 No. 5, pp. 575-585, doi: 10.1016/S0261-5177(03)00003-7.
Ghafelehbashi, S., Asadollahi, A. and Nikfar, F. (2011), “Acquaintance with all types of involvement inconsumer behavior”, Interdisciplinary Journal of Contemporary Research in Business, Vol. 3No. 5, pp. 493-507.
Ghose, S. and Johann, M. (2018), “Measuring tourist satisfaction with destination attributes”, Journalof Management and Financial Sciences, Vol. 11 No. 34, pp. 9-22.
Ghosh, P. and Sofique, M.A. (2012), “Tourist satisfaction at cultural heritage destinations: an empiricalstudy of West Bengal, India”, Asian Journal of Multidimensional Research, Vol. 1 No. 6,pp. 55-68.
Grappi, S. and Montanari, F. (2011), “The role of social identification and hedonism in affecting touristre-patronizing behaviours: the case of an Italian festival”, Tourism Management, Vol. 32 No. 5,pp. 1128-1140, doi: 10.1016/j.tourman.2010.10.001.
Guzel, B. (2017), “Destination attributes in the eye of the local people”, Kastamonu €Universitesi_Iktisadi ve _Idari Bilimler Fak€ultesi Dergisi, Vol. 18 No. 1, pp. 128-137.
Hahm, J.J. and Severt, K. (2018), “Importance of destination marketing on image and familiarity”,Journal of Hospitality and Tourism Insights, Vol. 1 No. 1, pp. 37-53, doi: 10.1108/jhti-10-2017-0002.
Han, H., Back, K.J. and Barrett, B. (2010), “A consumption emotion measurement development: a full-service restaurant setting”, Service Industries Journal, Vol. 30 No. 2, pp. 299-320, doi: 10.1080/02642060802123400.
Hermawan, H., Wijayanti, A. and Nugroho, D.S. (2019), “Loyalty on ecotourism analysed using thefactors of tourist attraction, safety, and amenities, with satisfaction as an intervening variable”,African Journal of Hospitality, Tourism and Leisure, Vol. 8 No. 5, pp. 1-19, doi: 10.31227/osf.io/sbdmu.
Hosany, S. and Prayag, G. (2013), “Patterns of tourists’ emotional responses, satisfaction, and intentionto recommend”, Journal of Business Research, Vol. 66 No. 6, pp. 730-737, doi: 10.1016/j.jbusres.2011.09.011, Elsevier.
Jani, D., Jang, C.-I. and Hwang, Y.-H. (2009), “Differential effects of tourism resources on theattractiveness of destination”, International Journal of Tourism Sciences, Vol. 9 No. 1, pp. 23-36,doi: 10.1080/15980634.2009.11434608.
Jayasinghe, M.K.D., Gnanapala, W.K.A. and Sandaruwani, J.A.R. (2015), “Factors affecting tourists’perception and satisfaction in Eliya, Sri Lanka”, Ilorin Journal of Economic Policy, Vol. 2, pp. 1-15.
The effect oftourist
emotionalinvolvement
Jing, C.J. and Rashid, B. (2018), “Assessing the influence of destination perceived attributesperformance on Chinese tourist emotional responses”, Journal of Tourism, Hospitality andEnvironment Management, Vol. 3 No. 11, pp. 59-70.
Jobson, J.D. (2012), Applied Multivariate Data Analysis: Volume II: Categorical and MultivariateMethods, Springer Science & Business Media, New York.
Kirom, N.R. and Putra, I.W.J.A. (2018), “The influence of tourist attractions towards the tourists’satisfaction”, The First International Research Conference on Economics and Business,pp. 270-288, doi: 10.18502/kss.v3i3.1889.
Kline, R.B. (2015), Principles and Practice of Structural Equation Modeling, 4th ed., Guilfordpublications, New York.
Kwanisai, G. and Vengesayi, S. (2016), “Destination attributes and overall destination satisfaction inZimbabwe”, Tourism Analysis, Vol. 21 No. 1, pp. 17-28, doi: 10.3727/108354216x14537459508775.
Lamb, C., Hair, J. and McDaniel, C. (2014), Principles of Marketing, Cengage Learning, Boston.
Lee, W. and Pachmayer, A. (2012), “The impact of visualization and expectation on tourists’ emotionand satisfaction at the destination”, TTRA: Advancing Tourism Research Globally, Vol. 12,available at: http://scholarworks.umass.edu/ttra%0ALee.
Lee, J. (2014), “Visitors’ emotional responses to the festival environment”, Journal of Travel andTourism Marketing, Vol. 31 No. 1, pp. 114-131, doi: 10.1080/10548408.2014.861726.
Lee, C. (2015), “Tourist satisfaction with factory tour experience”, International Journal of Culture,Tourism and Hospitality Research, Vol. 9 No. 3, pp. 261-277, doi: 10.1108/IJCTHR-02-2015-0005.
Lin, Y., Kerstetter, D., Nawijn, J. and Mitas, O. (2014), “Changes in emotions and their interactions withpersonality in a vacation context”, Tourism Management, Vol. 40, pp. 416-424, doi: 10.1016/j.tourman.2013.07.013, Elsevier.
Liu, Y., Liu-Lastres, B., Wang, Q. and Fu, Y.Y. (2019), “Exploring inbound tourists experience inBeijing, China: an online deductive approach”, International Journal of Tourism Cities, Vol. 5No. 3, pp. 443-450, doi: 10.1108/IJTC-04-2018-0026.
Liu, H. (2016), “The role of negative emotions in shaping tourist experiences”, Tourism Travel andResearch Association: Advancing Tourism Research Globally, available at: http://scholarworks.umass.edu/ttra/2016/Grad_Student_Workshop/13/?utm_source5scholarworks.umass.edu%2Fttra%2F2016%2FGrad_Student_Workshop%2F13&utm_medium5PDF&utm_campaign5PDFCoverPages.
Malodia, S. and Singla, H. (2017), “Using HOLSAT to evaluate satisfaction of religious tourist atsacred destinations: the case of religious travelers visiting sacred destinations in the Himalayas,India”, International Journal of Culture, Tourism and Hospitality Research, Vol. 11 No. 2,pp. 255-270, doi: 10.1108/IJCTHR-10-2015-0120.
Manui, J. and Wongsai, S. (2017), “Tourists’ perceptions on safety and security: a case study of PhuketIsland of Thailand”, Proceedings 2nd ISI Regional Statistics Conference, available at: https://isi-rsc2017.org/Portal/Proceeding/CPS/ISIRSC2017_CPS24_S2_P_Manui.pdf.
Ma, A.T.H., Chow, A.S., Cheung, L.T., Lee, K.M. and Liu, S. (2018), “Impacts of tourists’sociodemographic characteristics on the travel motivation and satisfaction: the case ofprotected areas in South China”, Sustainability, Vol. 10 No. 10, pp. 1-21, doi: 10.3390/su10103388.
May-Chiun, L., Peter, S. and Azlan, M.A. (2013), “Rural tourism and destination image: communityperception in tourism planning”, The Macrotheme Review, Vol. 2 No. 1, pp. 102-118.
McQuitty, S. (2004), “Statistical power and structural equation models in business research”, Journalof Business Research, Vol. 57 No. 2, pp. 175-183, doi: 10.1016/S0148-2963(01)00301-0.
Nasir, M.N.M., Mohamad, M., Ghani, N. and Afthanorhan, A. (2020), “Testing mediation roles of placeattachment and tourist satisfaction on destination attractiveness and destination loyaltyrelationship using phantom approach”, Management Science Letters, Vol. 10 No. 2, pp. 443-454,doi: 10.5267/j.msl.2019.8.026.
JHTI
Nunnally, J.C. (1978), Psychometric Theory, 2nd ed., McGraw Hill Book Company, New York.
Oliva, T.A., Oliver, R.L. and Bearden, W.O. (1995), “The relationships among consumer satisfaction,involvement, and product performance: a catastrophe theory application”, Behavioral Science,Vol. 40 No. 2, pp. 104-132.
Oliver, R.L. (1993), “Cognitive, affective, and attribute bases of the satisfaction response”, Journal ofConsumer Research, Vol. 20, December 1993, pp. 418-430, doi: 10.1086/209358.
Oliver, R.L. (1997), Satisfaction: A Behavioral Perspective on the Consumer, Irwin-McGraw-Hill,New York.
Omar, I., Paisar, S.M., Mohamed, B. andAbukhalifeh, A.A.N. (2017), “Expectations and experiences gap forPenang Island tourists: an application of the HOLSAT model”, International Journal of Leisure andTourism Marketing, Vol. 5 No. 2, pp. 128-142.
Parasuraman, A., Zeithaml, V.A. and Berry, L.L. (1988), “SERVQUAL: a multiple-item scale for measuringconsumer perceptions of service quality”, Journal of Retailling, Vol. 64 No. 1, pp. 12-40.
Patwary, A.K. and Rashid, B. (2016), “The impacts of hospitality services on visit experience andfuture visit intention of student travelers”, International Journal of Business andTechnopreneurship, Vol. 6 No. 8, pp. 106-125.
Pestana, M.H., Parreira, A. and Moutinho, L. (2019), “Motivations, emotions and satisfaction: thekeys to a tourism destination choice”, Journal of Destination Marketing and Management,Elsevier, Vol. 16, pp. 1-9, doi: 10.1016/j.jdmm.2018.12.006.
Prayag, G. and Ryan, C. (2012), “Antecedents of tourists’ loyalty to Mauritius: the role and influence ofdestination image, place attachment, personal involvement, and satisfaction”, Journal of TravelResearch, Vol. 51 No. 3, pp. 342-356, doi: 10.1177/0047287511410321.
Prayag, G., Hosany, S. and Odeh, K. (2013), “The role of tourists’ emotional experiences andsatisfaction in understanding behavioral intentions”, Journal of Destination Marketing andManagement, Vol. 2 No. 2, pp. 118-127, doi: 10.1016/j.jdmm.2013.05.001, Elsevier.
Preko, A., Doe, F. and Dadzie, S.A. (2019), “The future of youth tourism in Ghana: motives, satisfactionand behavioural intentions”, Journal of Tourism Futures, Vol. 5 No. 1, pp. 5-21, doi: 10.1108/JTF-12-2016-0059.
Ragavan, N.A., Subramonian, H. and Sharif, S.P. (2014), “Tourists’ perceptions of destination travelattributes: an application to international tourists to Lumpur”, Procedia-Social and BehavioralSciences, Vol. 144, pp. 403-411, doi: 10.1016/j.sbspro.2014.07.309, Elsevier B.V.
Rajesh, R. (2013), “Impact of tourist perceptions, destination image and tourist satisfaction ondestination loyalty: a conceptual model”, PASOS: Revista de Turismo y Patrimonio Cultural,Vol. 11 No. 3, pp. 67-78, doi: 10.4090/juee.2008.v2n2.033040.
Rani, K.J., Catherine, R. and Saillaja, V. (2019), “A study on customer relationship management inChennai”, Journal of Advanced Research in Dynamical and Control Systems, Vol. 11 No. 9,Special Issue, pp. 15-21, doi: 10.5373/JARDCS/V11/20192529.
Rasoolimanesh, S.M., Md Noor, S., Schuberth, F. and Jaafar, M. (2019), “Investigating the effects oftourist engagement on satisfaction and loyalty”, Service Industries Journal, Vol. 39 No. 7,pp. 559-574, doi: 10.1080/02642069.2019.1570152.
Reyes V�elez, P.E., P�erez Naranjo, L.M. and Rodr�ıguez Zapatero, M. (2019), “The impact of daily tourservice quality on tourist satisfaction and behavioural intentions in an island context: a studyon tours to Isla de la Plata, Ecuador”, Current Issues in Tourism, Vol. 22 No. 19, pp. 2337-2341,doi: 10.1080/13683500.2018.1505835, Taylor & Francis.
Roscoe, J.T. (1975), Fundamental Research Statistics for the Behavioral Sciences, 2nd ed., Holt, Rinehart,and Winston, New York.
San Mart�ın, H., Herrero, A. and Garc�ıa de los Salmonesdel, M.M. (2019), “An integrative model ofdestination brand equity and tourist satisfaction”, Current Issues in Tourism, Vol. 22 No. 16,pp. 1992-2013, doi: 10.1080/13683500.2018.1428286.
The effect oftourist
emotionalinvolvement
Sangpikul, A. (2018), “The effects of travel experience dimensions on tourist satisfaction anddestination loyalty: the case of an island destination”, International Journal of Culture, Tourismand Hospitality Research, Vol. 12 No. 1, pp. 106-123, doi: 10.1108/IJCTHR-06-2017-0067.
Sarkar, S. and Khare, A. (2018), “Influence of expectation confirmation, network externalities, and flowon use of mobile shopping apps”, International Journal of Human-Computer Interaction, Vol. 35No. 16, pp. 1449-1460, doi: 10.1080/10447318.2018.1540383, Taylor & Francis.
Seabra, C., Abrantes, J.L. and Kastenholz, E. (2014), “The influence of terrorism risk perception onpurchase involvement and safety concern of international travellers”, Journal of MarketingManagement, Vol. 30 Nos 9-10, pp. 874-903, doi: 10.1080/0267257X.2014.934904.
Sharma, P. and Nayak, J.K. (2019), “Do tourists’ emotional experiences influence images and intentionsin yoga tourism?”, Tourism Review, Vol. 74 No. 3, pp. 646-665, doi: 10.1108/TR-05-2018-0060.
Shavanddasht, M. and Allan, M. (2019), “First-time versus repeat tourists: level of satisfaction,emotional involvement, and loyalty at hot spring”, Anatolia, Vol. 30 No. 1, pp. 61-74, doi: 10.1080/13032917.2018.1498363, Routledge.
Sthapit, E., Bj€ork, P. and Coudounaris, D.N. (2017), “Emotions elicited by local food consumption,memories, place attachment and behavioural intentions”, Anatolia, Vol. 28 No. 3, pp. 363-380,doi: 10.1080/13032917.2017.1322111, Routledge.
Su, L., Huang, Y. and Hsu, M. (2018), “Unraveling the impact of destination reputation on placeattachment and behavior outcomes among Chinese urban tourists”, Journal of Hospitality andTourism Insights, Vol. 1 No. 4, pp. 290-308, doi: 10.1108/jhti-11-2017-0026.
Suanmali, S. (2014), “Factors affecting tourist satisfaction: an empirical study in the northern partof Thailand”, SHS Web of Conferences, EDP Sciences, p. 0102, doi: 10.1051/shsconf/20141201027.
Sukiman, M.F., Omar, S.I., Muhibudin, M., Yussof, I. and Mohamed, B. (2013), “Tourist satisfaction asthe key to destination survival in Pahang”, Procedia - Social and Behavioral Sciences, ElsevierB.V., Vol. 91 No. 10, pp. 78-87, doi: 10.1016/j.sbspro.2013.08.404.
Swan, J.E. and Combs, L.J. (1976), “Product performance and consumer satisfaction: a new concept”,Journal of Marketing, Vol. 40 No. 2, pp. 25-33, doi: 10.1177/002224297604000206.
Szolnoki, G. and Hoffmann, D. (2013), “Online, face-to-face and telephone surveys- Comparing differentsampling methods in wine consumer research”, Wine Economics and Policy, Vol. 2 No. 2,pp. 57-66, doi: 10.1016/j.we013.10.001, Elsevier.
Tasci, A.D.A. and Boylu, Y. (2010), “Cultural comparison of tourists’ safety perception in relation totrip satisfaction”, International Journal of Tourism Research, Vol. 12 No. 2, pp. 179-192, doi: 10.1002/jtr.745.
Tlili, H.T. and Amara, D. (2016), “Towards emotional experience and place attachment as touristsatisfaction attributes”, Journal of Business and Economic Policy, Vol. 3 No. 3, pp. 108-119.
Tribe, J. and Snaith, T. (1998), “From SERVQUAL to HOLSAT: holiday satisfaction invaradero, Cuba”, Tourism Management, Vol. 19 No. 1, pp. 25-34, doi: 10.1016/S0261-5177(97)00094-0.
Truong, T. and Foster, D. (2006), “Using HOLSAT to evaluate tourist satisfaction at destinations: thecase of Australian holidaymakers in Vietnam”, Tourism Management, Vol. 27 No. 5,pp. 842-855, doi: 10.1016/j.tourman.2005.05.008.
Truong, T.L.H., Lenglet, F. and Mothe, C. (2018), “Destination distinctiveness: concept, measurement,and impact on tourist satisfaction”, Journal of Destination Marketing and Management, Vol. 8April, pp. 214-231, doi: 10.1016/j.jdmm.2017.04.004, Elsevier.
Tse, D.K. and Wilton, P.C. (1988), “Models of consumer satisfaction formation: an extension”, Journalof Marketing Research, Vol. 25 No. 2, pp. 204-212, doi: 10.2307/3172652.
Valduga, M.C., Breda, Z. and Costa, C.M. (2019) ‘Perceptions of blended destination image: the case ofRio de Janeiro and Brazil.’, Journal of Hospitality and Tourism Insights, Vol. 3 No. 2, pp. 75-93,doi: 10.1108/JHTI-03-2019-0052.
JHTI
Vareiro, L., Ribeiro, J.C. and Remoaldo, P. (2017), Destination Attributes and Tourists’ Satisfaction in aCultural Destination, pp. 1-17, doi: 10.13140/RG.2.2.17542.98884.
Vengesayi, S., Mavondo, F.T. and Reisinger, Y. (2010), “Tourism destination attractiveness:attractions, facilities, and people as predictors”, Tourism Analysis, Vol. 14 No. 5, pp. 621-636,doi: 10.3727/108354209x12597959359211.
Xu, Z., Zhang, H., Zhang, C., Xu, M. and Dong, N. (2019), “Exploring the role of emotion in therelationship between museum image and tourists’ behavioral intention: the case of threemuseums in Xi’an”, Sustainability, Vol. 11 No. 3, pp. 1-20, doi: 10.3390/su11030559.
Yao, Y. (2013), “Assessing tourist experience satisfaction with a heritage destination”, MasterDissertation, Purdue University, West Lafayette, IN, available at: https://docs.lib.purdue.edu/open_access_theses/107/.
Yuksek, G., Akkoç, _I.T. and Bayer, R.U. (2016), “The effects of public transport performance ondestination satisfaction”, African Journal of Hospitality, Tourism and Leisure, Vol. 5 No. 4,pp. 1-12, available at: http://www.idep.eco.usi.ch/slides-leklaehn-246264.pdf.
Further reading
Brascamp, J.W., Van Ee, R., Noest, A.J., Jacobs, R.H. and Van den Berg, A.V. (2006), “The time courseof binocular rivalry reveals a fundamental role of noise”, Journal of Vision, Vol. 6 No. 11, pp. 8-8,doi: 10.1167/6.11.8.
Corresponding authorSantus Kumar Deb can be contacted at: [email protected]
For instructions on how to order reprints of this article, please visit our website:www.emeraldgrouppublishing.com/licensing/reprints.htmOr contact us for further details: [email protected]
The effect oftourist
emotionalinvolvement
View publication statsView publication stats