Embed Size (px)
Citation preview
1
Medicaid 101:Michigan Association of Health Plans
February 12, 2015
Steve FittonMedicaid Director
Michigan Department of Community HealthDirector: Nick Lyon

2
3
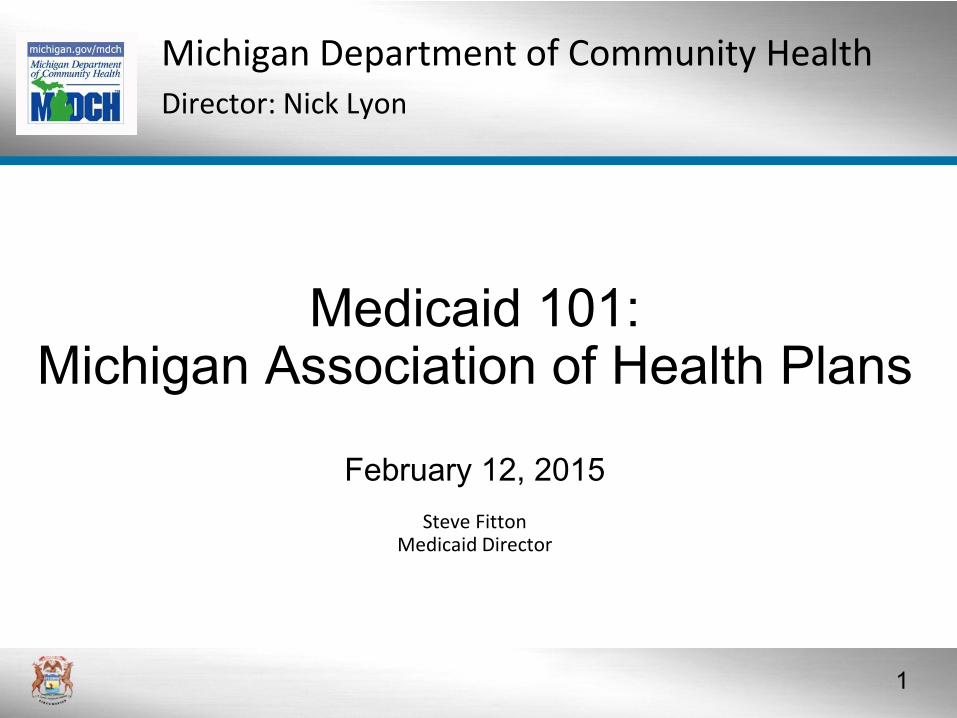
Medicaid History Condensed
• Federal legislation passed in 1965 (Title XIX of the
Social Security Act)
• Financing and control are shared between federal and
state governments – federal minimum financial support
is 50%
• State Plan- Contract with federal government
• Bias toward children—Early and Periodic Screening,
Diagnosis, and Treatment (EPSDT)
• Majority of spending on aged and disabled
• No two state Medicaid programs are the same
4
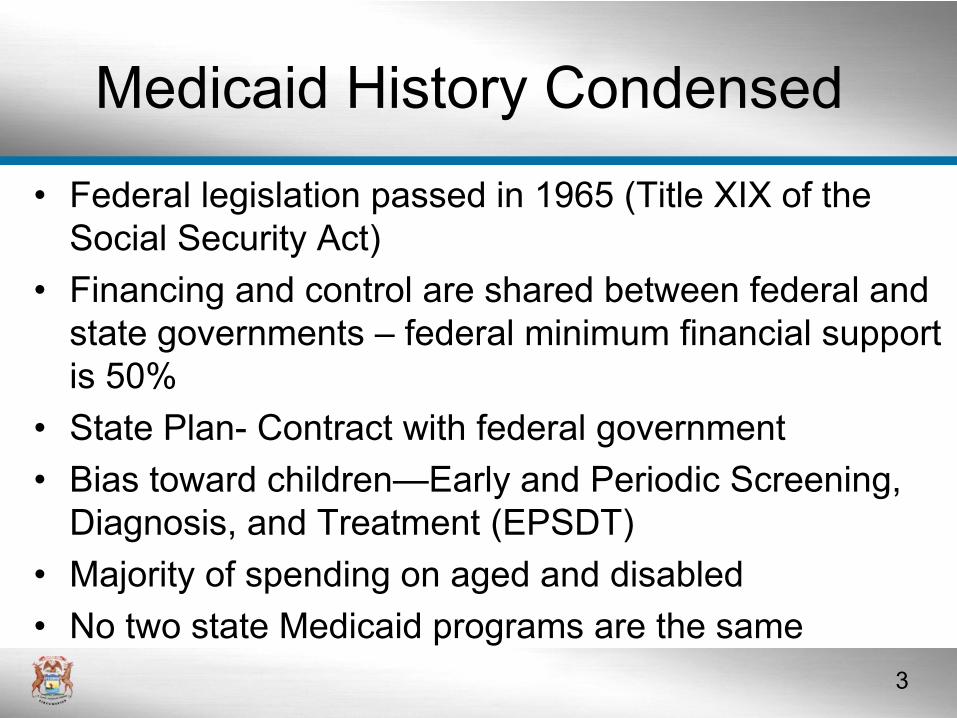
Childless Adults3%
Parents20%
Disabled16%
Aged6%
Children55%
•55% are Children
•22% are Aged or Disabled
Medicaid Consumers- FY13
5
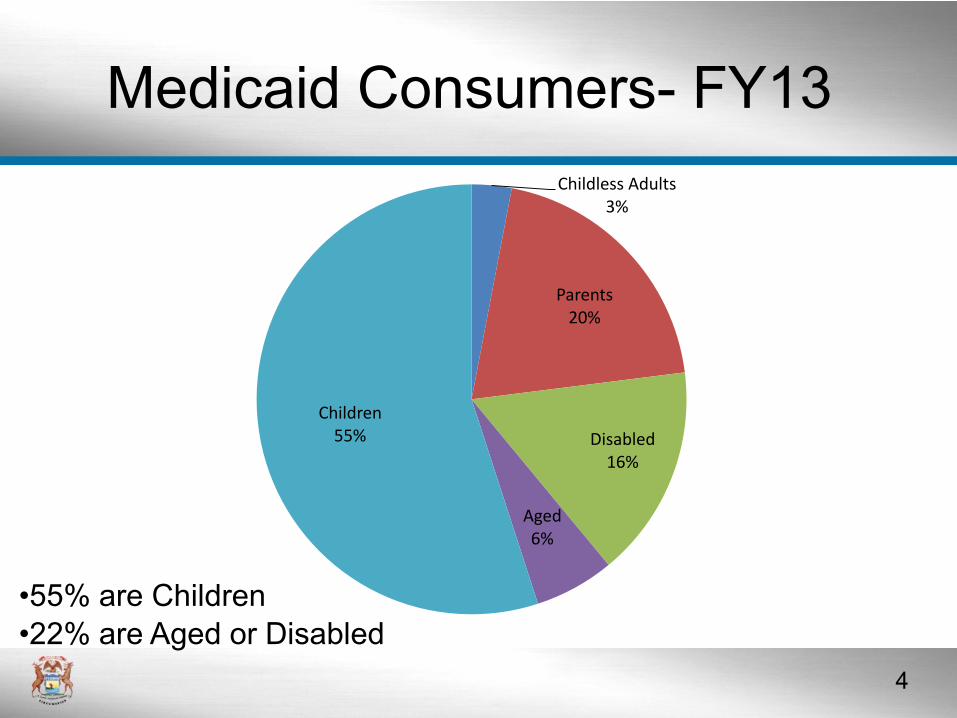
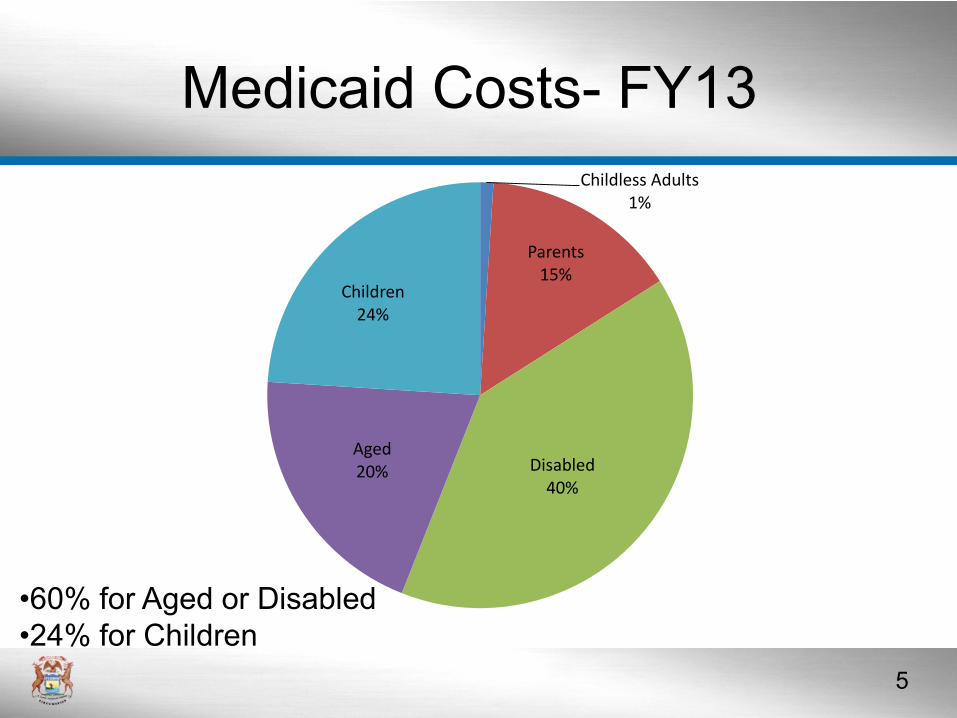
•60% for Aged or Disabled
•24% for Children
Childless Adults1%
Parents15%
Disabled40%
Aged20%
Children24%
Medicaid Costs- FY13
6
7
Michigan Medicaid Service Delivery
1973
• Managed Care movement initiated in 1973– First 3 Health Management Organization (HMO) contracts
established
– Two in Detroit and one in Benton Harbor
• In the first year of these contracts, services were
provided through to 13,000 Medicaid enrollees
on a voluntary basis
8
Michigan Medicaid Service Delivery
1995
• By 1995, Medicaid was being implemented
through a variety of “managed care” options:
– HMOs
– Clinic plans
• Physicians provided primary & most specialized care for a capitated rate. Hospital fees for inpatient care were paid directly by state
– Physician Sponsor Plan (PSP)
• Physicians were paid a $3 capitation rate per enrolled client to serve as “gatekeepers”
9
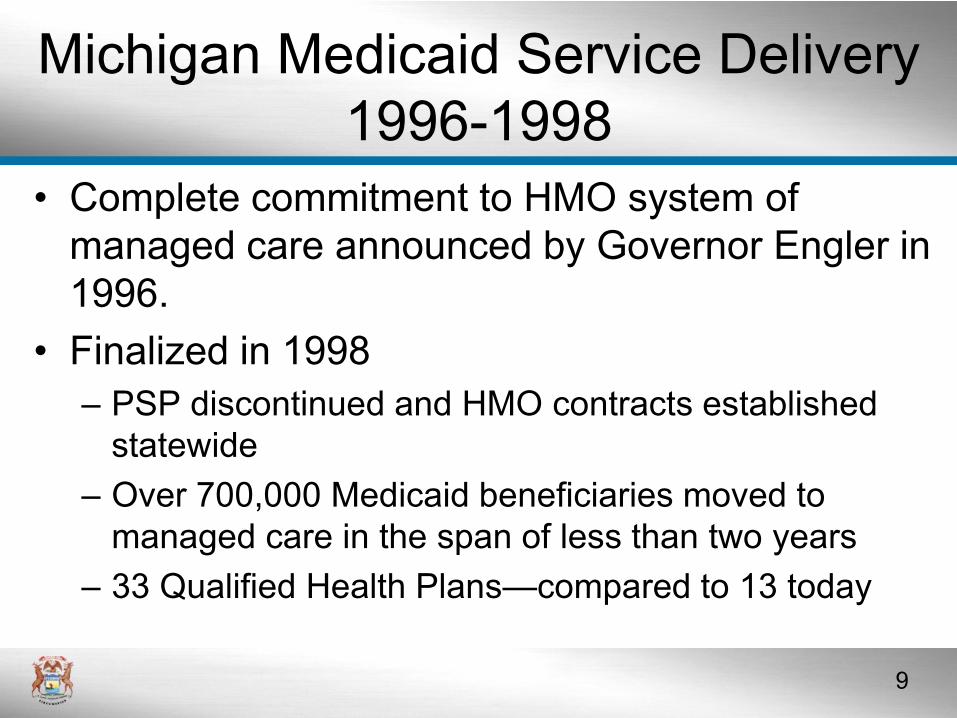
• Complete commitment to HMO system of
managed care announced by Governor Engler in
1996.
• Finalized in 1998
– PSP discontinued and HMO contracts established
statewide
– Over 700,000 Medicaid beneficiaries moved to
managed care in the span of less than two years
– 33 Qualified Health Plans—compared to 13 today
Michigan Medicaid Service Delivery
1996-1998
10
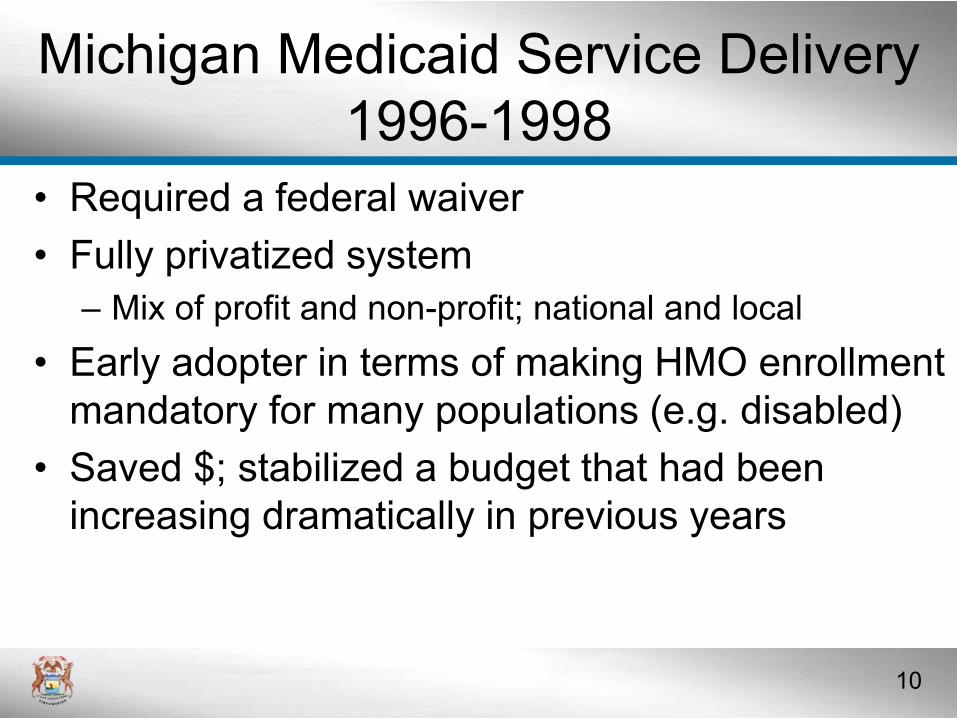
• Required a federal waiver
• Fully privatized system
– Mix of profit and non-profit; national and local
• Early adopter in terms of making HMO enrollment
mandatory for many populations (e.g. disabled)
• Saved $; stabilized a budget that had been
increasing dramatically in previous years
Michigan Medicaid Service Delivery
1996-1998
11
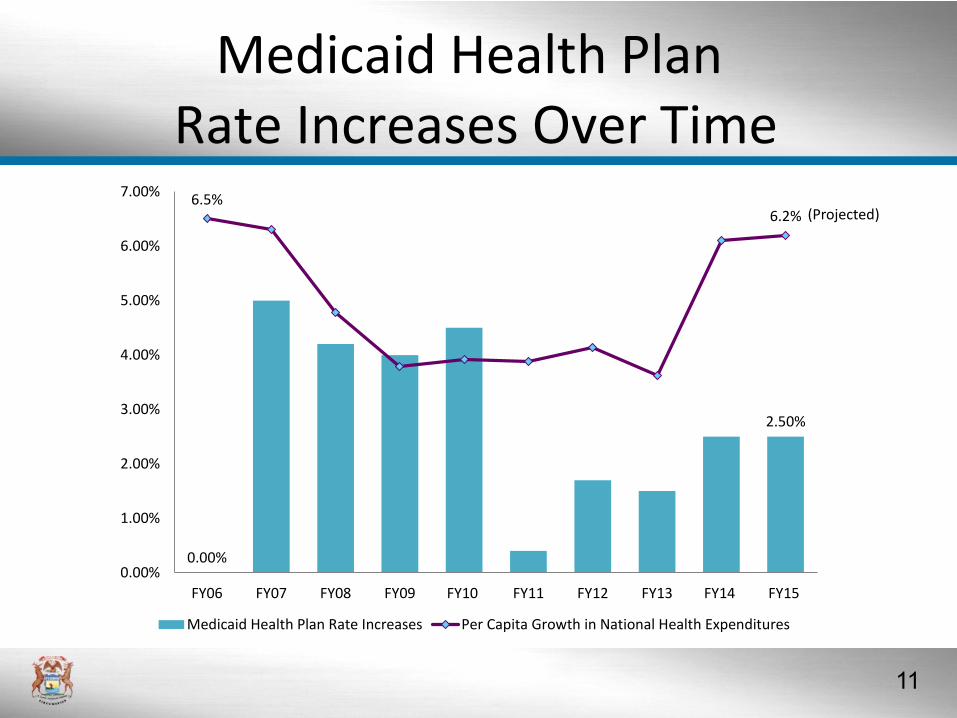
Medicaid Health PlanRate Increases Over Time
0.00%
2.50%
6.5%6.2%
0.00%
1.00%
2.00%
3.00%
4.00%
5.00%
6.00%
7.00%
FY06 FY07 FY08 FY09 FY10 FY11 FY12 FY13 FY14 FY15
Medicaid Health Plan Rate Increases Per Capita Growth in National Health Expenditures
(Projected)
12
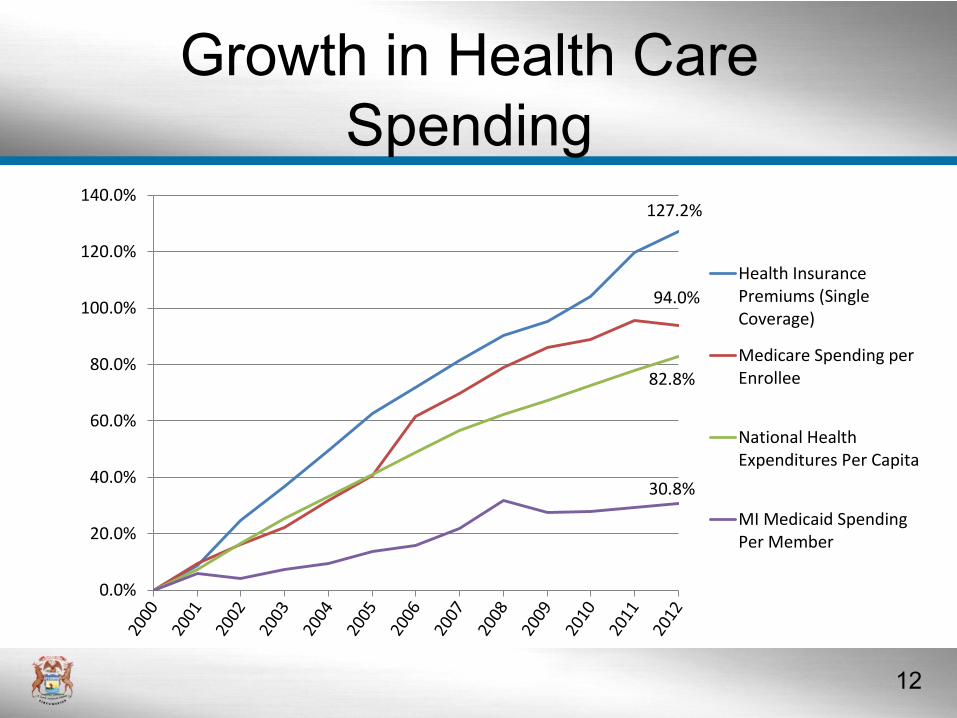
Growth in Health Care
Spending
127.2%
94.0%
82.8%
30.8%
0.0%
20.0%
40.0%
60.0%
80.0%
100.0%
120.0%
140.0%
Health InsurancePremiums (SingleCoverage)
Medicare Spending perEnrollee
National HealthExpenditures Per Capita
MI Medicaid SpendingPer Member
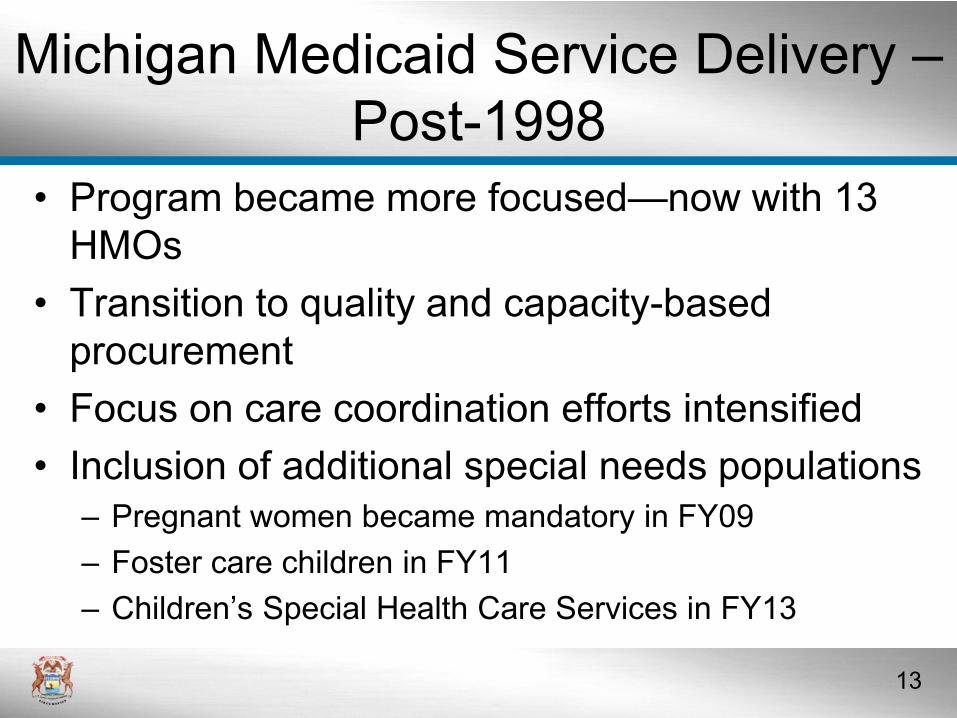
13
• Program became more focused—now with 13
HMOs
• Transition to quality and capacity-based
procurement
• Focus on care coordination efforts intensified
• Inclusion of additional special needs populations
– Pregnant women became mandatory in FY09
– Foster care children in FY11
– Children’s Special Health Care Services in FY13
Michigan Medicaid Service Delivery –
Post-1998
14
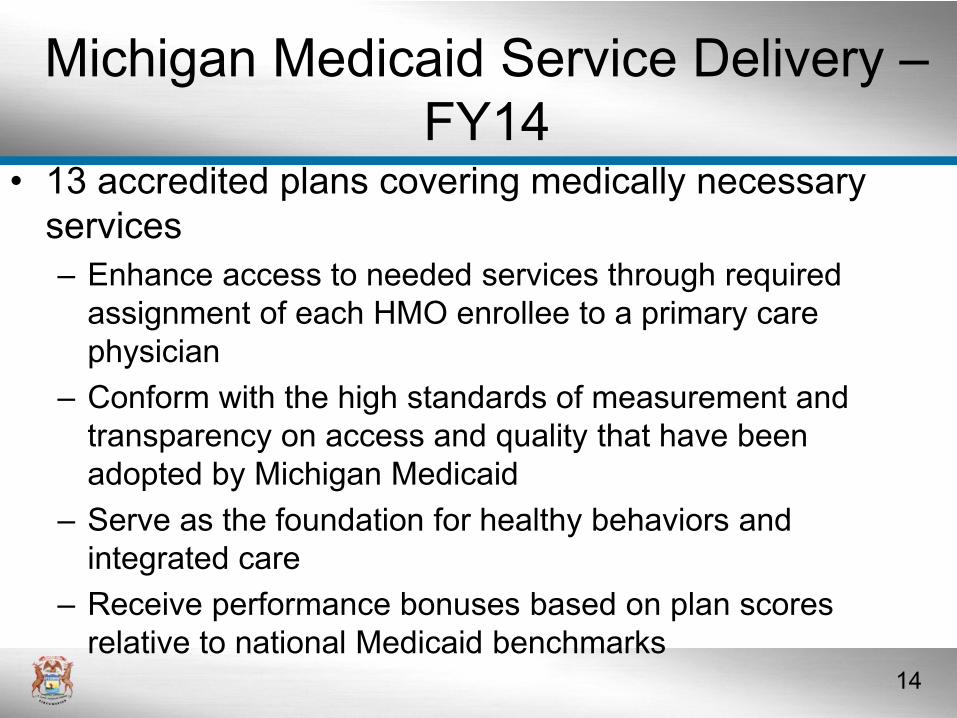
Michigan Medicaid Service Delivery –
FY14• 13 accredited plans covering medically necessary
services
– Enhance access to needed services through required
assignment of each HMO enrollee to a primary care
physician
– Conform with the high standards of measurement and
transparency on access and quality that have been
adopted by Michigan Medicaid
– Serve as the foundation for healthy behaviors and
integrated care
– Receive performance bonuses based on plan scores
relative to national Medicaid benchmarks

15
Michigan Medicaid Service Delivery-
FY14
Managed Care73%
Spend Down1%
Long Term Care2%
Dual Eligible Recipients8%
Non Dual Eligible-Migrating
to Managed Care7%
Non Dual Eligible Recipients
9%
Fee for Service24%
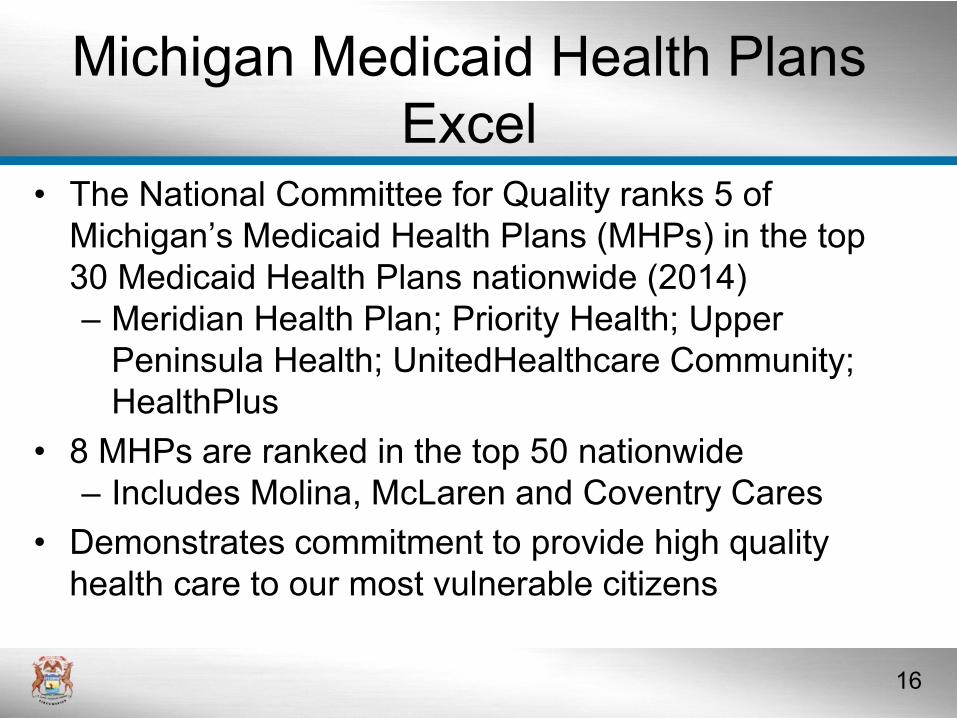
16
Michigan Medicaid Health Plans
Excel• The National Committee for Quality ranks 5 of
Michigan’s Medicaid Health Plans (MHPs) in the top
30 Medicaid Health Plans nationwide (2014)
– Meridian Health Plan; Priority Health; Upper
Peninsula Health; UnitedHealthcare Community;
HealthPlus
• 8 MHPs are ranked in the top 50 nationwide
– Includes Molina, McLaren and Coventry Cares
• Demonstrates commitment to provide high quality
health care to our most vulnerable citizens
17
18
HMP Basics
• Extends access to health coverage to previously uninsured or underinsured Michigan citizens
• Legislation signed by Governor on 9/16/13
– No immediate effect
• Enrollment began in April 2014
19
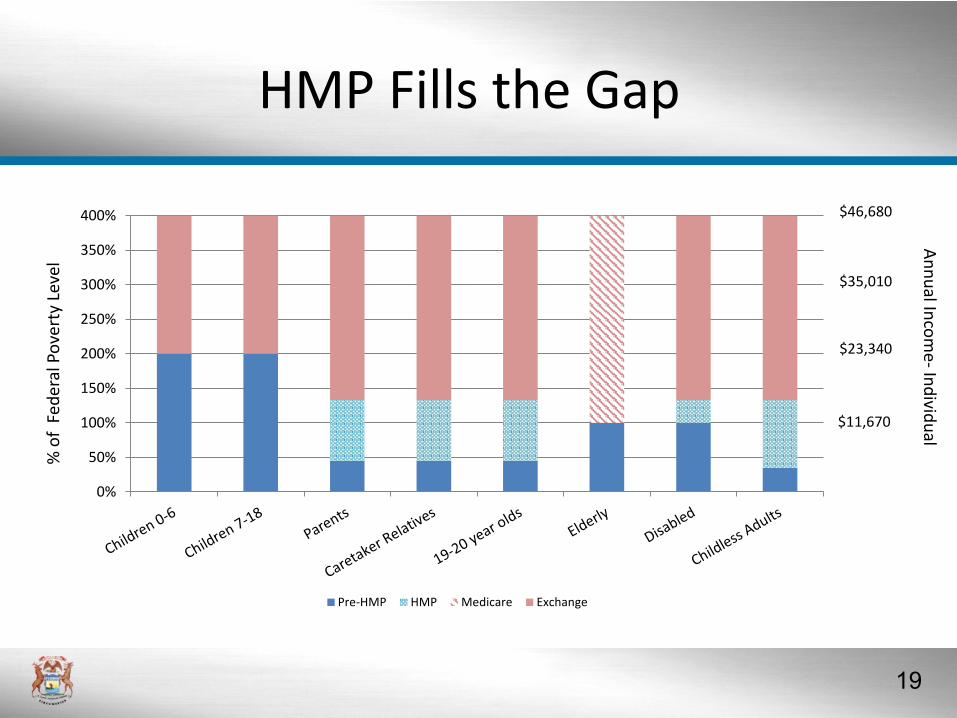
HMP Fills the Gap%
of
Fed
eral
Po
vert
y Le
vel
0%
50%
100%
150%
200%
250%
300%
350%
400%
Pre-HMP HMP Medicare Exchange
$46,680
$35,010
$23,340
$11,670
An
nu
al Inco
me-
Ind
ividu
al
20
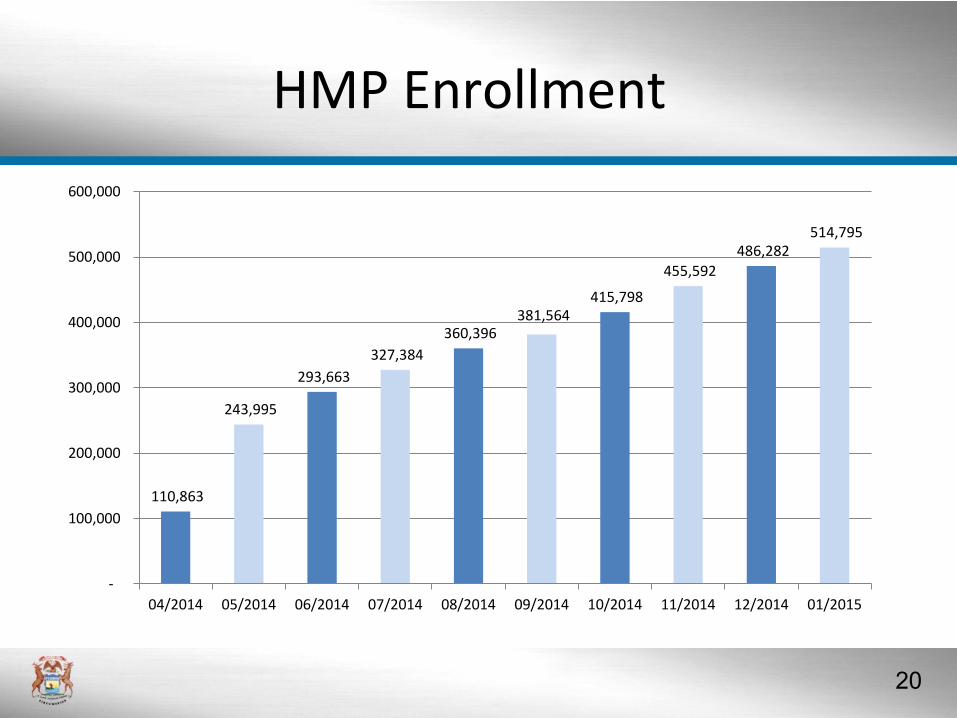
HMP Enrollment
110,863
243,995
293,663
327,384
360,396 381,564
415,798
455,592
486,282 514,795
-
100,000
200,000
300,000
400,000
500,000
600,000
04/2014 05/2014 06/2014 07/2014 08/2014 09/2014 10/2014 11/2014 12/2014 01/2015
21
HMP Themes
Legislation about program improvement broadly:
• Managed care approach
• Structural incentives built around promoting personal
responsibility
– Beneficiary Cost Sharing
– Healthy Behavior Incentives
• Alignment of incentives – beneficiaries, providers, and
health plans
• Continued improvements to Medicaid with integrated care
and value based design and purchasing
• Accountability
22
Personal ResponsibilityHealthy Behaviors
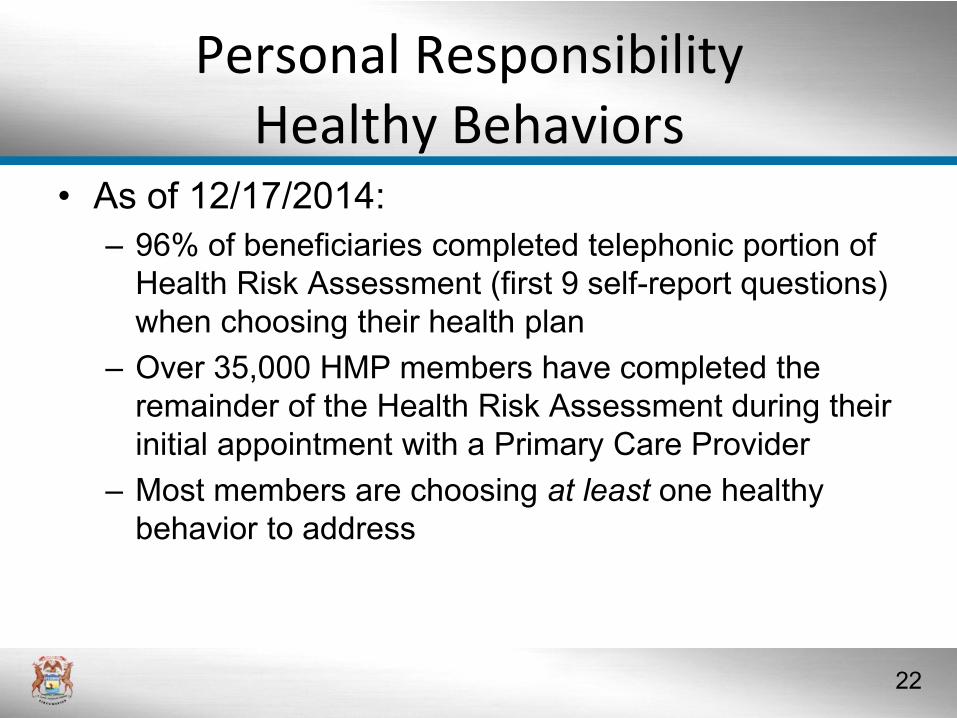
• As of 12/17/2014:
– 96% of beneficiaries completed telephonic portion of
Health Risk Assessment (first 9 self-report questions)
when choosing their health plan
– Over 35,000 HMP members have completed the
remainder of the Health Risk Assessment during their
initial appointment with a Primary Care Provider
– Most members are choosing at least one healthy
behavior to address
23
Personal ResponsibilityHealthy Behaviors
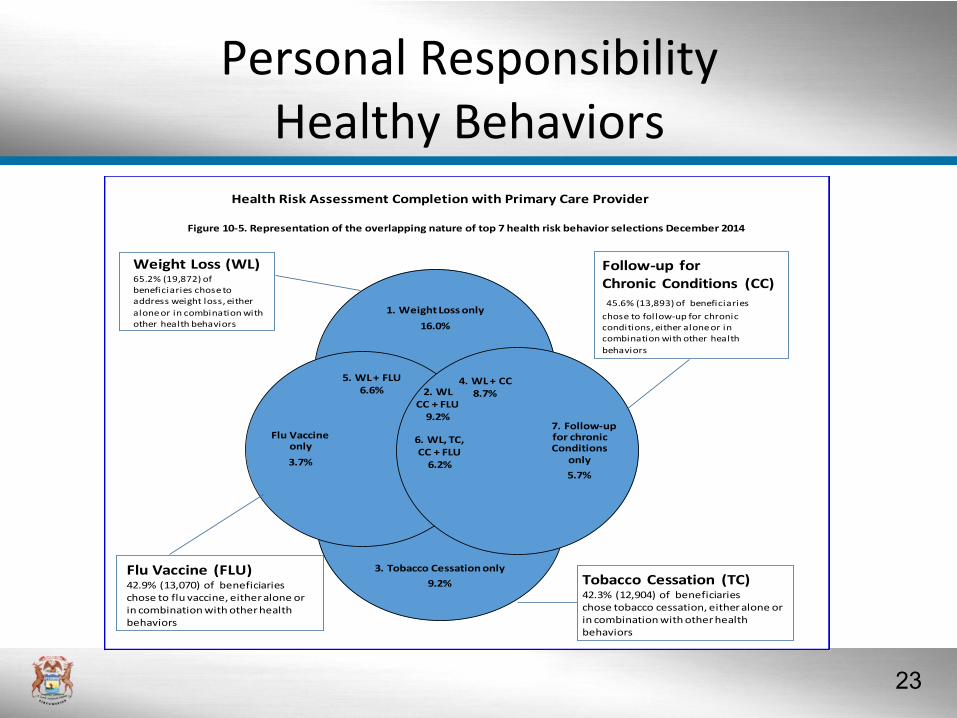
Health Risk Assessment Completion with Primary Care Provider
Figure 10-5. Representation of the overlapping nature of top 7 health risk behavior selections December 2014
Follow-up for Chronic Conditions (CC)45.6% (13,893) of beneficiaries
chose to follow-up for chronic conditions, either alone or in combination with other health
behaviors
1. Weight Loss only
16.0%
3. Tobacco Cessation only
9.2%
Flu Vaccine only
3.7%
7. Follow-up for chronic Conditions
only
5.7%
2. WL CC + FLU
9.2%
4. WL + CC8.7%
5. WL + FLU6.6%
6. WL, TC, CC + FLU
6.2%
Weight Loss (WL) 65.2% (19,872) of beneficiaries chose to address weight loss, either
alone or in combination with other health behaviors
Tobacco Cessation (TC)42.3% (12,904) of beneficiaries chose tobacco cessation, either alone or in combination with other health behaviors
Flu Vaccine (FLU)42.9% (13,070) of beneficiaries chose to flu vaccine, either alone or in combination with other health behaviors
24
Personal ResponsibilityHealth Plan Enrollment
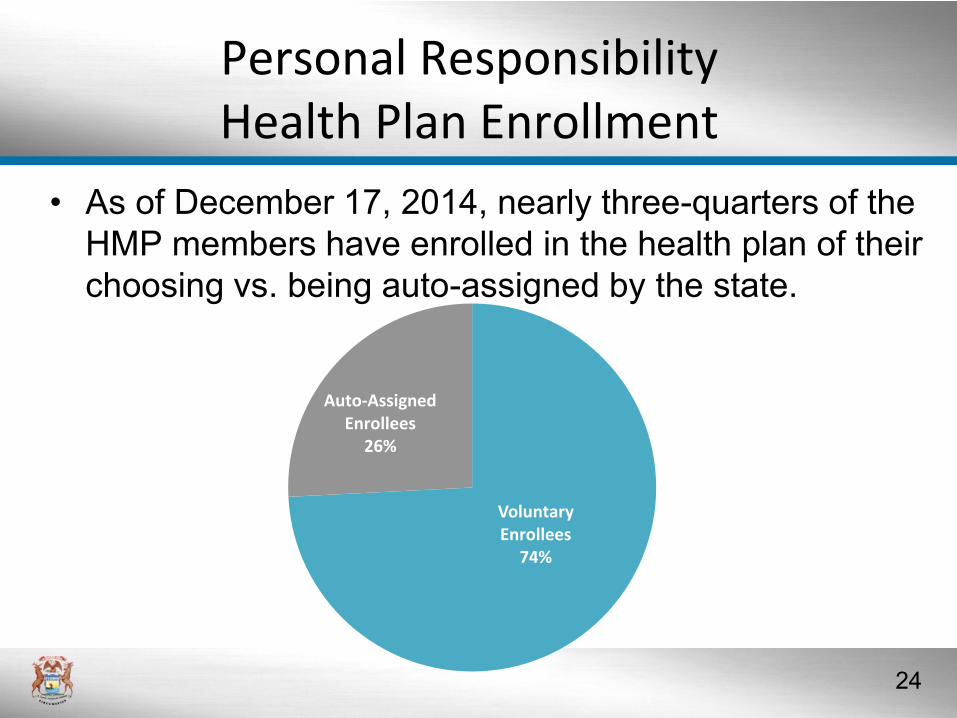
• As of December 17, 2014, nearly three-quarters of the
HMP members have enrolled in the health plan of their
choosing vs. being auto-assigned by the state.
Voluntary Enrollees
74%
Auto-Assigned Enrollees
26%
25
Personal ResponsibilityPreventive Care
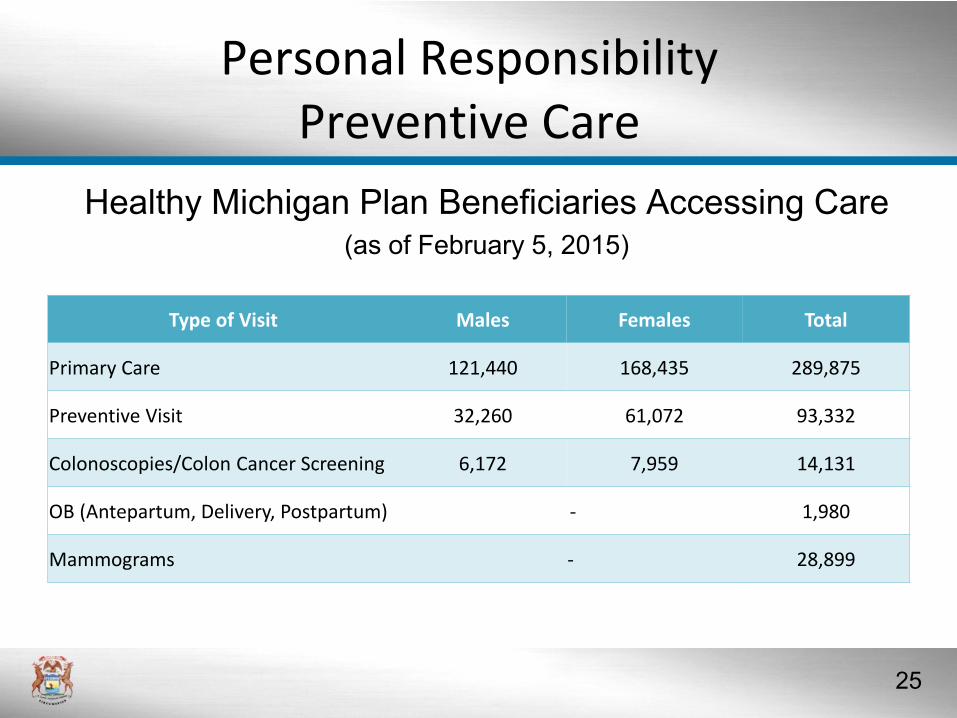
Healthy Michigan Plan Beneficiaries Accessing Care(as of February 5, 2015)
Type of Visit Males Females Total
Primary Care 121,440 168,435 289,875
Preventive Visit 32,260 61,072 93,332
Colonoscopies/Colon Cancer Screening 6,172 7,959 14,131
OB (Antepartum, Delivery, Postpartum) - 1,980
Mammograms - 28,899

26
Fiscal Impacts
• General Fund savings
– $1.2 billion in savings anticipated through 2020
• Reduction in uncompensated care
– $351 million in savings estimated in Michigan through 2022
related to uncompensated care costs1
• Takes pressure off of private health insurance premiums for businesses and families
• Offsets planned DSH and Medicare cuts
1 Kaiser Family Foundation study on the “Cost of Not Expanding Medicaid”
27
Conclusion
• Michigan’s Medicaid Program
– Is a national leader in many areas while emphasizing
sound fundamentals
– Is setting a new trend with Healthy Michigan;
incentivizing health behaviors and personal
responsibility
– Is cost effective while delivering access and quality
services to beneficiaries
– Tracks performance through a wide range of metrics
– Will continue to pursue cutting edge policies that
improve program performance