Embed Size (px)
Citation preview
MEDICAL BOARD STAFF REPORT Agenda Item 20A
DATE REPORT ISSUED: ATTENTION: SUBJECT: STAFF CONTACT:
July 11, 2017 Members, Medical Board of California
Administrative Summary Kimberly Kirchmeyer, Executive Director
REQUESTED ACTION: This report is intended to provide the Members with an update on the staffing, budget, and other administrative functions/projects occurring at the Medical Board of California (Board). No action is needed at this time.
Administrative Updates Board staff has had several meetings with interested parties regarding the Board. Board staff held teleconference meetings with the Board’s President and Vice President to discuss
pending projects, sunset review process, and the Board agendas. Regular meetings were held with Chief Deputy Director Jeffrey Mason and Deputy Director Christine
Lally of the Department of Consumer Affairs (DCA) and other DCA executive staff. Regular meetings continue to be held with Gloria Castro, Senior Assistant Attorney General. Meetings were held with David Chriss, Chief of Enforcement, and Kathleen Nicholls, Deputy Chief of
Enforcement, Division of Investigation, Health Quality Investigation Unit (HQIU), regarding the Board’s investigations.
Board staff continues to meet with DCA and the Department of Justice (DOJ) to discuss the Controlled Substance Utilization Review and Evaluation System (CURES) database.
Board staff attended meetings with the Psychotropic Medication Implementation (PMI) Workgroup, which is a workgroup to improve the safe and appropriate use of psychotropic medication for children and youth in foster care.
Board staff met with legislative offices to discuss the Board’s sunset legislation, provide updates, discuss other pending legislation, and provide education on the Board’s functions.
Board staff met with Graduate Medical Education Directors from the UC system to discuss postgraduate training and other licensing related issues.
Board staff attended webinars and teleconferences with staff from the Federation of State Medical Boards and the International Association of Medical Regulatory Authorities.
Board staff provided a presentation at the Physicians’ Well-Being Conference on the Board’s enforcement process and the physician health and wellness program implementation process.
Board staff provided a presentation at the California Association of Medical Staff Services Annual Education Forum.
Board Secretary and Board staff provided a presentation at Loma Linda University on the Board’s enforcement process.
Board staff and representatives from the Attorney General’s Office and HQIU met with the Enforcement Committee Chair to discuss the Board’s enforcement process and to identify improvements.
Board staff provided a presentation to the California Conference of Local Health Officers on the Board’s enforcement process.
Board staff continues to meet with representatives from the CDPH, the Board of Pharmacy, Dental Board, the DHCS, DOJ, the Emergency Medical Services Authority, DCA, and other interested parties regarding prescription opioid misuse and overdose. The group is identifying ways all the entities can work together to educate prescribers, dispensers, and patients regarding this issue of serious concern.
Staffing Update The Board has 163.6 permanent full-time positions (in addition to temporary staff). The Board is at an 11% vacancy rate which equates to 18 vacant positions. This is higher than the 9% vacancy rate that was
BRD 20A - 1

Administrative Summary July 11, 2017 Page 2
Agenda Item 20A
provided in the last administrative summary. However, there are three individuals who are going through the eligibility process, which would reduce the vacancy rate to 9%. Management will be working to fill these positions as soon as possible.
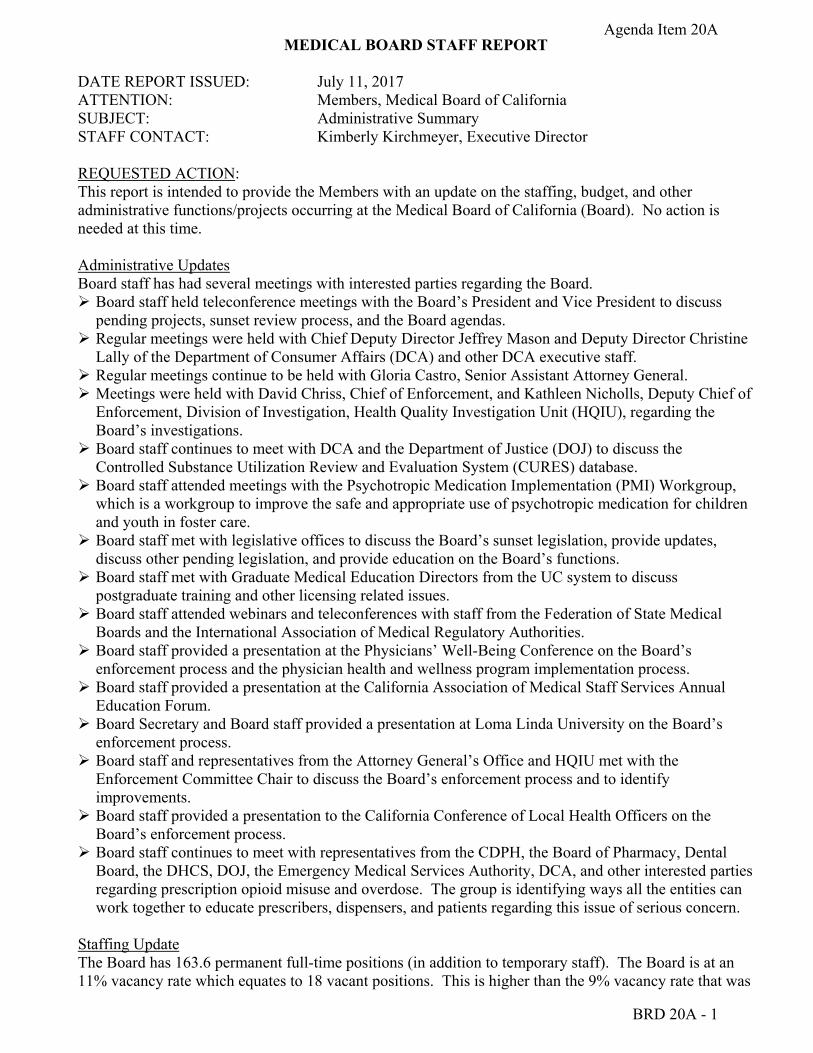
Budget Update The Board’s budget documents are attached, beginning on page BRD 20A-4 and continuing to page BRD 20A-16. BRD 20A-4 contains an excerpt of the budget that was signed by the Governor, which specifically identifies the Board’s budget for FY 17-18. Included in the FY 17-18 budget are four budget change proposals (BCP) that were approved, which impact the Board. The first BCP is to add two additional enforcement staff in the Central Complaint Unit. The funding for these positions is $187,000 for FY 17-18 and $161,000 in going fiscal years. The second BCP is to implement the Board’s Physician Health and Wellness Program pursuant to SB 1177 (Galgiani, Chapter 591), which was approved for $114,000 in FY 17-18 and $356,000 in ongoing fiscal years. The third and fourth BCPs were submitted by the DCA and were for $132,000 for the DCA’s SOLID unit and $2.235 million for the BreEZe database. The BreEZe BCP also included funding for FY 18-19 and FY 19-20.
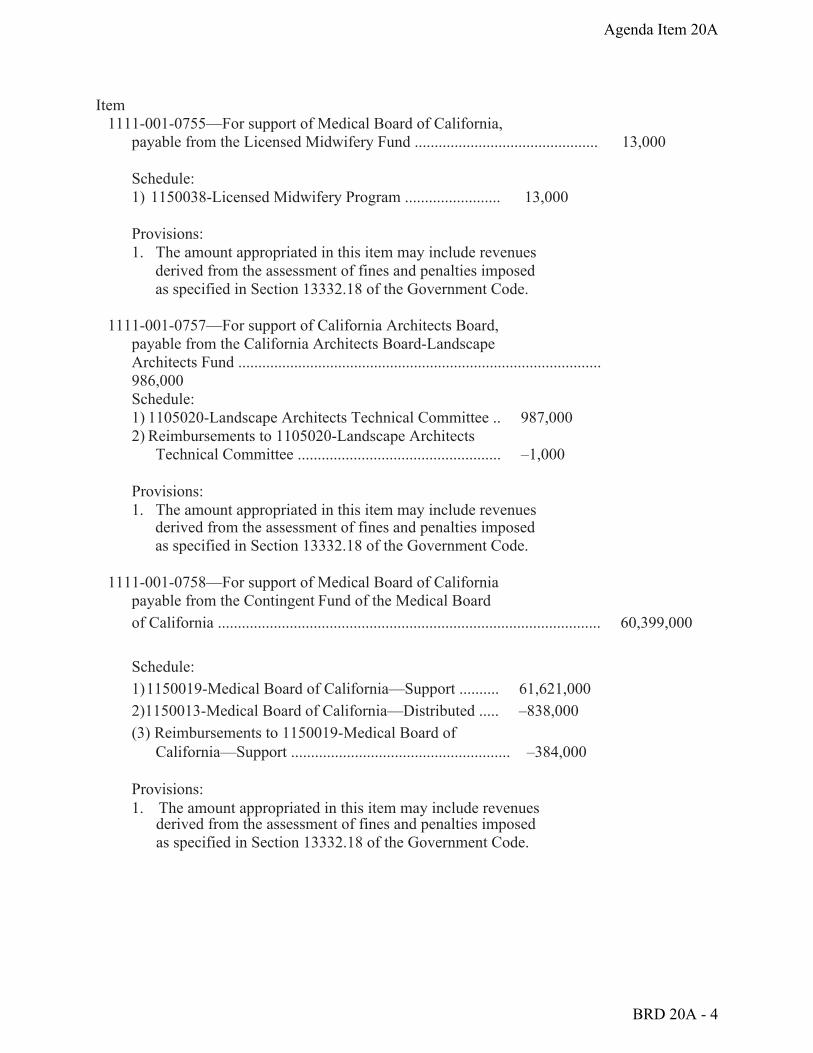
BRD 20A-5 is the Board’s fund condition, which identifies the Board's fund reserve at 4.8 months at the end of FY 16-17. The Board is awaiting confirmation that its $6 million outstanding loan was repaid in FY 16-17.
With the full repayment of the outstanding loans, which are scheduled but have not taken place, and taking into consideration future anticipated costs, the Board’s fund reserve is scheduled to be within its mandated level in FY 18-19. Board staff will be closely monitoring the Board’s budget to determine whether future changes are needed. As indicated by both fund conditions, it would not be prudent at this time to consider any reduction in licensing fees as previously recommended by the Bureau of State Audits because the Board anticipates being within its mandatory level at the end of FY 18-19. In addition, the Board has future costs that could impact the Board’s budget should they be approved.
The Board’s overall actual expenditures for FY 16-17 through May 31, 2017, can be found on page BRD 20A-7. Pages BRD 20A-8 to 20A-12 provide the budget report, specifically for licensing, enforcement, the HQIU, and the AG expenditures. Page BRD 20A-16 provides the Board Members’ expenditure report as of July 11, 2017.
BreEZe/License Lookup Update Board staff continues to submit requests for changes/fixes to DCA for the BreEZe system. The DCA is currently working on a new license lookup system that will be more user-friendly. Board staff is assisting in the development of this system. In addition, Board staff will begin testing for this new system in July. This new system is scheduled to be released in September 2017.
Controlled Substance Utilization Review and Evaluation System (CURES) Update As of June 15, 2017, there were 91,407 physicians registered in the CURES 2.0 system. In addition, between May 15 and June 15, 2017, physicians requested 264,673 patient activity reports from the CURES 2.0 system.
Board staff are working on a pamphlet for physicians regarding the use of CURES. This would provide information on how to use the CURES 2.0 system and what to do with the information once a CURES query has been completed. Board staff will work with subject matter experts and other stakeholders to provide this educational document.
BRD 20A - 2

Administrative Summary July 11, 2017 Page 3
Agenda Item 20A
Prescribing Psychotropic Medications to Foster Children The Board continues to have telephone conferences with staff from the DSS and the counties to identify a means to obtain the patient medical records in order for the Board to investigate the physician who may be inappropriately prescribing to foster care children. Without the authorization for the medical records, the Board cannot move forward with investigating these matters.
Update on the Federation of State Medical Boards On July 6, 2017, the Federation of State Medical Boards (FSMB) released a comprehensive summary and recommendations from a summit meeting it hosted to discuss how diverse organizations compile and share information about health care practitioners – including unprofessional conduct and disciplinary issues – and how such information could be better utilized to protect the public. A copy of that report can be found on pages BRD 20G-1 to 15.
End of Life Option Act On June 27, 2017, The California Department of Public Health (CDPH) released the 2016 End of Life Option Act (Act) first Annual Report. The Act required CDPH to provide annual reports, including information on the number of prescriptions written and the number of known individuals who died using aid-in-dying drugs. Additionally, the report includes demographic information on these individuals, including age and underlying illness. A copy of that report can be found on pages BRD 20A 17-23.
BRD 20A - 3
Agenda Item 20A
Item 1111-001-0755—For support of Medical Board of California,
payable from the Licensed Midwifery Fund .............................................. 13,000
Schedule: 1) 1150038-Licensed Midwifery Program ........................ 13,000
Provisions:1. The amount appropriated in this item may include revenues
derived from the assessment of fines and penalties imposedas specified in Section 13332.18 of the Government Code.
1111-001-0757—For support of California Architects Board,payable from the California Architects Board-Landscape Architects Fund ........................................................................................... 986,000Schedule: 1) 1105020-Landscape Architects Technical Committee .. 987,0002) Reimbursements to 1105020-Landscape Architects
Technical Committee ................................................... –1,000
Provisions:1. The amount appropriated in this item may include revenues
derived from the assessment of fines and penalties imposedas specified in Section 13332.18 of the Government Code.
1111-001-0758—For support of Medical Board of Californiapayable from the Contingent Fund of the Medical Board of California ................................................................................................ 60,399,000
Schedule:1) 1150019-Medical Board of California—Support .......... 61,621,000 2) 1150013-Medical Board of California—Distributed ..... –838,000(3) Reimbursements to 1150019-Medical Board of
California—Support ....................................................... –384,000
Provisions:1. The amount appropriated in this item may include revenues
derived from the assessment of fines and penalties imposed as specified in Section 13332.18 of the Government Code.
BRD 20A - 4
Agenda Item 20A
0758 - Medical Board Analysis of Fund Condition (Dollars in Thousands) Fund Condition with General Fund Loan Repayments
ACTUAL CY BY BY+1 BY+2 2015-16 2016-17 2017-18 2018-19 2019-20
BEGINNING BALANCE $ 28,087 $ 27,001 $ 25,438 $ 28,000 $ 20,173 Prior Year Adjustment $ 282 $ - $ - $ - $ -
Adjusted Beginning Balance $ 28,369 $ 27,001 $ 25,438 $ 28,000 $ 20,173
REVENUES, TRANSFERS AND OTHER ADJUSTMENTS Revenues:
125600 Other regulatory fees $ 385 $ 388 $ 388 $ 388 $ 388 125700 Other regulatory licenses and permits $ 7,388 $ 7,194 $ 7,194 $ 7,194 $ 7,194 125800 Renewal fees $ 48,728 $ 47,828 $ 48,799 $ 48,799 $ 48,799 125900 Delinquent fees $ 124 $ 136 $ 136 $ 136 $ 136 141200 Sales of documents $ 25 $ 10 $ 10 $ 10 $ 10 142500 Miscellaneous services to the public $ - $ - $ - $ - $ -150300 Income from surplus money investments $ 139 $ 101 $ 112 $ 76 $ 76 150500 Interest from interfund loans $ - $ 1,234 $ 226 $ - $ -160400 Sale of fixed assets $ - $ - $ - $ - $ -160800 Escheat of unclaimed property $ - $ - $ - $ - $ -161000 Escheat of unclaimed checks and warrants $ 24 $ - $ - $ - $ -161400 Miscellaneous revenues $ 3 $ - $ - $ - $ -164300 Penalty assessments $ - $ - $ - $ - $ -
Totals, Revenues $ 56,816 $ 56,891 $ 56,865 $ 56,603 $ 56,603
Transfers and Other Adjustments: Proposed GF Loan Repayment (Budget Act of 2008) $ - $ 6,000 $ - $ - $ -Proposed GF Loan Repayment (Budget Act of 2011) $ - $ - $ 9,000 $ - $ -
TOTALS, REVENUES, TRANSFERS AND OTHER ADJUSTMENTS $ 56,816 $ 62,891 $ 65,865 $ 56,603 $ 56,603
TOTAL RESOURCES $ 85,185 $ 89,892 $ 91,303 $ 84,603 $ 76,776
EXPENDITURES AND EXPENDITURE ADJUSTMENTS Expenditures:
1111 Program Expenditures (State Operations) $ 58,077 $ 59,024 $ 56,882 $ 57,779 $ 58,933
2016-17 and Ongoing Approved Costs BreEZe Costs $ - $ 2,403 $ - $ - $ -Staff Augmentation $ - $ 113 $ 105 $ 105 $ 105 Expert Reviewer $ - $ 206 $ 206 $ 206 $ 206 Registered Dispensing Opticians $ - $ (39) $ (39) $ (39) $ (39) Department of Justice $ - $ 577 $ 577 $ 577 $ 577
Approved Future Costs Staff Augmentation - Enforcement $ - $ - $ 187 $ 161 $ 161 Implement SB 1177 $ - $ - $ 114 $ 356 $ 356 BreEZe Costs $ - $ - $ 2,235 $ 2,342 $ 1,188 SOLID $ - $ - $ 132 $ 120 $ 120
1111 Program Expenditures (State Operations) Subtotal $ 58,077 $ 62,284 $ 60,399 $ 61,607 $ 61,607
Expenditure Adjustments: 0840 State Controller (State Operations) $ - $ - $ - $ - $ -8880 Financial Information System for California (State Operations) $ 107 $ 77 $ 81 $ - $ -9900 Statewide Pro Rata $ - $ 2,993 $ 3,723 $ 3,723 $ 3,723
TOTALS, EXPENDITURES AND EXPENDITURE ADJUSTMENTS $ 58,184 $ 65,354 $ 64,203 $ 65,330 $ 65,330
Unscheduled Reimbursements $ - $ 900 $ 900 $ 900 $ 900
FUND BALANCE Reserve for economic uncertainties $ 27,001 $ 25,438 $ 28,000 $ 20,173 $ 12,346
Months in Reserve 5.0 4.8 5.1 3.7 2.3
NOTES: A. Assumes workload and revenue projections are realized for FY 16/17 and beyond. B. Interest on fund estimated at .382%. C. $6 million was loaned to the General Fund in FY 08/09 and $9 million was loaned to the General Fund by the Board in FY 11/12.
$6 million will be repaid in FY 16/17 and $9 million in FY 17/18. If partial payment is made, the remainder will be paid when the fund is nearing its minimum mandated level. D. The Financial Information System for California is a direct assessment which reduces the fund balance but is not reflected in the Medical Board of California's state operational budget. E. Unscheduled reimbursements result in a net increase in the fund balance.
BRD 20A - 5
Agenda Item 20A
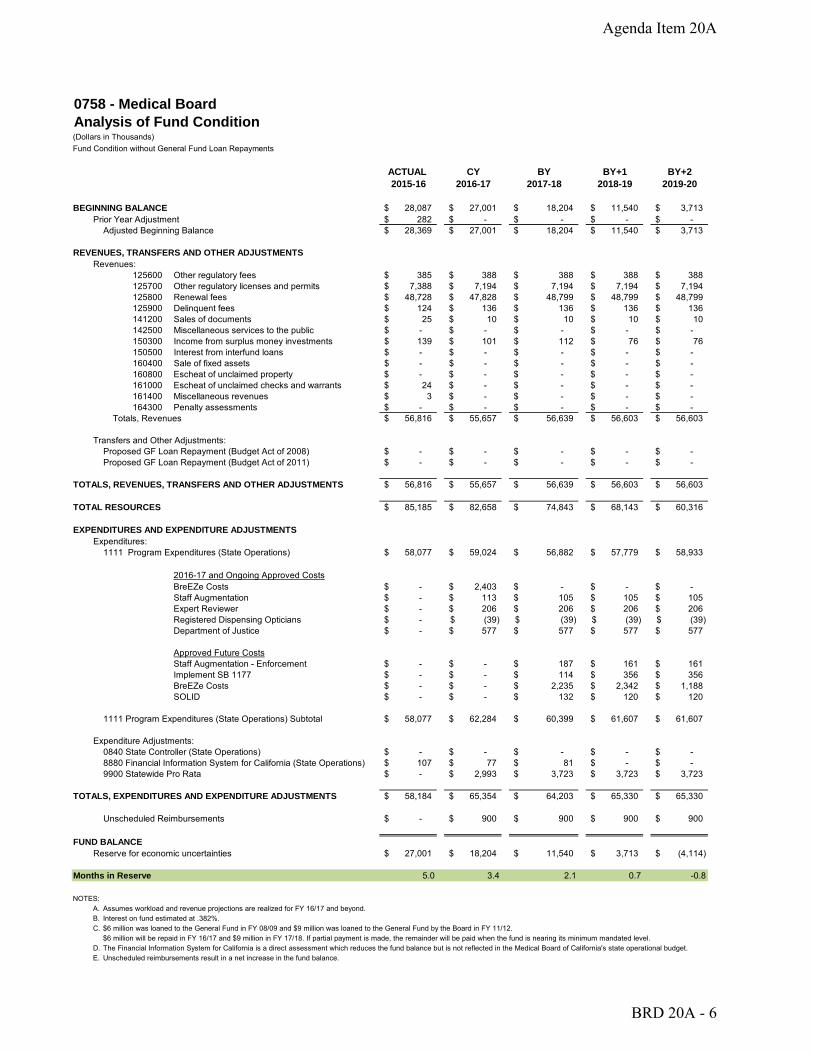
0758 - Medical Board Analysis of Fund Condition (Dollars in Thousands) Fund Condition without General Fund Loan Repayments
ACTUAL CY BY BY+1 BY+2 2015-16 2016-17 2017-18 2018-19 2019-20
BEGINNING BALANCE $ 28,087 $ 27,001 $ 18,204 $ 11,540 $ 3,713 Prior Year Adjustment $ 282 $ - $ - $ - $ -
Adjusted Beginning Balance $ 28,369 $ 27,001 $ 18,204 $ 11,540 $ 3,713
REVENUES, TRANSFERS AND OTHER ADJUSTMENTS Revenues:
125600 Other regulatory fees $ 385 $ 388 $ 388 $ 388 $ 388 125700 Other regulatory licenses and permits $ 7,388 $ 7,194 $ 7,194 $ 7,194 $ 7,194 125800 Renewal fees $ 48,728 $ 47,828 $ 48,799 $ 48,799 $ 48,799 125900 Delinquent fees $ 124 $ 136 $ 136 $ 136 $ 136 141200 Sales of documents $ 25 $ 10 $ 10 $ 10 $ 10 142500 Miscellaneous services to the public $ - $ - $ - $ - $ -150300 Income from surplus money investments $ 139 $ 101 $ 112 $ 76 $ 76 150500 Interest from interfund loans $ - $ - $ - $ - $ -160400 Sale of fixed assets $ - $ - $ - $ - $ -160800 Escheat of unclaimed property $ - $ - $ - $ - $ -161000 Escheat of unclaimed checks and warrants $ 24 $ - $ - $ - $ -161400 Miscellaneous revenues $ 3 $ - $ - $ - $ -164300 Penalty assessments $ - $ - $ - $ - $ -
Totals, Revenues $ 56,816 $ 55,657 $ 56,639 $ 56,603 $ 56,603
Transfers and Other Adjustments: Proposed GF Loan Repayment (Budget Act of 2008) $ - $ - $ - $ - $ -Proposed GF Loan Repayment (Budget Act of 2011) $ - $ - $ - $ - $ -
TOTALS, REVENUES, TRANSFERS AND OTHER ADJUSTMENTS $ 56,816 $ 55,657 $ 56,639 $ 56,603 $ 56,603
TOTAL RESOURCES $ 85,185 $ 82,658 $ 74,843 $ 68,143 $ 60,316
EXPENDITURES AND EXPENDITURE ADJUSTMENTS Expenditures:
1111 Program Expenditures (State Operations) $ 58,077 $ 59,024 $ 56,882 $ 57,779 $ 58,933
2016-17 and Ongoing Approved Costs BreEZe Costs $ - $ 2,403 $ - $ - $ -Staff Augmentation $ - $ 113 $ 105 $ 105 $ 105 Expert Reviewer $ - $ 206 $ 206 $ 206 $ 206 Registered Dispensing Opticians $ - $ (39) $ (39) $ (39) $ (39) Department of Justice $ - $ 577 $ 577 $ 577 $ 577
Approved Future Costs Staff Augmentation - Enforcement $ - $ - $ 187 $ 161 $ 161 Implement SB 1177 $ - $ - $ 114 $ 356 $ 356 BreEZe Costs $ - $ - $ 2,235 $ 2,342 $ 1,188 SOLID $ - $ - $ 132 $ 120 $ 120
1111 Program Expenditures (State Operations) Subtotal $ 58,077 $ 62,284 $ 60,399 $ 61,607 $ 61,607
Expenditure Adjustments: 0840 State Controller (State Operations) $ - $ - $ - $ - $ -8880 Financial Information System for California (State Operations) $ 107 $ 77 $ 81 $ - $ -9900 Statewide Pro Rata $ - $ 2,993 $ 3,723 $ 3,723 $ 3,723
TOTALS, EXPENDITURES AND EXPENDITURE ADJUSTMENTS $ 58,184 $ 65,354 $ 64,203 $ 65,330 $ 65,330
Unscheduled Reimbursements $ - $ 900 $ 900 $ 900 $ 900
FUND BALANCE Reserve for economic uncertainties $ 27,001 $ 18,204 $ 11,540 $ 3,713 $ (4,114)
Months in Reserve 5.0 3.4 2.1 0.7 -0.8
NOTES: A. Assumes workload and revenue projections are realized for FY 16/17 and beyond. B. Interest on fund estimated at .382%. C. $6 million was loaned to the General Fund in FY 08/09 and $9 million was loaned to the General Fund by the Board in FY 11/12.
$6 million will be repaid in FY 16/17 and $9 million in FY 17/18. If partial payment is made, the remainder will be paid when the fund is nearing its minimum mandated level. D. The Financial Information System for California is a direct assessment which reduces the fund balance but is not reflected in the Medical Board of California's state operational budget. E. Unscheduled reimbursements result in a net increase in the fund balance.
BRD 20A - 6

Agenda Item 20A
Medical Board of California Fiscal Year 2016-17
Budget Expenditure Report (As of May 31, 2017)
(92% of fiscal year completed)
PERCENT OF BUDGET EXPENDITURES / BUDGET UNENCUMBERED
OBJECT DESCRIPTION ALLOTMENT ENCUMBRANCES EXPEND / ENCUMB BALANCE
PERSONAL SERVICES Salary & Wages (Staff & Exec Director) 10,007,000 8,078,209 80.7 1,928,791
Board Members 32,000 100,200 313.1 (68,200) Temp Help 138,500 445,970 322.0 (307,470) BL 12-03 Blanket 617,500 816,342 132.2 (198,842) Overtime 44,000 44,275 100.6 (275)
Staff Benefits 5,476,000 4,807,816 87.8 668,184 TOTALS, PERS SERVICES 16,315,000 14,292,812 87.6 2,022,188
OPERATING EXP & EQUIP General Expense 79,000 248,548 314.6 (169,548) Fingerprint Reports 333,000 327,275 98.3 5,725 Printing 196,000 274,387 140.0 (78,387) Communications 107,000 104,747 97.9 2,254 Postage 151,000 90,425 59.9 60,575 Insurance 2,000 8,724 436.2 (6,724) Travel In-State 131,000 137,015 104.6 (6,015) Travel Out-of-State 0 7,150 0.0 (7,150) Training 57,000 4,436 7.8 52,564 Facilities Operation (Rent) 932,000 1,039,864 111.6 (107,864) Consult/Prof Services 1,290,500 1,159,941 89.9 130,559 Departmental Prorata 6,416,000 5,735,598 89.4 680,402
HQIU 18,395,000 15,478,402 84.1 2,916,598 Consolidated Data Center 650,000 122,773 18.9 527,227 Data Processing 117,000 126,000 107.7 (9,000) Major Equipment 163,000 38,483 23.6 124,517 Other Items of Expense 0 0 0.0 0 Vehicle Operations 32,000 16,246 50.8 15,755 Attorney General Services 13,924,000 13,244,242 95.1 679,758 Office of Administrative Hearings 1,750,000 1,547,183 88.4 202,817 Evidence/Witness 2,099,000 1,768,716 84.3 330,284 Court Reporter Services 251,500 110,211 43.8 141,289 Minor Equipment 115,000 205,833 179.0 (90,833) Special Items of Expense 0 0 0.0 0
TOTALS, OE&E 47,191,000 41,796,199 88.6 5,394,801
TOTALS, EXPENDITURES 63,506,000 56,089,011 88.3 7,416,989
Scheduled Reimbursements (384,000) (360,666) 93.9 (23,334) Distributed Costs (838,000) (417,795) 49.9 (420,205)
TOTAL PROGRAM EXPEND (STATE OPERATIONS) 62,284,000 55,310,550 88.8 6,973,449 Fi$Cal Expenditures 77,000 70,583 91.7 6,417 Statewide Pro Rata Expenditures 2,993,000 2,743,583 91.7 249,417 TOTAL WITH Fi$Cal AND PRO RATA 65,354,000 58,124,716 88.9 7,229,283
Unscheduled Reimbursements* (1,738,330) 56,386,386
* no authority to spend
BRD 20A - 7

Agenda Item 20A
Medical Board of California Fiscal Year 2016-17
Budget Expenditure Report - Licensing (As of May 31, 2017)
(92% of fiscal year completed)
PERCENT OF BUDGET EXPENDITURES / BUDGET UNENCUMBERED
OBJECT DESCRIPTION ALLOTMENT ENCUMBRANCES EXPEND / ENCUMB BALANCE
PERSONAL SERVICES Salary & Wages
(Staff & Exec Director) 2,882,400 2,326,795 80.7 555,605 Board Members 0 0 0.0 0 Temp Help 37,200 301,681 811.0 (264,481) BL 12-03 Blanket 110,000 148,591 135.1 (38,591)
Overtime 14,400 12,016 83.4 2,384 Staff Benefits 1,528,900 1,419,647 92.9 109,253 TOTALS, PERS SERVICES 4,572,900 4,208,730 92.0 364,170
OPERATING EXP & EQUIP General Expense 7,300 26,881 368.2 (19,581) Fingerprint Reports 333,000 326,349 98.0 6,651 Printing 73,000 103,721 142.1 (30,721) Communications 19,100 18,412 96.4 688 Postage 82,700 44,010 53.2 38,690 Insurance 0 91 0.0 (91) Travel In-State 18,000 17,522 97.3 478
Travel Out-of-State 0 0 0.0 0 Training 18,900 303 1.6 18,597 Facilities Operation (Rent) 305,400 328,340 107.5 (22,940) Consult/Prof Services 1,249,400 1,033,051 82.7 216,349 Departmental Prorata 1,243,300 1,097,217 88.3 146,083
HQIU 0 0 0.0 0 Consolidated Data Center 0 0 0.0 0 Data Processing 3,900 10,630 272.6 (6,730) Major Equipment 0 0 0.0 0 Other Items of Expense 0 0 0.0 0 Vehicle Operations 0 0 0.0 0 Attorney General Services 39,500 31,502 79.8 7,998 Office of Administrative Hearings 0 0 0.0 0 Evidence/Witness 0 881 0.0 (881) Court Reporter Services 0 0 0.0 0 Minor Equipment 0 223 0.0 (223) Special Items of Expense 0 0 0.0 0
TOTALS, OE&E 3,393,500 3,039,133 89.6 354,367
TOTALS, EXPENDITURES 7,966,400 7,247,863 91.0 718,537
Scheduled Reimbursements (384,000) (360,666) 93.9 (23,334) Distributed Costs (28,000) (38,210) 136.5 10,210
TOTAL PROGRAM EXPEND (STATE OPERATIONS) 7,554,400 6,848,987 90.7 705,413 Fi$Cal Expenditures 14,732 13,505 91.7 1,228 Statewide Pro Rata Expenditures 572,646 524,925 91.7 47,720 TOTAL WITH Fi$Cal AND PRO RATA 8,141,778 7,387,417 90.7 754,361
Unscheduled Reimbursements* 0 7,387,417
* no authority to spend
BRD 20A - 8
Agenda Item 20A
Medical Board of California Fiscal Year 2016-17
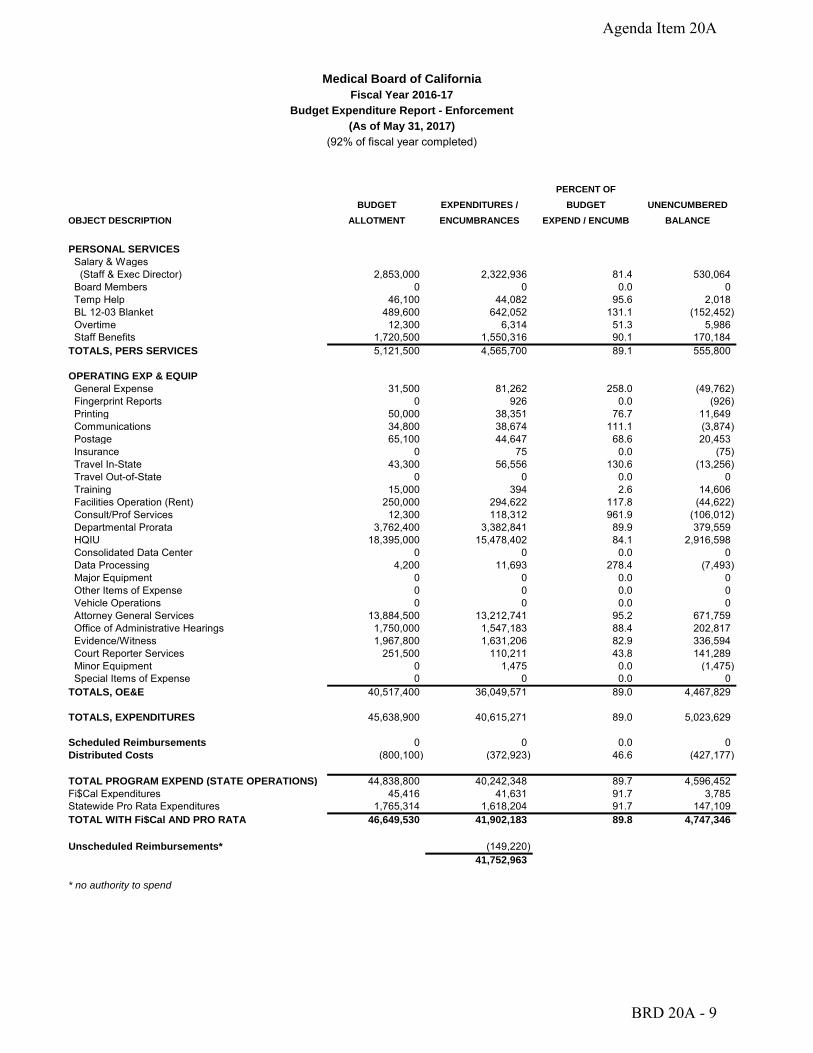
Budget Expenditure Report - Enforcement (As of May 31, 2017)
(92% of fiscal year completed)
PERCENT OF BUDGET EXPENDITURES / BUDGET UNENCUMBERED
OBJECT DESCRIPTION ALLOTMENT ENCUMBRANCES EXPEND / ENCUMB BALANCE
PERSONAL SERVICES Salary & Wages
(Staff & Exec Director) 2,853,000 2,322,936 81.4 530,064 Board Members 0 0 0.0 0 Temp Help 46,100 44,082 95.6 2,018 BL 12-03 Blanket 489,600 642,052 131.1 (152,452)
Overtime 12,300 6,314 51.3 5,986 Staff Benefits 1,720,500 1,550,316 90.1 170,184 TOTALS, PERS SERVICES 5,121,500 4,565,700 89.1 555,800
OPERATING EXP & EQUIP General Expense 31,500 81,262 258.0 (49,762) Fingerprint Reports 0 926 0.0 (926) Printing 50,000 38,351 76.7 11,649 Communications 34,800 38,674 111.1 (3,874) Postage 65,100 44,647 68.6 20,453 Insurance 0 75 0.0 (75) Travel In-State 43,300 56,556 130.6 (13,256)
Travel Out-of-State 0 0 0.0 0 Training 15,000 394 2.6 14,606 Facilities Operation (Rent) 250,000 294,622 117.8 (44,622) Consult/Prof Services 12,300 118,312 961.9 (106,012) Departmental Prorata 3,762,400 3,382,841 89.9 379,559
HQIU 18,395,000 15,478,402 84.1 2,916,598 Consolidated Data Center 0 0 0.0 0 Data Processing 4,200 11,693 278.4 (7,493) Major Equipment 0 0 0.0 0 Other Items of Expense 0 0 0.0 0 Vehicle Operations 0 0 0.0 0 Attorney General Services 13,884,500 13,212,741 95.2 671,759 Office of Administrative Hearings 1,750,000 1,547,183 88.4 202,817 Evidence/Witness 1,967,800 1,631,206 82.9 336,594 Court Reporter Services 251,500 110,211 43.8 141,289 Minor Equipment 0 1,475 0.0 (1,475) Special Items of Expense 0 0 0.0 0
TOTALS, OE&E 40,517,400 36,049,571 89.0 4,467,829
TOTALS, EXPENDITURES 45,638,900 40,615,271 89.0 5,023,629
Scheduled Reimbursements 0 0 0.0 0 Distributed Costs (800,100) (372,923) 46.6 (427,177)
TOTAL PROGRAM EXPEND (STATE OPERATIONS) 44,838,800 40,242,348 89.7 4,596,452 Fi$Cal Expenditures 45,416 41,631 91.7 3,785 Statewide Pro Rata Expenditures 1,765,314 1,618,204 91.7 147,109 TOTAL WITH Fi$Cal AND PRO RATA 46,649,530 41,902,183 89.8 4,747,346
Unscheduled Reimbursements* (149,220) 41,752,963
* no authority to spend
BRD 20A - 9

Agenda Item 20A
Health Quality Investigation Unit (HQIU) Fiscal Year 2016-17
Budget Expenditure Report (As of May 31, 2017)
(92% of fiscal year completed)
PERCENT OF BUDGET EXPENDITURES / BUDGET UNENCUMBERED
OBJECT DESCRIPTION ALLOTMENT ENCUMBRANCES EXPEND / ENCUMB BALANCE
PERSONAL SERVICES Salary & Wages 8,986,000 5,918,631 65.9 3,067,369 Temp Help 1,074,000 1,980,804 184.4 (906,804) Overtime 6,000 126,566 2109.4 (120,566)
Staff Benefits 5,142,000 3,986,479 77.5 1,155,521 BL 12-03 Blanket 0 7,773 0.0 (7,773)
TOTALS, PERS SERVICES 15,208,000 12,020,253 79.0 3,187,747
OPERATING EXP & EQUIP General Expense 214,000 242,394 113.3 (28,394) Printing 69,000 109,737 159.0 (40,737) Communications 172,000 97,616 56.8 74,384 Postage 36,000 26,511 73.6 9,489 Insurance 38,000 57,850 152.2 (19,850) Travel In-State 222,000 115,736 52.1 106,264 Travel Out-of-State 7,000 0 0.0 7,000 Training 27,000 27,265 101.0 (265) Facilities Operation (Rent) 1,574,000 1,510,617 96.0 63,383 Consult/Prof Services 91,000 82,240 90.4 8,760 Departmental Prorata 0 0 0.0 0 Consolidated Data Center 15,000 207,803 1385.4 (192,803) Data Processing 0 109,026 0.0 (109,026) Central Admin Svcs (Statewide Prorata) 0 0 0.0 0 Major Equipment 363,000 0 0.0 363,000 Other Items of Expense 28,000 141,321 504.7 (113,321) Vehicle Operations 216,000 168,568 78.0 47,432 Attorney General Services 0 0 0.0 0 Office of Administrative Hearings 0 0 0.0 0 Evidence/Witness 0 5,089 0.0 (5,089) Court Reporter Services 0 322,664 0.0 (322,664) Minor Equipment 115,000 195,974 170.4 (80,974) Special Items of Expense 0 37,738 0.0 (37,738)
TOTALS, OE&E 3,187,000 3,458,149 108.5 (271,149)
TOTALS, EXPENDITURES 18,395,000 15,478,402 84.1 2,916,598
Scheduled Reimbursements 0 0 0.0 0 Distributed Costs 0 0 0.0 0
NET TOTAL, EXPENDITURES 18,395,000 15,478,402 84.1 2,916,598 Unscheduled Reimbursements* 0 0 0.0 0
* no authority to spend
BRD 20A - 10

Number of Hours Rate Amount
July Attorney Services 5863.75 $170.00 $996,837.50 Paralegal Services 300.25 $120.00 $36,030.00 Auditor/Analyst Services 171.50 $99.00 $16,978.50 Special Agent 0.00 $120.00 $0.00 Cost of Suit $0.00
$1,049,846.00
August Attorney Services 7020.75 $170.00 $1,193,527.50 Paralegal Services 278.50 $120.00 $33,420.00 Auditor/Analyst Services 270.75 $99.00 $26,804.25 Special Agent 0.00 $120.00 $0.00 Cost of Suit $1,828.35
$1,255,580.10
September Attorney Services 6676.00 $170.00 $1,134,920.00 Paralegal Services 298.75 $120.00 $35,850.00 Auditor/Analyst Services 243.50 $99.00 $24,106.50 Special Agent 0.00 $120.00 $0.00 Cost of Suit $783.20
$1,195,659.70
October Attorney Services 6821.50 $170.00 $1,159,655.00 Paralegal Services 304.25 $120.00 $36,510.00 Auditor/Analyst Services 210.75 $99.00 $20,864.25 Special Agent 0.00 $120.00 $0.00 Cost of Suit $1,397.25
$1,218,426.50
November Attorney Services 5989.25 $170.00 $1,018,172.50 Paralegal Services 522.75 $120.00 $62,730.00 Auditor/Analyst Services 126.25 $99.00 $12,498.75 Special Agent 0.00 $120.00 $0.00 Cost of Suit $2,843.75
$1,096,245.00
December Attorney Services 5983.25 $170.00 $1,017,152.50 Paralegal Services 527.75 $120.00 $63,330.00 Auditor/Analyst Services 106.25 $99.00 $10,518.75 Special Agent 0.00 $120.00 $0.00 Cost of Suit $0.00
$1,091,001.25
Agenda Item 20A
MEDICAL BOARD OF CALIFORNIA ATTORNEY GENERAL EXPENDITURES - FY 2016-17 DOJ AGENCY CODE 003573 - ENFORCEMENT (6303) Page 1 of 2
Total July-Dec = $6,906,758.55 FY 2016-17 Budget = $13,884,500.00
BRD 20A - 11

Number of Hours Rate Amount
January Attorney Services 6890.25 $170.00 $1,171,342.50 Paralegal Services 628.75 $120.00 $75,450.00 Auditor/Analyst Services 145.75 $99.00 $14,429.25 Special Agent 0.00 $120.00 $0.00 Cost of Suit $6,903.40
$1,268,125.15
February Attorney Services 6188.00 $170.00 $1,051,960.00 Paralegal Services 678.00 $120.00 $81,360.00 Auditor/Analyst Services 131.50 $99.00 $13,018.50 Special Agent 0.00 $120.00 $0.00 Cost of Suit $3,429.90
$1,149,768.40
March Attorney Services 7389.25 $170.00 $1,256,172.50 Paralegal Services 895.25 $120.00 $107,430.00 Auditor/Analyst Services 114.00 $99.00 $11,286.00 Special Agent 0.00 $120.00 $0.00 Cost of Suit $14,880.47
$1,389,768.97
April Attorney Services 6553.00 $170.00 $1,114,010.00 Paralegal Services 620.25 $120.00 $74,430.00 Auditor/Analyst Services 104.25 $99.00 $10,320.75 Special Agent 0.00 $120.00 $0.00 Cost of Suit $10,354.35
$1,209,115.10
May Attorney Services 6893.00 $170.00 $1,171,810.00 Paralegal Services 759.50 $120.00 $91,140.00 Auditor/Analyst Services 110.25 $99.00 $10,914.75 Special Agent 0.00 $120.00 $0.00 Cost of Suit $15,339.80
$1,289,204.55
June Attorney Services 0.00 $170.00 $0.00 Paralegal Services 0.00 $120.00 $0.00 Auditor/Analyst Services 0.00 $99.00 $0.00 Special Agent 0.00 $120.00 $0.00 Cost of Suit $0.00
$0.00
Agenda Item 20A
MEDICAL BOARD OF CALIFORNIA ATTORNEY GENERAL EXPENDITURES - FY 2016-17 DOJ AGENCY CODE 003573 - ENFORCEMENT (6303) page 2 of 2
FYTD Total = $13,212,740.72 FY 2016-17 Budget = $13,884,500.00
BRD 20A - 12

Invest Cost Recovery Criminal Cost Recovery Probation Monitoring Exam Cite/Fine
MONTHLY TOTAL
FYTD TOTAL
Invest Cost Recovery Criminal Cost Recovery Probation Monitoring Exam Cite/Fine
MONTHLY TOTAL
FYTD TOTAL
Invest Cost Recovery
Jul-14 Aug-14 Sep-14 Oct-14 Nov-14 Dec-14 Jan-15 Feb-15 Mar-15 Apr-15 May-15 Jun-15 FYTD Total
0 844
64,316 9,061 3,000
50 29,175 41,643 3,048 3,000
50 4,060
52,840 7,438 1,000
850 13,683 73,499 13,718 5,000
0 15,041 56,938 26,715
0
850 1,185
146,603 8,551
0
800 1,133
414,557 13,313
0
500 6,184
227,809 7,060
0
100 1,499
117,226 6,755 2,500
50 7,009
60,897 8,796
0
1,963 1,194
46,859 3,273
0
600 3,284
47,974 600
2,500
5,813 84,291
1,351,161 108,328 17,000
77,221 76,916 65,388 106,750 98,694 157,189 429,803 241,553 128,080 76,752 53,289 54,958 1,566,593
77,221
Jul-15
154,137
Aug-15
219,525
Sep-15
326,275
Oct-15
424,969
Nov-15
582,158
Dec-15
1,011,961
Jan-16
1,253,514
Feb-16
1,381,594
Mar-16
1,458,346
Apr-16
1,511,635
May-16
1,566,593
Jun-16 FYTD Total
50 451
74,221 9,593
0
50 4,851
54,139 5,778
0
50 7,581
42,860 1,922
0
50 1,100
44,930 16,948
0
0 1,400
62,069 5,721
0
100 2,400
102,916 11,506
0
0 3,188
359,823 10,926 2,500
50 4,607
222,613 16,650
700
100 551
91,728 6,225 5,000
0 4,789
64,230 10,617 2,850
100 551
68,510 8,165 1,050
50 27,916 46,889 8,705 6,850
600 59,385
1,234,928 112,756 18,950
84,315 64,818 52,413 63,028 69,190 116,922 376,437 244,620 103,604 82,486 78,376 90,410 1,426,619
84,315
Jul-16
149,133
Aug-16
201,546
Sep-16
264,574
Oct-16
333,764
Nov-16
450,686
Dec-16
827,123
Jan-17
1,071,743
Feb-17
1,175,347
Mar-17
1,257,833
Apr-17
1,336,209
May-17
1,426,619
Jun-17 FYTD Total
0 100 2,050 50 50 50 50 50 15,050 0 1,192 18,642 Criminal Cost Recovery 181 6,225 100 50 450 50 2,050 350 50 9,025 1,200 19,731 Probation Monitoring 57,451 50,482 52,323 53,240 42,615 115,898 232,212 163,281 67,638 74,923 38,963 949,026 Exam 5,087 7,610 7,228 11,875 8,187 7,675 870 14,037 10,870 3,355 4,275 81,069 Cite/Fine
MONTHLY TOTAL
FYTD TOTAL
3,500 1,400 3,000 11,150 7,100 5,600 4,900 5,550 5,550 4,275 7,740 59,765 66,219 65,817 64,701 76,365 58,402 129,273 240,082 183,268 99,158 91,578 53,370 0 1,128,233
66,219 132,036 196,737 273,102 331,504 460,777 700,859 884,127 983,285 1,074,863 1,128,233 1,128,233
Agenda Item 20A
ENFORCEMENT/PROBATION RECEIPTS MONTHLY PROFILE: JULY 2014 - JUNE 2017
excel:enfreceiptsmonthlyprofile.xls.revised 6/20/2017
BRD 20A - 13

MEDICAL BOARD OF CALIFORNIA BUDGET OVERVIEW BY BOARD COMPONENT
OPERATION
Agenda Item 20A
EXEC ENFORCE SAFE
MEDICINE LICENSING ADMIN
SERVICES INFO
SYSTEMS PROBATION
MONITORING BOARD TOTAL
FY 13/14 $ Budgeted $ Spent* Positions
Authorized
2,304,466 1,427,599
8.8
40,127,776 40,148,898
147.0
716,147 879,418
6.0
8,386,914 6,023,718
53.3
1,833,855 1,650,434
14.0
3,363,720 3,166,541
17.0
2,281,227 1,424,973
25.0
59,014,105 54,721,581 *
271.1
FY 14/15 $ Budgeted $ Spent* Positions
Authorized
1,909,018 1,517,922
8.0
45,230,270 40,108,425
44.0
6,502,878 8,845,645
53.1
1,576,586 1,413,056
14.0
3,154,922 2,745,722
17.0
2,065,009 2,276,725
24.0
60,438,683 56,907,495 *
160.1
FY 15/16 $ Budgeted $ Spent* Positions
Authorized
2,000,070 2,027,741
8.0
41,624,123 40,082,824
44.0
8,551,071 8,855,159
53.1
2,312,598 2,298,695
14.0
3,969,970 3,309,798
17.0
3,606,168 3,374,110
24.0
62,064,000 59,948,327 *
160.1
FY 16/17 $ Budgeted ** $ Spent thru 5/31* Positions
Authorized
1,895,515 1,709,976
8.0
46,649,530 41,902,183
45.0
8,141,778 7,387,417
52.6
2,112,100 1,854,727
14.0
3,662,694 2,696,950
17.0
2,892,383 2,573,463
24.0
65,354,000 58,124,716 *
160.6
* net expenditures (excludes unscheduled reimbursements) ** Budgeted does not include pending current year budget adjustments.
7/12/2017
BRD 20A - 14

Agenda Item 20A
Departmental Pro Rata $7,000,000
$6,000,000
$5,000,000
$4,000,000
$3,000,000
$2,000,000
$1,000,000
$-FY 12/13 FY 13/14 FY 14/15 FY 15/16 FY 16/17
Actuals Budget
Statewide Pro Rata $3,500,000
$3,000,000
$2,500,000
$2,000,000
$1,500,000
$1,000,000
$500,000
$-FY 12/13 FY 13/14 FY 14/15 FY 15/16 FY 16/17
Actuals Budget
Office of Administrative Hearings $2,000,000 $1,800,000 $1,600,000 $1,400,000 $1,200,000 $1,000,000
$800,000 $600,000 $400,000 $200,000
$-FY 12/13 FY 13/14 FY 14/15 FY 15/16 FY 16/17
Attorney General's Office $16,000,000
$14,000,000
$12,000,000
$10,000,000
$8,000,000
$6,000,000
$4,000,000
$2,000,000
$-FY 12/13 FY 13/14 FY 14/15 FY 15/16 FY 16/17
Actuals Budget Actuals Budget
BRD 20A - 15

Agenda Item 20A
NAMES JULY AUG SEPT OCT NOV DEC JAN FEB MAR APRIL MAY JUNE YTD DR. BHOLAT - Per diem $ - $ - $ - $ - $ - $ - $ - $ - $ - $ - $ - $ - $ -Travel $ - $ - $ - $ - $ - $ - $ - $ - $ - $ - $ - $ - $ -
Total-Dr. Bholat $ - $ - $ - $ - $ - $ - $ - $ - $ - $ - $ - $ - $ -DR. BISHOP - Per diem $ 900 $ - $ 500 $ 1,000 $ 700 $ 1,100 $ 1,300 $ 800 $ 700 $ 1,400 $ - $ - $ 8,400 Travel $ 848 $ - $ - $ - $ 277 $ - $ 636 $ - $ - $ 435 $ - $ - $ 2,196
Total-Dr. Bishop $ 1,748 $ - $ 500 $ 1,000 $ 977 $ 1,100 $ 1,936 $ 800 $ 700 $ 1,835 $ - $ - $ 10,596 JUDGE FEINSTEIN - Per diem $ 1,300 $ 800 $ 700 $ 1,400 $ 800 $ 700 $ 1,100 $ 600 $ 600 $ 400 $ 400 $ - $ 8,800 Travel $ - $ - $ - $ - $ - $ - $ - $ - $ - $ - $ - $ - $ -
Total-Judge Feinstein $ 1,300 $ 800 $ 700 $ 1,400 $ 800 $ 700 $ 1,100 $ 600 $ 600 $ 400 $ 400 $ - $ 8,800 DR. GNANADEV - Per diem $ 1,100 $ 1,200 $ 1,100 $ 1,100 $ 1,100 $ - $ 1,500 $ 1,300 $ 1,000 $ 2,000 $ - $ - $ 11,400 Travel $ 1,028 $ - $ - $ 518 $ - $ - $ 828 $ 1,046 $ - $ 868 $ 631 $ - $ 4,919
Total-Dr. Gnanadev $ 2,128 $ 1,200 $ 1,100 $ 1,618 $ 1,100 $ - $ 2,328 $ 2,346 $ 1,000 $ 2,868 $ 631 $ - $ 16,319 DR. HAWKINS - Per diem $ 2,100 $ 1,800 $ 2,000 $ 2,500 $ 1,900 $ 2,300 $ 1,300 $ 1,100 $ 2,200 $ 1,600 $ 3,000 $ - $ 21,800 Travel $ 1,010 $ - $ - $ - $ - $ - $ - $ - $ - $ - $ - $ - $ 1,010
Total-Dr. Hawkins $ 3,110 $ 1,800 $ 2,000 $ 2,500 $ 1,900 $ 2,300 $ 1,300 $ 1,100 $ 2,200 $ 1,600 $ 3,000 $ - $ 22,810 DR. KRAUSS - Per diem $ 1,100 $ - $ - $ - $ - $ - $ 1,200 $ - $ - $ 3,000 $ - $ - $ 5,300 Travel $ - $ - $ - $ - $ - $ - $ - $ - $ - $ - $ - $ - $ -
Total-Dr. Krauss $ 1,100 $ - $ - $ - $ - $ - $ 1,200 $ - $ - $ 3,000 $ - $ - $ 5,300 MS. LAWSON - Per diem $ 900 $ 700 $ 500 $ 1,000 $ - $ 600 $ 900 $ 600 $ 600 $ 1,100 $ 800 $ - $ 7,700 Travel $ - $ - $ - $ 976 $ - $ - $ - $ - $ - $ 897 $ - $ - $ 1,873
Total-Ms. Lawson $ 900 $ 700 $ 500 $ 1,976 $ - $ 600 $ 900 $ 600 $ 600 $ 1,997 $ 800 $ - $ 9,573 DR. LEVINE - Per diem $ - $ - $ - $ - $ - $ - $ - $ - $ - $ - $ - $ - $ -Travel $ - $ - $ - $ - $ - $ - $ 445 $ - $ 135 $ - $ - $ - $ 580
Total-Dr. Levine $ - $ - $ - $ - $ - $ - $ 445 $ - $ 135 $ - $ - $ - $ 580 DR. LEWIS - Per diem $ 900 $ 700 $ 700 $ 1,100 $ 800 $ 800 $ 1,200 $ 500 $ 900 $ 1,200 $ 1,200 $ - $ 10,000 Travel $ 1,948 $ - $ - $ 552 $ - $ - $ 469 $ - $ - $ 759 $ - $ - $ 3,728
Total-Dr. Lewis $ 2,848 $ 700 $ 700 $ 1,652 $ 800 $ 800 $ 1,669 $ 500 $ 900 $ 1,959 $ 1,200 $ - $ 13,728 MS. PINES - Per diem $ 600 $ 1,000 $ 1,000 $ 1,600 $ 1,000 $ 700 $ 1,400 $ 1,300 $ 1,000 $ 1,200 $ 900 $ - $ 11,700 Travel $ - $ - $ - $ 530 $ 846 $ - $ 842 $ 1,991 $ - $ 414 $ 634 $ - $ 5,257
Total-Ms. Pines $ 600 $ 1,000 $ 1,000 $ 2,130 $ 1,846 $ 700 $ 2,242 $ 3,291 $ 1,000 $ 1,614 $ 1,534 $ - $ 16,957 MR. SERRANO SEWELL- Per diem $ 600 $ - $ - $ - $ - $ - $ - $ - $ - $ - $ - $ - $ 600 Travel $ - $ - $ - $ - $ - $ - $ - $ - $ - $ - $ - $ - $ -
Total-Mr. Serrano Sewell $ 600 $ - $ - $ - $ - $ - $ - $ - $ - $ - $ - $ - $ 600 MS. SUTTON-WILLS - Per diem $ 1,500 $ 1,500 $ 1,200 $ 1,400 $ 1,200 $ 1,400 $ 1,500 $ 700 $ 1,800 $ 3,600 $ 400 $ - $ 16,200 Travel $ - $ - $ - $ - $ - $ - $ 582 $ - $ - $ - $ - $ - $ 582
Total-Ms. Sutton-Wills $ 1,500 $ 1,500 $ 1,200 $ 1,400 $ 1,200 $ 1,400 $ 2,082 $ 700 $ 1,800 $ 3,600 $ 400 $ - $ 16,782 MR. WARMOTH - Per diem $ 900 $ 500 $ 500 $ 900 $ 600 $ 600 $ 800 $ 1,000 $ - $ - $ 400 $ - $ 6,200 Travel $ 1,075 $ - $ - $ - $ - $ - $ 803 $ - $ - $ - $ - $ - $ 1,877
Total-Mr. Warmoth $ 1,975 $ 500 $ 500 $ 900 $ 600 $ 600 $ 1,603 $ 1,000 $ - $ - $ 400 $ - $ 8,077 MS. WRIGHT - Per diem $ 1,200 $ 800 $ 800 $ 1,300 $ 600 $ 600 $ 1,000 $ 800 $ 700 $ 800 $ 1,400 $ - $ 10,000 Travel $ 487 $ - $ - $ - $ - $ - $ - $ - $ - $ 67 $ - $ - $ 554
Total-Ms. Wright $ 1,687 $ 800 $ 800 $ 1,300 $ 600 $ 600 $ 1,000 $ 800 $ 700 $ 867 $ 1,400 $ - $ 10,554 DR. YIP - Per diem $ - $ - $ - $ - $ - $ - $ - $ - $ - $ - $ - $ - $ -Travel $ - $ - $ - $ - $ - $ - $ - $ - $ - $ - $ - $ - $ -
Total-Dr. Yip $ - $ - $ - $ - $ - $ - $ - $ - $ - $ - $ - $ - $ -As of: 7/11/17 TOTAL PER DIEM BUDGETED $ 32,000
TOTAL PER DIEM $ 118,100 TOTAL TRAVEL $ 22,574
TOTAL $ 140,674
BRD 20A - 16
Agenda Item 20A
CALIFORNIA END OF LIFE OPTION ACT 2016 DATA REPORT
For more information: https://www.cdph.ca.gov/Programs/CHSI/Pages/End-of-Life-Option-Act-.aspx Contact: [email protected]
BRD 20A - 17

Agenda Item 20A
Executive Summary
California’s End of Life Option Act (EOLA) became effective on June 9, 2016. The Act allows terminally ill
adults living in California to obtain and self-administer aid-in-dying drugs.1 The Act requires the
California Department of Public Health (CDPH) to provide annual reports under strict privacy
requirements. CDPH’s reporting requirements are outlined in Health and Safety Code section 443.19
(b), which reads:
(b) On or before July 1, 2017, and each year thereafter, based on the information collected in the
previous year, the department shall create a report with the information collected from the
attending physician followup form and post that report to its Internet Web site. The report shall
include, but not be limited to, all of the following based on the information that is provided to
the department and on the department’s access to vital statistics:
(1) The number of people for whom an aid-in-dying prescription was written.
(2) The number of known individuals who died each year for whom aid-in-dying prescriptions were written, and the cause of death of those individuals.
(3) For the period commencing January 1, 2016, to and including the previous year, cumulatively, the total number of aid-in-dying prescriptions written, the number of people who died due to use of aid-in-dying drugs, and the number of those people who died who were enrolled in hospice or other palliative care programs at the time of death.
(4) The number of known deaths in California from using aid-in-dying drugs per 10,000 deaths in California.
(5) The number of physicians who wrote prescriptions for aid-in-dying drugs.
(6) Of people who died due to using an aid-in-dying drug, demographic percentages organized by the following characteristics:
(A) Age at death.
(B) Education level.
(C) Race.
(D) Sex.
(E) Type of insurance, including whether or not they had insurance.
(F) Underlying illness.
This report presents data as reported to CDPH from the EOLA-mandated physician reporting forms
received between June 9, 2016, and December 31, 2016, and reflects information on individuals who
were prescribed aid-in-dying drugs in 2016. The information collected has been aggregated to protect
the privacy of the individuals. Subsequent annual reports will encompass 12 months of data.
For the partial year ending December 31, 2016, 191 individuals received prescriptions under EOLA. 111
individuals died following their ingestion of the prescribed aid-in-dying drug(s). Of the 111 individuals,
1 Assembly Bill x2 15 (Eggman), Chapter 1, Statutes of 2015.
BRD 20A - 18

Agenda Item 20A
87.4 percent were 60 years of age or older, 96.4 percent had health insurance, and 83.8 percent were
receiving hospice and/or palliative care. As this report covers only six-months of data, caution should be
exercised in drawing conclusions based on the numbers reported.
Introduction
The EOLA allows an adult diagnosed with a terminal disease, who meets certain qualifications, to
request an aid-in-dying drug from a physician. The Act requires physicians to use forms specified in
statute for submitting information to CDPH. CDPH is responsible for collecting data from these forms,
and preparing an annual report. Data presented in this report is based on the information contained in
physicians’ forms and California death certificates as of December 31, 2016.
More information on the Act, reporting process, and required forms can be found here:
https://www.cdph.ca.gov/Programs/CHSI/Pages/End-of-Life-Option-Act-.aspx.
Participation in the End-of-Life Option Activities
From June 9, 2016 through December 31, 2016, 258 individuals started the end-of-life option process, as
set forth in the Act, by making two verbal requests to their physicians at least 15 days apart. 173 unique
physicians prescribed 191 individuals aid-in-dying drugs. Of the 191 individuals who were prescribed
such drugs, 111, or 58.1 percent, were reported by their physician to have died following ingestion of
aid-in-dying drugs prescribed under EOLA; and 21 individuals, or 11.0 percent, died without ingestion of
the prescribed aid-in-dying drug(s). The outcome of the remaining 59 individuals, or 30.9 percent, who
have been prescribed aid-in-dying drugs, is currently undetermined as there has been no outcome
reported for these individuals within the time period covered by this report. A chart illustrating the
outcomes is provided on the next page as Figure 1.
The rate for those who died following ingestion of aid-in-dying drugs was 6.06 per 10,000 total deaths2
based on 183,265 deaths in California from June 9, 2016 to December 31, 2016.
2 This rate does not include any deaths following the ingestion of prescribed drugs after December 31, 2016. Total
deaths in California include only those deaths that occurred from 00:00 hours June 9, 2016, to 23:59 December 31, 2016, and is not based on all deaths occurring in California in 2016.
BRD 20A - 19

Agenda Item 20A
Characteristics of Individuals
Of the 111 individuals who died pursuant to EOLA during 2016, 12.6 percent were under 60 years of age,
75.6 percent were 60-89 years of age, and 11.7 percent were 90 years of age and older. The median age
was 73 years. At the time of death, the decedents were 89.5 percent white, 54.1 percent were female;
83.8 percent were receiving hospice and/or palliative care, and 72.1 percent had at least some level of
college education. A summary of this information is set forth in Table 1.
Of the 111 individuals who died pursuant to EOLA during 2016, the majority, or 58.6 percent, of their
underlying illnesses, were identified as malignant neoplasms (cancer). Neuromuscular disorders such as
ALS3 and Parkinson’s accounted for the second largest underlying illness grouping, totaling 18.0 percent.
The remaining major categories of underlying illnesses were documented as: heart disease (8.1
percent), lung respiratory diseases (non-cancer) with 6.3 percent, and other underlying illnesses (9.0
percent). This data is presented below in Figure 2.
Certifiers (physicians, coroners, and medical examiners) report the underlying terminal disease as the
cause of death on the death certificates. This approach complies with applicable law; best ensures the
reliability and usefulness of data collected from the death certificate for state, national, and
international surveillance purposes; and effectuates the California Legislature’s intent to maintain the
confidentiality of individuals’ participation in the Act.
3 Amyotrophic Lateral Sclerosis.
BRD 20A - 20

Agenda Item 20A
Figure 2: Major Illness Categories for EOLA Individuals in 2016
6570
60
50
40
30 20 20 10 9 710
0
Malignant Neuromuscular Other Underlying Heart Disease Lung Respiratory Neoplasms Illnesses Disease (non-cancer)
Among those with malignant cancer as the underlying terminal disease – the largest group of individuals
who utilized the Act – lung cancer accounted for 20.0 percent, breast cancer accounted for 18.5 percent,
pancreatic cancer comprised 12.3 percent, and 10.8 percent had prostate cancer. Other malignant
neoplasms accounted for the remaining 38.5 percent, as shown below in Figure 3.
Figure 3: Percentage Summary of EOLA Individuals by Malignant Neoplasm Type
Breast Cancer
Lung Cancer
Pancreatic Cancer
Prostate Cancer
Other Cancers
18.5%
20.0%
12.3%10.8%
38.5%
Most of the individuals who participated in EOLA had some form of health insurance. Medicare and/or
Medi-Cal accounted for 56.8 percent of individuals, followed by public/private insurance at 30.6
percent. Ten individuals, or 9.0 percent, had undetermined health insurance coverage.
BRD 20A - 21

Agenda Item 20A
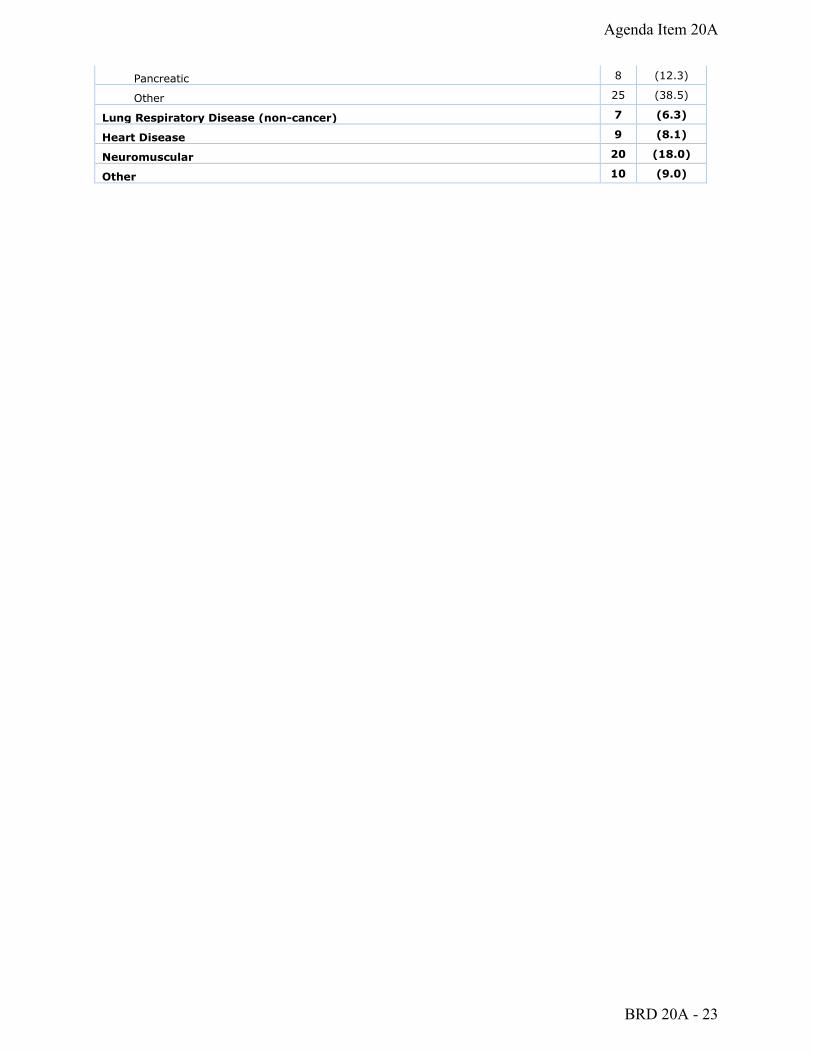
Table 1. Characteristics of the End of Life Option Act individuals who
died following ingestion of aid-in-dying drug
Characteristics 2016
(N=111)
Age N (%)
Under 60 14 (12.6)
60-69 25 (22.5)
70-79 30 (27.0)
80-89 29 (26.1)
90 and Over 13 (11.7)
Median Year (range) 73 (41-99)
Gender N (%)
Male 51 (45.9)
Female 60 (54.1)
Education N (%)
No High School Diploma 6 (5.4)
High School Diploma or General Educational Development 25 (22.5)
Some College no Degree 16 (14.4)
Associate, Bachelor or Master Degree 51 (45.9)
Doctorate or Professional Degree 13 (11.7)
Race/Ethnicity N = 1144
(%)
White 102 (89.5)
Asian 6 (5.3)
Black 3 (2.6)
Hispanic 3 (2.6)
End of Life Care N (%)
Hospice and/or Palliative Care
Enrolled 93 (83.8)
Not Enrolled 13 (11.7)
Unknown 5 (4.5)
Insurance N (%)
Medicare 49 (44.2)
Medi-Cal 4 (3.6)
Medicare/Medi-Cal (Dual Eligible) 10 (9.0)
Private Insurance 21 (18.9)
Medicare/Medi-Cal and Private Supplemental Insurance 13 (11.7)
Has Insurance but Unknown Type 10 (9.0)
No Insurance 4 (3.6)
Illness N (%)
Malignant Neoplasms 65 (58.6)
Breast 12 (18.5)
Lung 13 (20.0)
Prostate 7 (10.8)
4 Numerator includes EOLA individuals of multiple races and/or ethnicities.
BRD 20A - 22
Agenda Item 20A
Pancreatic 8 (12.3)
Other 25 (38.5)
Lung Respiratory Disease (non-cancer) 7 (6.3)
Heart Disease 9 (8.1)
Neuromuscular 20 (18.0)
Other 10 (9.0)
BRD 20A - 23

Agenda Item 20A
Renewed and Current License Age Distribution with Retired Survey Response (excluding Disabled, Retired, and Inactive Secondary Status)
35,000
30,000
25,000
20,000
15,000
10,000
5,000
1,602
669 1
6,745
22,681
27
3,577
29,445
64
4,017
24,534
204
2,465
11,408
447
2,595
8,817
912
2,221
5,387
1,144
2,912
3,822
1,693
Retired Survey Response
Yes No No Response
20 - 29 30 - 39 40 - 49 50 - 59 60 - 64 65 - 69 70 - 74 75+ (2,272) (29,453) (33,086) (28,755) (14,320) (12,324) (8,752) (8,427)
Age Group (Total License Count)
7/6/2017
BRD 20A - 24
0

3,500
3,000
Retired Survey Response
Yes No No Response
2,500
2,000
1,500
1,000
500
0
Agenda Item 20A
BRD 20A - 25
Renewed and Current License Age Distribution with Retired Survey Response (excluding Disabled, Retired, and Inactive Secondary Status)
Age Group (Total License Count)
7/6/2017