Embed Size (px)
DESCRIPTION
The Christiana Care Division of Medical Critical Care is excited to share a review of its achievements for FY13. We are proud of the continued attainment of excellent clinical outcomes, strong performance to improve the safety of our patients, and ability to implement innovative programs that meet best practice standards.
Citation preview

Medical Critical Care Year End Review
FY 2013

Medical Critical Care Year End Review
The Division of Medical Critical Care is excited to share a review of its achievements for FY13. We are
proud of the continued attainment of excellent clinical outcomes, strong performance to improve the safety of our
patients, and ability to implement innovative programs that meet best practice standards. This work has been led by
the Medical Intensivists of Christiana Care Pulmonary Associates in conjunction with a strong partnership with the
nursing staff of the MICU and WICU. Additionally, our success would not be possible without the dedicated care
provided by the Critical Care Physician Assistants, Respiratory Therapists, Rehab services, and other ancillary
support. As a result of our collective efforts we have demonstrated improved mortality in our critically ill patients,
which are amongst the most severely ill in the entire nation. Additionally, we have made substantial improvements
in ventilator duration, device utilization, and hospital acquired infection rates. The Medical intensivists have
expanded their scope to bring expert critical care in areas outside of the MICU and WICU, resulting in improved
outcomes for our patients in the CICU and during emergent situations such as RRT and code blue. We are leaders
in demonstrating the value of multidisciplinary collaboration with rounds and daily checklists, as well as
integrating Patient and Family Centered principles into the care delivery of our patients.
Vinay Maheshwari, MD, FCCP
Director, Medical Critical Care

Medical Critical Care Year End Review
The patients in the MICU and WICU are amongst the most severely ill within the entire VISICU
national database*. We have consistently demonstrated outstanding outcomes in relation to severity
adjusted mortality and ICU length of stay and rank amongst the top decile of all programs within the
VISICU database.
CCHS had the 4th lowest Hospital
Mortality ratio compared to the
other health systems in the
national database
CCHS had the 2nd
lowest ICU
LOS Ratio in compared to the
other health systems in the
national database
*based on APACHE IV

Medical Critical Care Year End Review
MICU Apache Data
MICU APACHE Data * Source VISICU Quarter Q4 2011 Q1 2012 Q2 2012 Q3 2012 Q4 2012 Q1 2013 Q2 2013 Number of Patients 416 474 448 419 471 486 476 Number of Unit Stays 439 517 476 439 505 526 503 Average APACHE Score 68.92 70.73 67.05 67.76 69.24 68.64 68.04
0.66 0.66
0.68
0.52
0.53
0.45 0.42
0
0.1
0.2
0.3
0.4
0.5
0.6
0.7
0.8
0
2
4
6
8
10
12
Q4 2011 Q1 2012 Q2 2012 Q3 2012 Q4 2012 Q1 2013 Q2 2013 Mo
rtali
ty R
ati
o
% o
f D
eath
s
Quarter
MICU Mortality Actual Deaths (%)
O:E Mortality Ratio
The MICU Actual Deaths % has improved by 44% from Q4 2011 to Q2 2013
0.91 0.82
0.81 0.91 0.77
0.83
0.75
0
0.2
0.4
0.6
0.8
1
0
0.5
1
1.5
2
2.5
3
3.5
4
4.5
Q4 2011 Q1 2012 Q2 2012 Q3 2012 Q4 2012 Q1 2013 Q2 2013
LO
S R
ati
o
Day
s
Quarter
MICU LOS Actual LOS
O:E ICU LOS Ratio
Medical Critical Care Year End Review
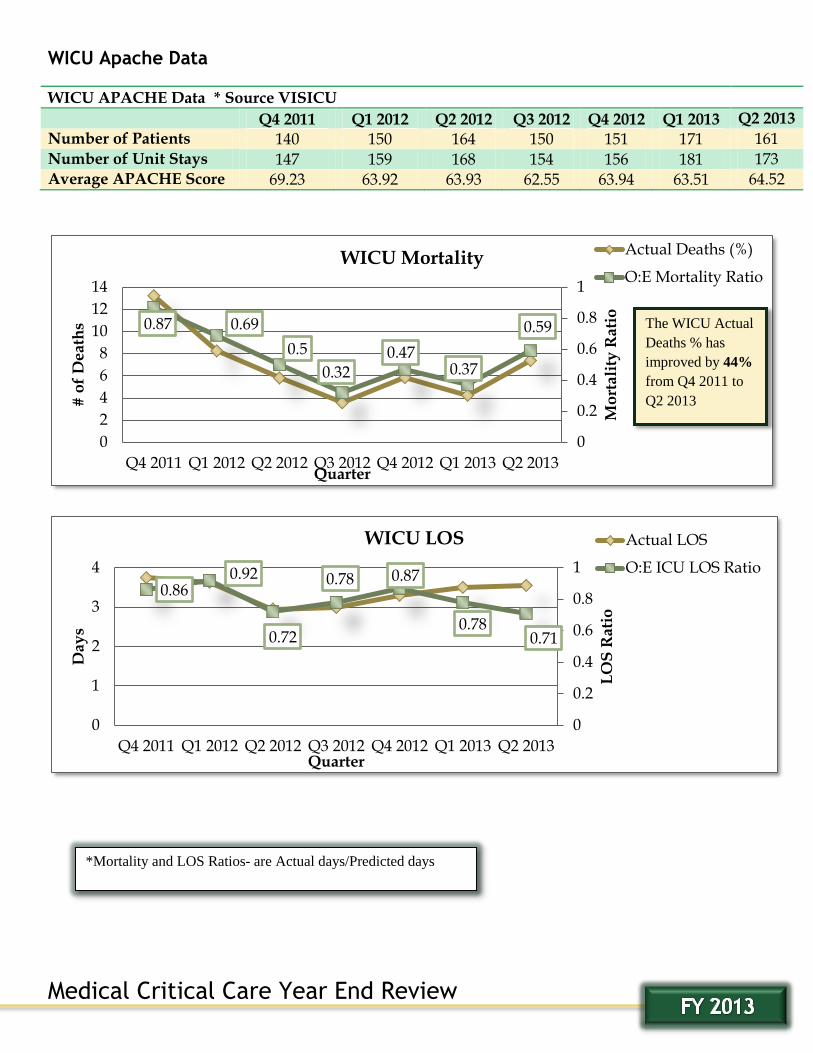
WICU Apache Data
WICU APACHE Data * Source VISICU
Q4 2011 Q1 2012 Q2 2012 Q3 2012 Q4 2012 Q1 2013
Q2 2013
Number of Patients 140 150 164 150 151 171 161 Number of Unit Stays 147 159 168 154 156 181 173 Average APACHE Score 69.23 63.92 63.93 62.55 63.94 63.51 64.52
0.87 0.69
0.5
0.32 0.47
0.37
0.59
0
0.2
0.4
0.6
0.8
1
0
2
4
6
8
10
12
14
Q4 2011 Q1 2012 Q2 2012 Q3 2012 Q4 2012 Q1 2013 Q2 2013
Mo
rtali
ty R
ati
o
# o
f D
eath
s
Quarter
WICU Mortality Actual Deaths (%)
O:E Mortality Ratio
0.86 0.92
0.72
0.78 0.87
0.78 0.71
0
0.2
0.4
0.6
0.8
1
0
1
2
3
4
Q4 2011 Q1 2012 Q2 2012 Q3 2012 Q4 2012 Q1 2013 Q2 2013
LO
S R
ati
o
Day
s
Quarter
WICU LOS Actual LOS
O:E ICU LOS Ratio
*Mortality and LOS Ratios- are Actual days/Predicted days
The WICU Actual
Deaths % has
improved by 44%
from Q4 2011 to
Q2 2013

Medical Critical Care Year End Review
MV LOS Reduction
Although there has been a 9% increase inpatient volume since FY2011, patient ventilator days have been
reduced by ½ a day and that has been associated with a reduction of Hospital LOS by almost a full day.
935
977
1021 13.96
14.9
13.13
6.54 6.51 5.98
880
900
920
940
960
980
1000
1020
1040
0
2
4
6
8
10
12
14
16
FY11 FY12 FY13
# o
f P
ati
en
ts
Day
s
Fiscal Year
Number of Patients Hospital LOS Ventilator Days
283
273
298 13.08
10.64 10.92
4.59 4.48 3.76
0
2
4
6
8
10
12
14
FY11 FY12 FY13
260
265
270
275
280
285
290
295
300
Day
s
Fiscal Year
# o
f P
ati
en
ts
Number of Patients Hospital LOS Ventilator Time Days
MICU
WICU
Patient totals are based on hospital admission date by fiscal year.

Medical Critical Care Year End Review
MICU Off Shift Extubation Process
Improved Off shift extubations in MICU from baseline of 23% to 44%
MV reduction from 5.3days to 4.7days
ICU LOS reduction from 6.0days to 5.2days
Sepsis Value Improvement Team
Created a multidisciplinary team aimed at improving the outcomes related to Sepsis
Approved by CCHS as 5th
DRG population based VIT in April 2013
Dashboard created to follow clinical results starting July 2013
Demonstration of significant improvement in multiple areas
Improved Performance by a full Letter grade on Sepsis VIT Scorecard
Medical Critical Care Year End Review
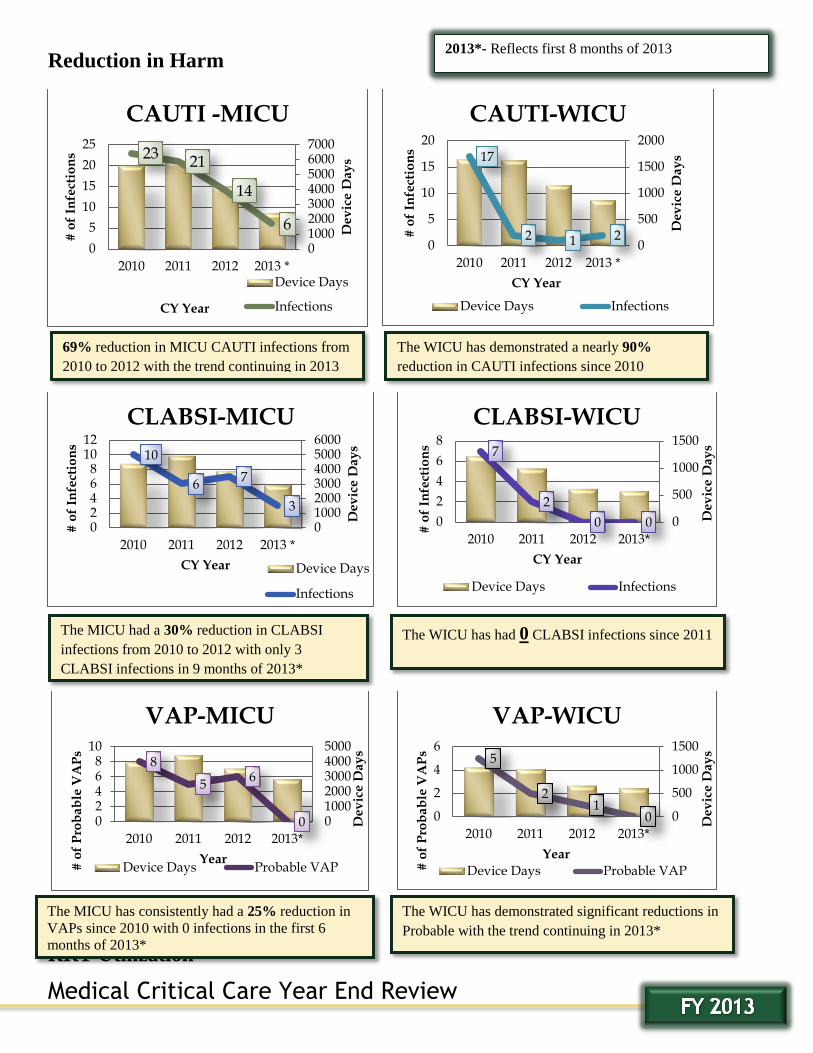
Reduction in Harm
RRT Utilization
23 21
14
6
01000200030004000500060007000
0
5
10
15
20
25
2010 2011 2012 2013 *
De
vic
e D
ay
s
# o
f In
fect
ion
s
CY Year
CAUTI -MICU
Device Days
Infections
17
2 1 2 0
500
1000
1500
2000
0
5
10
15
20
2010 2011 2012 2013 *
De
vic
e D
ay
s
# o
f In
fect
ion
s
CY Year
CAUTI-WICU
Device Days Infections
10
6 7
3
0100020003000400050006000
02468
1012
2010 2011 2012 2013 *
De
vic
e D
ay
s
# o
f In
fect
ion
s
CY Year
CLABSI-MICU
Device Days
Infections
7
2
0 0 0
500
1000
1500
0
2
4
6
8
2010 2011 2012 2013*
CY Year
De
vic
e D
ay
s
# o
f In
fect
ion
s
CLABSI-WICU
Device Days Infections
8
5 6
0 02468
10
2010 2011 2012 2013*
010002000300040005000
# o
f P
rob
ab
le V
AP
s
Year
De
vic
e D
ay
s
VAP-MICU
Device Days Probable VAP
5
2 1
0 0
500
1000
1500
0
2
4
6
2010 2011 2012 2013*
De
vic
e D
ay
s
# o
f P
rob
ab
le V
AP
s
Year
VAP-WICU
Device Days Probable VAP
69% reduction in MICU CAUTI infections from
2010 to 2012 with the trend continuing in 2013
The WICU has demonstrated a nearly 90%
reduction in CAUTI infections since 2010
The WICU has had 0 CLABSI infections since 2011 The MICU had a 30% reduction in CLABSI
infections from 2010 to 2012 with only 3
CLABSI infections in 9 months of 2013*
The MICU has consistently had a 25% reduction in
VAPs since 2010 with 0 infections in the first 6
months of 2013*
The WICU has demonstrated significant reductions in
Probable with the trend continuing in 2013*
2013*- Reflects first 8 months of 2013

Medical Critical Care Year End Review
RRT Utilization
10 7 6 7
5 5 3
11
6
5
3
4
2 3 1 3
4
1
13-Jan 13-Feb Mar 13 13-Apr 13-May 13-Jun 13-Jul 13-Aug 13-Sep
Multiple RRT Calls
2 within 12 hours 3 within 48 hours
Linear (2 within 12 hours) Linear (3 within 48 hours)
41.3 38.6 37.3 33.0 35.5 37.2 50.5 46.6 44.1 41.3 37.7 34.9 38.4 32.5 40.3 32.0
1.9 2.7 2.3 2.8 3.3 3.2
2.4 2.9 2.4 2.8 2.7 3.8 1.6 2.2
3.5 3.2
Non-ICU Codes/RRT Calls per 1000 Discharges
CCHS RRT calls per 1000 disch Total Non-ICU codes per 1000 disch
Reduction in RRT utilization over first 6 months of 2013
Non- ICU code rate has improved or remained unchanged
Improvement in number of RRT’s within first 24 hours of admission
Reduced number of multiple RRT’s

Medical Critical Care Year End Review
Daily Checklist
MICU and WICU collaborated to create uniform ICU best practice checklist and integration on
multidisciplinary rounds. Being utilized > 95% of all patients on daily basis in both units.
This checklist was shared across the system and now integrated into the rounds of each adult ICU at
CCHS.
Collaboration with Christiana Care Cardiology Consultants (C4)
Dedicated Intensivist to CICU 1/1/2012
Established agreement with C4 for co-management with medical critical care (CCPA) of critically ill
patients admitted to Cardiology service to CICU. Started 7/1/2012
Implemented Daily Checklist to CICU Rounds
Helped establish multidisciplinary rounds in CICU
Significant reductions in device days and Hospital Acquired Infections have been achieved during this
timeframe.
0.91 0.83 0.75
0.74 0.88
0.73
1.21
0.79 0.72
0.74 0.83 0.68
Q1 2012 Q2 2012 Q3 2012 Q4 2012 Q1 2013 Q2 2013
CICU ECARE Data
ICU LOS Ratio Vent. Days Ratio Linear (Vent. Days Ratio)

Medical Critical Care Year End Review
CRTI Initiative
Baseline (2011)
MICU Alert Intervention (Jan. 10th –August 2013 )
% Reduction
EDLOS Avg. (Hrs.) 9.10 7.17 21%
MICULOS Avg. (Days) 3.79 3.25 14%
Hosp.LOS Avg. (Days) 10.66 8.60 19%
Baseline (July 2011-March 2012)
MAT Intervention (April 2012-Sept. 2013)
% Reduction
EDLOS Avg. (Hrs.) 8.24 6.42 22%
MICULOS Avg.(Days) 3.16 2.70 15%
Hosp.LOS Avg. (Days) 7.79 7.45 5%
The Medical Critical Care Division has adopted the Choosing Wisely campaign and its principles of physician
stewardship, or the ideal that physicians are held responsible for providing effective healthcare, and therefore
should be at the center of driving cost control. We have created initiatives to address each of the following
recommendations endorsed by the Society of Critical Care Medicine.
Don't order diagnostic tests at regular intervals (e.g., daily), but rather in response to specific clinical
questions.
Don't transfuse red blood cells in hemodynamically stable, non-bleeding ICU patients with a
hemoglobin concentration greater than 7 mg/dL.
Don't use parenteral nutrition in adequately nourished critically ill patients within the first seven days of
an ICU stay.
Don't deeply sedate mechanically ventilated patients without specific indications, and do attempt to
lighten sedation daily.
Don't continue life support for patients at high risk for death or impaired functional recovery without
offering patients and their families the alternative of care focused entirely on comfort.
Do not initiate or continue antimicrobial agents without specifying an evidence-based duration or
endpoint and reassessing daily whether to narrow the spectrum of coverage based on cultures and
clinical response.
Do not place or maintain arterial and central venous catheters in critically ill patients without specific
indications.
MICU data from Donna Mahoney, Director, Data Acquisition & Measurement
WICU data from Donna Mahoney, Director, Data Acquisition & Measurement

Medical Critical Care Year End Review
Early Mobility
Roaming ICU Provider
Has allowed more immediate evaluation of critically ill patients in non-MICU locations. This has
resulted in improved RRT outcomes and utilization, as well as improved collaborative efforts in the
Cardiac ICU. Both are elucidated further in improved clinical outcomes.
Data Category Baseline (CY 2011)
Intervention Period (FY2013)
Number of Patient Stays 1688 1691 Patents that received PT Services
274 620
Percentage of patients that received PT Services
16.2% 36.7%
Average MICU LOS (d) 4.3 2.7 Average total hospital LOS (d) 12.37 11.2 Average mechanical ventilator LOS (d)
5.4 4.3
This was a multidisciplinary initiative
designed to focus on the functional
mobility of patients immediately upon
ICU admission. This process included
identifying appropriate patients on a
daily basis, developing efficient
workflows between various providers,
and a paradigm shift in culture. As a
result, there was a substantial increase in
the number of patients who received
Rehab services and this was associated
with improved outcomes as highlighted
below.
MICU LOS has
been reduced by 1.6
days compared to
baseline period
CY2011

Medical Critical Care Year End Review
2010 Rising Star Award- Vinay Maheshwari
2010 Specialist of the Year- Michael Benninghoff
2010 ANCC Magnet Award
2011 Internal Medicine Teacher of the Year- Badrish Patel
2012 Kimberly Clark HAI Watchdog Award- 1st Place- Wilmington ICU
2013 Internal Medicine Teacher of the Year- Mithil Gajera
2013-8 Nursing Excellence Nominees and 3 award winners
2012-2015 AACN Beacon Award -Silver
CNS Nurse of the Year from Delaware Today- Maureen Seckel
SDS Learning Institute Center for Simulation Award- Bridget Remel
Unit Based Value Improvement Team (UBVIT) Recognition Award- Wilmington ICU