Embed Size (px)
Citation preview

Medical Engineering and Physics 49 (2017) 71–78
Contents lists available at ScienceDirect
Medical Engineering and Physics
journal homepage: www.elsevier.com/locate/medengphy
Non-linear finite element model to assess the effect of tendon forces
on the foot-ankle complex
Enrique Morales-Orcajo
a , b , c , e , ∗, Thales R. Souza
d , Javier Bayod
a , b , e , Estevam Barbosa de Las Casas c
a Group of Structural Mechanics and Materials Modeling (GEMM), Aragón Institute of Engineering Research (I3A). University of Zaragoza, Zaragoza, Spain b Biomedical Research Networking Center in Bioengineering, Biomaterials and Nanomedicine (CIBER-BBN), Spain c Group of Biomechanical Engineering UFMG - (MecBio), School of Engineering, Universidade Federal de Minas Gerais, Belo Horizonte, MG, Brazil d Department of Physical Therapy, Graduate Program in Rehabilitation Sciences, Universidade Federal de Minas Gerais, Belo Horizonte, MG, Brazil e Mechanical Engineering Department, School of Engineering and Architecture (EINA), University of Zaragoza, c/María de Luna s/n, Betancourt Building,
50018 Zaragoza, Spain
a r t i c l e i n f o
Article history:
Received 11 December 2016
Revised 18 June 2017
Accepted 24 July 2017
Keywords:
Finite element method
Foot tendons
Computational simulation
Hyperelastic behavior
Ogden model
Foot biomechanics
a b s t r a c t
A three-dimensional foot finite element model with actual geometry and non-linear behavior of tendons
is presented. The model is intended for analysis of the lower limb tendon forces effect in the inner foot
structure. The geometry of the model was obtained from computational tomographies and magnetic res-
onance images. Tendon tissue was characterized with the first order Ogden material model based on
experimental data from human foot tendons. Kinetic data was employed to set the load conditions. Af-
ter model validation, a force sensitivity study of the five major foot extrinsic tendons was conducted to
evaluate the function of each tendon. A synergic work of the inversion-eversion tendons was predicted.
Pulling from a peroneus or tibialis tendon stressed the antagonist tendons while reducing the stress in
the agonist. Similar paired action was predicted for the Achilles tendon with the tibialis anterior. This
behavior explains the complex control motion performed by the foot. Furthermore, the stress state at the
plantar fascia, the talocrural joint cartilage, the plantar soft tissue and the tendons were estimated in
the early and late midstance phase of walking. These estimations will help in the understanding of the
functional role of the extrinsic muscle-tendon-units in foot pronation-supination.
© 2017 IPEM. Published by Elsevier Ltd. All rights reserved.
1
l
p
i
s
a
t
a
t
m
d
e
n
c
c
fi
c
a
t
b
t
i
r
t
d
r
y
m
h
1
. Introduction
Foot finite element (FE) models have been developed during the
ast three decades improving their features as computational ca-
acity and constitutive models for biological tissues were improv-
ng. Mechanical behavior of bone has been well addressed, but foot
oft tissues approaches are still evolving [1] . Advances have been
chieved in simulating the non-linear behavior of foot plantar soft
issue and refined constitutive models with real geometries of lig-
ments are currently used in foot modeling. However, muscle and
endon components have not been appropriately addressed yet [2] .
Realistic tendon simulation provides refined estimation of the
echanical performance on the foot-ankle complex. Kinematic and
ynamic tendon data can be found in the literature [3–5] . How-
ver, stress levels of tendons are rarely reported mainly due to the
∗ Corresponding author at: Mechanical Engineering Department, School of Engi-
eering and Architecture (EINA), University of Zaragoza, c/María de Luna s/n, Betan-
ourt Building, 50018 Zaragoza, Spain.
E-mail address: [email protected] (E. Morales-Orcajo).
i
t
b
W
fi
ttp://dx.doi.org/10.1016/j.medengphy.2017.07.010
350-4533/© 2017 IPEM. Published by Elsevier Ltd. All rights reserved.
omplexity of performing experimental measurements and the dif-
culty of modeling soft tissue. Fill this gap is relevant from a clini-
al perspective since stress helps to estimate pain and tissue dam-
ge and it is independent of the structural characteristics of the
endon.
In computational foot modeling, tendon representations have
een limited to reaction forces in the tendon insertions [6,7] or
he use of one-dimensional link elements [8,9] . Recent approaches
ncluded the realistic geometry of Achilles tendon (AT), but the
emaining tendons that control foot motion were represented by
russ elements or neglected [10] . The consideration of the real ten-
on geometry allows the study of the tendon itself and not only its
eaction in the bone structure. This opens new avenues in the anal-
sis of the foot tendon performance. Furthermore, the use of linear
aterial models to assess the non-linear behavior of tendon tissue
s other of the current boundaries in foot tendon simulation. Par-
icularly, in FE foot modeling, only three different approaches have
een used for this tissue [2] . The first approach was presented by
u [11] in a 2D foot FE model where the tendon tissue was con-
gured linear elastic transverse isotropic using a Young’s modulus
72 E. Morales-Orcajo et al. / Medical Engineering and Physics 49 (2017) 71–78
e
l
d
r
f
r
e
t
B
r
2
d
p
l
m
0
w
T
d
2
t
m
m
d
f
c
C
w
t
n
w
a
b
t
a
s
v
l
t
d
o
i
of 1200 MPa for the axial direction and a Poisson’s ratio of 0.4. The
second approach was given by Gu et al. [12] in a 3D model of the
Achilles tendon. They simulated the Achilles tendon behavior using
an incompressible hyperelastic two-parameter Mooney–Rivlin for-
mulation. The third approach was the isotropic linear elastic mate-
rial model with Young’s modulus of 450 MPa and Poisson’s ratio of
0.3 firstly used by Garcia-Aznar et al. [13] . Linear material models
are based on the consideration that stresses and strains are pro-
portional. This approximation disregards the initial elongation of
the tendons at lower stress values, the so-called toe region [14,15] .
As for non-linear material models, that initial strain is considered,
as well as the non-linear transition previous to the linear region,
providing more realistic stress estimations.
The purpose of this study was to establish a three-dimensional
FE model of the human foot using detailed realistic geometry and
non-linear behavior of tendons. The model was used to shed light
on the role of each tendon in the mechanical response of the foot.
For this, force sensitivity analyses of ankle stabilizer tendons, i.e.
peroneus, tibialis, and Achilles tendons, were performed. Further-
more, the mechanical solicitations of the internal foot components
were predicted at the beginning and the end of the midstance
phase of walking. These estimations will help in the understand-
ing of the functional role of the extrinsic muscle-tendon-units of
the foot and in the quantification of its mechanical performance.
2. Methods
2.1. Finite element model
2.1.1. Geometry reconstruction
The right foot of a 49 years old male volunteer, with weight
of 70 kg and height of 170 cm, was scanned to obtain the geome-
try of the FE model. Two different tomographies were utilized to
capture the geometry details of all tissues in the foot [16] . First,
x-ray 0.6 mm slice distance computed tomographic images were
segmented to define bone volumes (cortical and trabecular) and
to sketch a primary distribution of the tendons. Then, magnetic
resonance images, which provide a better definition of soft tis-
sues, were used to refine the initial segmentation, especially the
deeper layers of muscles. MIMICS software (Materialise, Leuven,
Belgium) was employed to generate the three-dimensional surfaces
(STL files) from the two-dimensional stacked image data. This im-
age processing software, frequently cited in three-dimensional re-
construction from medical images [2] , use an adapted marching
cubes algorithm to create three-dimensional surfaces based on the
masks, i.e. region of interest, selected during the segmentation pro-
cess. Several anatomy references were additionally consulted to
help in the identification and delimitation of each individual ten-
don geometry [17–19] .
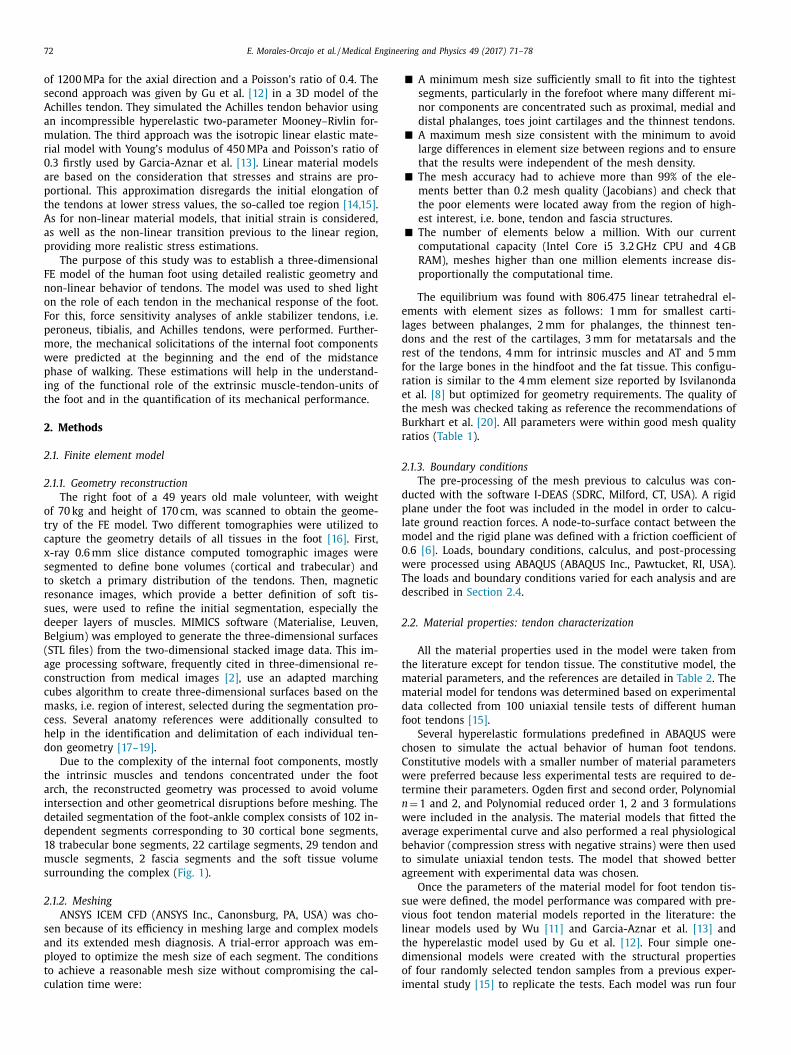
Due to the complexity of the internal foot components, mostly
the intrinsic muscles and tendons concentrated under the foot
arch, the reconstructed geometry was processed to avoid volume
intersection and other geometrical disruptions before meshing. The
detailed segmentation of the foot-ankle complex consists of 102 in-
dependent segments corresponding to 30 cortical bone segments,
18 trabecular bone segments, 22 cartilage segments, 29 tendon and
muscle segments, 2 fascia segments and the soft tissue volume
surrounding the complex ( Fig. 1 ).
2.1.2. Meshing
ANSYS ICEM CFD (ANSYS Inc., Canonsburg, PA, USA) was cho-
sen because of its efficiency in meshing large and complex models
and its extended mesh diagnosis. A trial-error approach was em-
ployed to optimize the mesh size of each segment. The conditions
to achieve a reasonable mesh size without compromising the cal-
culation time were:
� A minimum mesh size sufficiently small to fit into the tightest
segments, particularly in the forefoot where many different mi-
nor components are concentrated such as proximal, medial and
distal phalanges, toes joint cartilages and the thinnest tendons.
� A maximum mesh size consistent with the minimum to avoid
large differences in element size between regions and to ensure
that the results were independent of the mesh density.
� The mesh accuracy had to achieve more than 99% of the ele-
ments better than 0.2 mesh quality (Jacobians) and check that
the poor elements were located away from the region of high-
est interest, i.e. bone, tendon and fascia structures.
� The number of elements below a million. With our current
computational capacity (Intel Core i5 3.2 GHz CPU and 4 GB
RAM), meshes higher than one million elements increase dis-
proportionally the computational time.
The equilibrium was found with 806.475 linear tetrahedral el-
ments with element sizes as follows: 1 mm for smallest carti-
ages between phalanges, 2 mm for phalanges, the thinnest ten-
ons and the rest of the cartilages, 3 mm for metatarsals and the
est of the tendons, 4 mm for intrinsic muscles and AT and 5 mm
or the large bones in the hindfoot and the fat tissue. This configu-
ation is similar to the 4 mm element size reported by Isvilanonda
t al. [8] but optimized for geometry requirements. The quality of
he mesh was checked taking as reference the recommendations of
urkhart et al. [20] . All parameters were within good mesh quality
atios ( Table 1 ).
.1.3. Boundary conditions
The pre-processing of the mesh previous to calculus was con-
ucted with the software I-DEAS (SDRC, Milford, CT, USA). A rigid
lane under the foot was included in the model in order to calcu-
ate ground reaction forces. A node-to-surface contact between the
odel and the rigid plane was defined with a friction coefficient of
.6 [6] . Loads, boundary conditions, calculus, and post-processing
ere processed using ABAQUS (ABAQUS Inc., Pawtucket, RI, USA).
he loads and boundary conditions varied for each analysis and are
escribed in Section 2.4 .
.2. Material properties: tendon characterization
All the material properties used in the model were taken from
he literature except for tendon tissue. The constitutive model, the
aterial parameters, and the references are detailed in Table 2 . The
aterial model for tendons was determined based on experimental
ata collected from 100 uniaxial tensile tests of different human
oot tendons [15] .
Several hyperelastic formulations predefined in ABAQUS were
hosen to simulate the actual behavior of human foot tendons.
onstitutive models with a smaller number of material parameters
ere preferred because less experimental tests are required to de-
ermine their parameters. Ogden first and second order, Polynomial
= 1 and 2, and Polynomial reduced order 1, 2 and 3 formulations
ere included in the analysis. The material models that fitted the
verage experimental curve and also performed a real physiological
ehavior (compression stress with negative strains) were then used
o simulate uniaxial tendon tests. The model that showed better
greement with experimental data was chosen.
Once the parameters of the material model for foot tendon tis-
ue were defined, the model performance was compared with pre-
ious foot tendon material models reported in the literature: the
inear models used by Wu [11] and Garcia-Aznar et al. [13] and
he hyperelastic model used by Gu et al. [12] . Four simple one-
imensional models were created with the structural properties
f four randomly selected tendon samples from a previous exper-
mental study [15] to replicate the tests. Each model was run four
E. Morales-Orcajo et al. / Medical Engineering and Physics 49 (2017) 71–78 73
Fig. 1. Tissue layers of the finite element model. (A) Skeleton + fascia. (B) Skeleton + muscle/tendons. (C) Skeleton + soft tissue + ground.
Table 1
Mesh quality metrics based on Burkhart et al. [20] recommendations.
Mesh quality metric Assessment criteria Accurate elements Inaccurate elements
Element Jacobians > 0.2 99.9% 0.1%
Aspect Ratio < 3 94.5% 5.5%
Min angles > 30 ° 80.2% 19.8%
Max angles < 120 ° 99.8% 0.2%
Table 2
Formulation approach for each tissue included in the model. Units for the shear parameters ( μ and C ij ) are
MPa and for the compressibility parameter ( D i ) are mm
2 N
−1 .
Component Constitutive model Constants Reference
Cortical bone Linear elastic E = 17,0 0 0 MPa, ν = 0.3 [13]
Trabecular bone Linear elastic E = 700 MPa, ν = 0.3 [13]
Rearfoot cartilages Linear elastic E = 10 MPa, ν = 0.4 [43]
Forefoot cartilages Linear elastic E = 1 MPa, ν = 0.4 [44]
Fascia Linear elastic E = 350 MPa, ν = 0.3 [6]
Muscle Linear elastic E = 450 MPa, ν = 0.3 [9]
Tendon Ogden n = 1 μ = 33.1622, α = 24.8987, D = 0.0 0 01207 –
Fat tissue Hyperelastic n = 2 C 10 = 0.08556, C 01 = −0.05841, C 20 = 0.039,
C 11 = −0.02319, C 02 = 0.00851, D 1 = 3.65273,
D 2 = 0
[45]
t
c
u
2
m
p
u
C
c
f
o
c
1
d
p
p
m
T
2
I
d
m
t
i
f
2
2
t
s
c
f
p
a
i
m
I
m
[
A
w
imes, once for each different approach and the load-displacement
urve obtained was compared with the experimental curve to eval-
ate the performance of each material model.
.3. Foot finite element model validation
The biomechanical reliability of the model was evaluated by
eans of two different responses: vertical foot displacement and
lantar pressure distribution.
The vertical displacement of the foot arch structure was eval-
ated with experimental measurements available in the literature.
heung et al. [6] performed a pure vertical compression test in six
adaveric feet and the average of the six curves reported was used
or comparison. Tao et al. [21] measured the vertical deformation
f the foot in vivo under gradual increasing loads using a motion
apture system. The model was loaded axially from 0 to 500 N in
00 N step increments ( Table 3 —Configuration 1) and the vertical
isplacement of the navicular bone was compared with both ex-
erimental measurements.
The plantar pressure distribution and location of the center of
ressure (CoP) predicted by the model were matched with the
easurements of the same subject who volunteered for scanning.
he volunteer stood upright for 30 s on a pressure platform with
5 mm
2 resolution, model Footchecker (Loran Engineering S.R.L.,
taly). Due to the slightly unbalanced standing of the volunteer
uring the record time, little variations were registered from one
easure to another. Therefore, the most balanced distribution of
hree measurements was selected. The model was set up for stand-
ng position, i.e., half of the body weight and half of the tendon
orces for midstance walking phase [22] ( Table 3 —Configuration 2).
.4. Analyses
.4.1. Tendon force sensitivity analysis
The idea behind the tendon force sensitivity analysis was to de-
ermine the impact of each tendon on the foot-ankle complex. Two
ensitivity analyses were performed based on two different loading
ondition: standing position and midstance walking phase.
In the first sensitivity analysis, standing position, the tendon
orces were set as in the previous case to calculate the plantar
ressure distribution ( Table 3 —Configuration 2). Then, a sensitivity
nalysis of the five major stabilizer tendons was performed rang-
ng their loads from 0 to 300 N individually in 100 N step incre-
ents and keeping the rest of the forces in standing configuration.
n the second sensitivity analysis, midstance walking phase, the
uscle forces were based on the estimation of Salathe and Arangio
22] and the axial load was fixed as 0.9 of the body weight [23] .
gain, a sensitivity study of the stabilizer tendons from 0 to 300 N
as performed ( Table 3 —Configuration 3).
74 E. Morales-Orcajo et al. / Medical Engineering and Physics 49 (2017) 71–78
Table 3
Load configurations applied to the model in total contact position for each analysis. Ellipses indicate the values that have been
ranged in the sensitivity analysis keeping the rest of the tendon forces fixed. Force values are given in Newtons.
Loads Conf. 1 Conf. 2 Conf. 3 Conf. 4 Conf. 5
Validation Standing position Midstance phase Early-midstance Late-midstance
Axial load 0 … 500 350 630 630 630
Achilles tendon – … 150 … … 300 … 300 1300
Tibialis anterior – …–… …–… 60 –
Tibialis posterior – … 30 … … 60 … 60 60
Peroneus brevis – … 12 … … 24 … 12 36
Peroneus longus – … 24 … … 48 … 24 72
Extensor hallucis longus – 15 30 60 30
Flexor hallucis longus – 15 30 30 120
Extensor digitorum longus – 7,5 15 30 15
Flexor digitorum longus – 7,5 15 15 60
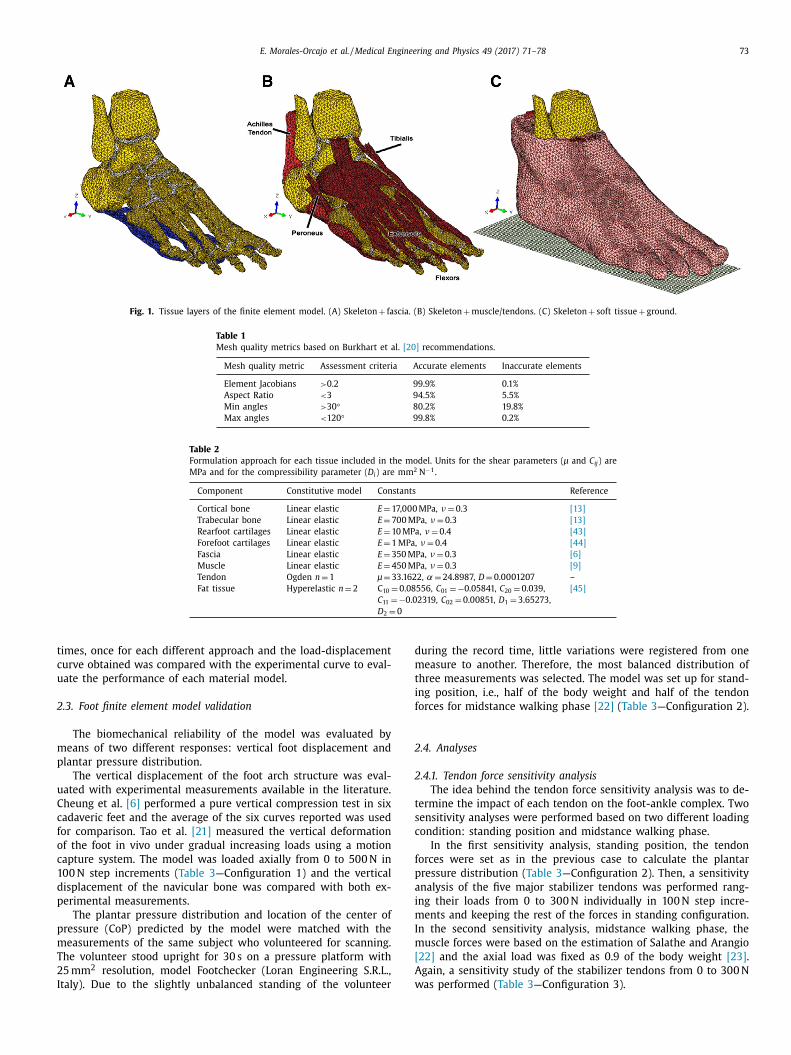
Fig. 2. Fitting curves of different material models for foot tendon tissue. Polynomial
n = 1 and 2, polynomial reduced order 1, 2 and 3 and Ogden first and second order.
The experimental curve is presented with mean and standard deviation [15] .
t
l
F
j
t
t
l
t
a
3
t
t
i
m
C
w
i
c
3
3
l
a
t
f
t
p
d
c
i
f
v
d
f
n
A
c
d
i
e
s
w
t
2.4.2. Quasi-static analysis of walking midstance phase
The walking midstance phase comprehends about 50% of the
stance phase of gait, from ∼15% to ∼65%, and within that period
the muscular stimulus varies. At early-midstance, the musculature
is disposed to impact absorption whereas at late-midstance the
musculature is arranged to impulse. Hence, the beginning and the
end of this phase were configured in order to study the effect of
these alterations ( Table 3 —Configuration 4 and 5). The load con-
ditions for these cases were estimated considering the midstance
configuration and muscle activation patterns during walking [3] .
3. Results
3.1. Tendon characterization
Out of the seven approaches chosen to fit the average foot ten-
don response, only first order Ogden formulation and polynomial
reduced of second order fitted the experimental curve performing
a real physiological behavior, i.e. compression stress with negative
strains ( Fig. 2 ). In the second step, where the uniaxial tendon tests
were replicated, the Ogden material model showed better agree-
ment with experimental data than the polynomial reduced of sec-
ond order model. Therefore, the parameters of the first order Og-
den material model were used to simulate foot tendon tissue.
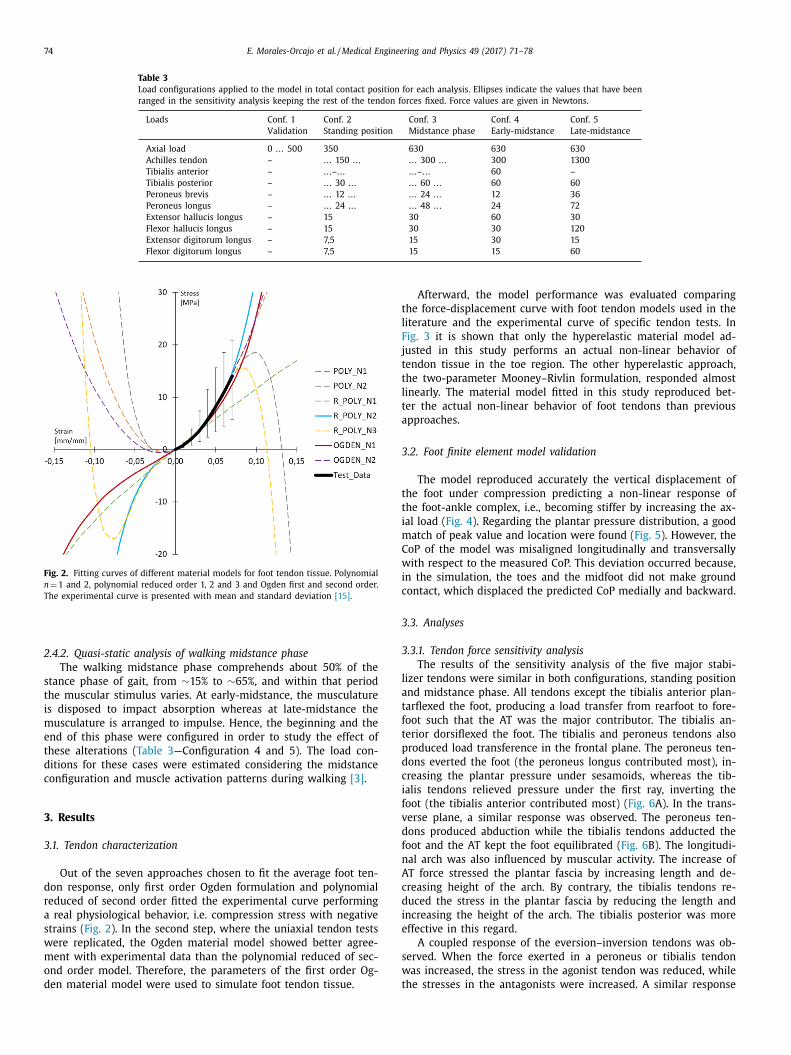
Afterward, the model performance was evaluated comparing
he force-displacement curve with foot tendon models used in the
iterature and the experimental curve of specific tendon tests. In
ig. 3 it is shown that only the hyperelastic material model ad-
usted in this study performs an actual non-linear behavior of
endon tissue in the toe region. The other hyperelastic approach,
he two-parameter Mooney–Rivlin formulation, responded almost
inearly. The material model fitted in this study reproduced bet-
er the actual non-linear behavior of foot tendons than previous
pproaches.
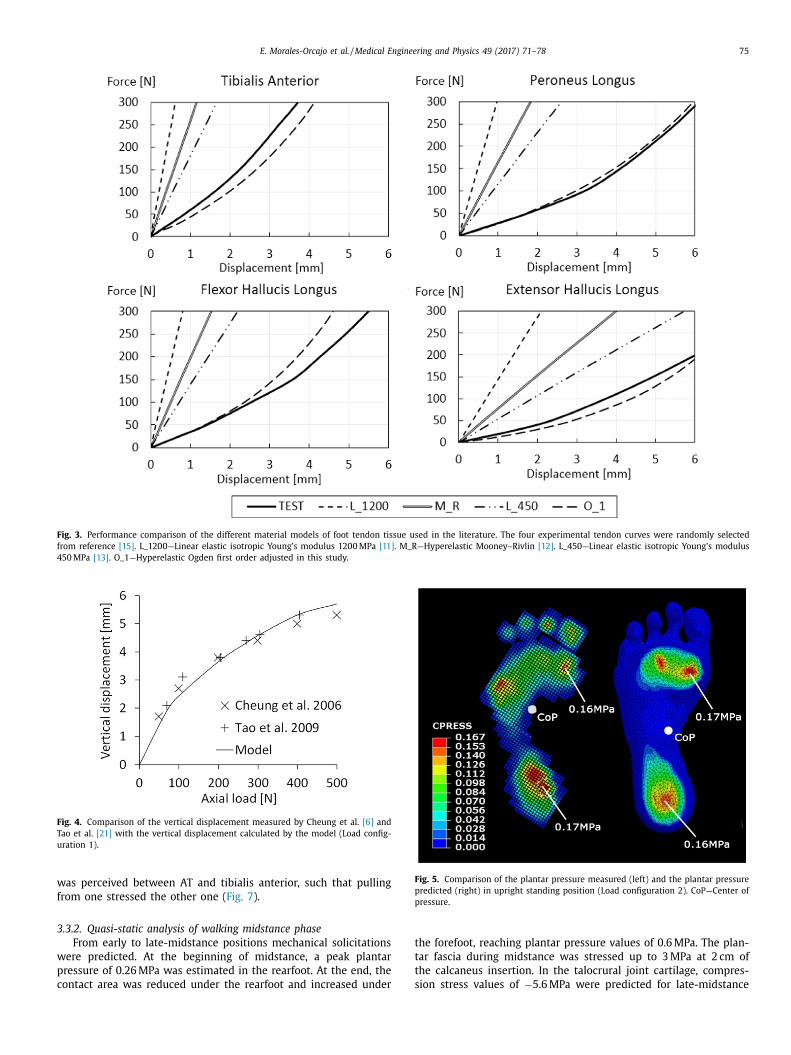
.2. Foot finite element model validation
The model reproduced accurately the vertical displacement of
he foot under compression predicting a non-linear response of
he foot-ankle complex, i.e., becoming stiffer by increasing the ax-
al load ( Fig. 4 ). Regarding the plantar pressure distribution, a good
atch of peak value and location were found ( Fig. 5 ). However, the
oP of the model was misaligned longitudinally and transversally
ith respect to the measured CoP. This deviation occurred because,
n the simulation, the toes and the midfoot did not make ground
ontact, which displaced the predicted CoP medially and backward.
.3. Analyses
.3.1. Tendon force sensitivity analysis
The results of the sensitivity analysis of the five major stabi-
izer tendons were similar in both configurations, standing position
nd midstance phase. All tendons except the tibialis anterior plan-
arflexed the foot, producing a load transfer from rearfoot to fore-
oot such that the AT was the major contributor. The tibialis an-
erior dorsiflexed the foot. The tibialis and peroneus tendons also
roduced load transference in the frontal plane. The peroneus ten-
ons everted the foot (the peroneus longus contributed most), in-
reasing the plantar pressure under sesamoids, whereas the tib-
alis tendons relieved pressure under the first ray, inverting the
oot (the tibialis anterior contributed most) ( Fig. 6 A). In the trans-
erse plane, a similar response was observed. The peroneus ten-
ons produced abduction while the tibialis tendons adducted the
oot and the AT kept the foot equilibrated ( Fig. 6 B). The longitudi-
al arch was also influenced by muscular activity. The increase of
T force stressed the plantar fascia by increasing length and de-
reasing height of the arch. By contrary, the tibialis tendons re-
uced the stress in the plantar fascia by reducing the length and
ncreasing the height of the arch. The tibialis posterior was more
ffective in this regard.
A coupled response of the eversion–inversion tendons was ob-
erved. When the force exerted in a peroneus or tibialis tendon
as increased, the stress in the agonist tendon was reduced, while
he stresses in the antagonists were increased. A similar response
E. Morales-Orcajo et al. / Medical Engineering and Physics 49 (2017) 71–78 75
Fig. 3. Performance comparison of the different material models of foot tendon tissue used in the literature. The four experimental tendon curves were randomly selected
from reference [15] . L_1200—Linear elastic isotropic Young’s modulus 1200 MPa [11] . M_R—Hyperelastic Mooney–Rivlin [12] . L_450—Linear elastic isotropic Young’s modulus
450 MPa [13] . O_1—Hyperelastic Ogden first order adjusted in this study.
Fig. 4. Comparison of the vertical displacement measured by Cheung et al. [6] and
Tao et al. [21] with the vertical displacement calculated by the model (Load config-
uration 1).
w
f
3
w
p
c
Fig. 5. Comparison of the plantar pressure measured (left) and the plantar pressure
predicted (right) in upright standing position (Load configuration 2). CoP—Center of
pressure.
t
t
t
s
as perceived between AT and tibialis anterior, such that pulling
rom one stressed the other one ( Fig. 7 ).
.3.2. Quasi-static analysis of walking midstance phase
From early to late-midstance positions mechanical solicitations
ere predicted. At the beginning of midstance, a peak plantar
ressure of 0.26 MPa was estimated in the rearfoot. At the end, the
ontact area was reduced under the rearfoot and increased under
he forefoot, reaching plantar pressure values of 0.6 MPa. The plan-
ar fascia during midstance was stressed up to 3 MPa at 2 cm of
he calcaneus insertion. In the talocrural joint cartilage, compres-
ion stress values of −5.6 MPa were predicted for late-midstance

76 E. Morales-Orcajo et al. / Medical Engineering and Physics 49 (2017) 71–78
Fig. 6. Rotation angles of the foot as function of force exerted by tendons (Load
configuration 3). (A) Eversion–inversion movement. (B) Adduction–abduction move-
ment.
TA—Tibialis anterior, TP—Tibialis posterior, AT—Achilles tendon, PB—Peroneus brevis,
PL—Peroneus longus.
Fig. 7. Stabilizer tendon relationships. Above: Tendon location scheme on the cross-
section of the ankle at talocrural-joint–high. Below: Tendon stress relationship ob-
served in the sensitivity analysis. In each row, one tendon was pulled and the re-
action of the other tendons is represented by increasing ( � ) or decreasing stress
( � ).
d
f
T
s
u
m
s
m
o
o
i
t
m
m
t
m
b
s
F
e
t
t
u
a
l
T
t
i
a
m
B
t
phase. With respect to the tendons, tibialis and peroneus ten-
dons worked in values of 1–3 MPa during midstance cases and the
AT reached 17.7 MPa at late-midstance analysis. In late-midstance
position, higher mechanical response of the foot structure was
required.
4. Discussion
In the present study, a complete foot FE model was developed
including a detailed representation of the actual geometry and be-
havior of tendons. Trabecular and cortical bones were differenti-
ated and each cartilage, fascia, tendon, and muscle that compounds
the foot were included in the model, comprising 102 deformable
volumes. Tendons were simulated with a non-linear first order Og-
den material model adjusting the parameters with uniaxial ten-
don testing curves. Finally, the model was validated and the effect
in the foot-ankle complex produced by the extrinsic tendons was
assessed.
Input requirements of biomechanical models make necessary
to quantify the force applied by each muscle-tendon-unit during
a specific movement. Since there are no actual measurements of
those forces in the literature, kinetic estimations have to be used.
In the present study, the muscle forces calculated by Salathe and
Arangio [22] were chosen as a reference to set the different load-
ing conditions. These values are consistent with the range of force
in which each tendon is expected to work; considering that ten-
ons work regularly below half of its capacity the values proposed
or midstance positions are below 15% of the load failure [15,24] .
hese values have been adopted previously for the computational
imulation of flatfoot (Pes Planus) [25] and are similar to the val-
es employed in other computational and cadaveric models esti-
ated through different approaches [26,27] .
The model predictions were validated in two different re-
ponses and showed good agreement with in-vivo and in-vitro
easurements. This model is a step further in the development
f foot FE models since it includes a more accurate simulation
f the tendon tissue. This new feature opens new possibilities
n the analysis of foot soft tissue function and pathology. In
he literature there are abundant research studies related to the
uscle-tendon activity during walking: capture motion measure-
ents, electromyographic reports, musculoskeletal models estima-
ions and dynamic cadaver performances, however, none of these
ethods measured tissue stress. Stress information is relevant
ecause it is the mechanical parameter closely related to pain, tis-
ue damage and mechanical stimuli of biochemical processes. The
E model presented in this study, based upon kinetic parameters,
stimates tissue stress, an important contribution to the produc-
ion of trustworthy information of clinical relevance.
The new model used in this study present some limitations
hat need to be addressed in future developments. A better sim-
lation of bone-to-bone contact is necessary. There are two main
pproaches to deal with this interaction. One is the use of friction-
ess contact elements, which allow free movement between bones.
his approach produces higher displacements between bony struc-
ures than in the experimental measures [6] . The other approach
s to disregard contact properties of joints connecting one bone to
nother with low stiffness elements. The latter was used in this
odel and it has the limitation of making joint movements stiffer.
ecause of this option, ligaments were not simulated. Other fea-
ures that should be improved to take full advantage of the model

E. Morales-Orcajo et al. / Medical Engineering and Physics 49 (2017) 71–78 77
a
p
d
p
p
s
t
f
a
c
v
a
t
m
i
T
o
p
b
t
t
c
c
s
f
t
i
c
m
f
m
u
v
m
i
d
p
T
h
r
e
a
t
m
s
s
u
a
i
t
m
t
w
i
g
t
i
p
i
o
w
m
r
s
i
s
a
p
t
c
o
e
t
s
a
c
c
t
[
a
p
t
a
t
[
t
t
r
t
n
c
5
t
t
m
o
i
v
m
f
e
p
i
t
A
c
E
s
p
g
t
t
C
re the soft tissue volume interactions. Within the foot-ankle com-
lex, many muscle and tendon components overlap, limiting the
isplacement of one component respect to its surrounding. A slip-
ing interaction between these components when a force is ap-
lied to a tendon would be desirable, although this feature repre-
ents a difficult computational challenge. In addition, remark that
he results are susceptible to the force input data. Quantifying the
orces exerted by each muscle during lower limb movements is
challenging task. Actual measurements on this matter are diffi-
ult to find in the literature because measuring muscle forces in
ivo is generally not feasible. Therefore, the use of optimization
lgorithms based on physiological parameters is a recurrent way
o predict tendon pulling forces. Due to the nature of those esti-
ations, proposed values are within a large range and variability
ncreases by inter-subject differences, age, and gender dependency.
herefore, advances in that direction will also improve the fidelity
f the model.
Tissues are composite materials with sophisticated non-linear
roperties. Due to the limitation of the computational capacity a
alance between the intricate geometry and the material proper-
ies used is necessary [2] . Foot FE models with detailed geome-
ry usually include linear material properties to compensate the
omplexity of the mesh regarding the computational cost [28] . Re-
ent models present improvements to reduce the gap between the
imulation and the reality, as in the case of the present study
or tendons and others for fascia [29] or for cartilages [30] . All
hese effort s together with the advances in computational capac-
ty will give us the capacity to model the human foot with all its
omplexities.
The present model calculated the inversion–eversion move-
ents of the foot relative to the tibia as a function of tendon
orces. The peroneus tendons increased plantar pressure under the
edial aspect and the tibialis tendons increased plantar pressure
nder the lateral aspect. At the ankle articular cartilage, the re-
erse was true, peroneus stressed lateral side while tibialis stressed
edial side. This pattern was noted by Potthast et al. [31] measur-
ng the effect of the muscle forces in the intraarticular pressure
istribution of the talocrural joint. They concluded that the cou-
led activation of synergist tendons would intensify those changes.
he FE model predicted cartilage peak stress values of this joint
igher than the measurements reported for similar axial load
atios [32,33] . This overestimation could be expected since the lin-
ar material model applied to simulate the cartilage behavior was
gross approximation for this complex tissue. A refined formula-
ion for these components will provide better results.
In the cadaveric simulation performed by Sharkey et al. [34] , a
irror effect was described with respect to the sagittal plane. Load
ettings that produced high medial strains tended to produce low
trains on the lateral side. This effect was also noted in our sim-
lations, but besides a combined work of the tendons to keep the
nkle movement stable. This coupled activation pattern of tendons
s understandable given the precise control motion requirements
o reach the responsiveness of the foot-ankle complex.
The arch-supporting function of the tibialis posterior is a com-
on discussion in the literature [35–37] . However, the capacity of
ibialis anterior of avoiding excessive navicular drop has not been
ell studied yet. The model predicted similar functions for the tib-
alis anterior than for the tibialis posterior although in a lesser de-
ree. Future research in this line could open new possibilities for
he treatment or preservation of pes planus.
Regarding the midstance analysis, it was observed that the foot
s subjected to higher mechanical stresses during late-midstance
revious to the heel rise. Stress in the plantar fascia was predicted
n the proximal portion where plantar fasciitis is more likely to
ccur. The AT stress value predicted at the late-midstance position
as similar to the 19 MPa maximal tension stress during walking
easured by Finni et al. [38] . The stress levels estimated for the
est of the tendons constituted around 10% of their ultimate tensile
tresses [15] . Considering that biological tissues, in their physiolog-
cal performance, work below half the failure stress, these levels of
olicitation are reasonable for a relatively low mechanical demand
ctivity such as walking.
From a clinical perspective, the model can be applied to many
athological or dysfunctional conditions, such as altered muscle ac-
ivation patterns. The present model-based findings also provide
linically relevant information on the role of the ankle muscles
n pronation-supination. Health professionals are frequently inter-
sted in walking mechanisms that may decrease excessive prona-
ion during early stance and may produce supination during late
tance, in order to treat or prevent pathological conditions such
s plantar fasciitis and medial tibial stress syndrome [39,40] . Ac-
ording to the present findings, at early-midstance, the ankle mus-
les produce a total torque of inversion and adduction, i.e., supina-
ion, while it is known that the foot is pronating at this instant
41] . Thus, these muscles decelerate pronation at early midstance
nd this function should be clinically optimized to avoid excessive
ronation. The present results also showed that, at late-midstance,
he ankle muscles, mostly demanded to generate plantar flexion
nd gait propulsion, produce a total torque of eversion and abduc-
ion, i.e., pronation. At this instant, the foot is actually supinating
41] , what would be decelerated by the ankle muscles. Therefore,
o optimize supination at late-midstance, the role of tissues other
han ankle muscles should be also regarded. Lower-limb external
otation produced at the hip and its role in increasing supina-
ion [42] , through the mechanical coupling between shank exter-
al rotation and foot supination [41] , should be then clinically
onsidered.
. Conclusions
In this study, a three-dimensional FE model of the human foot,
aking into account the real geometry and non-linear behavior of
endons, was developed and validated. The new features of the
odel focus in tendon stress estimation were used to shed light
n the role of the five major stabilizer tendons and their impact
n the foot-ankle complex. The model fed with kinetic data pro-
ides the mechanical response of each of the foot components. The
odel output is strongly related to the load tendon setting. There-
ore, advances in muscle control force quantification during differ-
nt lower limb movements will significantly help for more reliable
redictions of the model.
The work was framed in the area of orthopedic biomechan-
cs and was intended to advance towards a refined simulation of
he internal soft tissues of the foot to predict therapy outcomes.
dvances in biomechanical modeling will provide useful tools for
linical assessment, reducing cost and health hazards.
thics approval
Ethical approval for this study was granted by Bioethical Re-
earch Committee of the Hospital Clinico San Carlos at Com-
lutense University (reference number 12/210-E). The volunteer
ave written informed consent for participating in the computer
omographies and magnetic resonance imaging scanning and plan-
ar pressure measurements.
onflicts of interests
The authors have no conflicts of interest to declare.

78 E. Morales-Orcajo et al. / Medical Engineering and Physics 49 (2017) 71–78
Acknowledgments
The authors would like to thank Dr. Ricardo Becerro de Bengoa
Vallejo and Dr. Marta Losa Iglesias for providing the computer to-
mographies, magnetic resonance images and plantar pressure mea-
surements of the volunteer. Enrique Morales Orcajo was partially
funded by the Brazilian Government—Coordenação de Aperfeiçoa-
mento de Pessoal de Nivel Superior (CAPES). The study has been
support by the Ministry of Economy and competitiveness of the
Government of Spain through the project DPI2013-44987-R.
Supplementary materials
Supplementary material associated with this article can be
found, in the online version, at doi:10.1016/j.medengphy.2017.07.
010 .
References
[1] Fontanella CG, Favaretto E, Carniel EL, Natali AN. Constitutive formulation andnumerical analysis of the biomechanical behaviour of forefoot plantar soft tis-
sue. J Eng Med 2014;228:942–51. doi: 10.1177/0954411914551852 .
[2] Morales-Orcajo E, Bayod J, Barbosa de Las Casas E. Computational foot mod-eling: scope and applications. Arch Comput Methods Eng 2016;23:389–416.
doi: 10.1007/s11831-015-9146-z . [3] Sharkey NA , Hamel AJ . A dynamic cadaver model of the stance phase
of gait: performance characteristics and kinetic validation. Clin Biomech1998;13:420–33 .
[4] Neptune RR, Kautz SA, Zajac FE. Contributions of the individual ankle plantar
flexors to support, forward progression and swing initiation during walking. JBiomech 2001;34:1387–98. doi: 10.1016/S0 021-9290(01)0 0105-1 .
[5] Murley GS, Menz HB, Landorf KB. Electromyographic patterns of tibialis pos-terior and related muscles when walking at different speeds. Gait Posture
2014;39:1080–5. doi: 10.1016/j.gaitpost.2014.01.018 . [6] Cheung JT-M, Zhang M, An K-N. Effect of Achilles tendon loading on plan-
tar fascia tension in the standing foot. Clin Biomech 2006;21:194–203. doi: 10.
1016/j.clinbiomech.2005.09.016 . [7] Chen Y-N, Chang C-W, Li C-T, Chang C-H, Lin C-F. Finite element analysis
of plantar fascia during walking: a quasi-static simulation. Foot Ankle Int2014;36:90–7. doi: 10.1177/1071100714549189 .
[8] Isvilanonda V, Dengler E, Iaquinto JM, Sangeorzan BJ, Ledoux WR. Finite ele-ment analysis of the foot: model validation and comparison between two com-
mon treatments of the clawed hallux deformity. Clin Biomech 2012;27:837–44.
doi: 10.1016/j.clinbiomech.2012.05.005 . [9] Morales-Orcajo E, Bayod J, Becerro-de-Bengoa-Vallejo R, Losa-Iglesias M,
Doblare M. Influence of first proximal phalanx geometry on hallux valgusdeformity: a finite element analysis. Med Biol Eng Comput 2015;53:645–53.
doi: 10.1007/s11517-015-1260-4 . [10] Chen W-M, Park J, Park S-B, Shim VP-W, Lee T. Role of gastrocnemius-soleus
muscle in forefoot force transmission at heel rise—a 3D finite element analysis.
J Biomech 2012;45:1783–9. doi: 10.1016/j.jbiomech.2012.04.024 . [11] Wu L. Nonlinear finite element analysis for musculoskeletal biomechanics of
medial and lateral plantar longitudinal arch of Virtual Chinese Human afterplantar ligamentous structure failures. Clin Biomech 2007;22:221–9. doi: 10.
1016/j.clinbiomech.20 06.09.0 09 . [12] Gu YD, Li JS, Lake MJ, Ren XJ, Zeng YJ. The mechanical response of Achilles
tendon during different kinds of sports. Commun Numer Methods Eng2008;24:2077–85. doi: 10.1002/cnm .
[13] García-Aznar JM, Bayod J, Rosas A, Larrainzar R, García-Bógalo R, Doblaré M,
et al. Load transfer mechanism for different metatarsal geometries: a finite el-ement study. J Biomech Eng 2009;131:21011. doi: 10.1115/1.3005174 .
[14] Wang JH-C. Mechanobiology of tendon. J Biomech 2006;39:1563–82. doi: 10.1016/j.jbiomech.2005.05.011 .
[15] Morales-Orcajo E, Becerro De Bengoa Vallejo R, Losa Iglesias M, Bayod J. Struc-tural and material properties of human foot tendons. Clin Biomech 2016;37:1–
6. doi: 10.1016/j.clinbiomech.2016.05.014 .
[16] Shin J, Yue N, Untaroiu CD. A finite element model of the foot and an-kle for automotive impact applications. Ann Biomed Eng 2012;40:2519–31.
doi: 10.1007/s10439- 012- 0607- 3 . [17] Fernandes R, Aguiar R, Trudell D, Resnick D. Tendons in the plantar aspect
of the foot: MR imaging and anatomic correlation in cadavers. Skeletal Radiol2007;36:115–22. doi: 10.1007/s00256- 006- 0203- 4 .
[18] Sarrafian SK. Anatomy of the foot and ankle. Descriptive, topographic, func-
tional. Ed. 2. 1993. [19] Michaud TC . Human locomotion: the conservative management of gait-related
disorders; 2011 .
[20] Burkhart TA, Andrews DM, Dunning CE. Finite element modeling mesh qual-ity, energy balance and validation methods: a review with recommendations
associated with the modeling of bone tissue. J Biomech 2013;46:1477–88.doi: 10.1016/j.jbiomech.2013.03.022 .
[21] Tao K, Wang D, Wang C, Wang X, Liu A, Nester CJ, et al. An in vivo ex-perimental validation of a computational model of human foot. J Bionic Eng
2009;6:387–97. doi: 10.1016/s1672- 6529(08)60138- 9 . [22] Salathe EP, Arangio GA. A biomechanical model of the foot: the role of muscles,
tendons, and ligaments. J Biomech Eng 2002;124:281. doi: 10.1115/1.1468865 .
[23] Barela AMF , De Freitas PB , Celestino ML , Camargo MR , Barela JA . Ground re-action forces during level ground walking with body weight unloading. Braz J
Phys Ther 2014;18:572–9 . [24] Wren TA , Yerby SA , Beaupré GS , Carter DR . Mechanical properties of the hu-
man Achilles tendon. Clin Biomech 2001;16:245–51 . [25] Wang Z, Imai K, Kido M, Ikoma K, Hirai S. A finite element model of flatfoot
(Pes Planus) for improving surgical plan. Conf proc annu int conf IEEE eng med
biol soc IEEE eng med biol soc annu conf 2014; 2014. p. 844–847. doi: 10.1109/EMBC.2014.6943723 .
[26] Imhauser CW, Siegler S, Abidi NA, Frankel DZ. The effect of posterior tibialistendon dysfunction on the plantar pressure characteristics and the kinemat-
ics of the arch and the hindfoot. Clin Biomech 2004;19:161–9. doi: 10.1016/j.clinbiomech.20 03.10.0 07 .
[27] Liu X, Zhang M. Redistribution of knee stress using laterally wedged insole
intervention: finite element analysis of knee-ankle-foot complex. Clin Biomech2013;28:61–7. doi: 10.1016/j.clinbiomech.2012.10.004 .
[28] Wong DW-C, Niu W, Wang Y, Zhang M. Finite element analysis of foot andankle impact injury: risk evaluation of calcaneus and talus fracture. PLoS One
2016;11:e0154435. doi: 10.1371/journal.pone.0154435 . [29] Lin S-C, Chen CP-C, Tang SF-T, Chen C-W, Wang J-J, Hsu C-C, et al.
Stress distribution within the plantar aponeurosis during walking—a dy-
namic finite element analysis. J Mech Med Biol 2014;14:1450053. doi: 10.1142/S0219519414500535 .
[30] Marchelli GLS, Ledoux WR, Isvilanonda V, Ganter MA, Storti DW. Joint-specificdistance thresholds for patient-specific approximations of articular cartilage
modeling in the first ray of the foot. Med Biol Eng Comput 2014;52:773–9.doi: 10.1007/s11517- 014- 1179- 1 .
[31] Potthast W, Lersch C, Segesser B, Koebke J, Brüggemann GP. Intraarticular pres-
sure distribution in the talocrural joint is related to lower leg muscle forces.Clin Biomech 2008;23:632–9. doi: 10.1016/j.clinbiomech.20 07.11.0 05 .
[32] Calhoun JH, Li F, Ledbetter BR, Viegas SF. A comprehensive study of pres-sure distribution in the ankle joint with inversion and eversion. Foot Ankle
Int 1994;15:125–33. doi: 10.1177/107110 07940150 0307 . [33] Natsakis T, Burg J, Dereymaeker G, Vander Sloten J, Jonkers I. Extrinsic mus-
cle forces affect ankle loading before and after total ankle arthroplasty. Clin
Orthop Relat Res 2015. doi: 10.1007/s11999- 015- 4346- 2 . [34] Sharkey N , Ferris L , Smith T , Matthews D . Strain and loading of the second
metatarsal during heel-lift. J Bone Joint Surg 1995;77A:1050–7 . [35] Thordarson DB , Schmotzer H , Chon J , Peters J . Dynamic support of the hu-
man longitudinal arch—a biomechanical evaluation. Clin Orthop Relat Res1995;316:165–72 .
[36] Kitaoka H , Luo Z , An K . Effect of the posterior tibial tendon on the arch of thefoot during simulated weightbearing: biomechanical analysis. Foot Ankle Int
1997;18:43–6 .
[37] Watanabe K, Kitaoka HB, Fujii T, Crevoisier X, Berglund LJ, Zhao KD, et al. Pos-terior tibial tendon dysfunction and flatfoot: analysis with simulated walking.
Gait Posture 2013;37:264–8. doi: 10.1016/j.gaitpost.2012.07.015 . [38] Finni T , Komi P , Lukkariniemi J . Achilles tendon loading during walking: appli-
cation of a novel optic fiber technique. Eur J Appl Physiol 1998;77:289–91 . [39] Chang R, Rodrigues PA, Van Emmerik REA, Hamill J. Multi-segment foot kine-
matics and ground reaction forces during gait of individuals with plantar fasci-
itis. J Biomech 2014;47:2571–7. doi: 10.1016/j.jbiomech.2014.06.003 . [40] Neal BS, Griffiths IB, Dowling GJ, Murley GS, Munteanu SE, Franettovich
Smith MM, et al. Foot posture as a risk factor for lower limb overuse in-jury: a systematic review and meta-analysis. J Foot Ankle Res 2014;7:1–13.
doi: 10.1186/s13047- 014- 0055- 4 . [41] Souza TR, Pinto RZ, Trede RG, Kirkwood RN, Fonseca ST. Temporal couplings
between rearfoot-shank complex and hip joint during walking. Clin Biomech
2010;25:745–8. doi: 10.1016/j.clinbiomech.2010.04.012 . [42] Souza TR, Mancini MC, Araújo VL, Carvalhais VOC, Ocarino JM, Silva PL, et al.
Clinical measures of hip and foot-ankle mechanics as predictors of rearfootmotion and posture. Man Ther 2014;19:379–85. doi: 10.1016/j.math.2013.10.
003 . [43] Gefen A. Stress analysis of the standing foot following surgical plantar fascia
release. J Biomech 2002;35:629–37. doi: 10.1016/s0021-9290(01)00242-1 .
[44] Athanasiou KA , Liu GT , Lavery LA , Lanctot DR , Schenck RC . Biomechanical to-pography of human articular cartilage in the first metatarsophalangeal joint.
Clin Orthop Relat Res 1998;348:269–81 . [45] Chen W-M, Lee T, Lee PV-S, Lee JW, Lee S-J. Effects of internal stress concen-
trations in plantar soft-tissue—a preliminary three-dimensional finite elementanalysis. Med Eng Phys 2010;32:324–31. doi: 10.1016/j.medengphy.2010.01.001 .