Embed Size (px)
Citation preview
State of Connecticut Insurance Department
Commissioner Thomas R. Sullivan
P.O. Box 816
153 Market Street Hartford, CT 06142-0816
(860) 297-3801 www.ct.gov/cid
Connecticut Medical Malpractice Annual Report
May 2010
Contents
Connecticut Medical Malpractice Annual Report – 2010
I. Introduction
II. Background
III. Data Collection
IV. Description of Analysis
V. Limitations of Analysis
VI. Key Findings
VII. Detailed Findings
VIII. Rate Filings and Industry Calendar Year Data Appendix 1 – Closed Claims Analyst Report Appendix 2 – Calendar Year Premium and Losses Appendix 3 – Insurance Industry Financial Data Appendix 4 - Connecticut General Statute § 38a-395 Appendix 5 – Application Users Guide
1
Connecticut Medical Malpractice Annual Report – 2010 I. Introduction Pursuant to Section 14 of Public Act 05-275, codified as C.G.S. section 38a-395, the Connecticut Insurance Department (the “Department”) hereby submits its 2010 annual report to the General Assembly. The report summarizes the Connecticut medical malpractice liability closed claim data received by the Department for the fourth quarter of 2005 and calendar years 2006 through 2009. In addition, it provides a summary of rate filing activity for 2009, premium information by medical provider specialty for 2009 and industry calendar year experience for 2005 through 2009. Copies of prior year reports are available on the Department’s website at www.ct.gov/cid. II. Background The Connecticut legislature passed Public Act 05-275 (the “Act”) in 2005. This Act, among other things, required that after January 1, 2006 each insurer “that insures a physician, surgeon, hospital, advanced practice registered nurse or physician assistant against professional liability” provide the Insurance Commissioner with a closed claim report on a quarterly basis. For purposes of closed claim reporting, an “insurer” includes captives and self-insured entities or persons. In 2007, the legislature passed Public Act 07-25 which expanded the definition of medical specialties for which closed claim reporting was required. The expanded reporting, effective October 1, 2007, requires submission of closed claims for all “medical professionals and hospitals”. The definition of “medical professional” has the same meaning as provided in C.G.S. section 38a-976. The details of the requirements for the claim information to be reported are provided in C.G.S. section 38a-395(c) and a copy of 38a-395 as revised in 2007 is attached as Appendix 4. The individual closed claim data collected by the Department, as required by C.G.S. 38a-395, is confidential. As a result, this report summarizes data in order to maintain the confidentiality of the individual claim information filed by each reporting entity. III. Data Collection During 2008, Department staff, in conjunction with the University of Connecticut’s Department of Computer Science and Engineering, developed a new data reporting application. This secured web-based application, which became operational in the fourth quarter of and year-end 2008 reporting. Since that time users have been able to submit closed claim information directly to the Department’s website. This new reporting tool will enhance the quality and timeliness of the data and has received positive feedback from reporting entities. Closed claim data prior to the fourth quarter of 2008 were submitted using the Department’s previous software application. The required closed claim data elements are submitted to the Department on a quarterly basis. Closed claim reports are due by the 10th of the month following the last month of
1
each quarter. In addition to the closed claim data, the Department also captures annual calendar year premium and loss information as required in the statute. Information on rate filing activity was compiled from the Department’s files. We received data from 102 insuring entities, which included 45 admitted insurance companies, 25 surplus lines insurers, 6 risk retention groups (RRG’s) and 26 hospitals or hospital groups that are either self-insured or insured with a captive. While there are still some delays in providing the closed claim information, compliance with the data submission requirements by insurers was generally good. As was the case last year, some of the risk retention groups continue to assert that the Federal Liability Risk Retention Act provides them an exemption from having to report claim data to Connecticut or any other state. Fortunately, most of the RRG’s have relatively small market shares, with the exception of MCIC Vermont, Inc. (MCIC), which is now the leading writer of medical malpractice liability insurance in the state. MCIC, although continuing to assert the exemption, agreed to supply summarized claim information to the Department again this year. The Department recently requested an opinion from Attorney General Blumenthal as to the extent to which the Department can use its regulatory authority to compel RRG’s to supply this data for our analysis. Depending on the Attorney General’s response, the Department may have more information to supply the legislature in future years. Since the publication of last year’s report, we have received additional closed claim data from a number of entities that were unable to meet the prior year’s filing deadline. In addition, we uncovered a number of data errors as part of our reasonability checking process. As a result of these additional submissions and data corrections, there were an additional 22 claims reported as closing in calendar year 2008 that were not included in last year’s report. As such, any comparisons of this year’s report to last year’s published report will be distorted. IV. Description of Analysis A claim is a demand for compensation due to alleged malpractice of a health care provider or facility as defined in the Act. For the purposes of this report, and based on general practice, when an insurer opens a file and begins to investigate the circumstances of a demand for compensation, a claim has occurred, whether or not a lawsuit is ever filed. When the file is closed, even when the claimant receives no payment, the claim must be reported and counted as a closed claim. In this report, two primary pieces of claim data are analyzed:
- Paid indemnity: The amount of compensation paid to a claimant or plaintiff on behalf of each defendant.
- Allocated Loss Adjustment Expenses (ALAE): These are expenses
associated with defending the case. They are comprised of payments to defense counsel for legal services, and other expenses incurred by
2
the insuring entity to handle a specific claim, such as investigations or fees for expert witnesses.
In this analysis, as displayed on the reports in Appendix 1, we organized and summarized the data to reflect the types of medical malpractice claims, the age and size of these claims and the type of insurer. For purposes of this report, we define Commercial Insurer (“Commercial Insurer”) to include admitted insurers and surplus lines carriers. Also, experience for captives, RRG’s and self-insurers (captives/self-insurers) was combined. Readers of this report should keep in mind that when comparing the four years displayed in the closed claim exhibits that there is only one quarter of data in 2005 and four quarters in 2006 through 2009. This report contains more data for our analysis as in the past (seventeen quarters). The overall statistical credibility of the data is still somewhat limited and therefore, caution should be exercised in drawing any definitive conclusions at this time. Subsequent annual reports will continue to add more data, eventually allowing trends to emerge and the opportunity for additional detail in the analysis. Appendix 2 also includes an exhibit (Report 12) displaying full calendar year premiums and losses for 2005 through 2009. It should be noted that the losses displayed in Report 12 are not comparable to the closed claim data provided in the reports in Appendix 1. The paid losses in Report 12 include partial payments on claims that are still open and the incurred losses include reserve estimates on open cases. The Appendix 1 reports include only payments on claims that have reached final closure. In Appendix 3, we have provided annual financial statement data from the National Association of Commissioners (NAIC) database. For calendar years 2008 and 2009 we have displayed premium, loss, expense and investment income data individually for the top 15 insurers writing medical malpractice insurance in Connecticut. In addition, we have provided similar data for all companies combined for calendar years 2001 – 2009. These exhibits do not include data for captives or self-insurers, but do include RRG’s. V. Limitations of Analysis The loss analysis is based entirely on historical closed claim data. That is, claims are reported to us and included in this analysis based on the quarter and year in which they reach a final outcome and all payments had been made. Some arose from fairly recent medical incidents, but most arose from incidents that occurred a number of years ago. The Department has relied on the accuracy of the data submitted by the various insuring entities. Other than checking the claim data for reasonability, the Department has not attempted to verify or audit the accuracy of the submitted information directly with the reporting entities. As such, the quality of the analysis is dependent on the accuracy of the data submitted by the insurers and self-insurers. This report is not intended to be used to evaluate past or current medical malpractice liability insurance rates.
3
VI. Key Findings While the data is limited in that it only includes claims closed in seventeen calendar quarters, there are some observations that can be made from an analysis of the claim information. Greater detail is provided in Section VII which provides the narrative describing the reports and charts in Appendix 1. • Total Claims: A total of 2,839 closed claims were reported for the seventeen quarters
included in the reporting period. Commercial Insurers reported more than half of the claims, or 1,500. Captives/self-insurers reported 1,339 claims.
• Indemnity Payments: Indemnity payments include all compensation paid to
claimants or plaintiffs. A majority of medical malpractice claims resulted in no indemnity payments. A little over half (52%) of the claims, 1,463, had no indemnity payments, while the remainder, 1,376, closed with an indemnity payment. The total amount paid to claimants was $850.0 million, an average of $617,722 for those claims with an indemnity payment. The payments include amounts for both economic and non-economic damages. Fewer claims were reported as closed in 2009 compared to 2008 and the average indemnity payment decreased from approximately $608,000 in 2008 to $545,000 in 2009.
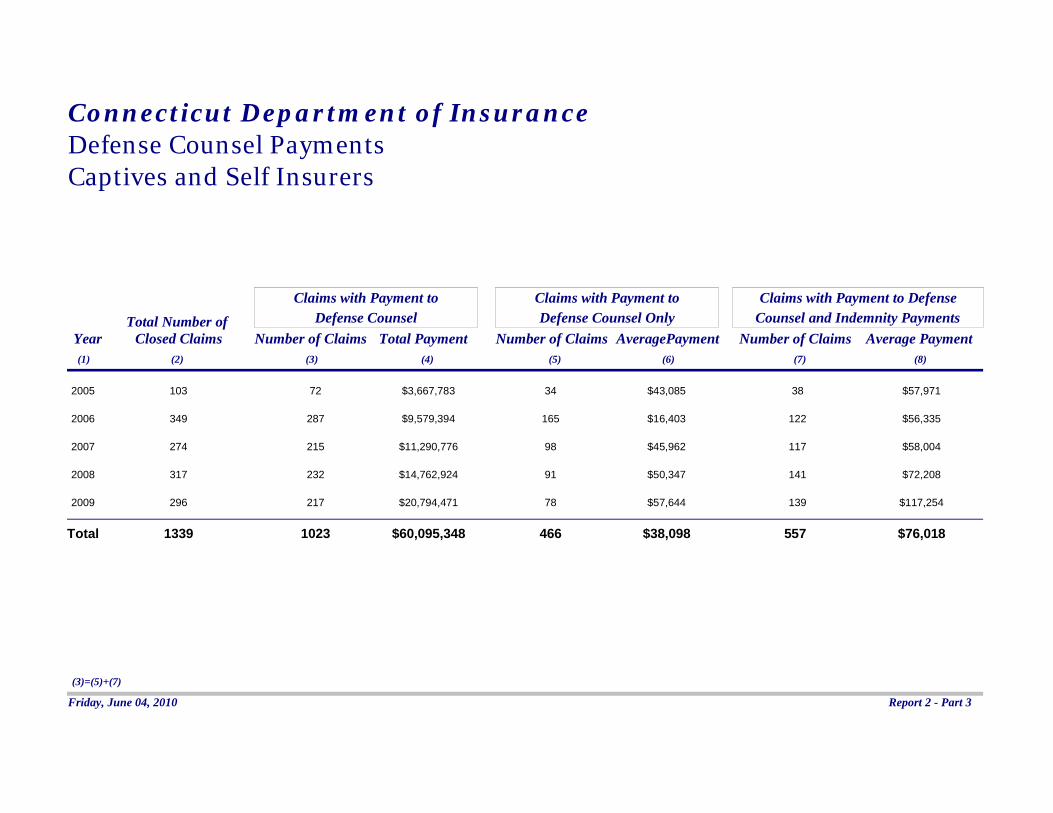
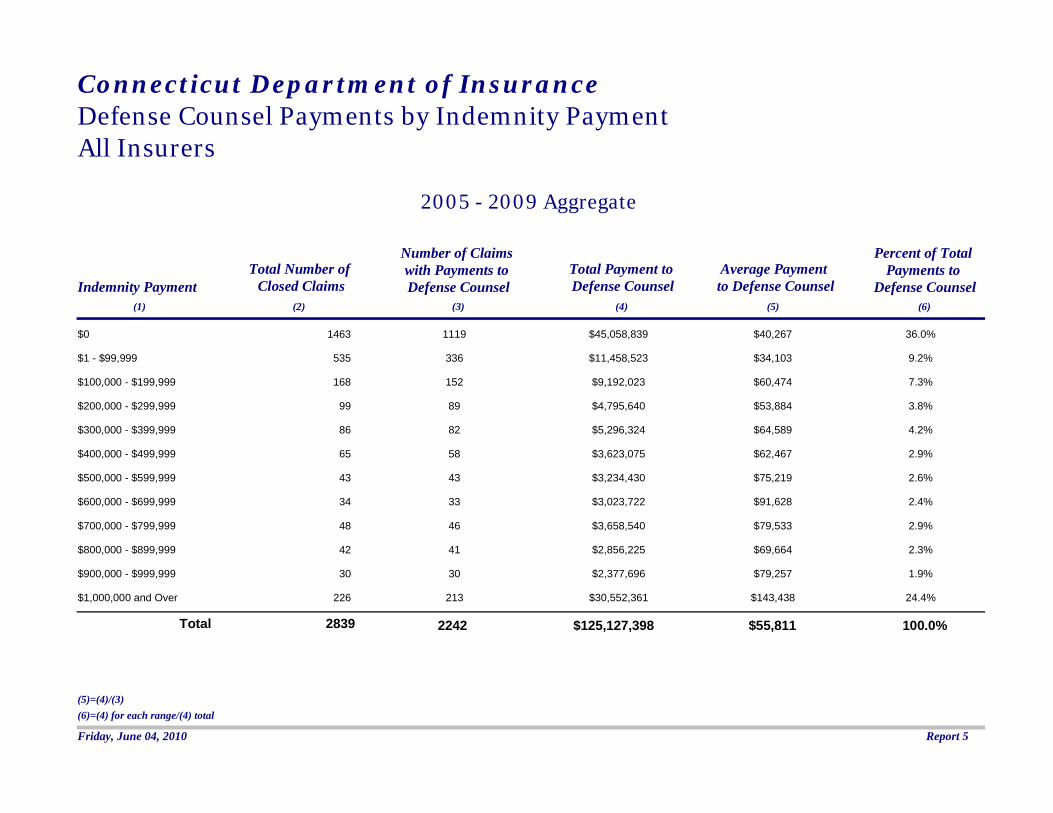
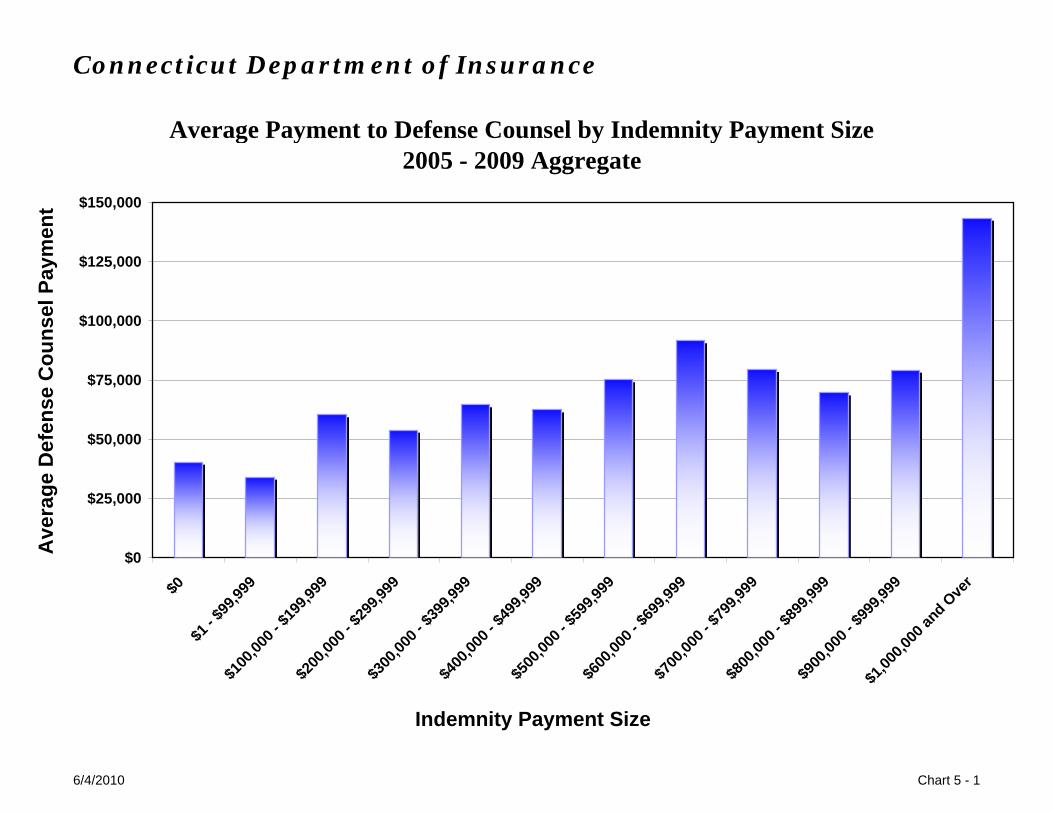
• Defense Counsel Payments: Over half of the claims closed with no payments to
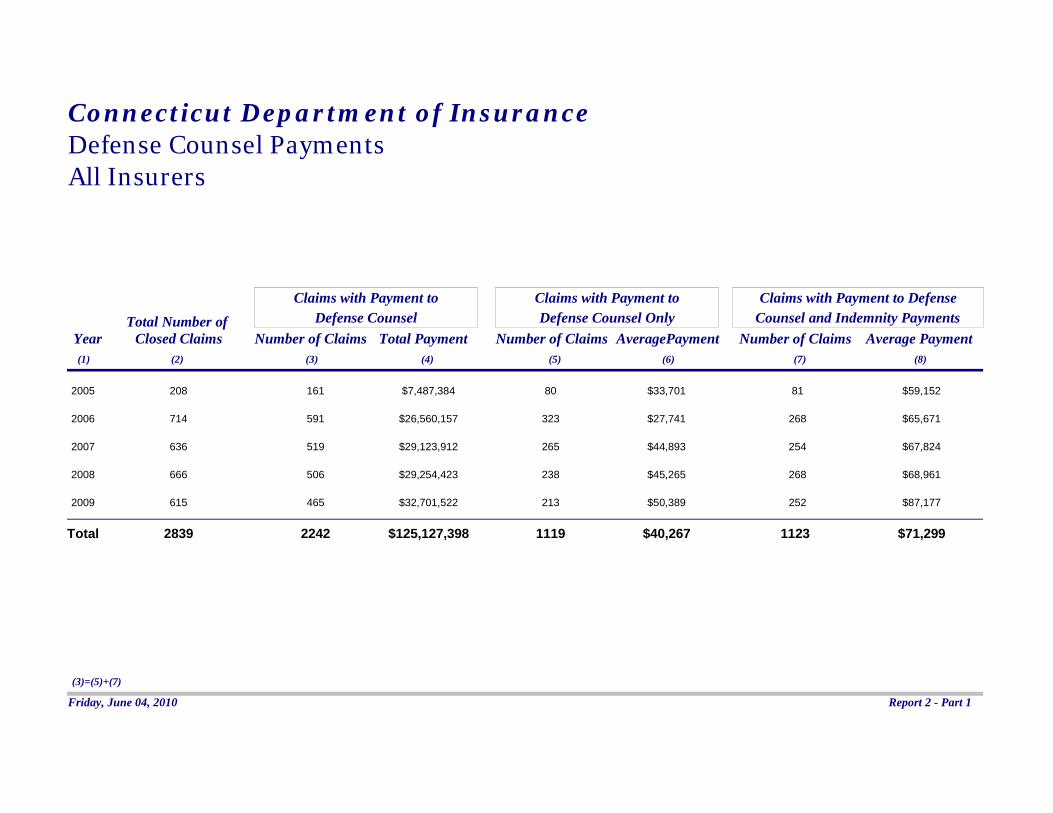
claimants, yet 79%, or 2,242, generated legal expenses to defend the claim. These expenses totaled $125.1 million, an average of $55,810 per claim. Of these, 50% (1,119) were for incidents that had no payments to claimants, averaging $40,267 for legal expenses. Legal defense costs continued to rise year over year with a significant increase from an average of approximately $58,000 last year to $70,000 in 2009.
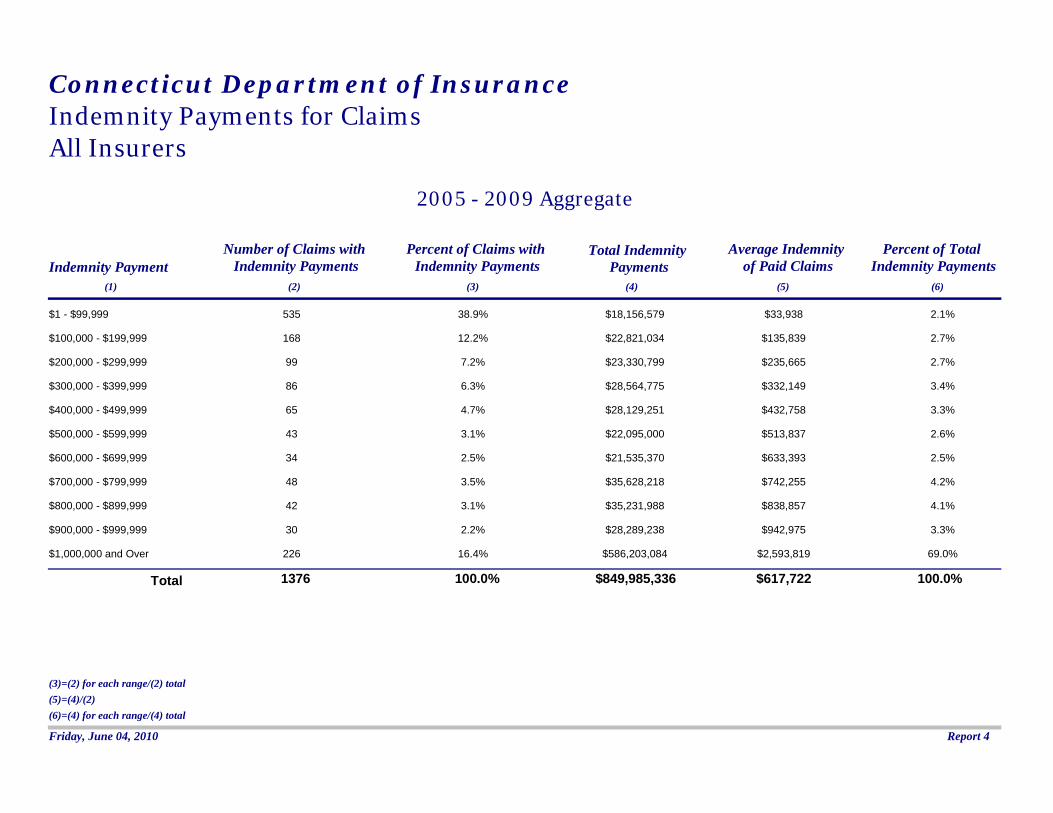
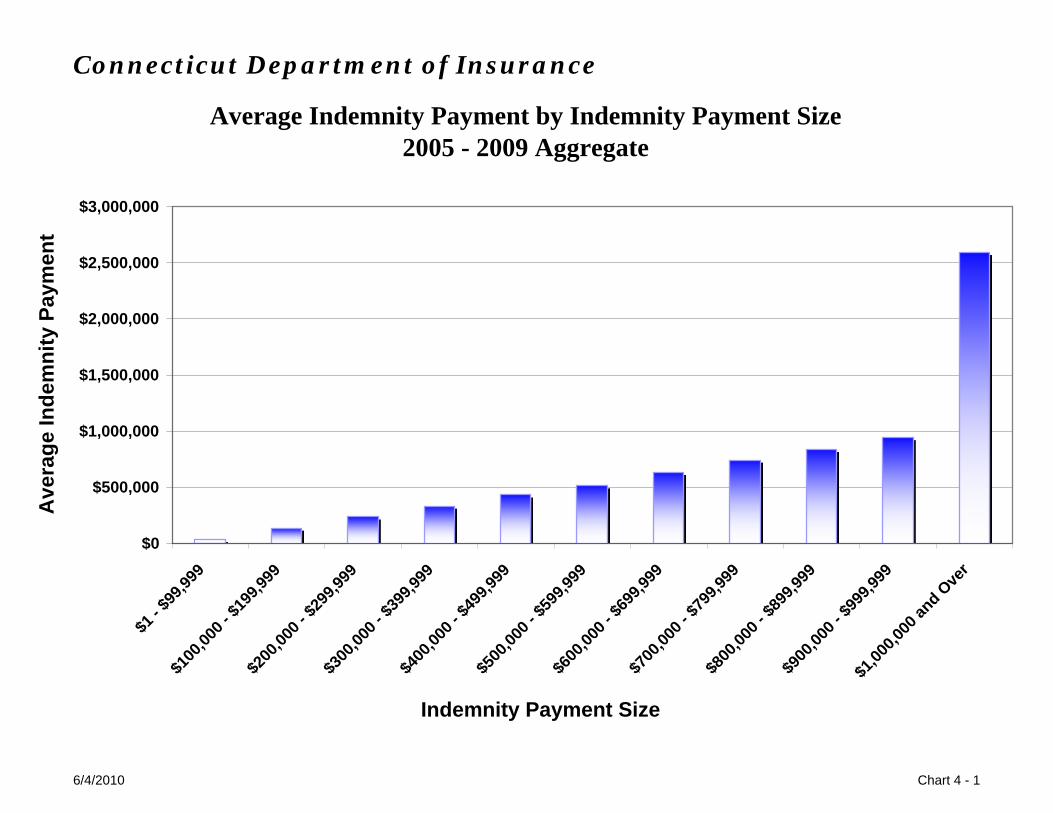
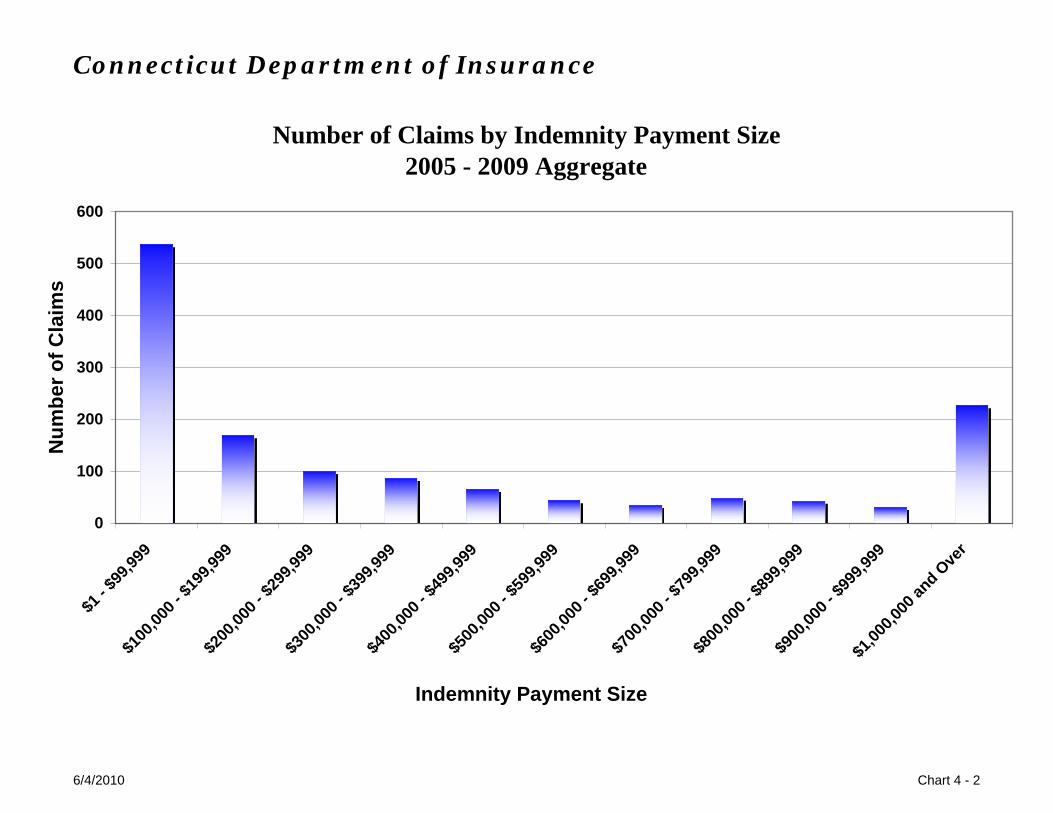
• Indemnity Payments and Size of Claims: Claims with indemnity payments
increased 30%, from 1,060 to 1,376. No one category in Report 12 saw an increase in the number of claims that was dramatically different. More than half of all claims that have an indemnity payment have a payments of less than $200,000. But million dollar plus claims, with only 16.4% of all claim counts represent 69% of all indemnity payments, nearly $587 million.
• Indemnity Payments and Age of Claim: The amount paid to claimants increased
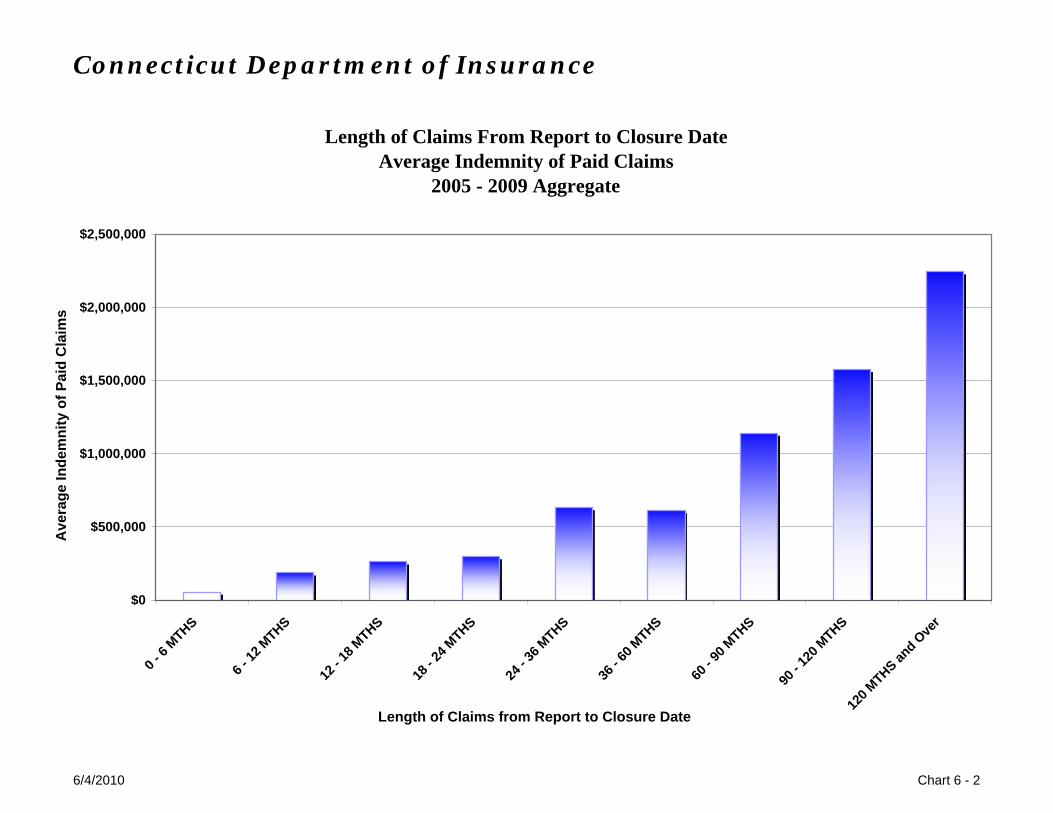
with the age of the claim. Of the 1,376 claims that closed with an indemnity payment, 173 closed within one year of being reported and had an average paid indemnity of $18,091. That average figure rose to $279,841 for 185 claims closing in their second year, and to $631,929 for 301 claims closing in their third year. The 205 claims that closed between 60 and 90 months from being reported averaged $1,145,833.
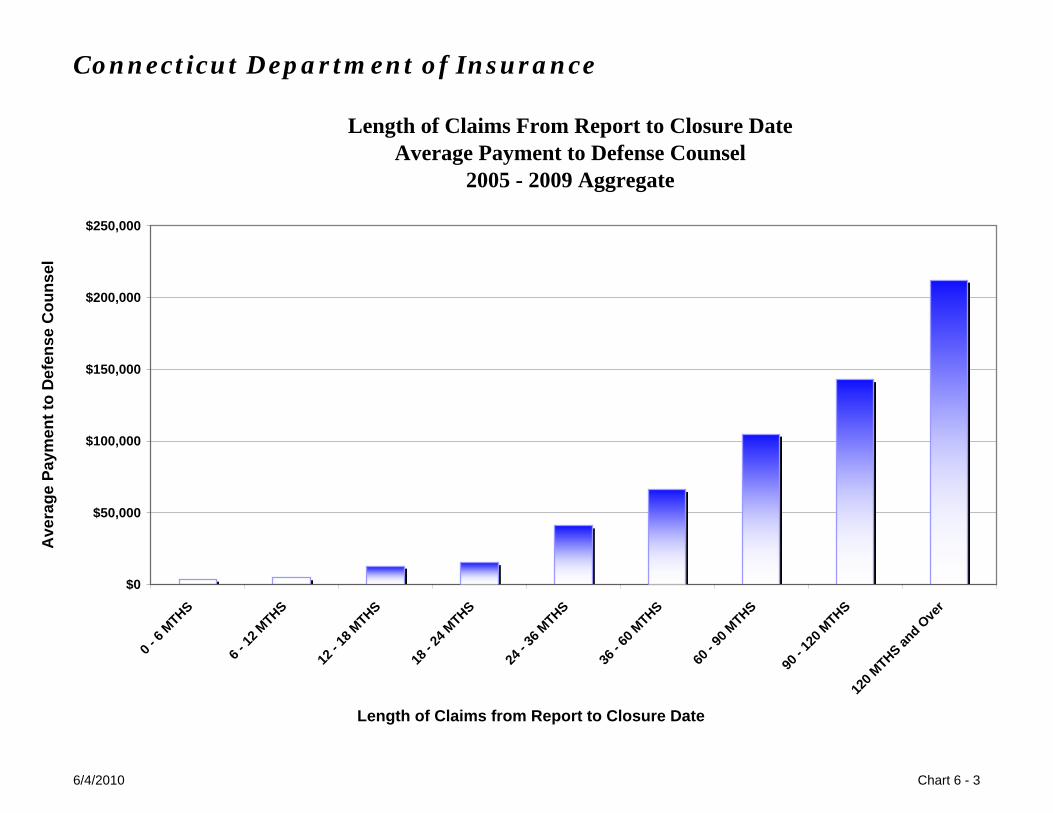
• Defense Counsel Payments and Age of Claim: Defense counsel payments also
increased with the age of claim, starting with an average of $4,283 for claims that closed in their first year, and rising to $14,306 and $40,931 for claims in their second
4
and third years, respectively. For claims closing five or more years after being reported, the average was $114,676.
• Claim Outcomes: Of the 2,839 reported claims, 1,376 were resolved in favor of the
claimant or plaintiff. Of the claims resolved in favor of the claimant or plaintiff, 97.6% were settled, with 93.9% settled before trial began. The remaining 1,463 claims were resolved in favor of the defendant. Of the claims resolved in favor of the defendant, 86.7% were settled, with 83.3% of those settled before trial began.
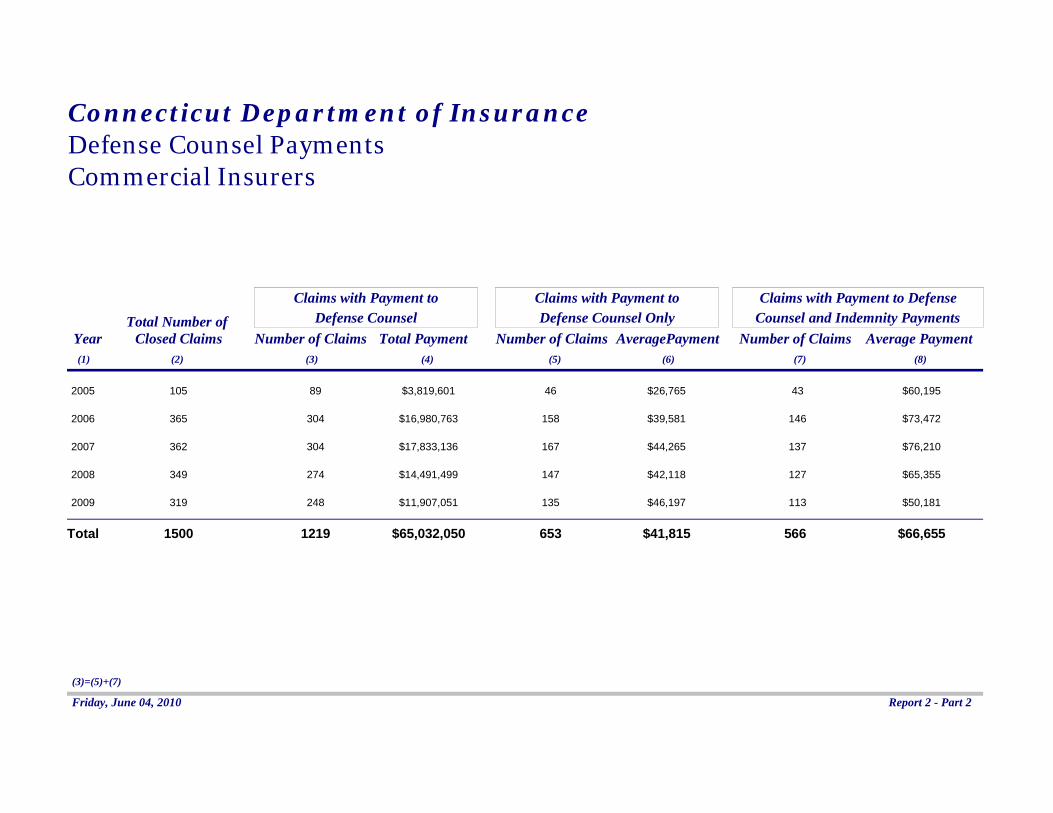
VII. Detailed Findings This discussion corresponds to the reports and charts attached as Appendix 1. The reader is encouraged to review those exhibits for full details. Claims by Insurer (Reports 1, 2 and 3) Of the total of 2,202 claims, 1,043, or 47% had indemnity payments to a claimant at an average value of $667,418. While Commercial Insurers reported a greater number of claims in total, captives/self-insurers actually had more claims with indemnity payments (547 to 496). This disparity occurs because captives/self-insurers had a greater proportion of their claims with indemnity payments (53% versus 42%). However, the average claim size continues to be much greater for Commercial Insurers; $795,431 versus $551,342 for captives/self-insurers. Slightly more claims were reported as closing in 2008 compared to 2007 and the average indemnity payment increased from approximately $607,000 in 2007 to $698,000 in 2008, reversing the decrease seen last year. The increase in average values was seen for both Commercial Insurers and captives/self-insurers. Of the total 2,202 claims, approximately four out of five had payments to defense counsel. There was little difference between Commercial Insurers and captives/self-insurers in the proportion of claims with legal defense costs. For the seventeen quarters of data combined, Commercial Insurers average legal expenses were higher per claim (approximately $55,000 versus $49,000) than captives/self-insurers. However, for 2008 claims, captives/self-insurers showed a significant increase in average payments over 2007 and in comparison to Commercial Insurers. Legal defense costs in 2008 increased over 2007 from an average of approximately $56,000 to $59,000, driven entirely by the increase for captives/self-insurers.
5
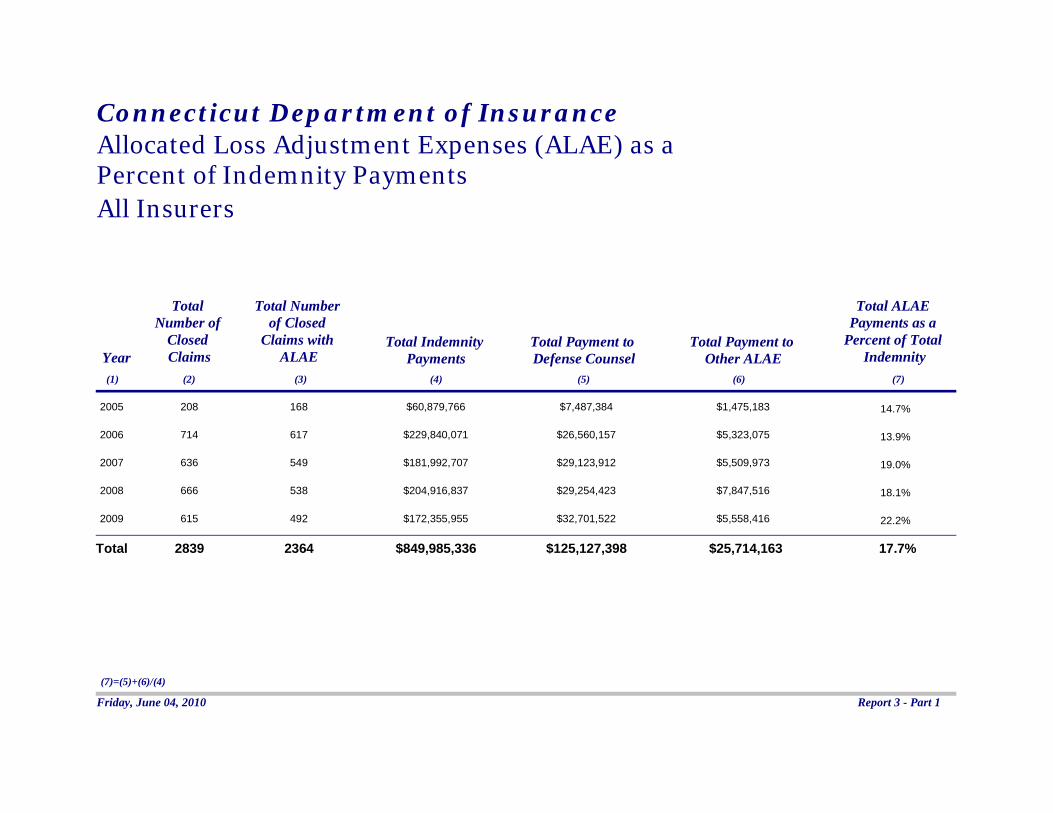
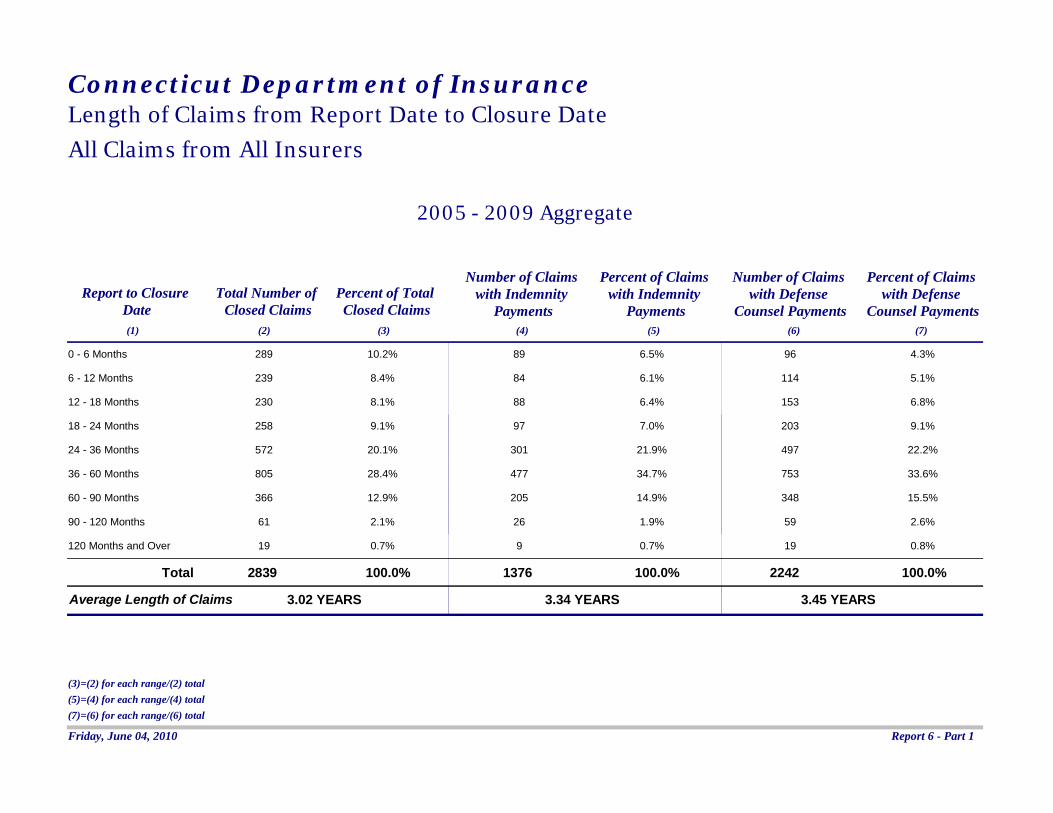
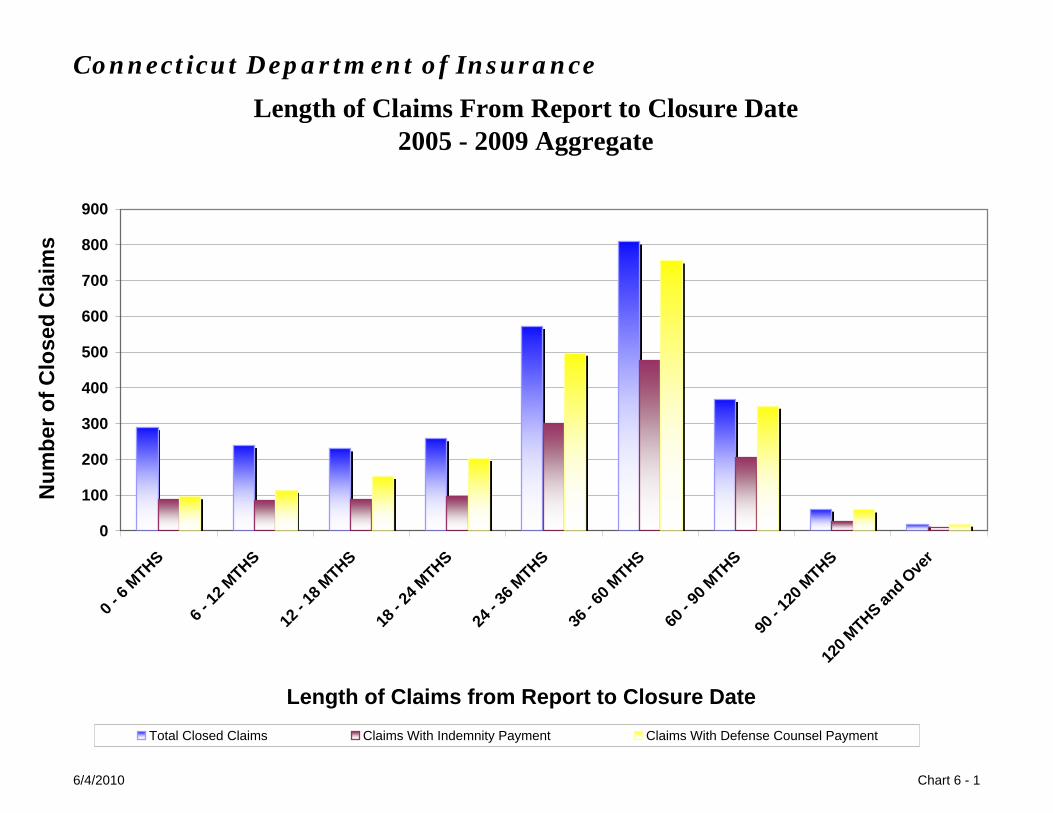
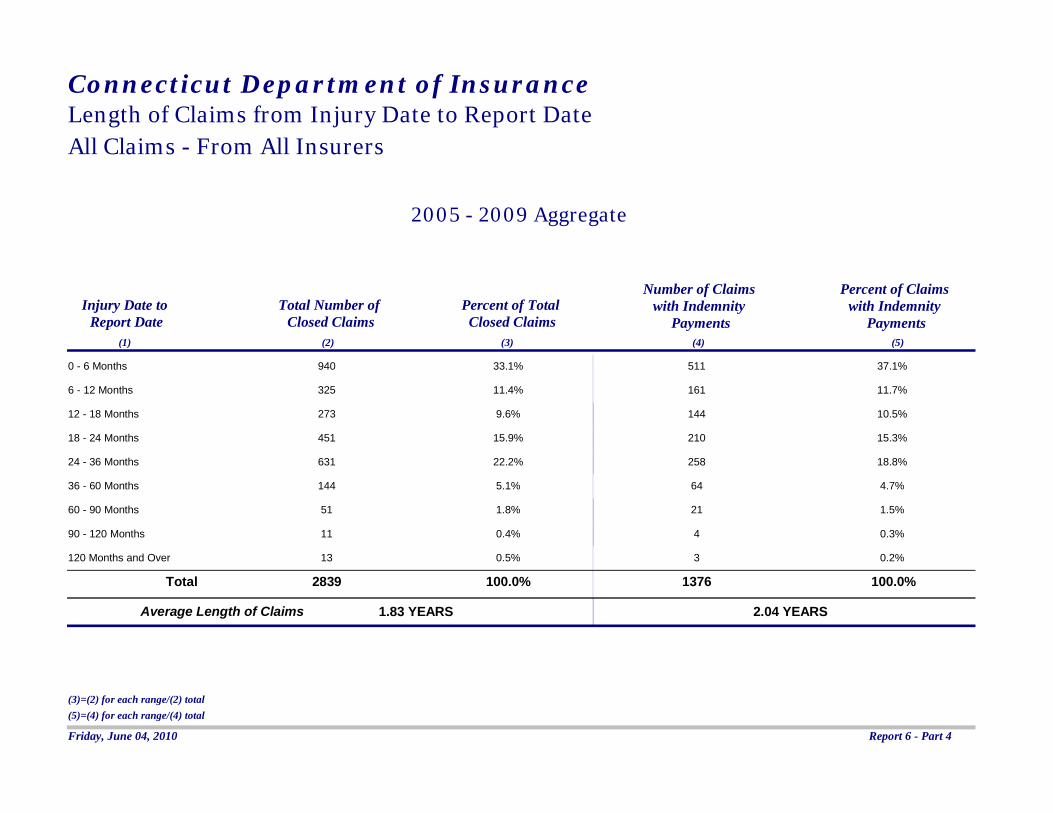
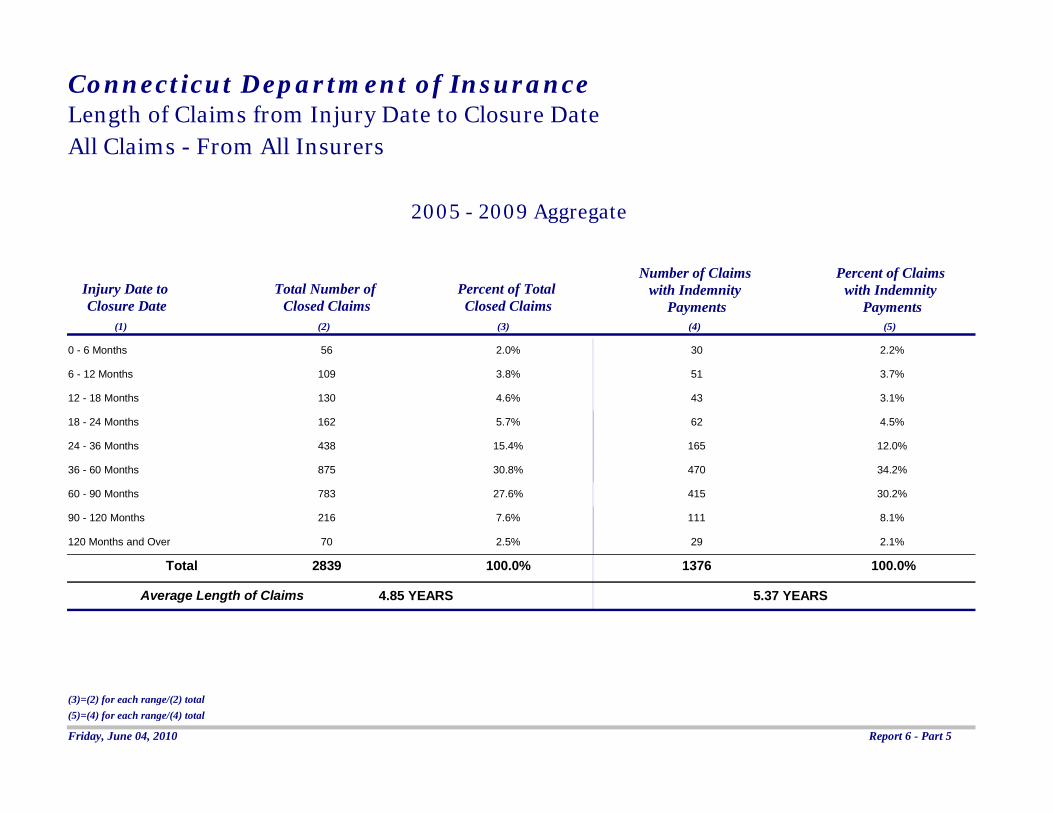
When other ALAE are included with defense counsel payments, the total of $111.5 million represents the amount expended to defend and investigate claims. This represents approximately 16% of the total indemnity payments and is the same percentage as in last year’s report. Commercial Insurers expended a higher percentage (17.2% versus 14.5%) than captives/self-insurers. Although the other ALAE dollars expended in 2008 increased over 2007, the percentages decreased when compared to much higher indemnity payments in the most recent year. Claims by Size (Reports 4 and 5) Of the total 2,839 claims, 1,376 had indemnity payments. The distribution of these claims by size is shown on Report 4 and on Charts 4-1 and 4-2. Of the 1,376 claims, 226, or 16.4% of claims with indemnity payments, were for amounts greater than $1 million. In 2009 we received 51 new claims that were greater than $1 million. Indemnity payments for these claims totaled $586.2 million, or 69% of the total payments for all claim sizes. Claims greater than $500,000, but less than $1 million represented another 197 claims (14.3%) with $142.8 million of payments. Thus, the 423claims greater than $500,000 represent approximately 31% of the claims, but 82% of the total paid indemnity. On the other hand, 36% of legal defense costs are expended to defend claims where there are no indemnity payments. The distribution of the defense counsel payments by size of loss is shown on Report 5 and Chart 5-1. Legal defense costs for the $1 million and above claims represent 24.4 % of the total. And, the average amount of defense costs per claim generally increases as the claims get larger. Age of Claim (Report 6) These exhibits display claims by age at the time of closing from both report date and injury date and provide the average length of time to closure. The majority of claims with indemnity payments, almost 60%, closed between two and five years of being reported. Overall, it took a little less than three and one half years from the report date to close claims with indemnity payments. The time from the date of incident to report was almost two years, which suggests claims are closed, on average, roughly five years after injury. Average payments increased as the claim aged, with claims closing after five years averaging approximately $1.2 million per claim. The distribution of claims and payments by age can be seen on Report 6, Parts 1 and 2 and Charts 6-1 and 6-2. The older the age of the claim, the more likely it was to have legal costs to defend the claim. Of the claims that closed within one year, 40% had defense counsel payments. For claims closing after five years, the percentage rises to 96%. As with indemnity costs, the average legal cost associated with a claim increased as the claim aged. Claims closed in the first year averaged legal costs of $4,283 while those closing five or more years after being reported averaged $119,992. The distribution of defense counsel payments by age of claim are displayed on Report 6, Part 3 and Chart 6-3. Report 6, Part 4 displays data from injury date to report date and Report 6, Part 5 shows data from injury date to
6
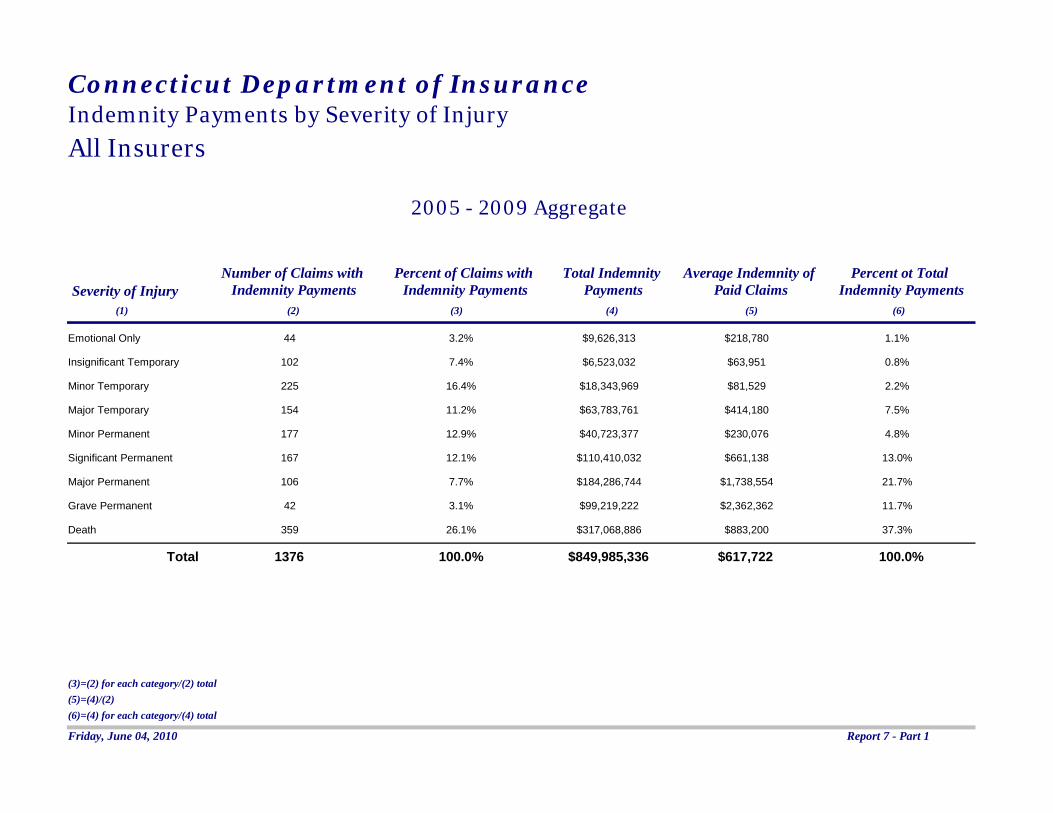
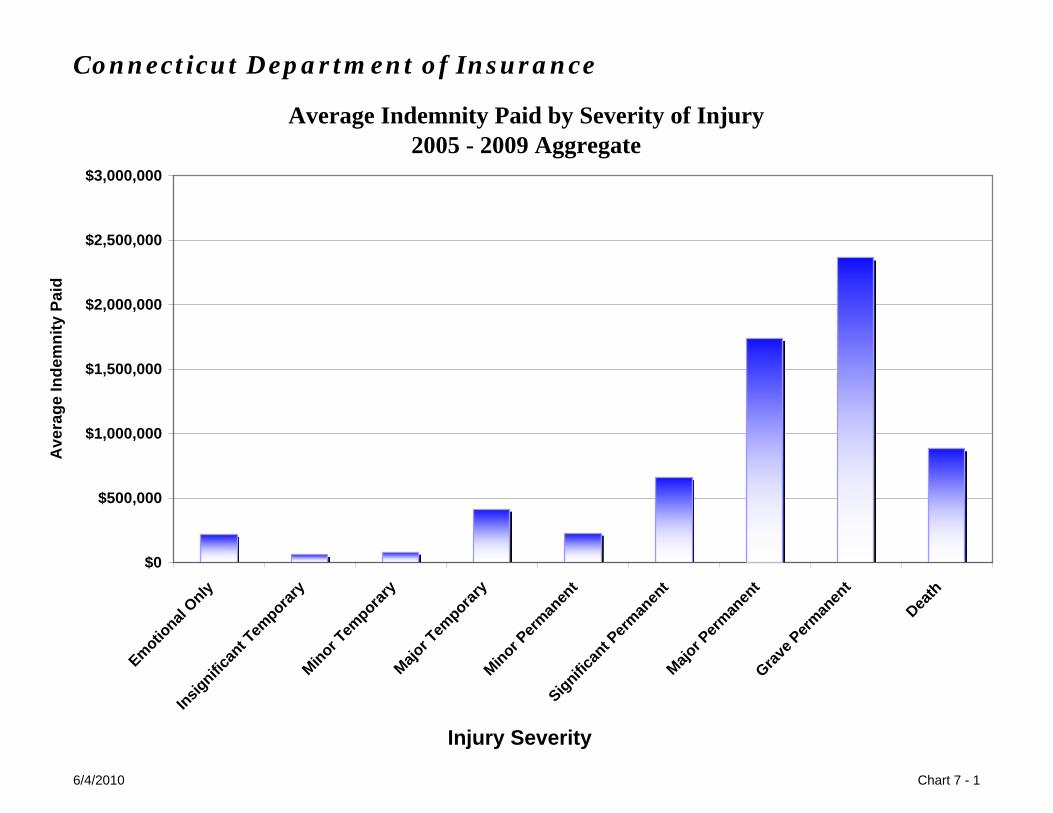
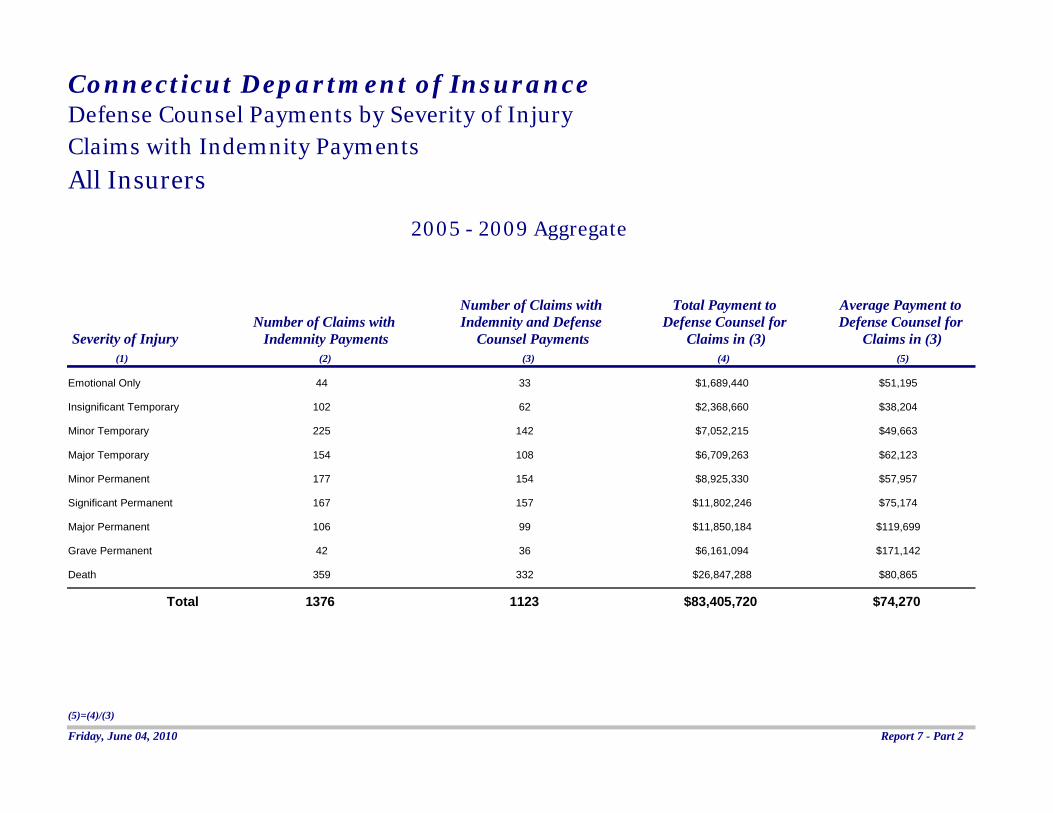
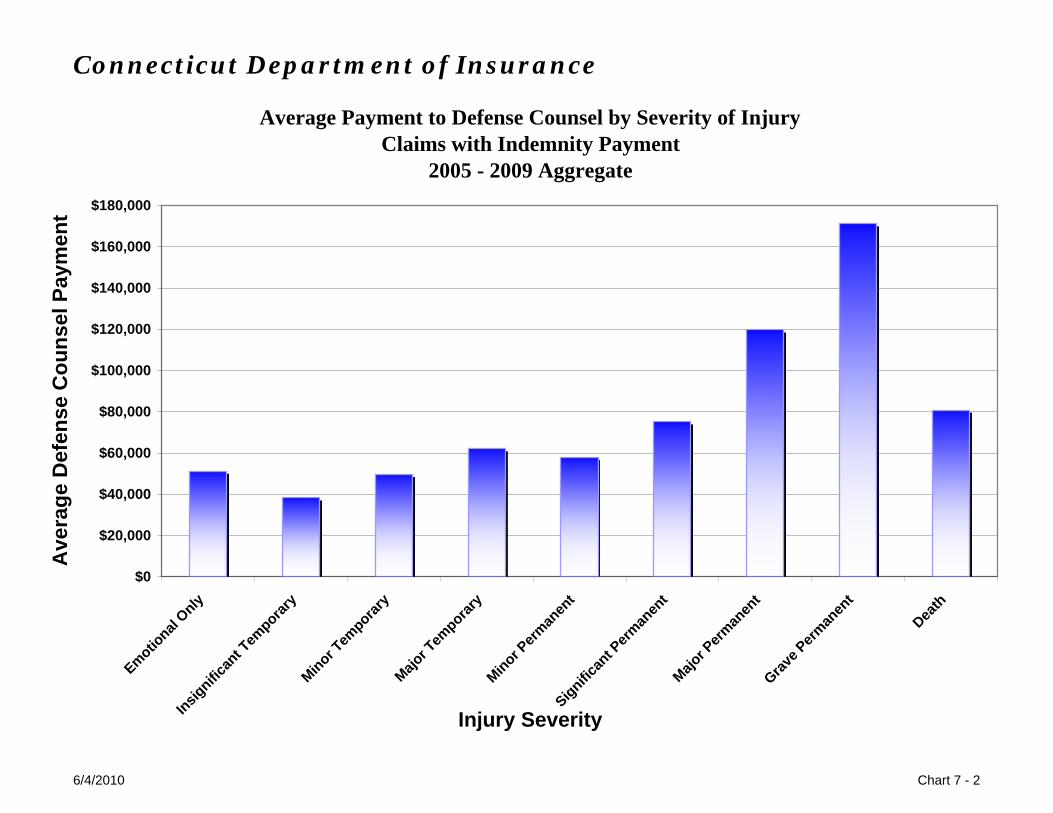
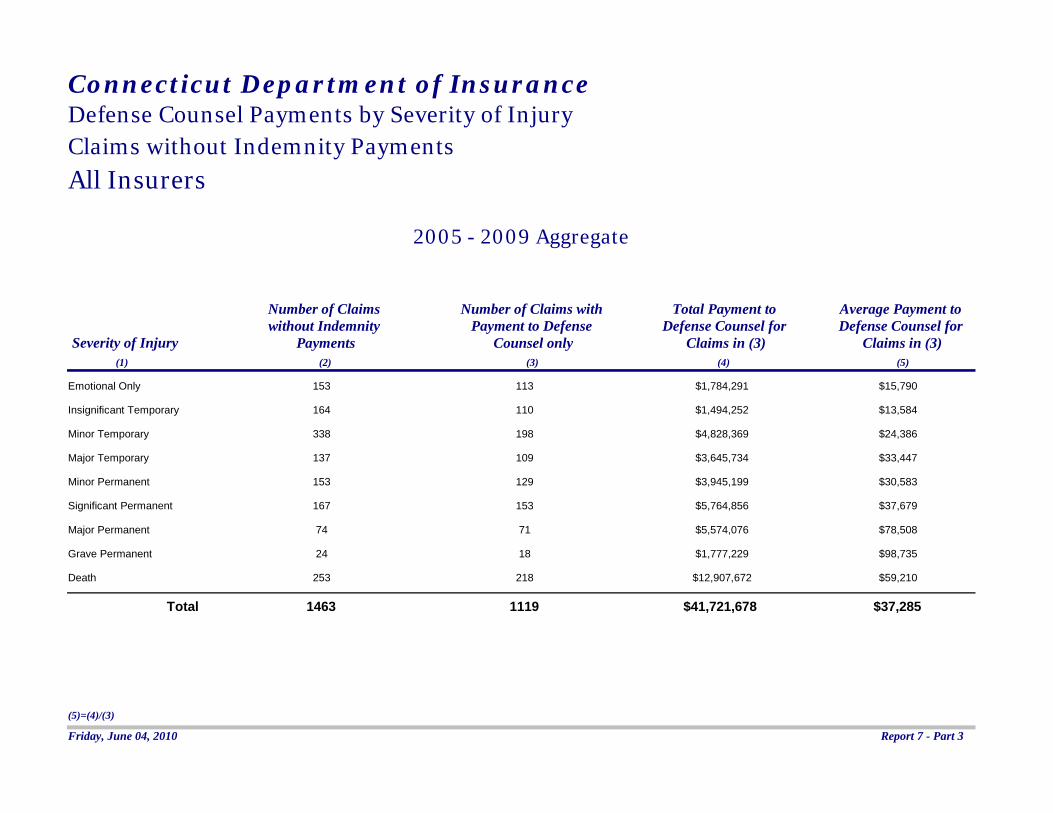
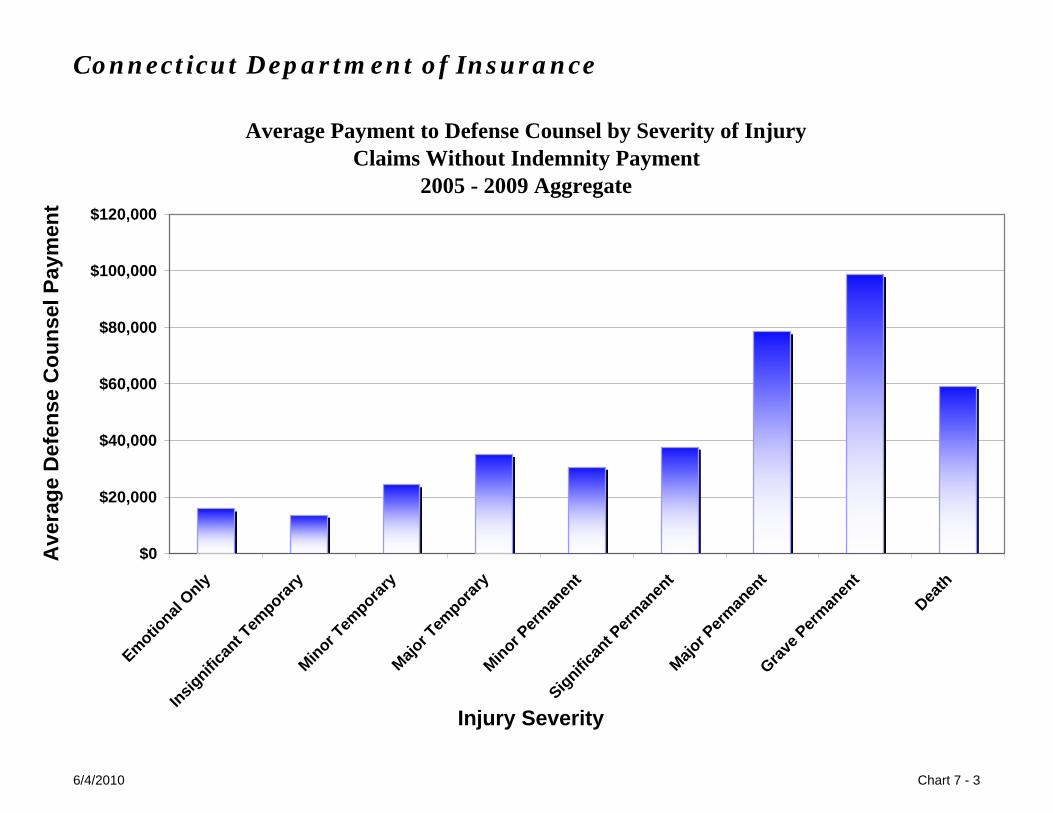
date of final closure. In Report 6, Part 5 we note that over 40% of claims with an indemnity payment take at least 5 years from date of injury to finally close Severity of Injury (Report 7) Of the 1,376 claims reported as closed with an indemnity payment, 359, or 26% were due to the death of the injured party, with average paid indemnity of $883,200. Injuries identified as either “major permanent” or “grave permanent” had average paid indemnity of $1,915,581, which was over three times the overall average indemnity payment. These types of claims include quadriplegia and brain damage cases, requiring lifelong dependent care. These 148 severe “permanent injury” claims, when combined with the death cases, comprise over 70% of the total indemnity payments. The average payments by injury type are shown on Report 7, Part 1 and Chart 7-1. Likewise, the average legal costs associated with the 148 most serious non-death claims were significantly higher than the overall average. For those claims, 135 of which had defense counsel costs, the average was $133,416 compared to $74,270 for all claims with defense counsel costs. The average legal costs by injury type are displayed on Report 7, Part 2 and Chart 7-2. For claims where no indemnity payment was made, approximately 76% had defense counsel payments that averaged $37,285. However, for the most serious non-death permanent injury claims, 91% required legal defense at an average cost of $82,599. Details of legal costs for these claims by injury type are displayed on Report 7, Part 3 and Chart 7-3 Claims by Physician Specialty (Report 8) These exhibits show the medical provider specialties for which claims were reported that had indemnity payments. Hospitals-General had the most claims followed by the Physicians-Other category. The majority (over 90%) of the Hospital claims were reported by the captives/self-insurers, while Commercial Insurers reported the most in the Physicians-other category. The average paid indemnity amounts vary significantly by specialty and are often distorted by one or two large claims. For the Hospitals-General category, which had almost 50% of the claims, the average indemnity payment was $646,430, or slightly above the overall average. The anesthesiology and gynecology/OB-GYN specialties had the highest average claim sizes over $1.1 million. In reviewing the Report 8 exhibits, the reader should be aware that the volume of date is not sufficient to properly measure differences in claim costs by specialty. We note that four of the specialty areas have less than 10 claims over this seventeen month period. As additional years of data are gathered, these exhibits will become more statistically reliable. In addition to claim information, Report 8, Part 2 also displays base premiums by medical provider specialty for Commercial Insurers. For purposes of this report, base premiums are defined as the manual premium before the application of increased limits factors or experience debits and credits. Base premiums were not available from the captives/self-insurers.
7
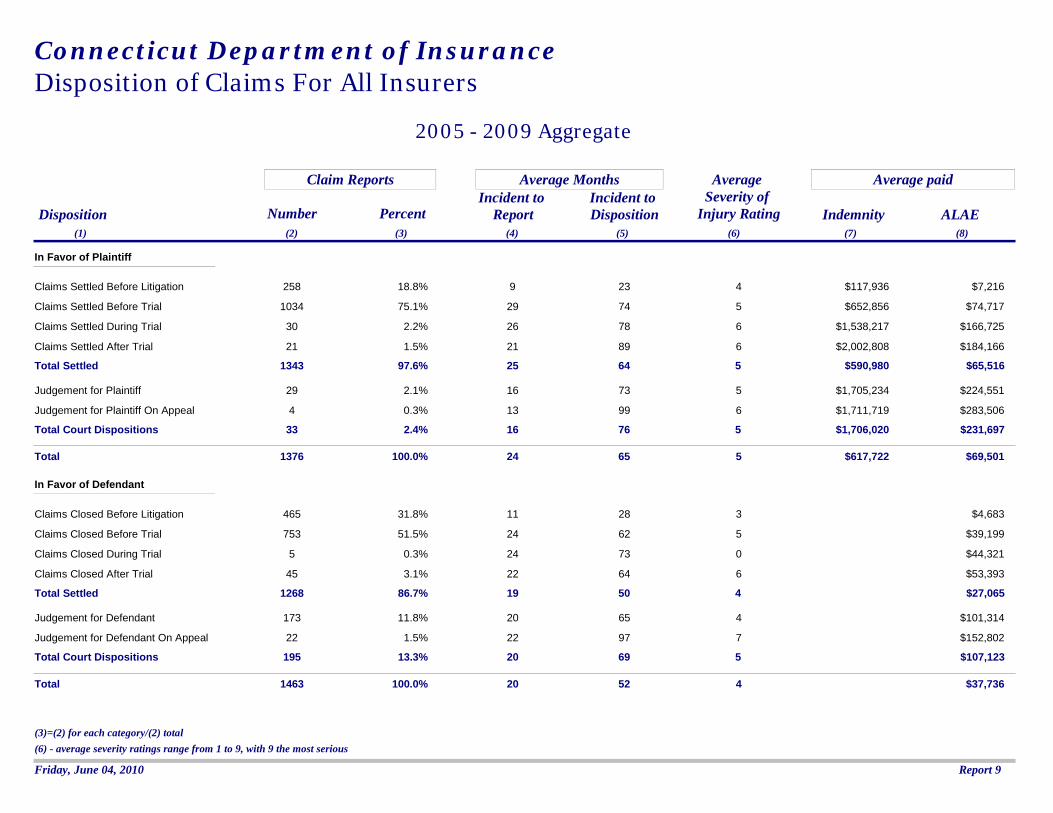
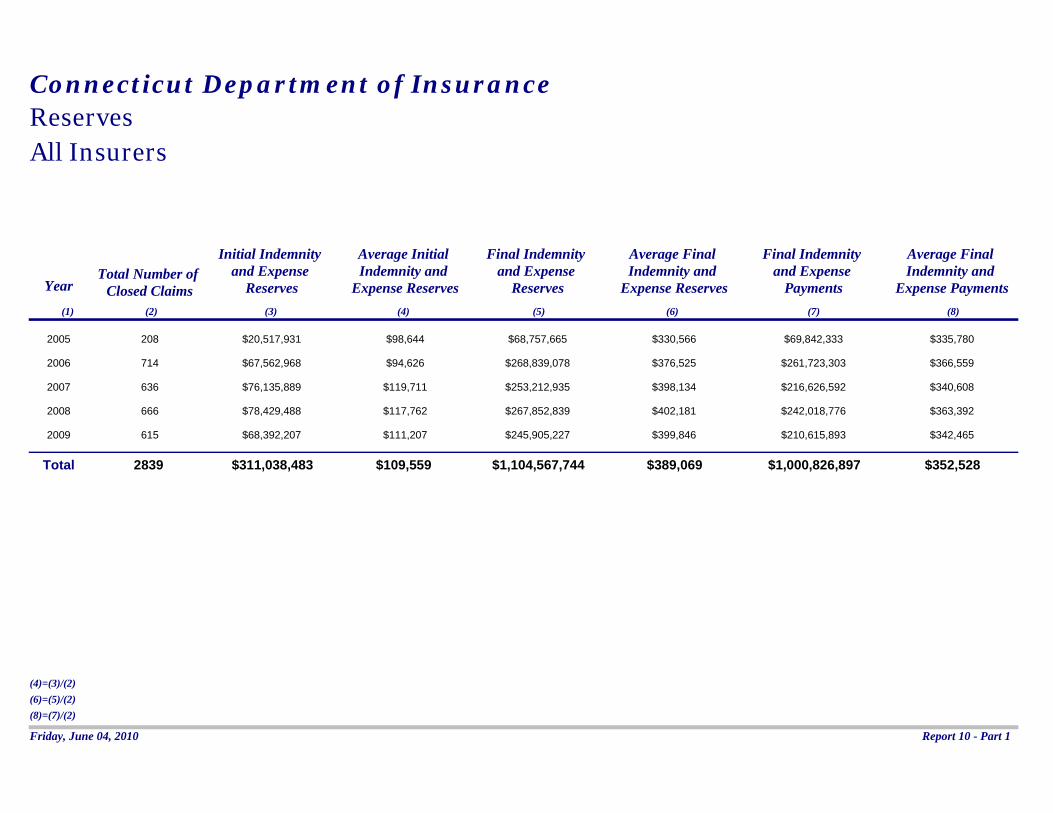
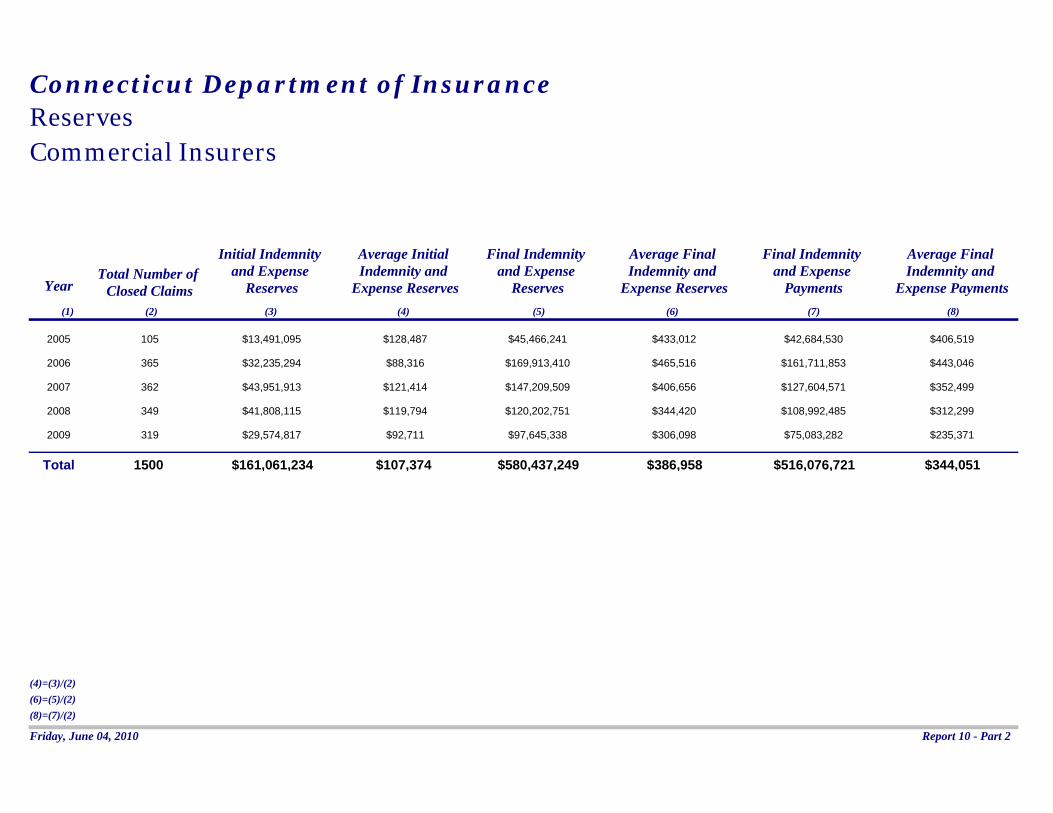
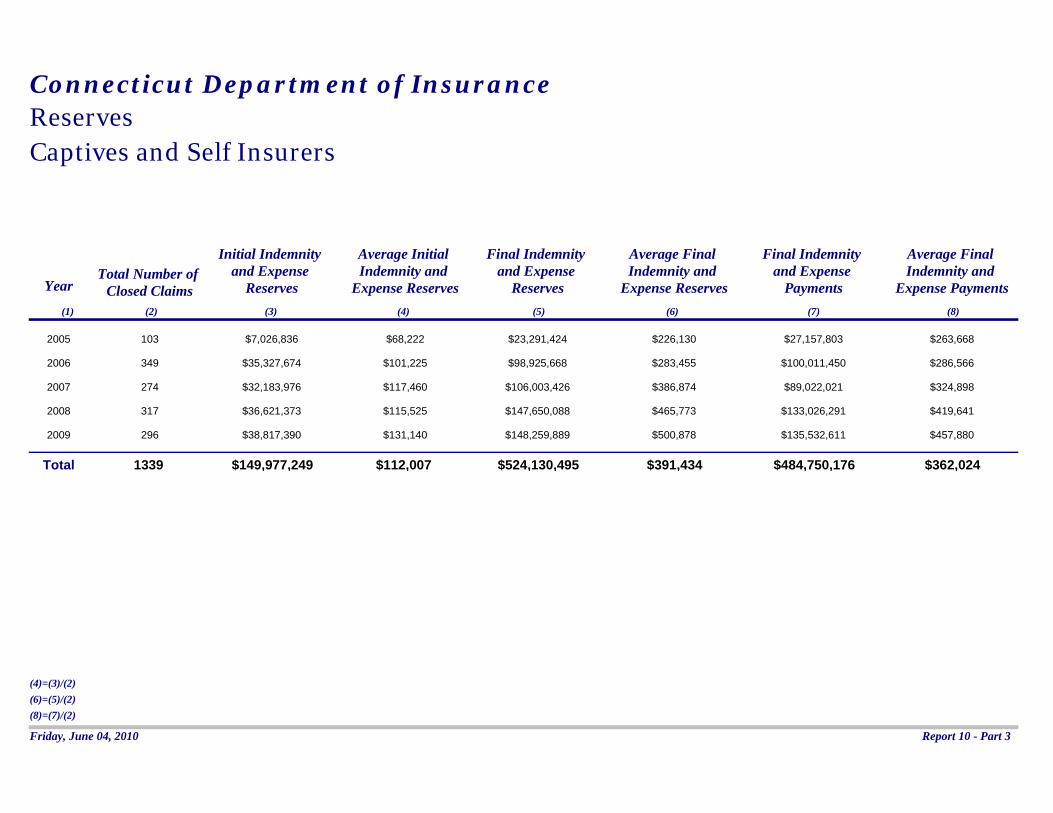
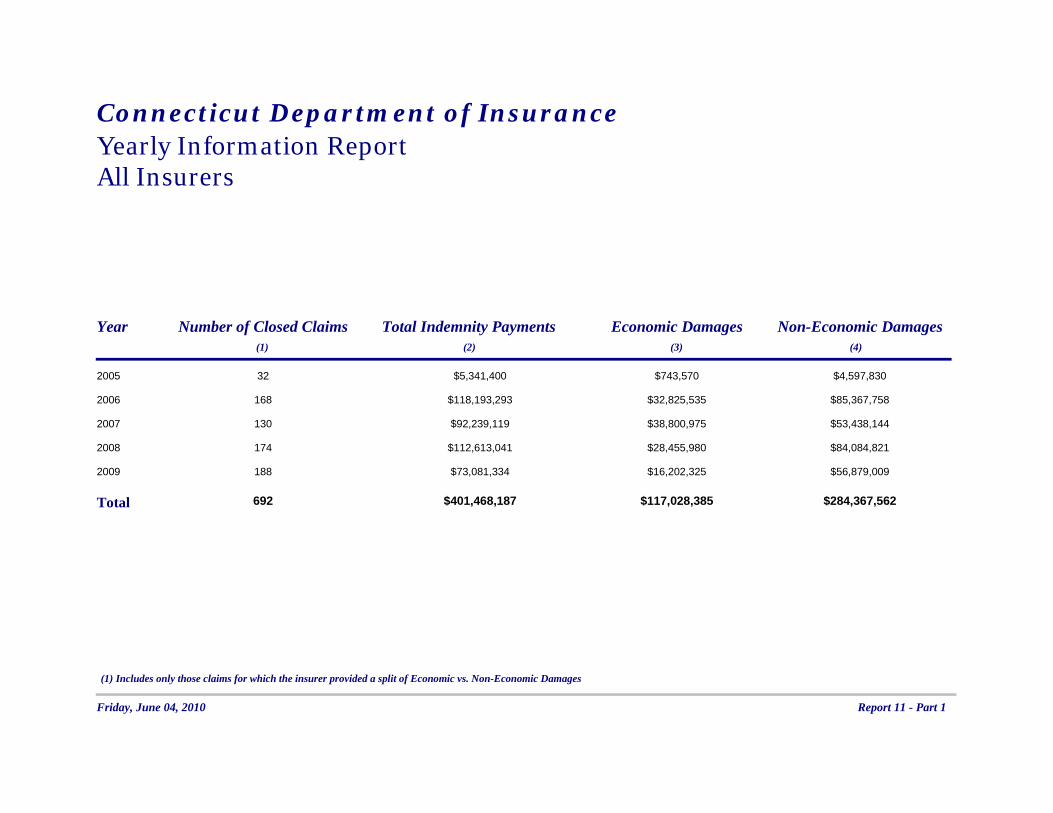
Claims by Outcome (Report 9) Reporting entities were asked to indicate the method of final disposition for each closed claim: - Of the 2,839 closed claims, 52% resulted in no payment to the plaintiff. Of these, 86.7% were settled and virtually all cases were resolved either before litigation began (31.8%) or before trial (51.5%). Claims closed before a lawsuit was filed tended to be less serious and closed within approximately two and one half years of the incident date on average. Of the claims that were not settled, the average time to final resolution was 19 months longer than for settled cases. - The remaining 48% of closed claims resulted in indemnity payments to the plaintiff. Of these, 97.6% were settled, with most of those being settled before trial. Only 33 of the 1,376 claims were the result of court judgments for the plaintiff. - Of the cases resolved by trial, only 14% resulted in payments to the plaintiff. For cases that were settled, 51% resulted in payments to the plaintiff. - For claims where indemnity was paid, the average value for settled cases was $590,980 with additional expenses for total ALAE of $65,516 per claim. For cases that had court dispositions, the average payment was $1.7 million with $231,697 of ALAE per claim. - The “average severity of injury rating” column measures the seriousness of the claim by averaging the severity rating (e.g., a death claim is a 9, a grave permanent claim is an 8, and so on) for the claims in each category. Claim Reserves (Report 10) These exhibits display combined final indemnity and all ALAE payments with the initial and final reserves for those claims. The reserve amounts represent the insurer’s best estimate at two points in time of what they believe the ultimate payment will be when the claim finally closes. A comparison of the initial reserves to the final payments shows that the first estimates were significantly understated – only 31% of the average final payment. There is little difference between the Commercial Insurers and the captives/self-insurers in the degree of understatement in initial estimates. The final reserve amounts were much closer to the final payments. They were overstated by roughly 10%, with Commercial Insurers somewhat higher at an approximate 12% overestimate, and captives/self-insurers at 8%. While these values represent averages for all seventeen quarters of data combined, these differences in the estimates versus the final payments highlight the difficulty all insurers have in accurately assessing what the ultimate payout will be for a particular claim. This is especially true in the early stages of claim development when details related to the incident are still incomplete. Economic and Non-Economic Damages (Report 11) Reporting entities were asked to split the final indemnity payment into economic and non-economic damages. Economic damages are usually defined as objectively verifiable
8
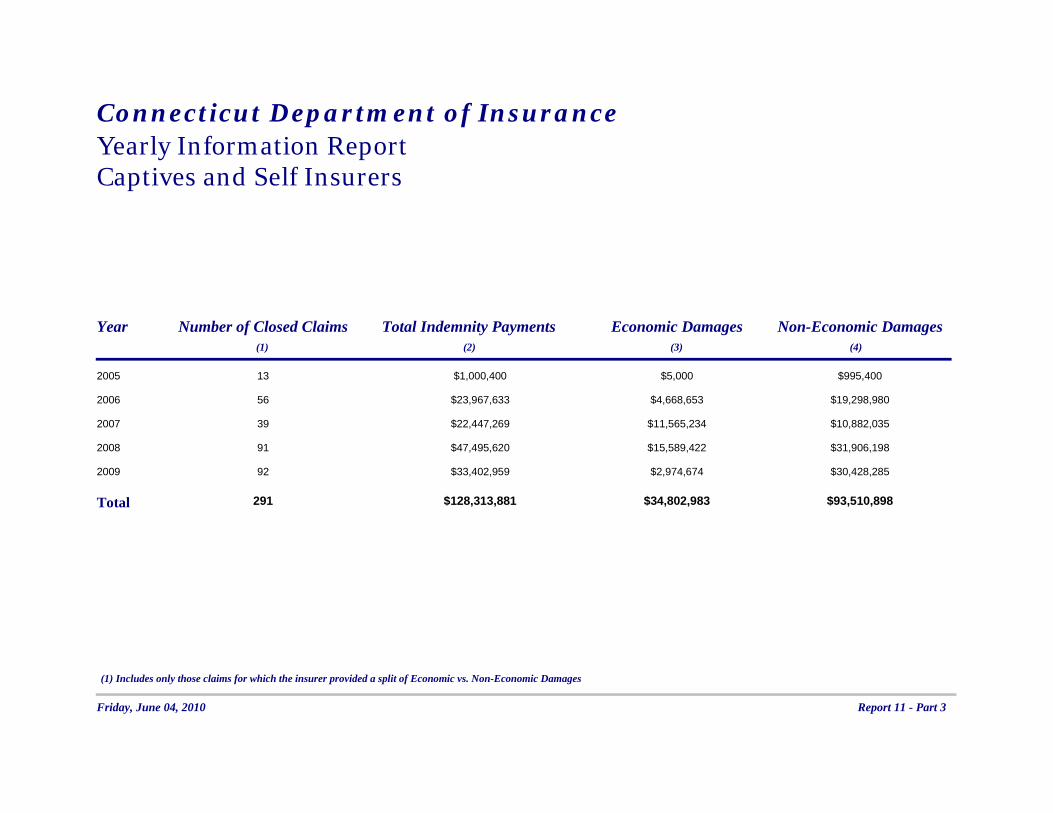
monetary losses such as medical expenses, loss of earnings, burial costs, etc. Non-economic damages typically refer to subjective non-monetary losses such as pain, suffering, inconvenience, emotional distress, etc. For about one half of the cases, or 684, insurers failed to provide this split in the reported data as they indicated that such information was not available in the final settlement. For the claims where the split was provided, approximately 71% of the payments were for non-economic damages. The average value of the claims in Report 11 was $580,156, or approximately 6% lower than the overall average for all claims with indemnity payments. Commercial Insurers provided the split on 62% of the claims reported and 70% of those payments were for non-economic damages. Captives/self-insurers provided the split on only 39% of reported claims and had about the same proportion allocated to non-economic damages at 73%. VIII. Rate Filings and Industry Calendar Year Data Rate Filings for Professional Liability There were no rate filings received by the Department during 2009 for physicians and surgeons, hospitals, advanced practice registered nurses or physician assistants.
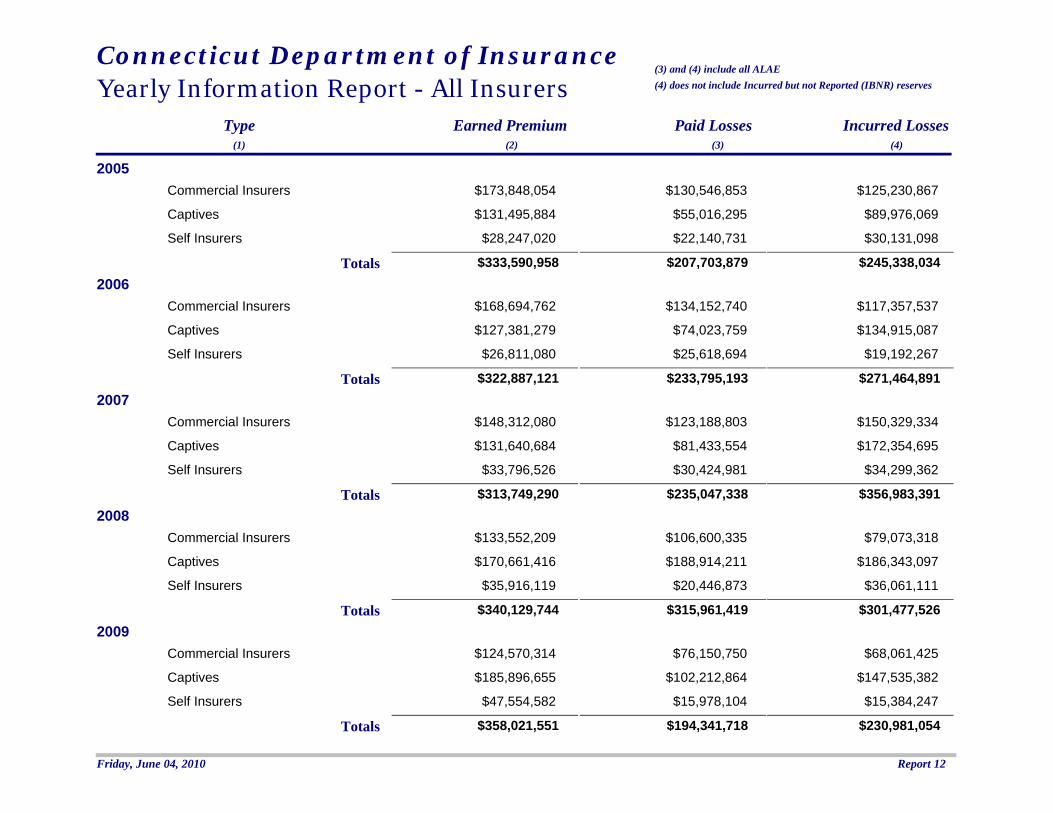
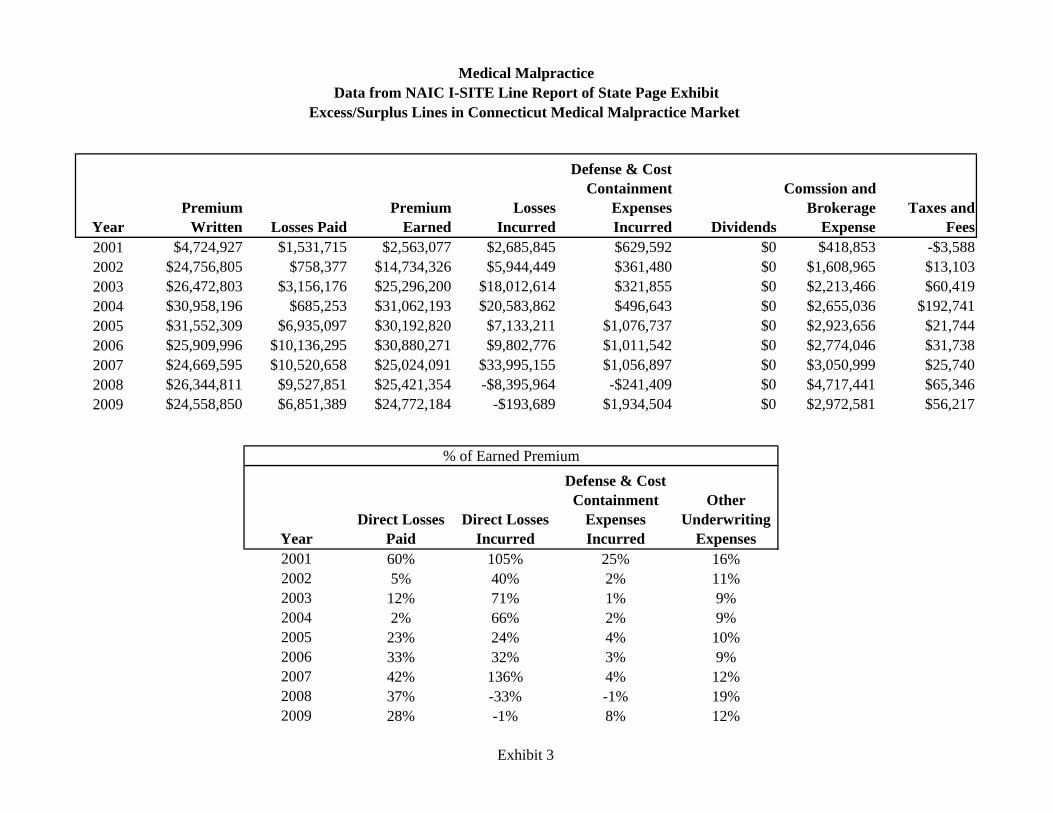
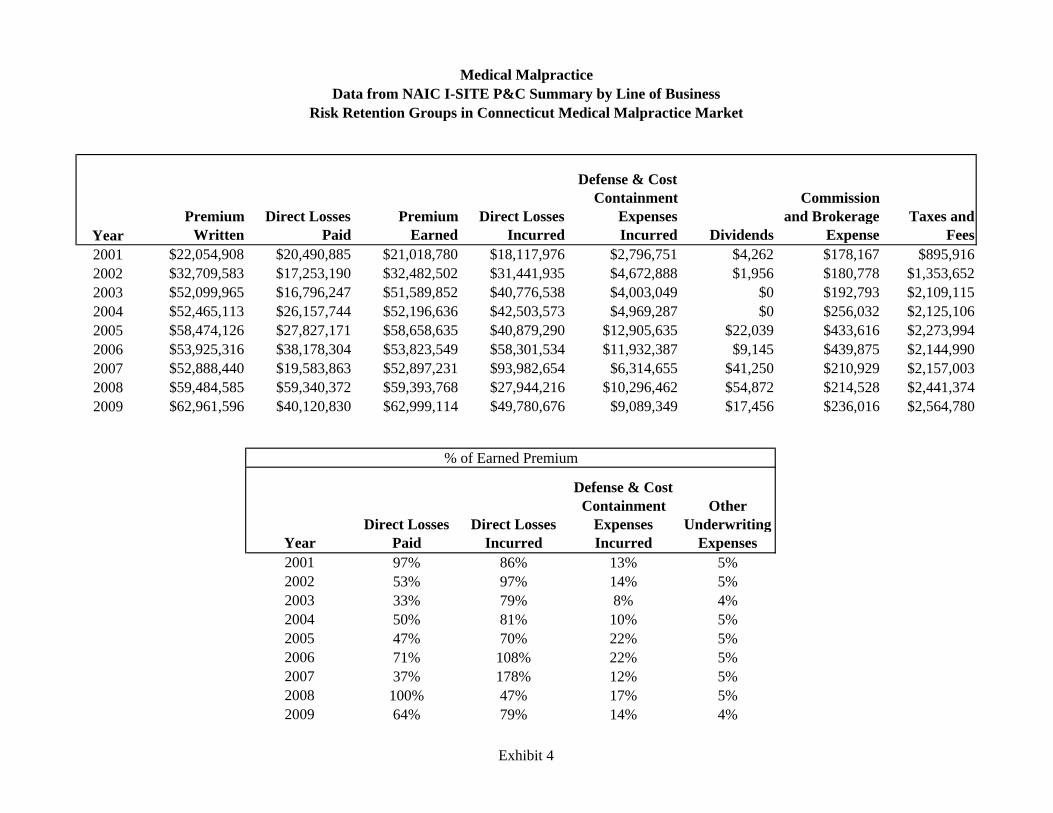
Calendar Year Premium and Losses (Appendix 2, Report 12) Report 12 displays calendar year earned premium and losses for 2005 through 2009 separately for Commercial Insurers, captives (including RRG’s) and self-insurers. This information is compiled from data submissions provided by insuring entities that responded to the data call. As such, it includes data from captives and self insurers that are not included in the industry data in Appendix 3. It should be noted that the paid losses included in this report are not directly comparable to the amounts shown in the closed claim reports in Appendix 1. The paid losses in Report 12 include partial payments on claims that are still open. It should also be noted that the incurred losses in Report 12 do not include reserves for incurred but not reported (IBNR) claims. While only five years of data has limited value in determining long term trends, we do observe that captives and self-insurers have gradually increased their share of premiums over this period of time. Correspondingly, the share of premiums for Commercial Insurers has declined steadily since 2005. Industry Data from the NAIC (Appendix 3) In Appendix 3, we display industry data compiled from annual financial statements provided to the NAIC by all companies writing medical malpractice business in Connecticut. Data is included for licensed companies, surplus lines companies and risk retention groups, but excludes captives. It also includes data from companies that write business for medical provider specialties (e.g., chiropractors or psychiatrists) that were not included in the Connecticut-specific data call until the fourth quarter of 2007.
9
10
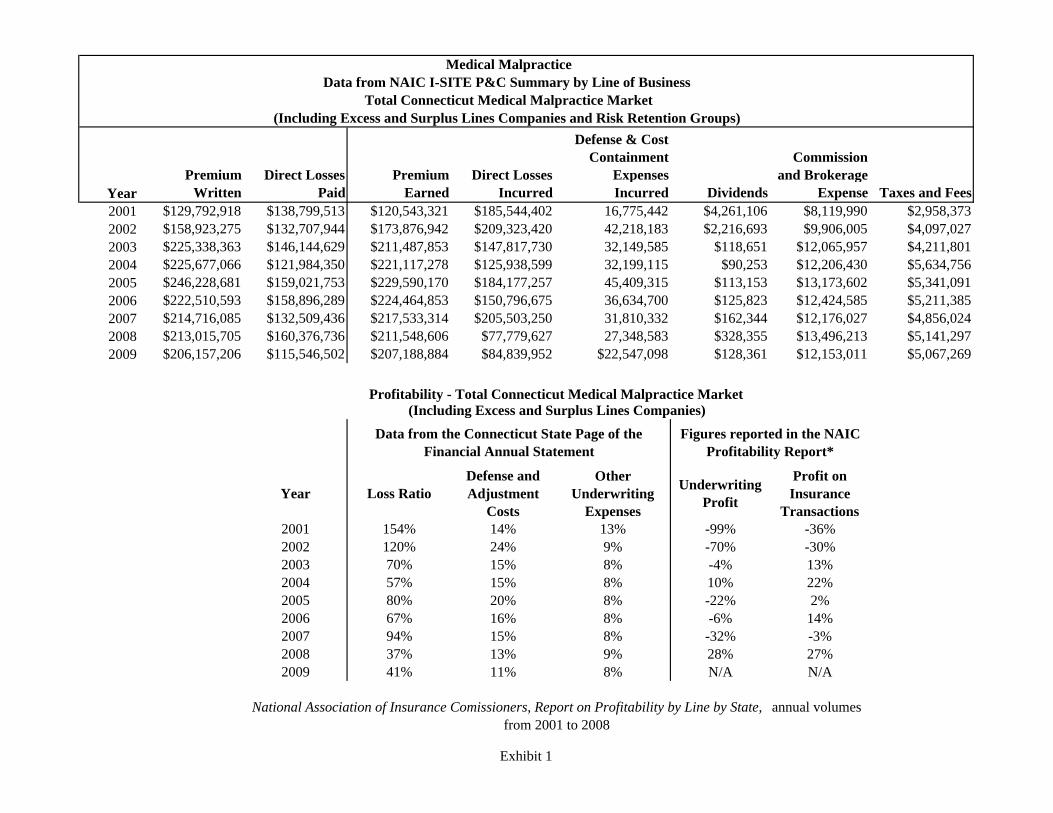
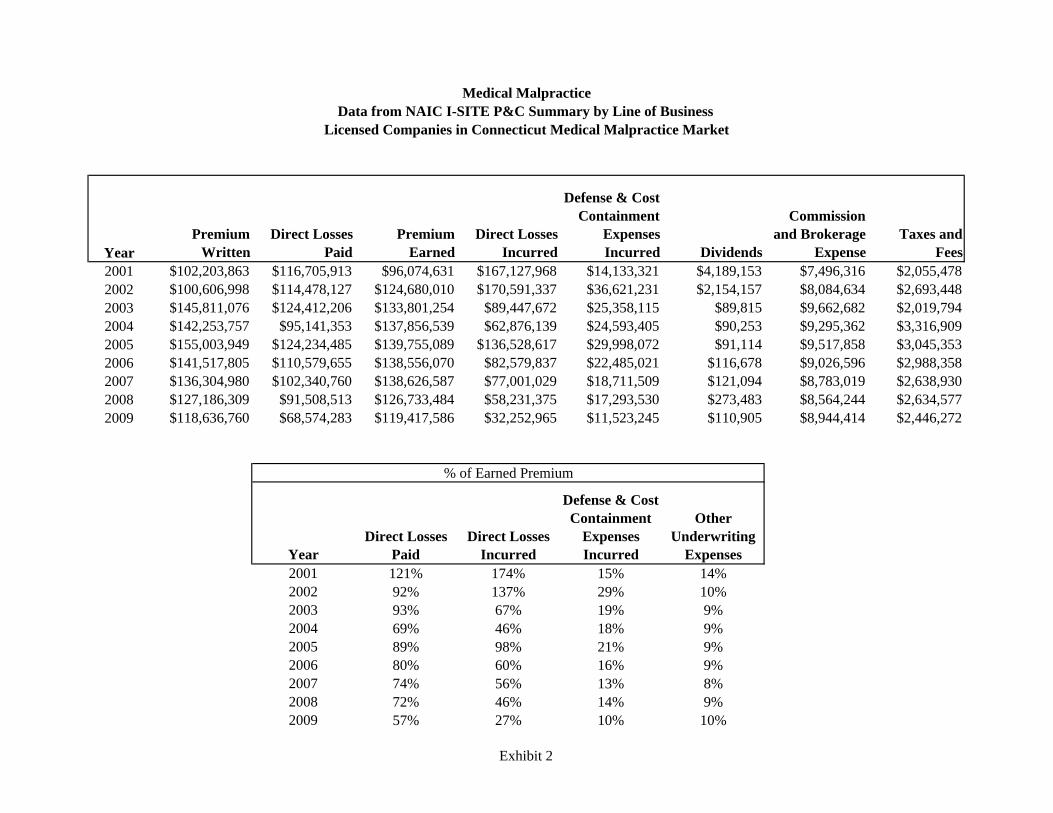
The first four exhibits provide historical industry premium, loss and expense experience from 2001 to 2009. Exhibit 1 displays experience for all companies combined and also includes profitability ratios from the NAIC Report on Profitability by Line by State (Profitability Report). Ratios are shown separately for underwriting profit (premiums less losses and expenses as a percent of earned premium) and profit on the insurance transaction (underwriting profit plus investment earnings less federal income taxes as a percent of earned premium). These results show that after two very bad years in 2001 and 2002, the industry was profitable through 2006; then experienced a 3.4% loss on the insurance transaction in 2007; then showed profitability again in 2008. While the NAIC profitability report is not yet available for 2009, the continued low incurred loss ratios for 2009 suggests that profitability is likely to continue in 2009. Exhibits 2, 3 and 4 provide the same experience, without the profitability information, separately for licensed companies, surplus lines companies, and risk retention groups. The reserve take downs observed last year by the surplus lines companies continue in 2009 to a smaller degree. The nine years of history generally shows much more volatile incurred loss experience for the surplus lines and risk retention groups, while licensed companies’ experience is more stable, with gradual improvement over the latest five years. Exhibits 5 and 6 provide premium, loss and expense experience for 2008 and 2009 separately for the top fifteen writers in 2009. The written premium decline that we observed last year continues in 2009. The market remains concentrated with over 90% of the premium written by the top 15 insurers. MCIC, VT, Inc., an RRG covering several hospitals in Connecticut, ProSelect Insurance Company and Connecticut Medical Insurance Company continue as the top three writers with over 70% of total direct written premium. Non-admitted carriers (i.e., surplus lines and RRG’s) are writing over 40% of the business in 2009, and continue to increase their market share In addition, we have provided Exhibit 7 which displays investment income for 2008 and 2009 for the 15 leading insurers in the state. As noted above, these companies write 90% of the statewide premium. Meaningful comparisons are limited since investment earnings are not specific to medical malpractice insurance or to policies written just in Connecticut as they are derived from all assets held by the companies. These investment earnings are not specific to medical malpractice insurance or to policies written just in Connecticut as they are derived from all assets held by the companies. They also reflect total earnings for all insurance companies in a group, not just the company writing business in Connecticut.
Connecticut Medical Malpractice Annual Report – 2010
Appendix 1
Closed Claim Analysis Reports
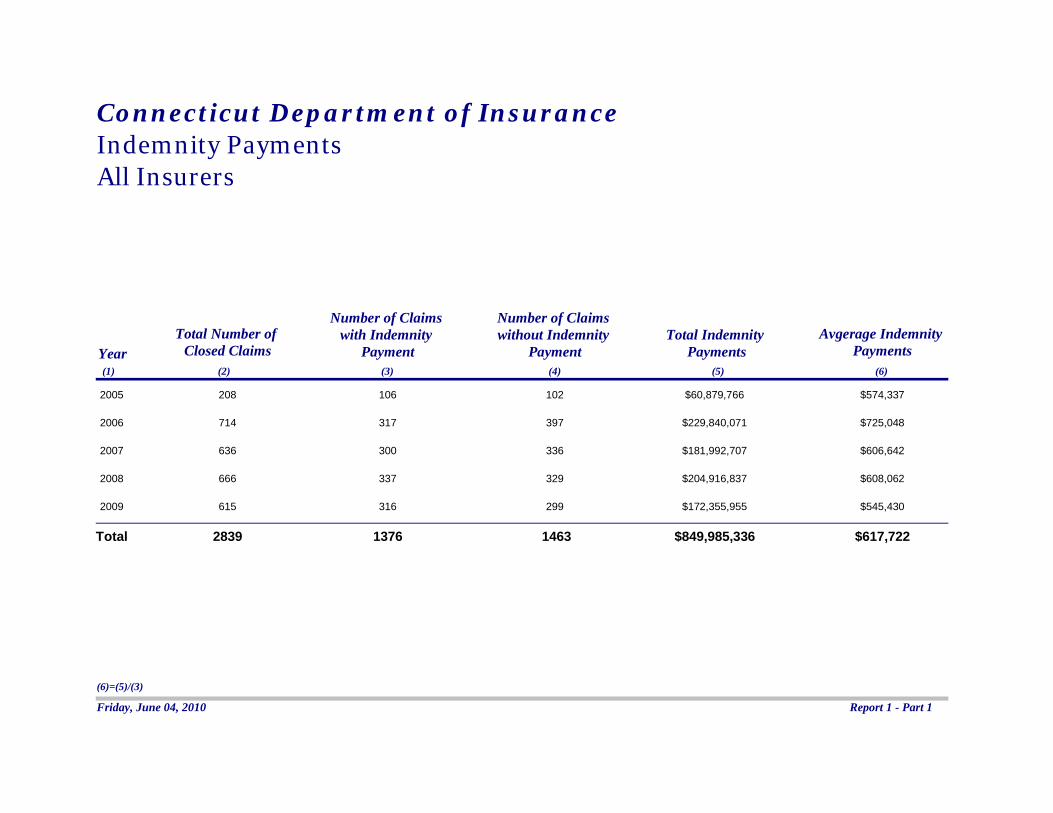
Number of Claims Number of Claims Total Number of with Indemnity without Indemnity Total Indemnity Avgerage Indemnity
Year Closed Claims Payment Payment Payments Payments (1) (2) (3) (4) (5) (6)
2005 208 106 102 $60,879,766 $574,337
2006 714 317 397 $229,840,071 $725,048
2007 636 300 336 $181,992,707 $606,642
2008 666 337 329 $204,916,837 $608,062
2009 615 316 299 $172,355,955 $545,430
Total 2839 1376 1463 $849,985,336 $617,722
Connecticut Department of Insurance
Indemnity Payments All Insurers
(6)=(5)/(3)
Friday, June 04, 2010 Report 1 - Part 1
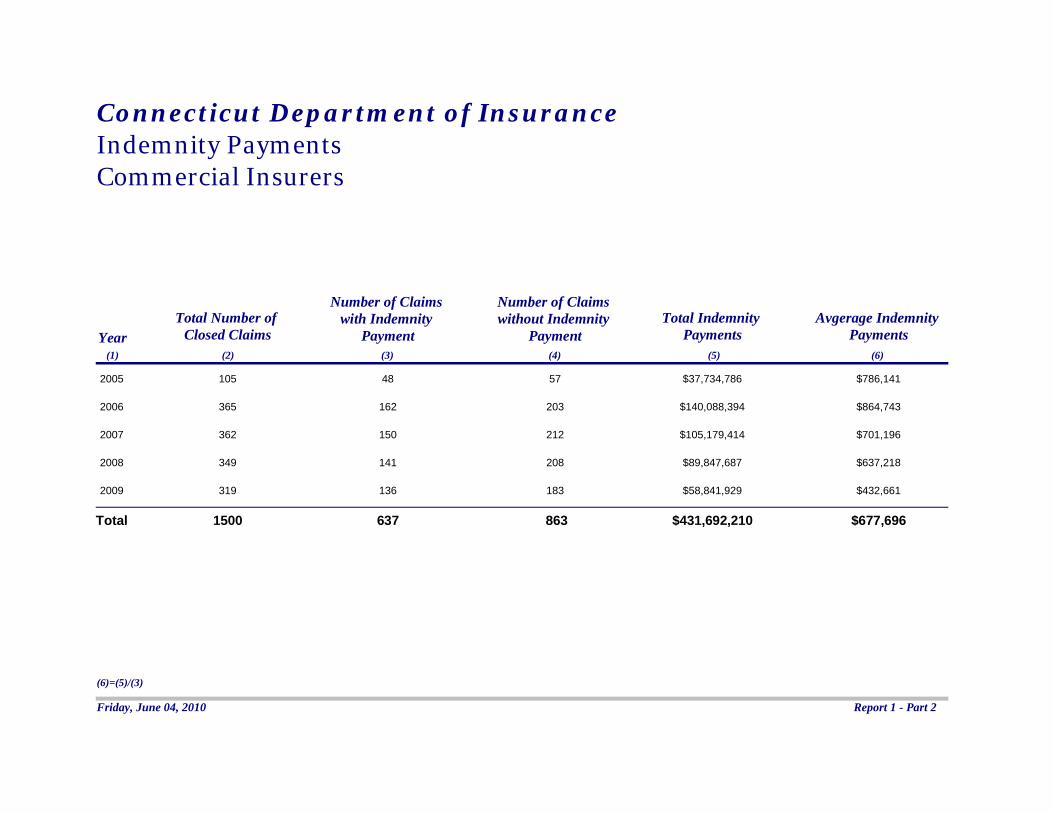
Number of Claims Number of Claims Total Number of with Indemnity without Indemnity Total Indemnity Avgerage Indemnity
Year Closed Claims Payment Payment Payments Payments (1) (2) (3) (4) (5) (6)
2005 105 48 57 $37,734,786 $786,141
2006 365 162 203 $140,088,394 $864,743
2007 362 150 212 $105,179,414 $701,196
2008 349 141 208 $89,847,687 $637,218
2009 319 136 183 $58,841,929 $432,661
Total 1500 637 863 $431,692,210 $677,696
Connecticut Department of Insurance
Indemnity Payments Commercial Insurers
(6)=(5)/(3)
Friday, June 04, 2010 Report 1 - Part 2
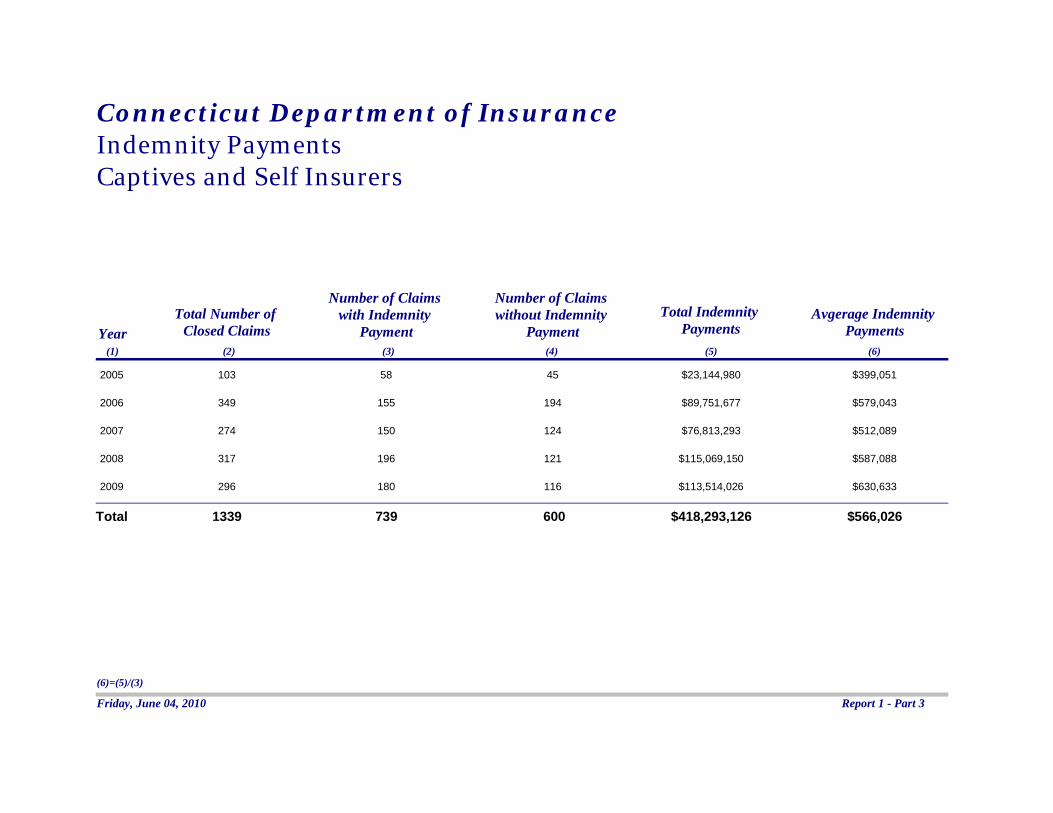
Number of Claims Number of Claims Total Number of with Indemnity without Indemnity Total Indemnity Avgerage Indemnity
Year Closed Claims Payment Payment Payments Payments (1) (2) (3) (4) (5) (6)
2005 103 58 45 $23,144,980 $399,051
2006 349 155 194 $89,751,677 $579,043
2007 274 150 124 $76,813,293 $512,089
2008 317 196 121 $115,069,150 $587,088
2009 296 180 116 $113,514,026 $630,633
Total 1339 739 600 $418,293,126 $566,026
Connecticut Department of Insurance
Indemnity Payments Captives and Self Insurers
(6)=(5)/(3)
Friday, June 04, 2010 Report 1 - Part 3
Total Number of Claims with Payment to
Defense Counsel Claims with Payment to
Defense Counsel Only Claims with Payment to Defense
Counsel and Indemnity Payments Year Closed Claims Number of Claims Total Payment Number of Claims AveragePayment Number of Claims Average Payment (1) (2) (3) (4) (5) (6) (7) (8)
2005 208 161 $7,487,384 80 $33,701 81 $59,152
2006 714 591 $26,560,157 323 $27,741 268 $65,671
2007 636 519 $29,123,912 265 $44,893 254 $67,824
2008 666 506 $29,254,423 238 $45,265 268 $68,961
2009 615 465 $32,701,522 213 $50,389 252 $87,177
Total 2839 2242 $125,127,398 1119 $40,267 1123 $71,299
Connecticut Department of Insurance
Defense Counsel Payments All Insurers
(3)=(5)+(7)
Friday, June 04, 2010 Report 2 - Part 1
Total Number of Claims with Payment to
Defense Counsel Claims with Payment to
Defense Counsel Only Claims with Payment to Defense
Counsel and Indemnity Payments Year Closed Claims Number of Claims Total Payment Number of Claims AveragePayment Number of Claims Average Payment (1) (2) (3) (4) (5) (6) (7) (8)
2005 105 89 $3,819,601 46 $26,765 43 $60,195
2006 365 304 $16,980,763 158 $39,581 146 $73,472
2007 362 304 $17,833,136 167 $44,265 137 $76,210
2008 349 274 $14,491,499 147 $42,118 127 $65,355
2009 319 248 $11,907,051 135 $46,197 113 $50,181
Total 1500 1219 $65,032,050 653 $41,815 566 $66,655
Connecticut Department of Insurance
Defense Counsel Payments Commercial Insurers
(3)=(5)+(7)
Friday, June 04, 2010 Report 2 - Part 2
Total Number of Claims with Payment to
Defense Counsel Claims with Payment to
Defense Counsel Only Claims with Payment to Defense
Counsel and Indemnity Payments Year Closed Claims Number of Claims Total Payment Number of Claims AveragePayment Number of Claims Average Payment (1) (2) (3) (4) (5) (6) (7) (8)
2005 103 72 $3,667,783 34 $43,085 38 $57,971
2006 349 287 $9,579,394 165 $16,403 122 $56,335
2007 274 215 $11,290,776 98 $45,962 117 $58,004
2008 317 232 $14,762,924 91 $50,347 141 $72,208
2009 296 217 $20,794,471 78 $57,644 139 $117,254
Total 1339 1023 $60,095,348 466 $38,098 557 $76,018
Connecticut Department of Insurance
Defense Counsel Payments Captives and Self Insurers
(3)=(5)+(7)
Friday, June 04, 2010 Report 2 - Part 3
Total Total Number Total ALAE Number of of Closed Payments as a
Closed Claims with Total Indemnity Total Payment to Total Payment to Percent of Total Year Claims ALAE Payments Defense Counsel Other ALAE Indemnity (1) (2) (3) (4) (5) (6) (7)
2005 208 168 $60,879,766 $7,487,384 $1,475,183 14.7%
2006 714 617 $229,840,071 $26,560,157 $5,323,075 13.9%
2007 636 549 $181,992,707 $29,123,912 $5,509,973 19.0%
2008 666 538 $204,916,837 $29,254,423 $7,847,516 18.1%
2009 615 492 $172,355,955 $32,701,522 $5,558,416 22.2%
Total 2839 2364 $849,985,336 $125,127,398 $25,714,163 17.7%
Connecticut Department of Insurance
Allocated Loss Adjustment Expenses (ALAE) as a Percent of Indemnity Payments All Insurers
(7)=(5)+(6)/(4)
Friday, June 04, 2010 Report 3 - Part 1

Total Total Number Total ALAE Number of of Closed Payments as a
Closed Claims with Total Indemnity Total Payment to Total Payment to Percent of Total Year Claims ALAE Payments Defense Counsel Other ALAE Indemnity (1) (2) (3) (4) (5) (6) (7)
2005 105 90 $37,734,786 $3,819,601 $1,130,143 13.1%
2006 365 322 $140,088,394 $16,980,763 $4,642,696 15.4%
2007 362 324 $105,179,414 $17,833,136 $4,592,021 21.3%
2008 349 292 $89,847,687 $14,491,499 $4,653,299 21.3%
2009 319 270 $58,841,929 $11,907,051 $4,334,302 27.6%
Total 1500 1298 $431,692,210 $65,032,050 $19,352,461 19.5%
Connecticut Department of Insurance
Allocated Loss Adjustment Expenses (ALAE) as a Percent of Indemnity Payments Commercial Insurers
(7)=(5)+(6)/(4)
Friday, June 04, 2010 Report 3 - Part 2

Total Total Number Total ALAE Number of of Closed Payments as a
Closed Claims with Total Indemnity Total Payment to Total Payment to Percent of Total Year Claims ALAE Payments Defense Counsel Other ALAE Indemnity (1) (2) (3) (4) (5) (6) (7)
2005 103 78 $23,144,980 $3,667,783 $345,040 17.3%
2006 349 295 $89,751,677 $9,579,394 $680,379 11.4%
2007 274 225 $76,813,293 $11,290,776 $917,952 15.9%
2008 317 246 $115,069,150 $14,762,924 $3,194,217 15.6%
2009 296 222 $113,514,026 $20,794,471 $1,224,114 19.4%
Total 1339 1066 $418,293,126 $60,095,348 $6,361,702 15.9%
Connecticut Department of Insurance Allocated Loss Adjustment Expenses (ALAE) as a Percent of Indemnity Payments Captives and Self Insurers
(7)=(5)+(6)/(4)
Friday, June 04, 2010 Report 3 - Part 3
Indemnity Payment (1)
Number of Claims with Indemnity Payments
(2)
Percent of Claims with Indemnity Payments
(3)
Total Indemnity Payments
(4)
Average Indemnity of Paid Claims
(5)
Percent of Total Indemnity Payments
(6)
$1 - $99,999
$100,000 - $199,999
$200,000 - $299,999
$300,000 - $399,999
$400,000 - $499,999
$500,000 - $599,999
$600,000 - $699,999
$700,000 - $799,999
$800,000 - $899,999
$900,000 - $999,999
$1,000,000 and Over
535
168
99
86
65
43
34
48
42
30
226
38.9%
12.2%
7.2%
6.3%
4.7%
3.1%
2.5%
3.5%
3.1%
2.2%
16.4%
$18,156,579
$22,821,034
$23,330,799
$28,564,775
$28,129,251
$22,095,000
$21,535,370
$35,628,218
$35,231,988
$28,289,238
$586,203,084
$33,938
$135,839
$235,665
$332,149
$432,758
$513,837
$633,393
$742,255
$838,857
$942,975
$2,593,819
2.1%
2.7%
2.7%
3.4%
3.3%
2.6%
2.5%
4.2%
4.1%
3.3%
69.0%
Total 1376 100.0% $849,985,336 $617,722 100.0%
Connecticut Department of Insurance Indemnity Payments fo r Claims All Insurers
2005 - 2009 Aggregate
(6)=(4) for each range/(4) total (5)=(4)/(2) (3)=(2) for each range/(2) total
Friday, June 04, 2010 Report 4
$1- $
99,99
9
$100
,000 - $
199,9
99
$200
,000 - $
299,9
99
$300
,000 - $
399,9
99
$400
,000 - $
499,9
99
$500
,000 - $
599,9
99
$600
,000 - $
699,9
99
$700
,000 - $
799,9
99
$800
,000 - $
899,9
99
$900
,000 - $
999,9
99
$1,00
0,000
and O
ver
Connecticut Department of Insurance
Average Indemnity Payment by Indemnity Payment Size 2005 - 2009 Aggregate
$0
$500,000
$1,000,000
$1,500,000
$2,000,000
$2,500,000
$3,000,000
Ave
rage
Inde
mni
ty P
aym
ent
Indemnity Payment Size
6/4/2010 Chart 4 - 1
$1 - $
99, 99
9 $1
00,00
0 - $1
99,99
9 $2
00,00
0 - $2
99,99
9 $3
00,00
0 - $3
99,99
9 $4
00,00
0 - $4
99,99
9 $5
00,00
0 - $5
99,99
9 $6
00,00
0 - $6
99,99
9 $7
00,00
0 - $7
99,99
9 $8
00,00
0 - $8
99,99
9 $9
00,00
0 - $9
99,99
9 $1
, 000,0
00 an
d Ove
r Connecticut Department of Insurance
Number of Claims by Indemnity Payment Size 2005 - 2009 Aggregate
0
100
200
300
400
500
600
Num
ber o
f Cla
ims
Indemnity Payment Size
6/4/2010 Chart 4 - 2
Indemnity Payment (1)
Total Number of Closed Claims
(2)
Number of Claims with Payments to
Defense Counsel (3)
Total Payment to Defense Counsel
(4)
Average Payment to Defense Counsel
(5)
Percent of Total Payments to
Defense Counsel (6)
$0
$1 - $99,999
$100,000 - $199,999
$200,000 - $299,999
$300,000 - $399,999
$400,000 - $499,999
$500,000 - $599,999
$600,000 - $699,999
$700,000 - $799,999
$800,000 - $899,999
$900,000 - $999,999
$1,000,000 and Over
1463
535
168
99
86
65
43
34
48
42
30
226
1119
336
152
89
82
58
43
33
46
41
30
213
$45,058,839
$11,458,523
$9,192,023
$4,795,640
$5,296,324
$3,623,075
$3,234,430
$3,023,722
$3,658,540
$2,856,225
$2,377,696
$30,552,361
$40,267
$34,103
$60,474
$53,884
$64,589
$62,467
$75,219
$91,628
$79,533
$69,664
$79,257
$143,438
36.0%
9.2%
7.3%
3.8%
4.2%
2.9%
2.6%
2.4%
2.9%
2.3%
1.9%
24.4%
Total 2839 2242 $125,127,398 $55,811 100.0%
Connecticut Department of Insurance Defense Counsel Payments by Indemnity Payment All Insurers
2005 - 2009 Aggregate
(5)=(4)/(3)
(6)=(4) for each range/(4) total
Friday, June 04, 2010 Report 5
$0
$1 - $
99,99
9
$100
,000 -
$199
,999
$200
,000 -
$299
,999
$300
,000 -
$399
,999
$400
,000 -
$499
,999
$500
,000 -
$599
,999
$600
,000 -
$699
,999
$700
,000 -
$799
,999
$800
,000 -
$899
,999
$900
,000 -
$999
,999
$1,00
0,000
and O
ver
Connecticut Department of Insurance
Average Payment to Defense Counsel by Indemnity Payment Size 2005 - 2009 Aggregate
$0
$25,000
$50,000
$75,000
$100,000
$125,000
$150,000
Ave
rage
Def
ense
Cou
nsel
Pay
men
t
Indemnity Payment Size
6/4/2010 Chart 5 - 1
Number of Claims Percent of Claims Number of Claims Percent of Claims Report to Closure Total Number of Percent of Total with Indemnity with Indemnity with Defense with Defense
Date Closed Claims Closed Claims Payments Payments Counsel Payments Counsel Payments (1) (2) (3) (4) (5) (6) (7)
0 - 6 Months 289 10.2% 89 6.5% 96 4.3%
6 - 12 Months 239 8.4% 84 6.1% 114 5.1%
12 - 18 Months 230 8.1% 88 6.4% 153 6.8%
18 - 24 Months 258 9.1% 97 7.0% 203 9.1%
24 - 36 Months 572 20.1% 301 21.9% 497 22.2%
36 - 60 Months 805 28.4% 477 34.7% 753 33.6%
60 - 90 Months 366 12.9% 205 14.9% 348 15.5%
90 - 120 Months 61 2.1% 26 1.9% 59 2.6%
120 Months and Over 19 0.7% 9 0.7% 19 0.8%
Total 2839 100.0% 1376 100.0% 2242 100.0%
Average Length of Claims 3.02 YEARS 3.34 YEARS 3.45 YEARS
Connecticut Department of Insurance Length of Claims from Report Date to Closure Date
All Claims from All Insurers
2005 - 2009 Aggregate
(3)=(2) for each range/(2) total (5)=(4) for each range/(4) total (7)=(6) for each range/(6) total
Friday, June 04, 2010 Report 6 - Part 1
0 -6 MTHS
6 -12
MTHS 12
- 18 M
THS 18
- 24 M
THS 24
- 36 M
THS 36
- 60 M
THS 60
- 90 M
THS 90
- 120
MTHS 12
0 MTHS and O
ver
Connecticut Department of Insurance
Length of Claims From Report to Closure Date 2005 - 2009 Aggregate
0
100
200
300
400
500
600
700
800
900
Num
ber o
f Clo
sed
Cla
ims
Length of Claims from Report to Closure Date
Total Closed Claims Claims With Indemnity Payment Claims With Defense Counsel Payment
6/4/2010 Chart 6 - 1
Number of Claims Average Report Date to Total Number of with Indemnity Total Indemnity Percent of Total Indemnity of Paid
Closure Date Closed Claims Payments Paid Ratio Payments Indemnity Payments Claims (1) (2) (3) (4) (5) (6) (7)
0 - 6 Months 289 89 30.8% $4,858,384 0.6% $54,589
6 - 12 Months 239 84 35.1% $15,571,398 1.8% $185,374
12 - 18 Months 230 88 38.3% $22,956,058 2.7% $260,864
18 - 24 Months 258 97 37.6% $28,814,534 3.4% $297,057
24 - 36 Months 572 301 52.6% $190,210,609 22.4% $631,929
36 - 60 Months 805 477 59.3% $291,509,616 34.3% $611,131
60 - 90 Months 366 205 56.0% $234,895,812 27.6% $1,145,833
90 - 120 Months 61 26 42.6% $40,985,800 4.8% $1,576,377
120 Months and Over 19 9 47.4% $20,183,125 2.4% $2,242,569
Total 2839 1376 48.5% $849,985,336 100.0% $617,722
Connecticut Department of Insurance Length of Claims from Report Date to Closure Date Claims with Indemnity Payments - From All Insurers
2005 - 2009 Aggregate
(4)=(3)/(2)
(6)=(5) for each range/(5) total
(7)=(5)/(3)
Friday, June 04, 2010 Report 6 - Part 2
0 - 6 MTHS
6 - 12MTHS
12- 18
MTHS
18- 24
MTHS
24- 36
MTHS
36- 60
MTHS
60- 90
MTHS
90- 12
0 MTHS 12
0 MTHS an
d Ove
r
Connecticut Department of Insurance
Length of Claims From Report to Closure Date Average Indemnity of Paid Claims
2005 - 2009 Aggregate
$0
$500,000
$1,000,000
$1,500,000
$2,000,000
$2,500,000
Ave
rage
Inde
mni
ty o
f Pai
d C
laim
s
Length of Claims from Report to Closure Date
6/4/2010 Chart 6 - 2
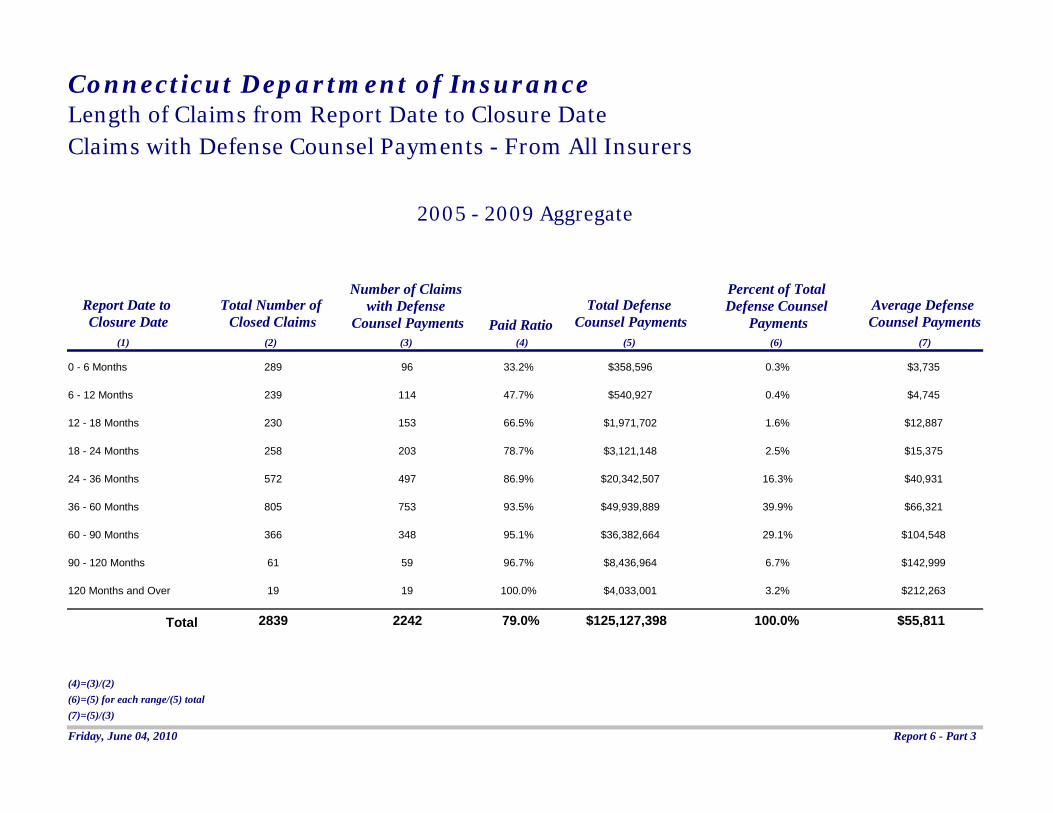
Connecticut Department of Insurance Length of Claims from Report Date to Closure Date Claims with Defense Counsel Payments - From All Insurers
2005 - 2009 Aggregate
Number of Claims Percent of Total Report Date to Total Number of with Defense Total Defense Defense Counsel Average Defense Closure Date Closed Claims Counsel Payments Paid Ratio Counsel Payments Payments Counsel Payments
(1) (2) (3) (4) (5) (6) (7)
0 - 6 Months 289 96 33.2% $358,596 0.3% $3,735
6 - 12 Months 239 114 47.7% $540,927 0.4% $4,745
12 - 18 Months 230 153 66.5% $1,971,702 1.6% $12,887
18 - 24 Months 258 203 78.7% $3,121,148 2.5% $15,375
24 - 36 Months 572 497 86.9% $20,342,507 16.3% $40,931
36 - 60 Months 805 753 93.5% $49,939,889 39.9% $66,321
60 - 90 Months 366 348 95.1% $36,382,664 29.1% $104,548
90 - 120 Months 61 59 96.7% $8,436,964 6.7% $142,999
120 Months and Over 19 19 100.0% $4,033,001 3.2% $212,263
Total 2839 2242 79.0% $125,127,398 100.0% $55,811
(4)=(3)/(2) (6)=(5) for each range/(5) total (7)=(5)/(3)
Friday, June 04, 2010 Report 6 - Part 3
0 - 6 MTHS
6 - 12MTHS
12- 18
MTHS
18- 24
MTHS
24- 36
MTHS
36- 60
MTHS
60- 90
MTHS
90- 12
0 MTHS 12
0 MTHS an
d Ove
r
Connecticut Department of Insurance
Length of Claims From Report to Closure Date Average Payment to Defense Counsel
2005 - 2009 Aggregate
$0
$50,000
$100,000
$150,000
$200,000
$250,000
Ave
rage
Pay
men
t to
Def
ense
Cou
nsel
Length of Claims from Report to Closure Date
6/4/2010 Chart 6 - 3
Number of Claims Percent of Claims Injury Date to Total Number of Percent of Total with Indemnity with Indemnity
Report Date Closed Claims Closed Claims Payments Payments (1) (2) (3) (4) (5)
0 - 6 Months 940 33.1% 511 37.1%
6 - 12 Months 325 11.4% 161 11.7%
12 - 18 Months 273 9.6% 144 10.5%
18 - 24 Months 451 15.9% 210 15.3%
24 - 36 Months 631 22.2% 258 18.8%
36 - 60 Months 144 5.1% 64 4.7%
60 - 90 Months 51 1.8% 21 1.5%
90 - 120 Months 11 0.4% 4 0.3%
120 Months and Over 13 0.5% 3 0.2%
Total 2839 100.0% 1376 100.0%
Average Length of Claims 1.83 YEARS 2.04 YEARS
Connecticut Department of Insurance Length of Claims from Injury Date to Report Date All Claims - From All Insurers
2005 - 2009 Aggregate
(3)=(2) for each range/(2) total (5)=(4) for each range/(4) total
Friday, June 04, 2010 Report 6 - Part 4
Number of Claims Percent of Claims Injury Date to Total Number of Percent of Total with Indemnity with Indemnity
Closure Date Closed Claims Closed Claims Payments Payments (1) (2) (3) (4) (5)
0 - 6 Months 56 2.0% 30 2.2%
6 - 12 Months 109 3.8% 51 3.7%
12 - 18 Months 130 4.6% 43 3.1%
18 - 24 Months 162 5.7% 62 4.5%
24 - 36 Months 438 15.4% 165 12.0%
36 - 60 Months 875 30.8% 470 34.2%
60 - 90 Months 783 27.6% 415 30.2%
90 - 120 Months 216 7.6% 111 8.1%
120 Months and Over 70 2.5% 29 2.1%
Total 2839 100.0% 1376 100.0%
Average Length of Claims 4.85 YEARS 5.37 YEARS
Connecticut Department of Insurance Length of Claims from Injury Date to Closure Date All Claims - From All Insurers
(3)=(2) for each range/(2) total (5)=(4) for each range/(4) total
Friday, June 04, 2010 Report 6 - Part 5
2005 - 2009 Aggregate
Number of Claims with Percent of Claims with Total Indemnity Average Indemnity of Percent ot Total Severity of Injury Indemnity Payments Indemnity Payments Payments Paid Claims Indemnity Payments
(1) (2) (3) (4) (5) (6)
Emotional Only 44 3.2% $9,626,313 $218,780 1.1%
Insignificant Temporary 102 7.4% $6,523,032 $63,951 0.8%
Minor Temporary 225 16.4% $18,343,969 $81,529 2.2%
Major Temporary 154 11.2% $63,783,761 $414,180 7.5%
Minor Permanent 177 12.9% $40,723,377 $230,076 4.8%
Significant Permanent 167 12.1% $110,410,032 $661,138 13.0%
Major Permanent 106 7.7% $184,286,744 $1,738,554 21.7%
Grave Permanent 42 3.1% $99,219,222 $2,362,362 11.7%
Death 359 26.1% $317,068,886 $883,200 37.3%
Total 1376 100.0% $849,985,336 $617,722 100.0%
Connecticut Department of Insurance Indemnity Payments by Severity of Injury
All Insurers
2005 - 2009 Aggregate
(3)=(2) for each category/(2) total (5)=(4)/(2) (6)=(4) for each category/(4) total
Friday, June 04, 2010 Report 7 - Part 1
Emotional
Only
Insignific
ant T
emporar
y Minor T
emporar
y Majo
r Tem
porary
Minor Perm
anen
t Signific
ant P
erman
ent
Major P
erman
ent
Grave Perm
anen
t
Death
Connecticut Department of Insurance
Average Indemnity Paid by Severity of Injury 2005 - 2009 Aggregate
$0
$500,000
$1,000,000
$1,500,000
$2,000,000
$2,500,000
$3,000,000
Ave
rage
Inde
mni
ty P
aid
Injury Severity
6/4/2010 Chart 7 - 1
Number of Claims with Total Payment to Average Payment to Number of Claims with Indemnity and Defense Defense Counsel for Defense Counsel for
Severity of Injury Indemnity Payments Counsel Payments Claims in (3) Claims in (3) (1) (2) (3) (4) (5)
Emotional Only 44 33 $1,689,440 $51,195
Insignificant Temporary 102 62 $2,368,660 $38,204
Minor Temporary 225 142 $7,052,215 $49,663
Major Temporary 154 108 $6,709,263 $62,123
Minor Permanent 177 154 $8,925,330 $57,957
Significant Permanent 167 157 $11,802,246 $75,174
Major Permanent 106 99 $11,850,184 $119,699
Grave Permanent 42 36 $6,161,094 $171,142
Death 359 332 $26,847,288 $80,865
Total 1376 1123 $83,405,720 $74,270
Connecticut Department of Insurance Defense Counsel Payments by Severity of Injury Claims with Indemnity Payments
All Insurers
2005 - 2009 Aggregate
(5)=(4)/(3)
Friday, June 04, 2010 Report 7 - Part 2
Emotional
Only Insig
nifican
t Temporar
y Minor T
emporar
y Majo
r Tem
porary
Minor Perm
anen
t Signific
ant Perm
anen
t Majo
r Perm
anen
t Grav
e Perman
ent
Death
Connecticut Department of Insurance
Average Payment to Defense Counsel by Severity of Injury
Claims with Indemnity Payment
2005 - 2009 Aggregate
$0
$20,000
$40,000
$60,000
$80,000
$100,000
$120,000
$140,000
$160,000
$180,000
Ave
rage
Def
ense
Cou
nsel
Pay
men
t
Injury Severity
6/4/2010 Chart 7 - 2
Number of Claims Number of Claims with Total Payment to Average Payment to without Indemnity Payment to Defense Defense Counsel for Defense Counsel for
Severity of Injury Payments Counsel only Claims in (3) Claims in (3) (1) (2) (3) (4) (5)
Emotional Only 153 113 $1,784,291 $15,790
Insignificant Temporary 164 110 $1,494,252 $13,584
Minor Temporary 338 198 $4,828,369 $24,386
Major Temporary 137 109 $3,645,734 $33,447
Minor Permanent 153 129 $3,945,199 $30,583
Significant Permanent 167 153 $5,764,856 $37,679
Major Permanent 74 71 $5,574,076 $78,508
Grave Permanent 24 18 $1,777,229 $98,735
Death 253 218 $12,907,672 $59,210
Total 1463 1119 $41,721,678 $37,285
Connecticut Department of Insurance Defense Counsel Payments by Severity of Injury Claims without Indemnity Payments
All Insurers
2005 - 2009 Aggregate
(5)=(4)/(3)
Friday, June 04, 2010 Report 7 - Part 3
Emotional
Only
Insignific
ant Tem
porary
Minor Temporar
y Majo
r Temporar
y Minor Perm
anen
t Signific
ant Perm
anen
t Majo
r Perman
ent
Grave Perm
anen
t
Death
Connecticut Department of Insurance
Average Payment to Defense Counsel by Severity of Injury Claims Without Indemnity Payment
2005 - 2009 Aggregate
$0
$20,000
$40,000
$60,000
$80,000
$100,000
$120,000
Ave
rage
Def
ense
Cou
nsel
Pay
men
t
Injury Severity
6/4/2010 Chart 7 - 3
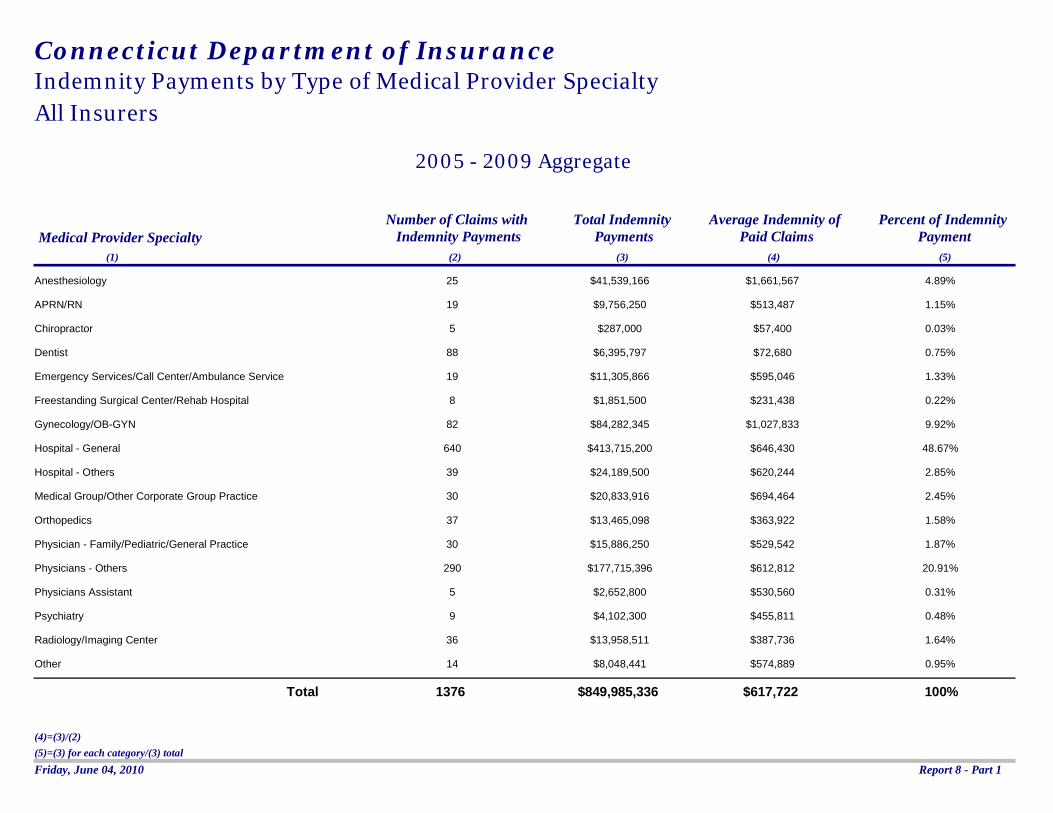
Connecticut Department of Insurance Indemnity Payments by Type of Medical Provider Specialty All Insurers
2005 - 2009 Aggregate
Number of Claims with Total Indemnity Average Indemnity of Percent of Indemnity Medical Provider Specialty Indemnity Payments Payments Paid Claims Payment
(1) (2) (3) (4) (5)
Anesthesiology 25 $41,539,166 $1,661,567 4.89%
APRN/RN 19 $9,756,250 $513,487 1.15%
Chiropractor 5 $287,000 $57,400 0.03%
Dentist 88 $6,395,797 $72,680 0.75%
Emergency Services/Call Center/Ambulance Service 19 $11,305,866 $595,046 1.33%
Freestanding Surgical Center/Rehab Hospital 8 $1,851,500 $231,438 0.22%
Gynecology/OB-GYN 82 $84,282,345 $1,027,833 9.92%
Hospital - General 640 $413,715,200 $646,430 48.67%
Hospital - Others 39 $24,189,500 $620,244 2.85%
Medical Group/Other Corporate Group Practice 30 $20,833,916 $694,464 2.45%
Orthopedics 37 $13,465,098 $363,922 1.58%
Physician - Family/Pediatric/General Practice 30 $15,886,250 $529,542 1.87%
Physicians - Others 290 $177,715,396 $612,812 20.91%
Physicians Assistant 5 $2,652,800 $530,560 0.31%
Psychiatry 9 $4,102,300 $455,811 0.48%
Radiology/Imaging Center 36 $13,958,511 $387,736 1.64%
Other 14 $8,048,441 $574,889 0.95%
Total 1376 $849,985,336 $617,722 100%
(4)=(3)/(2) (5)=(3) for each category/(3) total Friday, June 04, 2010 Report 8 - Part 1
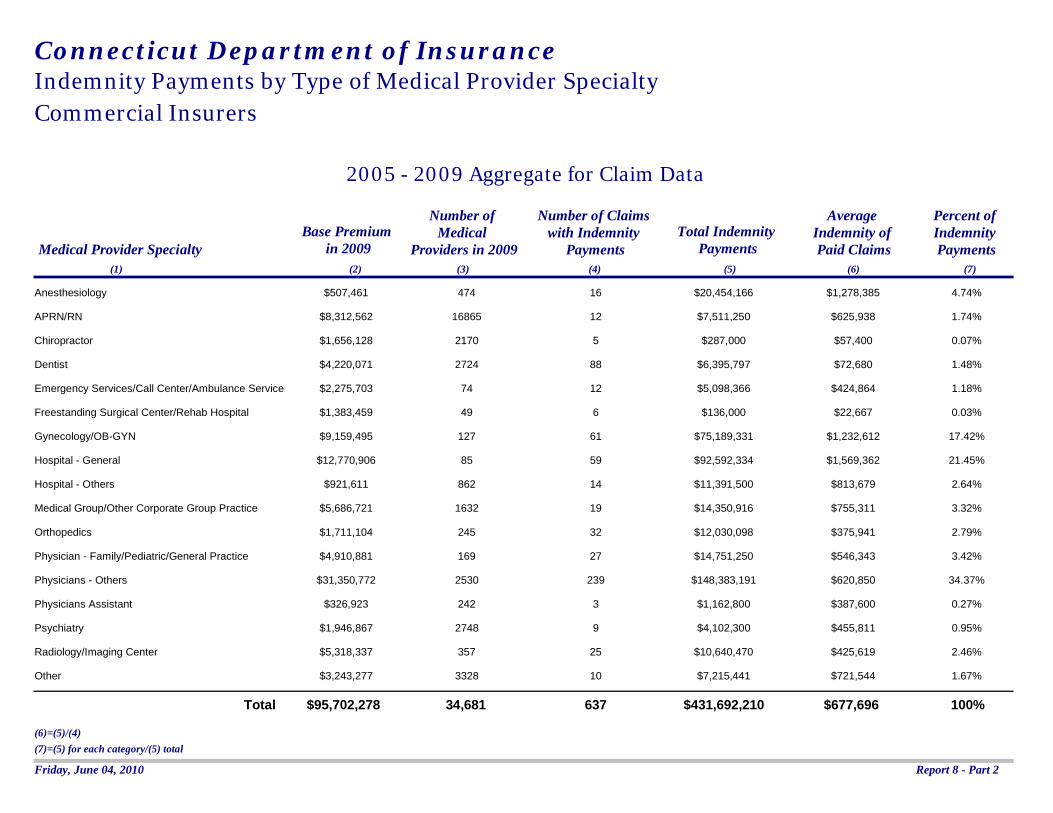
Connecticut Department of Insurance Indemnity Payments by Type of Medical Provider Specialty Commercial Insurers
2005 - 2009 Aggregate for Claim Data
Medical Provider Specialty Base Premium
in 2009
Number of Medical
Providers in 2009
Number of Claims with Indemnity
Payments Total Indemnity
Payments
Average Indemnity of Paid Claims
Percent of Indemnity Payments
(1) (2) (3) (4) (5) (6) (7)
Anesthesiology $507,461 474 16 $20,454,166 $1,278,385 4.74%
APRN/RN $8,312,562 16865 12 $7,511,250 $625,938 1.74%
Chiropractor $1,656,128 2170 5 $287,000 $57,400 0.07%
Dentist $4,220,071 2724 88 $6,395,797 $72,680 1.48%
Emergency Services/Call Center/Ambulance Service $2,275,703 74 12 $5,098,366 $424,864 1.18%
Freestanding Surgical Center/Rehab Hospital $1,383,459 49 6 $136,000 $22,667 0.03%
Gynecology/OB-GYN $9,159,495 127 61 $75,189,331 $1,232,612 17.42%
Hospital - General $12,770,906 85 59 $92,592,334 $1,569,362 21.45%
Hospital - Others $921,611 862 14 $11,391,500 $813,679 2.64%
Medical Group/Other Corporate Group Practice $5,686,721 1632 19 $14,350,916 $755,311 3.32%
Orthopedics $1,711,104 245 32 $12,030,098 $375,941 2.79%
Physician - Family/Pediatric/General Practice $4,910,881 169 27 $14,751,250 $546,343 3.42%
Physicians - Others $31,350,772 2530 239 $148,383,191 $620,850 34.37%
Physicians Assistant $326,923 242 3 $1,162,800 $387,600 0.27%
Psychiatry $1,946,867 2748 9 $4,102,300 $455,811 0.95%
Radiology/Imaging Center $5,318,337 357 25 $10,640,470 $425,619 2.46%
Other $3,243,277 3328 10 $7,215,441 $721,544 1.67%
Total $95,702,278 34,681 637 $431,692,210 $677,696 100%
(6)=(5)/(4) (7)=(5) for each category/(5) total
Friday, June 04, 2010 Report 8 - Part 2
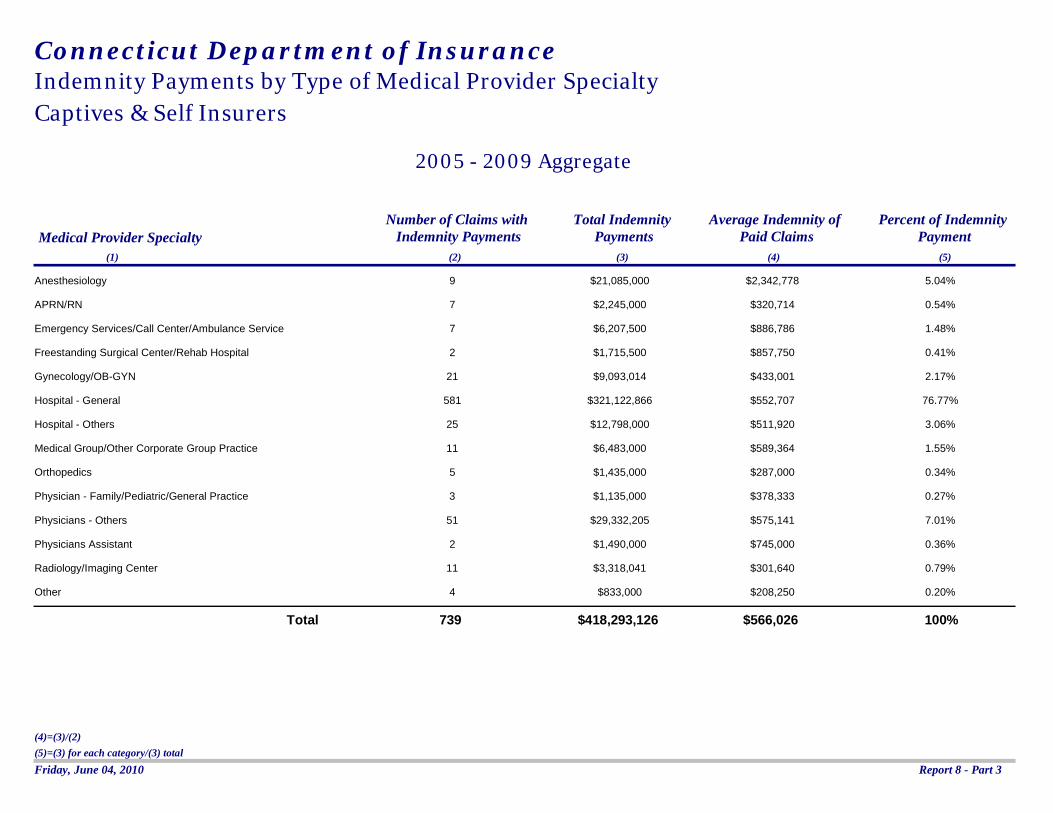
Connecticut Department of Insurance Indemnity Payments by Type of Medical Provider Specialty Captives & Self Insurers
2005 - 2009 Aggregate
Number of Claims with Total Indemnity Average Indemnity of Percent of Indemnity Medical Provider Specialty Indemnity Payments Payments Paid Claims Payment
(1) (2) (3) (4) (5)
Anesthesiology 9 $21,085,000 $2,342,778 5.04%
APRN/RN 7 $2,245,000 $320,714 0.54%
Emergency Services/Call Center/Ambulance Service 7 $6,207,500 $886,786 1.48%
Freestanding Surgical Center/Rehab Hospital 2 $1,715,500 $857,750 0.41%
Gynecology/OB-GYN 21 $9,093,014 $433,001 2.17%
Hospital - General 581 $321,122,866 $552,707 76.77%
Hospital - Others 25 $12,798,000 $511,920 3.06%
Medical Group/Other Corporate Group Practice 11 $6,483,000 $589,364 1.55%
Orthopedics 5 $1,435,000 $287,000 0.34%
Physician - Family/Pediatric/General Practice 3 $1,135,000 $378,333 0.27%
Physicians - Others 51 $29,332,205 $575,141 7.01%
Physicians Assistant 2 $1,490,000 $745,000 0.36%
Radiology/Imaging Center 11 $3,318,041 $301,640 0.79%
Other 4 $833,000 $208,250 0.20%
Total 739 $418,293,126 $566,026 100%
(4)=(3)/(2) (5)=(3) for each category/(3) total Friday, June 04, 2010 Report 8 - Part 3
Claim Reports Average Months Average Average paid Incident to Incident to Severity of
Disposition Number Percent Report Disposition Injury Rating Indemnity ALAE (1) (2) (3) (4) (5) (6) (7) (8)
In Favor of Plaintiff
Claims Settled Before Litigation 258 18.8% 9 23 4 $117,936 $7,216
Claims Settled Before Trial 1034 75.1% 29 74 5 $652,856 $74,717
Claims Settled During Trial 30 2.2% 26 78 6 $1,538,217 $166,725
Claims Settled After Trial 21 1.5% 21 89 6 $2,002,808 $184,166
Total Settled 1343 97.6% 25 64 5 $590,980 $65,516
Judgement for Plaintiff 29 2.1% 16 73 5 $1,705,234 $224,551
Judgement for Plaintiff On Appeal 4 0.3% 13 99 6 $1,711,719 $283,506
Total Court Dispositions 33 2.4% 16 76 5 $1,706,020 $231,697
Total 1376 100.0% 24 65 5 $617,722 $69,501
In Favor of Defendant
Claims Closed Before Litigation 465 31.8% 11 28 3 $4,683
Claims Closed Before Trial 753 51.5% 24 62 5 $39,199
Claims Closed During Trial 5 0.3% 24 73 0 $44,321
Claims Closed After Trial 45 3.1% 22 64 6 $53,393
Total Settled 1268 86.7% 19 50 4 $27,065
Judgement for Defendant 173 11.8% 20 65 4 $101,314
Judgement for Defendant On Appeal 22 1.5% 22 97 7 $152,802
Total Court Dispositions 195 13.3% 20 69 5 $107,123
Total 1463 100.0% 20 52 4 $37,736
(3)=(2) for each category/(2) total (6) - average severity ratings range from 1 to 9, with 9 the most serious
Friday, June 04, 2010 Report 9
Connecticut Department of Insurance Disposition of Claims For All Insurers
2005 - 2009 Aggregate
Connecticut Department of Insurance
Reserves All Insurers
Initial Indemnity Average Initial Final Indemnity Average Final Final Indemnity Average Final
Year Total Number of
Closed Claims and Expense
Reserves Indemnity and
Expense Reserves and Expense
Reserves Indemnity and
Expense Reserves and Expense
Payments Indemnity and
Expense Payments (1) (2) (3) (4) (5) (6) (7) (8)
2005 208 $20,517,931 $98,644 $68,757,665 $330,566 $69,842,333 $335,780
2006 714 $67,562,968 $94,626 $268,839,078 $376,525 $261,723,303 $366,559
2007 636 $76,135,889 $119,711 $253,212,935 $398,134 $216,626,592 $340,608
2008 666 $78,429,488 $117,762 $267,852,839 $402,181 $242,018,776 $363,392
2009 615 $68,392,207 $111,207 $245,905,227 $399,846 $210,615,893 $342,465
Total 2839 $311,038,483 $109,559 $1,104,567,744 $389,069 $1,000,826,897 $352,528
(4)=(3)/(2) (6)=(5)/(2) (8)=(7)/(2)
Friday, June 04, 2010 Report 10 - Part 1
Connecticut Department of Insurance
Reserves Commercial Insurers
Initial Indemnity Average Initial Final Indemnity Average Final Final Indemnity Average Final
Year Total Number of
Closed Claims and Expense
Reserves Indemnity and
Expense Reserves and Expense
Reserves Indemnity and
Expense Reserves and Expense
Payments Indemnity and
Expense Payments (1) (2) (3) (4) (5) (6) (7) (8)
2005 105 $13,491,095 $128,487 $45,466,241 $433,012 $42,684,530 $406,519
2006 365 $32,235,294 $88,316 $169,913,410 $465,516 $161,711,853 $443,046
2007 362 $43,951,913 $121,414 $147,209,509 $406,656 $127,604,571 $352,499
2008 349 $41,808,115 $119,794 $120,202,751 $344,420 $108,992,485 $312,299
2009 319 $29,574,817 $92,711 $97,645,338 $306,098 $75,083,282 $235,371
Total 1500 $161,061,234 $107,374 $580,437,249 $386,958 $516,076,721 $344,051
(4)=(3)/(2) (6)=(5)/(2) (8)=(7)/(2)
Friday, June 04, 2010 Report 10 - Part 2
Connecticut Department of Insurance
Reserves Captives and Self Insurers
Initial Indemnity Average Initial Final Indemnity Average Final Final Indemnity Average Final
Year Total Number of
Closed Claims and Expense
Reserves Indemnity and
Expense Reserves and Expense
Reserves Indemnity and
Expense Reserves and Expense
Payments Indemnity and
Expense Payments (1) (2) (3) (4) (5) (6) (7) (8)
2005 103 $7,026,836 $68,222 $23,291,424 $226,130 $27,157,803 $263,668
2006 349 $35,327,674 $101,225 $98,925,668 $283,455 $100,011,450 $286,566
2007 274 $32,183,976 $117,460 $106,003,426 $386,874 $89,022,021 $324,898
2008 317 $36,621,373 $115,525 $147,650,088 $465,773 $133,026,291 $419,641
2009 296 $38,817,390 $131,140 $148,259,889 $500,878 $135,532,611 $457,880
Total 1339 $149,977,249 $112,007 $524,130,495 $391,434 $484,750,176 $362,024
(4)=(3)/(2) (6)=(5)/(2) (8)=(7)/(2)
Friday, June 04, 2010 Report 10 - Part 3
Connecticut Department of Insurance
Yearly Information Report All Insurers
Year Number of Closed Claims Total Indemnity Payments Economic Damages Non-Economic Damages (1) (2) (3) (4)
2005 32 $5,341,400 $743,570 $4,597,830
2006 168 $118,193,293 $32,825,535 $85,367, 758
2007 130 $92,239,119 $38,800,975 $53,438, 144
2008 174 $112,613,041 $28,455,980 $84,084, 821
2009 188 $73,081,334 $16,202,325 $56,879, 009
Total 692 $401,468,187 $117,028,385 $284,367 ,562
(1) Includes only those claims for which the insurer provided a split of Economic vs. Non-Economic Damages
Friday, June 04, 2010 Report 11 - Part 1
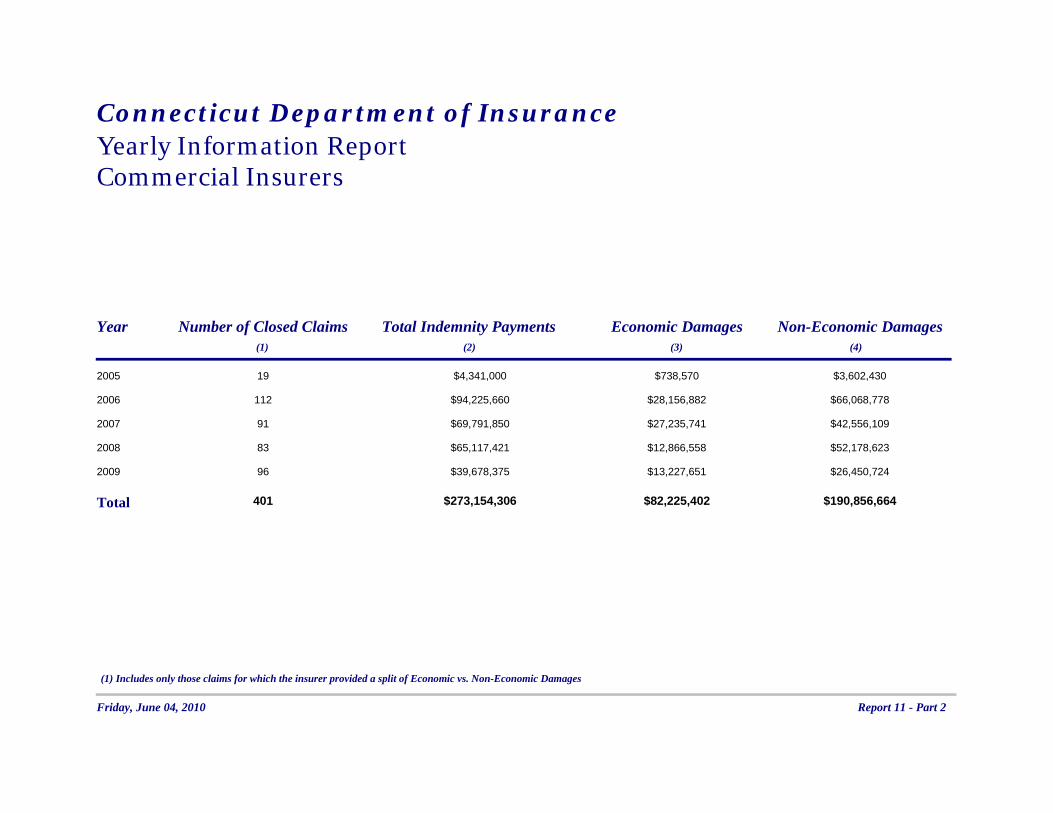
Year Number of Closed Claims Total Indemnity Payments Economic Damages Non-Economic Damages (1) (2) (3) (4)
2005 19 $4,341,000 $738,570 $3,602,430
2006 112 $94,225,660 $28,156,882 $66,068,778
2007 91 $69,791,850 $27,235,741 $42,556,109
2008 83 $65,117,421 $12,866,558 $52,178,623
2009 96 $39,678,375 $13,227,651 $26,450,724
Total 401 $273,154,306 $82,225,402 $190,856,664
(1) Includes only those claims for which the insurer provided a split of Economic vs. Non-Economic Damages
Friday, June 04, 2010 Report 11 - Part 2
Connecticut Department of Insurance
Yearly Information Report Commercial Insurers
Year Number of Closed Claims Total Indemnity Payments Economic Damages Non-Economic Damages (1) (2) (3) (4)
2005 13 $1,000,400 $5,000 $995,400
2006 56 $23,967,633 $4,668,653 $19,298,980
2007 39 $22,447,269 $11,565,234 $10,882,035
2008 91 $47,495,620 $15,589,422 $31,906,198
2009 92 $33,402,959 $2,974,674 $30,428,285
Total 291 $128,313,881 $34,802,983 $93,510,898
(1) Includes only those claims for which the insurer provided a split of Economic vs. Non-Economic Damages
Friday, June 04, 2010 Report 11 - Part 3
Connecticut Department of Insurance Yearly Information Report Captives and Self Insurers
Connecticut Medical Malpractice Annual Report – 2010
Appendix 2
Calendar Year Premium and Losses for 2005, 2006, 2007, 2008 and 2009
Connecticut Department of Insurance (3) and (4) include all ALAE (4) does not include Incurred but not Reported (IBNR) reserves Yearly Information Report - All Insurers
Type Earned Premium Paid Losses Incurred Losses (1) (2) (3) (4)
2005
Commercial Insurers
Captives
Self Insurers
$173,848,054
$131,495,884
$28,247,020
$130,546,853
$55,016,295
$22,140,731
$125,230,867
$89,976,069
$30,131,098
2006
Totals $333,590,958 $207,703,879 $245,338,034
Commercial Insurers
Captives
Self Insurers
$168,694,762
$127,381,279
$26,811,080
$134,152,740
$74,023,759
$25,618,694
$117,357,537
$134,915,087
$19,192,267
2007
Totals $322,887,121 $233,795,193 $271,464,891
Commercial Insurers
Captives
Self Insurers
$148,312,080
$131,640,684
$33,796,526
$123,188,803
$81,433,554
$30,424,981
$150,329,334
$172,354,695
$34,299,362
2008
Totals $313,749,290 $235,047,338 $356,983,391
Commercial Insurers
Captives
Self Insurers
$133,552,209
$170,661,416
$35,916,119
$106,600,335
$188,914,211
$20,446,873
$79,073,318
$186,343,097
$36,061,111
2009
Totals $340,129,744 $315,961,419 $301,477,526
Commercial Insurers
Captives
Self Insurers
$124,570,314
$185,896,655
$47,554,582
$76,150,750
$102,212,864
$15,978,104
$68,061,425
$147,535,382
$15,384,247
Totals $358,021,551 $194,341,718 $230,981,054
Friday, June 04, 2010 Report 12
Connecticut Medical Malpractice Annual Report – 2010
Appendix 3
Insurance Industry Financial Data
Profitability - Total Connecticut Medical Malpractice Market (Including Excess and Surplus Lines Companies)
Year
2001 2002 2003 2004 2005 2006 2007 2008 2009
Data from the Connecticut State Page of the Financial Annual Statement
Defense and Other Loss Ratio Adjustment Underwriting
Costs Expenses154%
14% 13%
120% 24% 9% 70% 15% 8% 57% 15% 8% 80% 20% 8% 67% 16% 8% 94% 15% 8% 37% 13% 9% 41% 11% 8%
Figures reported in the NAIC Profitability Report*
Profit on Underwriting Insurance Profit Transactions-99% -36% -70% -30% -4% 13% 10% 22% -22% 2% -6% 14% -32% -3% 28% 27% N/A N/A
Medical Malpractice Data from NAIC I-SITE P&C Summary by Line of Business
Total Connecticut Medical Malpractice Market (Including Excess and Surplus Lines Companies and Risk Retention Groups)
Defense & Cost Containment Commission
Premium Direct Losses Premium Direct Losses Expenses and Brokerage Year Written Paid Earned Incurred Incurred Dividends Expense Taxes and Fees 2001 $129,792,918 $138,799,513 $120,543,321 $185,544,402 16,775,442 $4,261,106 $8,119,990 $2,958,373 2002 $158,923,275 $132,707,944 $173,876,942 $209,323,420 42,218,183 $2,216,693 $9,906,005 $4,097,027 2003 $225,338,363 $146,144,629 $211,487,853 $147,817,730 32,149,585 $118,651 $12,065,957 $4,211,801 2004 $225,677,066 $121,984,350 $221,117,278 $125,938,599 32,199,115 $90,253 $12,206,430 $5,634,756 2005 $246,228,681 $159,021,753 $229,590,170 $184,177,257 45,409,315 $113,153 $13,173,602 $5,341,091 2006 $222,510,593 $158,896,289 $224,464,853 $150,796,675 36,634,700 $125,823 $12,424,585 $5,211,385 2007 $214,716,085 $132,509,436 $217,533,314 $205,503,250 31,810,332 $162,344 $12,176,027 $4,856,024 2008 $213,015,705 $160,376,736 $211,548,606 $77,779,627 27,348,583 $328,355 $13,496,213 $5,141,297 2009 $206,157,206 $115,546,502 $207,188,884 $84,839,952 $22,547,098 $128,361 $12,153,011 $5,067,269
National Association of Insurance Comissioners, Report on Profitability by Line by State, annual volumes from 2001 to 2008
Exhibit 1
Medical Malpractice
Data from NAIC I-SITE P&C Summary by Line of Business
Licensed Companies in Connecticut Medical Malpractice Market
Defense & Cost Containment Commission
Premium Direct Losses Premium Direct Losses Expenses and Brokerage Taxes and Year Written Paid Earned Incurred Incurred Dividends Expense Fees 2001 $102,203,863 $116,705,913 $96,074,631 $167,127,968 $14,133,321 $4,189,153 $7,496,316 $2,055,478 2002 $100,606,998 $114,478,127 $124,680,010 $170,591,337 $36,621,231 $2,154,157 $8,084,634 $2,693,448 2003 $145,811,076 $124,412,206 $133,801,254 $89,447,672 $25,358,115 $89,815 $9,662,682 $2,019,794 2004 $142,253,757 $95,141,353 $137,856,539 $62,876,139 $24,593,405 $90,253 $9,295,362 $3,316,909 2005 $155,003,949 $124,234,485 $139,755,089 $136,528,617 $29,998,072 $91,114 $9,517,858 $3,045,353 2006 $141,517,805 $110,579,655 $138,556,070 $82,579,837 $22,485,021 $116,678 $9,026,596 $2,988,358 2007 $136,304,980 $102,340,760 $138,626,587 $77,001,029 $18,711,509 $121,094 $8,783,019 $2,638,930 2008 $127,186,309 $91,508,513 $126,733,484 $58,231,375 $17,293,530 $273,483 $8,564,244 $2,634,577 2009 $118,636,760 $68,574,283 $119,417,586 $32,252,965 $11,523,245 $110,905 $8,944,414 $2,446,272
% of Earned Premium
Defense & Cost Containment Other
Direct Losses Direct Losses Expenses Underwriting Year Paid Incurred Incurred Expenses 2001 121% 174% 15% 14% 2002 92% 137% 29% 10% 2003 93% 67% 19% 9% 2004 69% 46% 18% 9% 2005 89% 98% 21% 9% 2006 80% 60% 16% 9% 2007 74% 56% 13% 8% 2008 72% 46% 14% 9% 2009 57% 27% 10% 10%
Exhibit 2
Medical Malpractice
Data from NAIC I-SITE Line Report of State Page Exhibit
Excess/Surplus Lines in Connecticut Medical Malpractice Market
Defense & Cost Containment Comssion and
Premium Premium Losses Expenses Brokerage Taxes and Year Written Losses Paid Earned Incurred Incurred Dividends Expense Fees 2001 $4,724,927 $1,531,715 $2,563,077 $2,685,845 $629,592 $0 $418,853 -$3,588 2002 $24,756,805 $758,377 $14,734,326 $5,944,449 $361,480 $0 $1,608,965 $13,103 2003 $26,472,803 $3,156,176 $25,296,200 $18,012,614 $321,855 $0 $2,213,466 $60,419 2004 $30,958,196 $685,253 $31,062,193 $20,583,862 $496,643 $0 $2,655,036 $192,741 2005 $31,552,309 $6,935,097 $30,192,820 $7,133,211 $1,076,737 $0 $2,923,656 $21,744 2006 $25,909,996 $10,136,295 $30,880,271 $9,802,776 $1,011,542 $0 $2,774,046 $31,738 2007 $24,669,595 $10,520,658 $25,024,091 $33,995,155 $1,056,897 $0 $3,050,999 $25,740 2008 $26,344,811 $9,527,851 $25,421,354 -$8,395,964 -$241,409 $0 $4,717,441 $65,346 2009 $24,558,850 $6,851,389 $24,772,184 -$193,689 $1,934,504 $0 $2,972,581 $56,217
% of Earned Premium Defense & Cost
Containment Other
Year 2001
Direct Losses Paid 60%
Direct Losses Incurred
105%
Expenses Incurred
25%
Underwriting Expenses
16% 2002 5% 40% 2% 11% 2003 12% 71% 1% 9% 2004 2% 66% 2% 9% 2005 23% 24% 4% 10% 2006 33% 32% 3% 9% 2007 42% 136% 4% 12% 2008 37% -33% -1% 19% 2009 28% -1% 8% 12%
Exhibit 3
% of Earned Premium
Defense & Cost Containment Other
Direct Losses Direct Losses Expenses Underwriting Year Paid Incurred Incurred Expenses 2001 97% 86% 13% 5% 2002 53% 97% 14% 5% 2003 33% 79% 8% 4% 2004 50% 81% 10% 5% 2005 47% 70% 22% 5% 2006 71% 108% 22% 5% 2007 37% 178% 12% 5% 2008 100% 47% 17% 5% 2009 64% 79% 14% 4%
Medical Malpractice
Data from NAIC I-SITE P&C Summary by Line of Business
Risk Retention Groups in Connecticut Medical Malpractice Market
Defense & Cost Containment Commission
Premium Direct Losses Premium Direct Losses Expenses and Brokerage Taxes and Year Written Paid Earned Incurred Incurred Dividends Expense Fees 2001 $22,054,908 $20,490,885 $21,018,780 $18,117,976 $2,796,751 $4,262 $178,167 $895,916 2002 $32,709,583 $17,253,190 $32,482,502 $31,441,935 $4,672,888 $1,956 $180,778 $1,353,652 2003 $52,099,965 $16,796,247 $51,589,852 $40,776,538 $4,003,049 $0 $192,793 $2,109,115 2004 $52,465,113 $26,157,744 $52,196,636 $42,503,573 $4,969,287 $0 $256,032 $2,125,106 2005 $58,474,126 $27,827,171 $58,658,635 $40,879,290 $12,905,635 $22,039 $433,616 $2,273,994 2006 $53,925,316 $38,178,304 $53,823,549 $58,301,534 $11,932,387 $9,145 $439,875 $2,144,990 2007 $52,888,440 $19,583,863 $52,897,231 $93,982,654 $6,314,655 $41,250 $210,929 $2,157,003 2008 $59,484,585 $59,340,372 $59,393,768 $27,944,216 $10,296,462 $54,872 $214,528 $2,441,374 2009 $62,961,596 $40,120,830 $62,999,114 $49,780,676 $9,089,349 $17,456 $236,016 $2,564,780
Exhibit 4
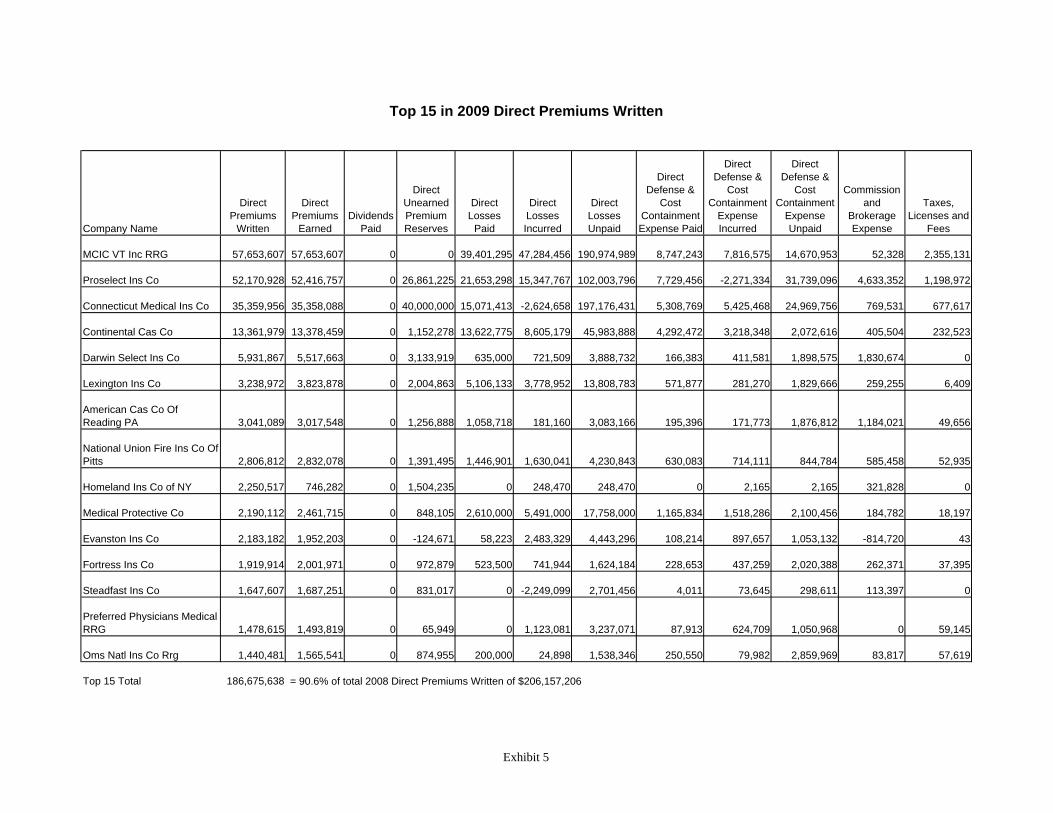
Top 15 in 2009 Direct Premiums Written
Company Name
Direct Premiums
Written
Direct Premiums
Earned Dividends
Paid
Direct Unearned Premium Reserves
Direct Losses
Paid
Direct Losses Incurred
Direct Losses Unpaid
Direct Defense &
Cost Containment Expense Paid
Direct Defense &
Cost Containment
Expense Incurred
Direct Defense &
Cost Containment
Expense Unpaid
Commission and
Brokerage Expense
Taxes, Licenses and
Fees
MCIC VT Inc RRG 57,653,607 57,653,607 0 0 39,401,295 47,284,456 190,974,989 8,747,243 7,816,575 14,670,953 52,328 2,355,131
Proselect Ins Co 52,170,928 52,416,757 0 26,861,225 21,653,298 15,347,767 102,003,796 7,729,456 -2,271,334 31,739,096 4,633,352 1,198,972
Connecticut Medical Ins Co 35,359,956 35,358,088 0 40,000,000 15,071,413 -2,624,658 197,176,431 5,308,769 5,425,468 24,969,756 769,531 677,617
Continental Cas Co 13,361,979 13,378,459 0 1,152,278 13,622,775 8,605,179 45,983,888 4,292,472 3,218,348 2,072,616 405,504 232,523
Darwin Select Ins Co 5,931,867 5,517,663 0 3,133,919 635,000 721,509 3,888,732 166,383 411,581 1,898,575 1,830,674 0
Lexington Ins Co 3,238,972 3,823,878 0 2,004,863 5,106,133 3,778,952 13,808,783 571,877 281,270 1,829,666 259,255 6,409
American Cas Co Of Reading PA 3,041,089 3,017,548 0 1,256,888 1,058,718 181,160 3,083,166 195,396 171,773 1,876,812 1,184,021 49,656
National Union Fire Ins Co Of Pitts 2,806,812 2,832,078 0 1,391,495 1,446,901 1,630,041 4,230,843 630,083 714,111 844,784 585,458 52,935
Homeland Ins Co of NY 2,250,517 746,282 0 1,504,235 0 248,470 248,470 0 2,165 2,165 321,828 0
Medical Protective Co 2,190,112 2,461,715 0 848,105 2,610,000 5,491,000 17,758,000 1,165,834 1,518,286 2,100,456 184,782 18,197
Evanston Ins Co 2,183,182 1,952,203 0 -124,671 58,223 2,483,329 4,443,296 108,214 897,657 1,053,132 -814,720 43
Fortress Ins Co 1,919,914 2,001,971 0 972,879 523,500 741,944 1,624,184 228,653 437,259 2,020,388 262,371 37,395
Steadfast Ins Co 1,647,607 1,687,251 0 831,017 0 -2,249,099 2,701,456 4,011 73,645 298,611 113,397 0
Preferred Physicians Medical RRG 1,478,615 1,493,819 0 65,949 0 1,123,081 3,237,071 87,913 624,709 1,050,968 0 59,145
Oms Natl Ins Co Rrg 1,440,481 1,565,541 0 874,955 200,000 24,898 1,538,346 250,550 79,982 2,859,969 83,817 57,619
Top 15 Total 186,675,638 = 90.6% of total 2008 Direct Premiums Written of $206,157,206
Exhibit 5
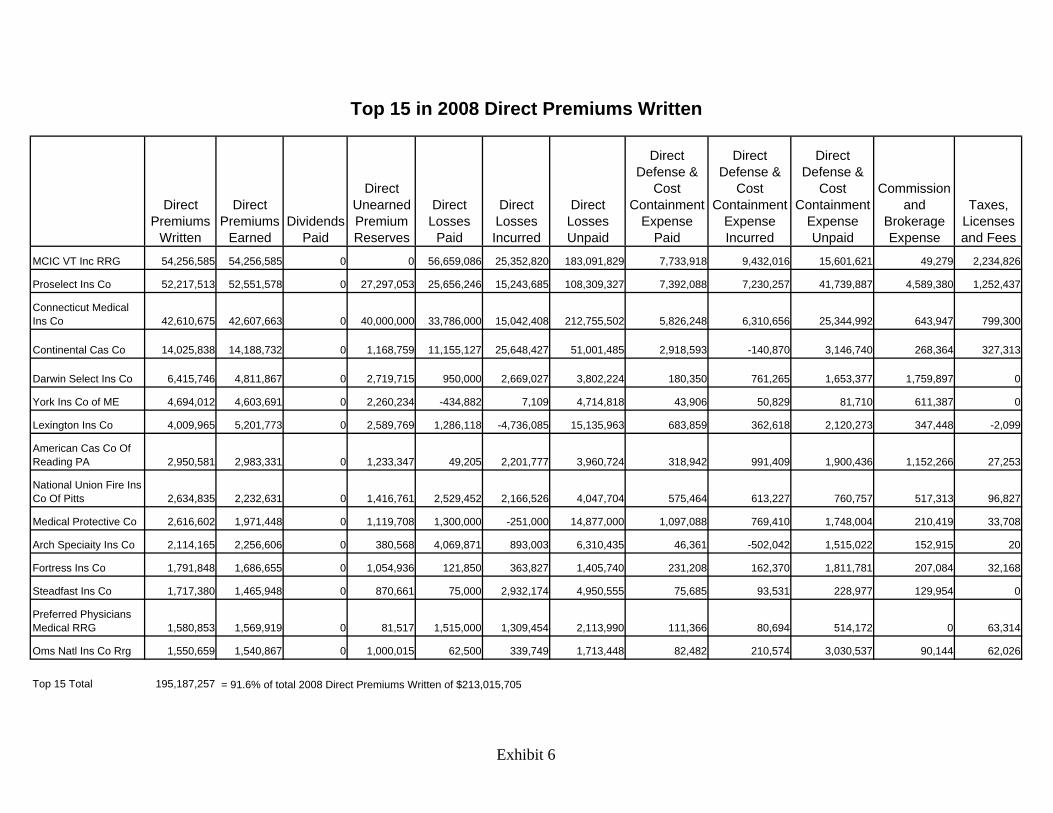
Top 15 in 2008 Direct Premiums Written
Direct Premiums
Written
Direct Premiums
Earned Dividends
Paid
Direct Unearned Premium Reserves
Direct Losses
Paid
Direct Losses Incurred
Direct Losses Unpaid
Direct Defense &
Cost Containment
Expense Paid
Direct Defense &
Cost Containment
Expense Incurred
Direct Defense &
Cost Containment
Expense Unpaid
Commission and
Brokerage Expense
Taxes, Licenses and Fees
MCIC VT Inc RRG 54,256,585 54,256,585 0 0 56,659,086 25,352,820 183,091,829 7,733,918 9,432,016 15,601,621 49,279 2,234,826
Proselect Ins Co 52,217,513 52,551,578 0 27,297,053 25,656,246 15,243,685 108,309,327 7,392,088 7,230,257 41,739,887 4,589,380 1,252,437
Connecticut Medical Ins Co 42,610,675 42,607,663 0 40,000,000 33,786,000 15,042,408 212,755,502 5,826,248 6,310,656 25,344,992 643,947 799,300
Continental Cas Co 14,025,838 14,188,732 0 1,168,759 11,155,127 25,648,427 51,001,485 2,918,593 -140,870 3,146,740 268,364 327,313
Darwin Select Ins Co 6,415,746 4,811,867 0 2,719,715 950,000 2,669,027 3,802,224 180,350 761,265 1,653,377 1,759,897 0
York Ins Co of ME 4,694,012 4,603,691 0 2,260,234 -434,882 7,109 4,714,818 43,906 50,829 81,710 611,387 0
Lexington Ins Co 4,009,965 5,201,773 0 2,589,769 1,286,118 -4,736,085 15,135,963 683,859 362,618 2,120,273 347,448 -2,099
American Cas Co Of Reading PA 2,950,581 2,983,331 0 1,233,347 49,205 2,201,777 3,960,724 318,942 991,409 1,900,436 1,152,266 27,253
National Union Fire Ins Co Of Pitts 2,634,835 2,232,631 0 1,416,761 2,529,452 2,166,526 4,047,704 575,464 613,227 760,757 517,313 96,827
Medical Protective Co 2,616,602 1,971,448 0 1,119,708 1,300,000 -251,000 14,877,000 1,097,088 769,410 1,748,004 210,419 33,708
Arch Speciaity Ins Co 2,114,165 2,256,606 0 380,568 4,069,871 893,003 6,310,435 46,361 -502,042 1,515,022 152,915 20
Fortress Ins Co 1,791,848 1,686,655 0 1,054,936 121,850 363,827 1,405,740 231,208 162,370 1,811,781 207,084 32,168
Steadfast Ins Co 1,717,380 1,465,948 0 870,661 75,000 2,932,174 4,950,555 75,685 93,531 228,977 129,954 0
Preferred Physicians Medical RRG 1,580,853 1,569,919 0 81,517 1,515,000 1,309,454 2,113,990 111,366 80,694 514,172 0 63,314
Oms Natl Ins Co Rrg 1,550,659 1,540,867 0 1,000,015 62,500 339,749 1,713,448 82,482 210,574 3,030,537 90,144 62,026
Top 15 Total 195,187,257 = 91.6% of total 2008 Direct Premiums Written of $213,015,705
Exhibit 6
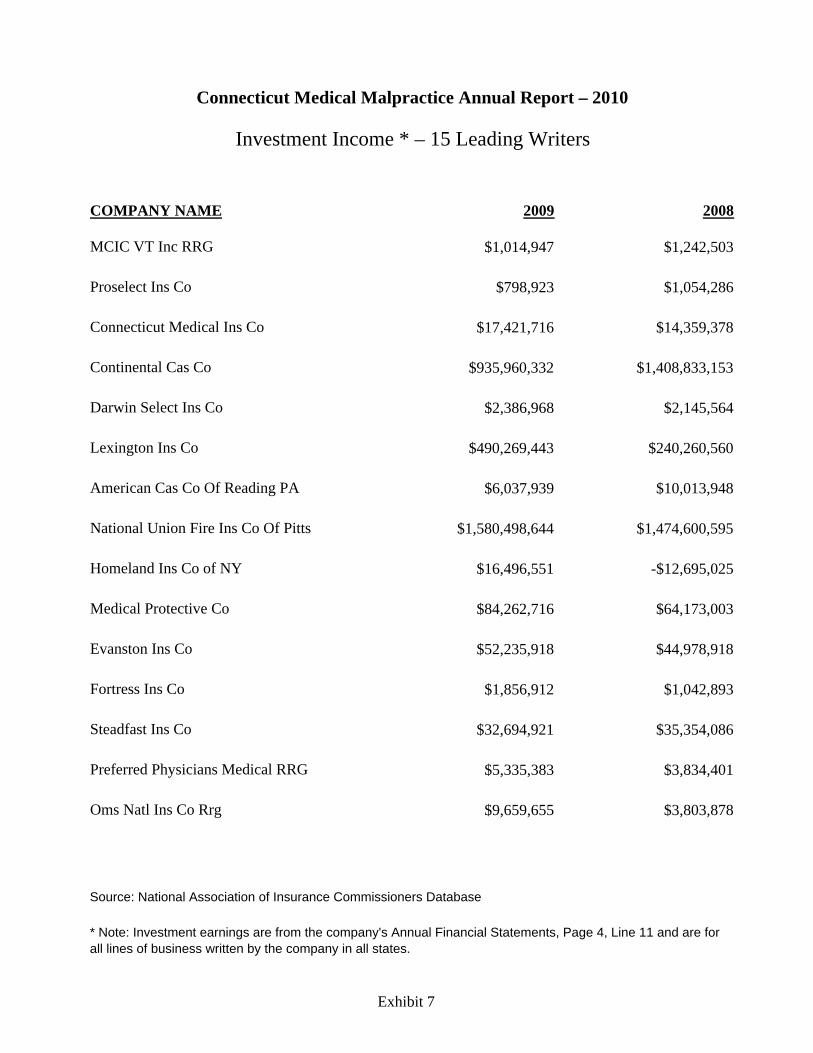
Connecticut Medical Malpractice Annual Report – 2010
Investment Income * – 15 Leading Writers
COMPANY NAME 2009 2008
MCIC VT Inc RRG $1,014,947 $1,242,503
Proselect Ins Co $798,923 $1,054,286
Connecticut Medical Ins Co $17,421,716 $14,359,378
Continental Cas Co $935,960,332 $1,408,833,153
Darwin Select Ins Co $2,386,968 $2,145,564
Lexington Ins Co $490,269,443 $240,260,560
American Cas Co Of Reading PA $6,037,939 $10,013,948
National Union Fire Ins Co Of Pitts $1,580,498,644 $1,474,600,595
Homeland Ins Co of NY $16,496,551 -$12,695,025
Medical Protective Co $84,262,716 $64,173,003
Evanston Ins Co $52,235,918 $44,978,918
Fortress Ins Co $1,856,912 $1,042,893
Steadfast Ins Co $32,694,921 $35,354,086
Preferred Physicians Medical RRG $5,335,383 $3,834,401
Oms Natl Ins Co Rrg $9,659,655 $3,803,878
Source: National Association of Insurance Commissioners Database
* Note: Investment earnings are from the company's Annual Financial Statements, Page 4, Line 11 and are for all lines of business written by the company in all states.
Exhibit 7
Connecticut Medical Malpractice Annual Report – 2010
Appendix 4
Medical Malpractice Data Reporting Requirements Connecticut General Statute § 38a-395
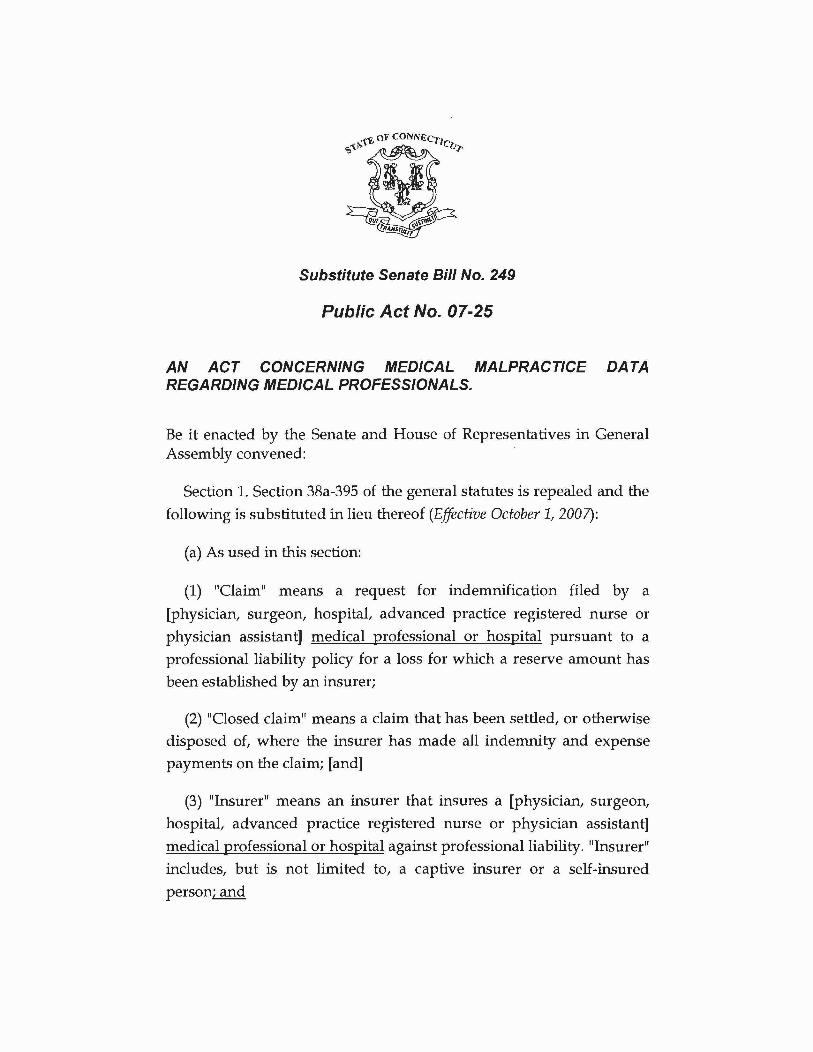
Substitute Senate Bill No. 249
Public Act No. 07-25
AN ACT CONCERNING MEDICAL MALPRACTICE DATA REGARDING MEDICAL PROFESSIONALS.
Be it enacted by the Senate and House of Representatives in General Assembly convened:
Section 1. Section 38a-395 of the general statutes is repealed and the
following is substituted in lieu thereof (Effective October 1,2007):
(a) As used in this section:
(1) "Claim" means a request for indemnification filed by a
[physician, surgeon, hospital- advanced practice registered nurse or
physician assistant] medical professional or hospital pursuant to a
professional liability policy for a loss for which a reserve amount has
been established by an insurer;
(2) "Closed claim" means a claim that has been settled, or otherwise
disposed of- where the insurer has made all indemnity and expense
payments on the claim; [and]
(3) "Insurer" means an insurer that insures a [physician, surgeon,
hospital, advanced practice registered nurse or physician assistant]
medical professional or hospital against professional liability. "Insurer"
includes, but is not limited to, a captive insurer or a self-insured
person; and
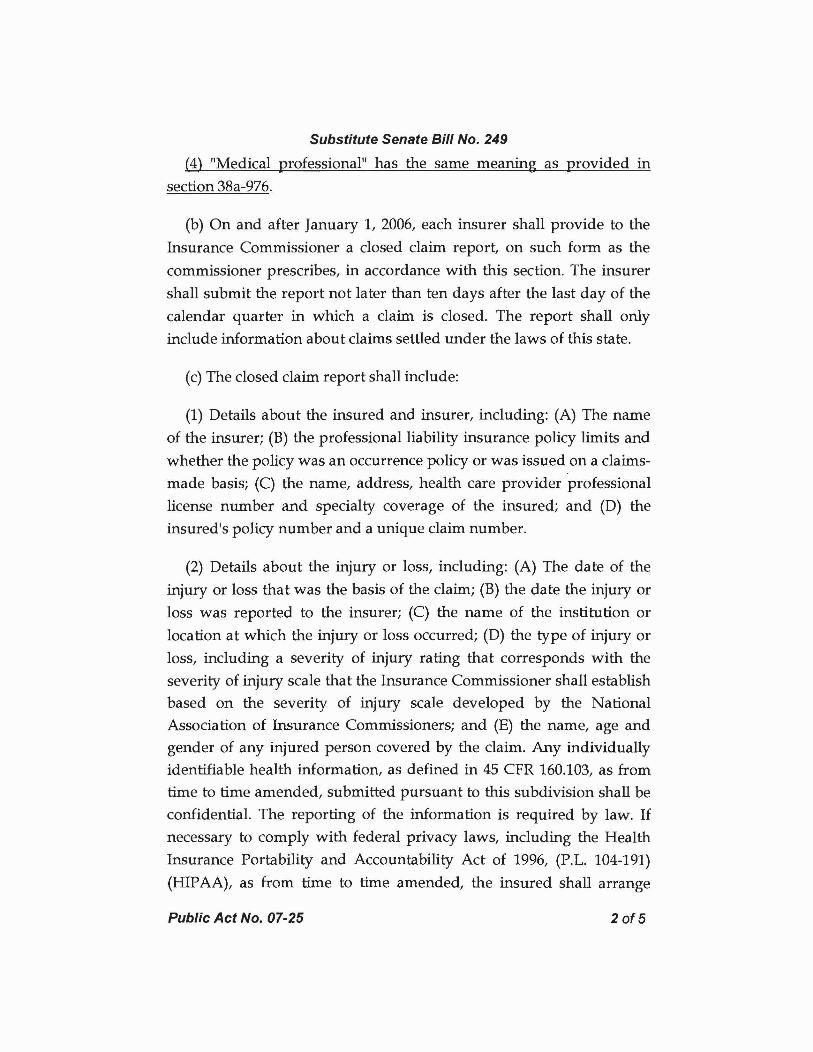
Substitute Senate Bill No. 249
(4) "Medical professional" has the same meaning as provided in
section 38a-976.
(b) On and after January 1, 2006, each insurer shall provide to the
Insurance Commissioner a closed claim report, on such form as the
commissioner prescribes, in accordance with this section. The insurer
shall submit the report not later than ten days after the last day of the
calendar quarter in which a claim is closed. The report shall only
include information about claims settled under the laws of this state.
(c) The closed claim report shall include:
(1) Details about the insured and insurer, including: (A) The name
of the insurer; (B) the professional liability insurance policy limits and
whether the policy was an occurrence policy or was issued on a claims
made basis; (C) the name, address, health care provider professional
license number and specialty coverage of the insured; and (D) the
insured's policy number and a unique claim number.
(2) Details about the injury or loss, including: (A) The date of the
injury or loss that was the basis of the claim; (B) the date the injury or
loss was reported to the insurer; (C) the name of the institution or
loca tion at which the injury or loss occurred; (D) the type of injury or
loss, including a severity of injury rating that corresponds with the
severity of injury scale that the Insurance Commissioner shall establish
based on the severity of injury scale developed by the National
Association of Insurance Commissioners; and (E) the name, age and
gender of any injured person covered by the claim. Any individually
identifiable health information, as defined in 45 CFR 160.103, as from
time to time amended, submitted pursuant to this subdivision shall be
confidential. The reporting of the information is required by law. If
necessary to comply with federal privacy laws, including the Health
Insurance Portability and Accountability Act of 1996, (P.L. 104-191)
(HIPAA), as from time to time amended, the insured shall arrange
Public Act No. 07-25 20'5
Substitute Senate Bill No. 249
with the insurer to release the required information.
(3) Details about the claims process, including: (A) Whether a
lawsuit was filed and, if so, in which court; (B) the outcome of such
lawsuit; (C) the number of other defendants, if any; (D) the stage in the
process when the claim was closed; (E) the dates of the trial, if any; (F)
the date of the judgment or settlement, if any; (G) whether an appeal
was filed and, if so, the date filed; (H) the resolution of any appeal and
the date such appeal was decided; (1) the date the claim was closed; 0)
the initial indemnity and expense reserve for the claim; and (K) the
final indemnity and expense reserve for the claim.
(4) Details about the amount paid on the claim, including: (A) The
total amount of the initial judgment rendered by a jury or awarded by
the court; (B) the total amount of the settlement if there was no
judgment rendered or awarded; (C) the total amount of the settlement
if the claim was settled after judgment was rendered or awarded; (D)
the amount of economic damages, as defined in section 52-572h, or the
insurer's estimate of the amount in the event of a settlement; (E) the
amount of noneconomic damages, as defined in section 52-572h, or the
insurer's estimate of the amount in the event of a settlement; (F) the
amount of any interest awarded due to the failure to accept an offer of
judgment or compromise; (G) the amount of any remittitur or additur;
(H) the amount of final judgment after remittitur or additur; (1) the
amount paid by the insurer; 0) the amount paid by the defendant due
to a deductible or a judgment or settlement in excess of policy limits;
(K) the amount paid by other insurers; (L) the amount paid by other
defendants; (M) whether a structured settlement was used; (N) the
expense assigned to and recorded with the claim, including, but not
limited to, defense and investigation costs, but not including the actual
claim payment; and (0) any other information the commissioner
determines to be necessary to regulate the professional liability
insurance industry with respect to [physicians, surgeons, hospitals,
Public Act No. 07-25 30'5
Substitute Senate Bill No. 249
advanced practice registered nurses or physician assistants] medical
professionals or hospitals, ensure the indUStry's solvency and ensure
that such liability insurance is available and affordable.
(d) (1) The commissioner shall establish an electronic database
composed of closed claim reports filed pursuant to this section.
(2) The commissioner shall compile the data included in individual
closed claim reports into an aggregated summary format and shall
prepare a written annual report of the summary data. The report shall
provide an analysis of closed claim information including a minimum
of five years of comparative data, when available, trends in frequency
and severity of claims, itemization of damages, timeliness of the claims
process, and any other descriptive or analytical information that would
assist in interpreting the trends in closed claims.
(3) The annual report shall include a summary of rate filings for
professional liability insurance for [physicians, surgeons, hospitals,
advanced practice registered nurses and physician assistants] medical
professionals or hospitals, which have been approved by the
department for the prior calendar year, including an analysis of the
trend of direct losses, incurred losses, earned premiums and
investment income as compared to prior years. The report shall
include base premiums charged by insurers for each specialty and the
number of providers insured by specialty for each insurer.
(4) Not later than March 15, 2007, and annually thereafter, the
commissioner shall submit the annual report to the joint standing
committee of the General Assembly having cognizance of matters
relating to insurance in accordance with section 11-4a. The
commissioner shall also (A) make the report available to the public, (B)
post the report on its Internet site, and (C) provide public access to the
contents of the electronic database after the commissioner establishes
that the names and other individually identifiable information about
Public Act No. 07-25 40f5
Substitute Senate Bill No. 249
the claimant and practitioner have been removed.
(e) The Insurance Commissioner shall provide the Commissioner of
Public Health with electronic access to all information received
pursuant to this section. The Commissioner of Public Health shall
maintain the confidentiality of such information in the same manner
and to the same extent as required for the Insurance Commissioner.
Approved May 18, 2007
Public Act No. 07-25 50'5
Connecticut Medical Malpractice Annual Report – 2010
Appendix 5
Medical Malpractice Closed Claim Data Collection Application Users Guide

Connecticut Medical Malpractice Annual Report – 2010
Appendix 5
Medical Malpractice Closed Claim Data Collection Application Users Guide
Medical Malpractice Online Reporting Tool Instruction To be able to have access to the Connecticut Insurance Department Medical Malpractice On-line Reporting tool, you will need to request your User ID; it will take the department 24 to 48 hours to grant access to your User ID. The user is the person who is responsible for submitting data to the department. Each user can select what type of information they are responsible to submit, such as “Yearly Information”, “Closed Claims Information” or both. In order to protect the uniqueness of the data submitted from user(s), we limit the company to have only one user for each role only. One user can be responsible to submit both, yearly data and quarterly closed claims data. The user(s) options are for example: 1. User A responsible for Yearly data, user B responsible for quarterly closed claims; or 2. User A responsible for yearly and quarterly closed claims data. In other words, you may either have one user responsible for both yearly and closed claim information, or you may have two users; one responsible for yearly information, and the other responsible for closed claim information. You may not have two users report the same type of information. Note: In the Company Request screen, do not use the Captive Tax ID for the Tax ID box but use your company Tax ID instead. Click here to start: https://www.cid-online.ct.gov/mmdc/Login_input.action To Bookmark this page:
1. Right mouse click on this page 2. Select “Add to Favorite” for Window Internet Explorer, or select “Bookmark This Page” if you are
using Firefox web browser.
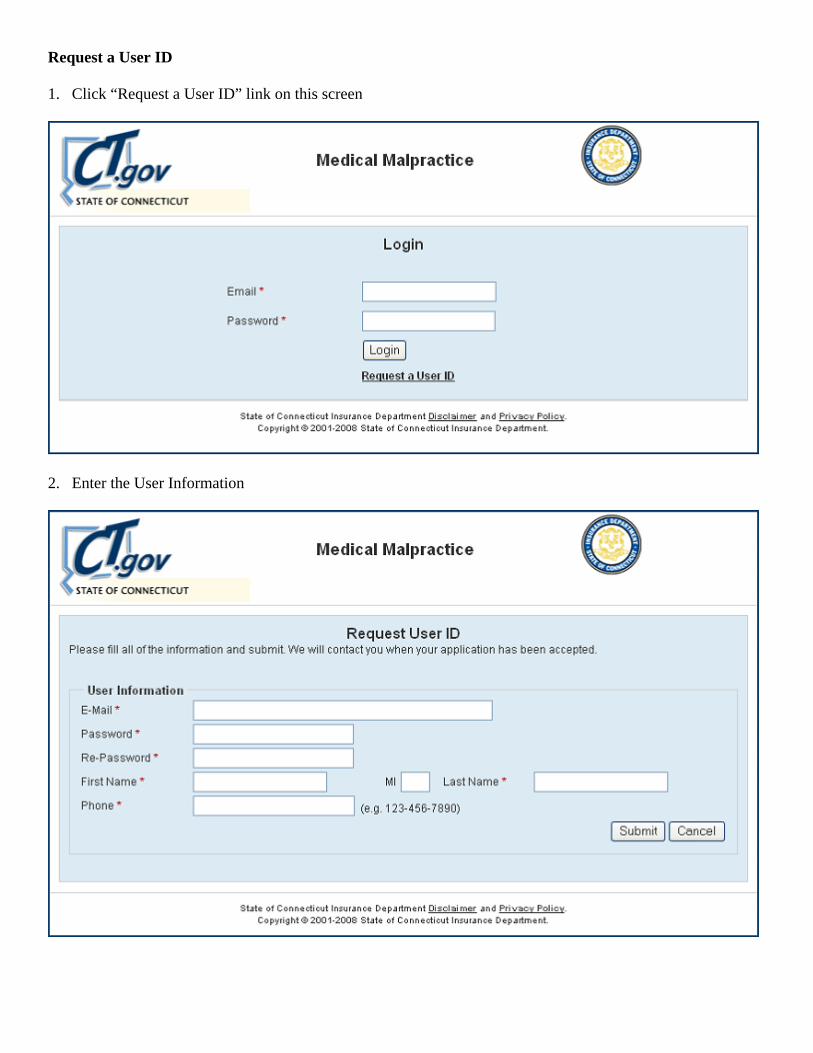
Request a User ID 1. Click “Request a User ID” link on this screen
2. Enter the User Information
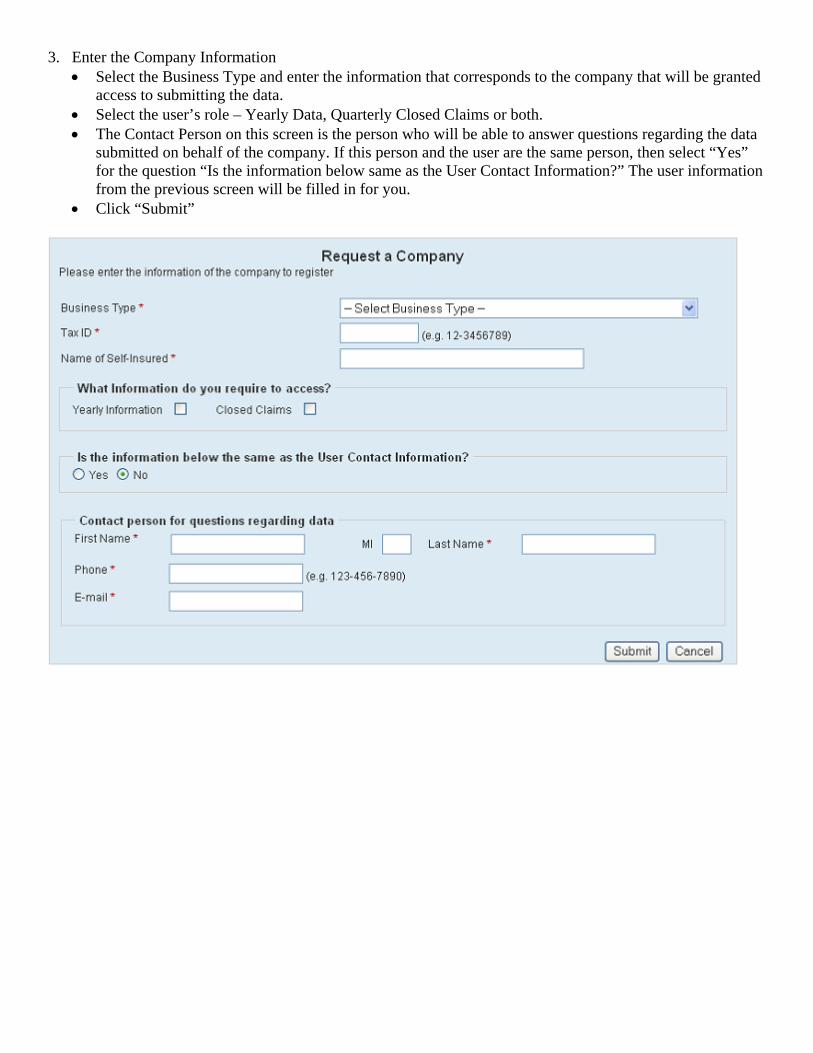
3. Enter the Company Information • Select the Business Type and enter the information that corresponds to the company that will be granted
access to submitting the data. • Select the user’s role – Yearly Data, Quarterly Closed Claims or both. • The Contact Person on this screen is the person who will be able to answer questions regarding the data
submitted on behalf of the company. If this person and the user are the same person, then select “Yes” for the question “Is the information below same as the User Contact Information?” The user information from the previous screen will be filled in for you.
• Click “Submit”
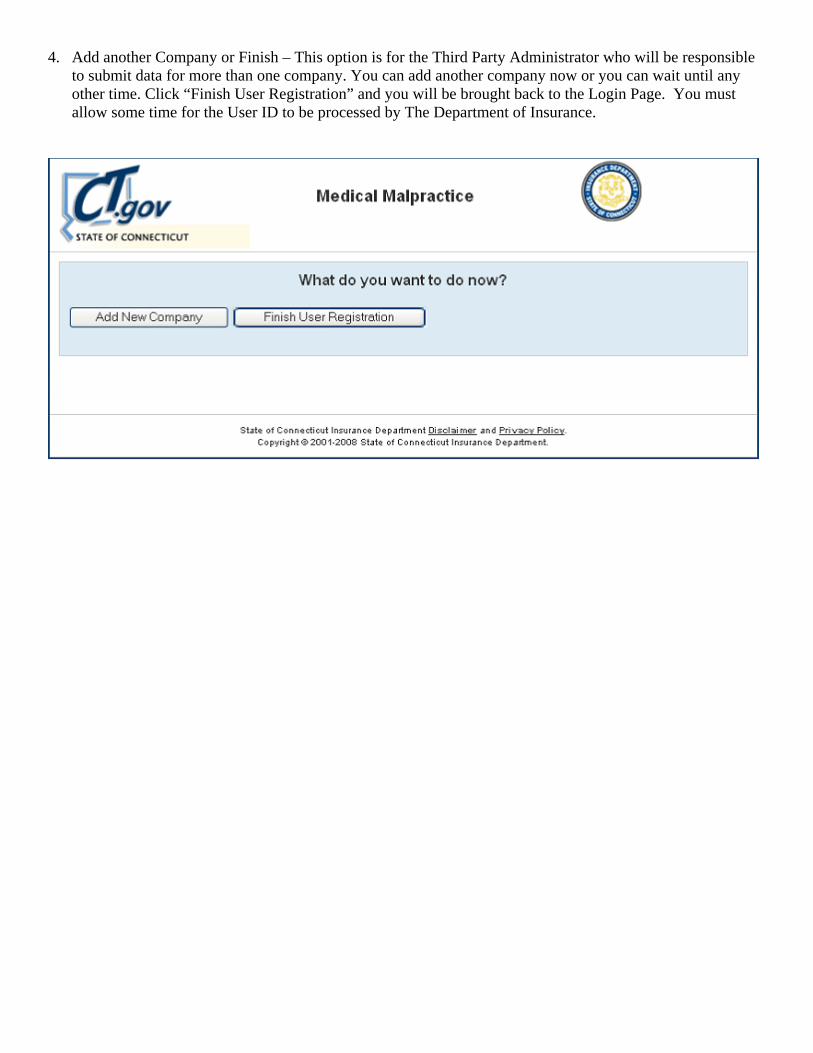
4. Add another Company or Finish – This option is for the Third Party Administrator who will be responsible to submit data for more than one company. You can add another company now or you can wait until any other time. Click “Finish User Registration” and you will be brought back to the Login Page. You must allow some time for the User ID to be processed by The Department of Insurance.
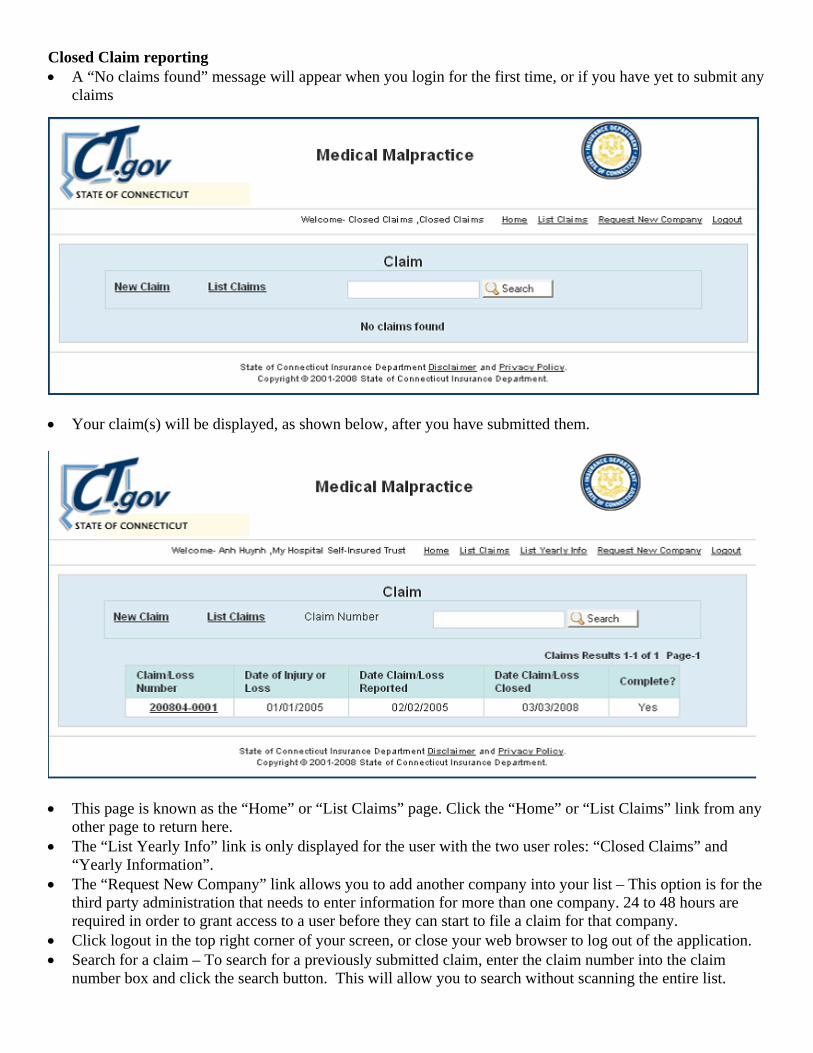
Closed Claim reporting • A “No claims found” message will appear when you login for the first time, or if you have yet to submit any
claims
• Your claim(s) will be displayed, as shown below, after you have submitted them.
• This page is known as the “Home” or “List Claims” page. Click the “Home” or “List Claims” link from any
link is only displayed for the user with the two user roles: “Closed Claims” and
he ours are
on.
h without scanning the entire list.
other page to return here. • The “List Yearly Info”
“Yearly Information”. • The “Request New Company” link allows you to add another company into your list – This option is for t
third party administration that needs to enter information for more than one company. 24 to 48 hrequired in order to grant access to a user before they can start to file a claim for that company.
• Click logout in the top right corner of your screen, or close your web browser to log out of the applicati• Search for a claim – To search for a previously submitted claim, enter the claim number into the claim
number box and click the search button. This will allow you to searc
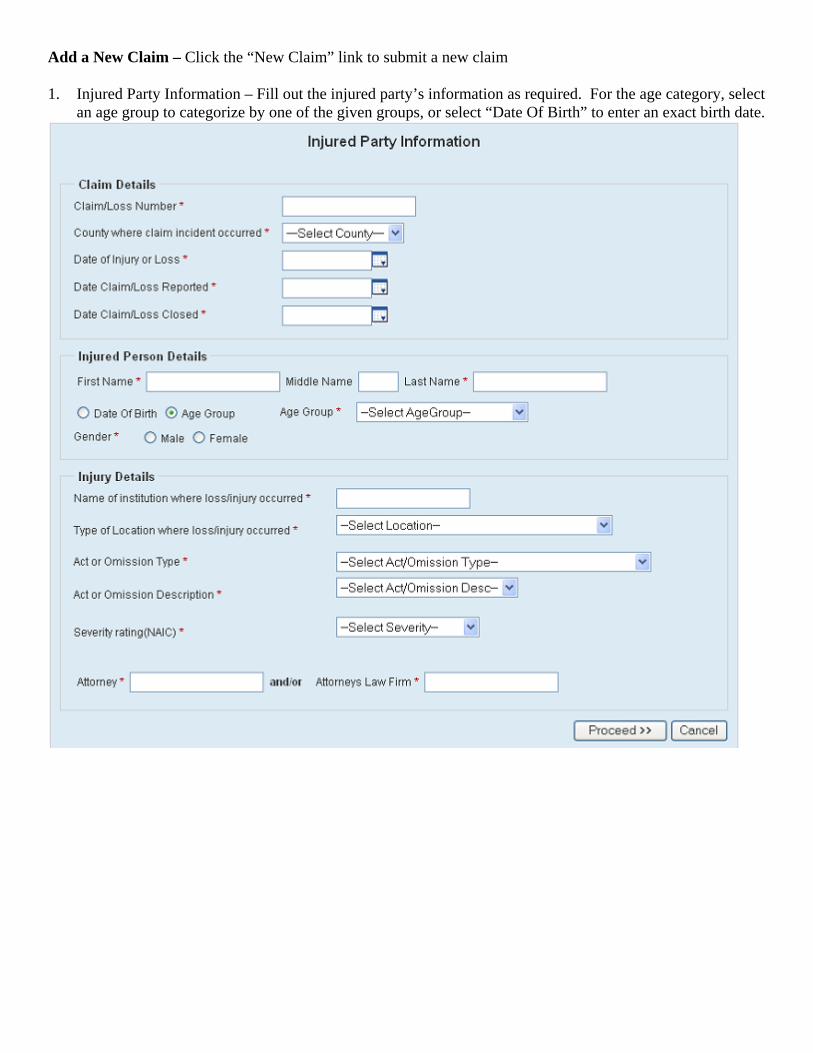
Add a New Claim – Click the “New Claim” link to submit a new claim 1. Injured Party Information – Fill out the injured party’s information as required. For the age category, sele
an age group to categorize by one of the given groups, or select “Date Of Birth” to enter an exact birth date. ct
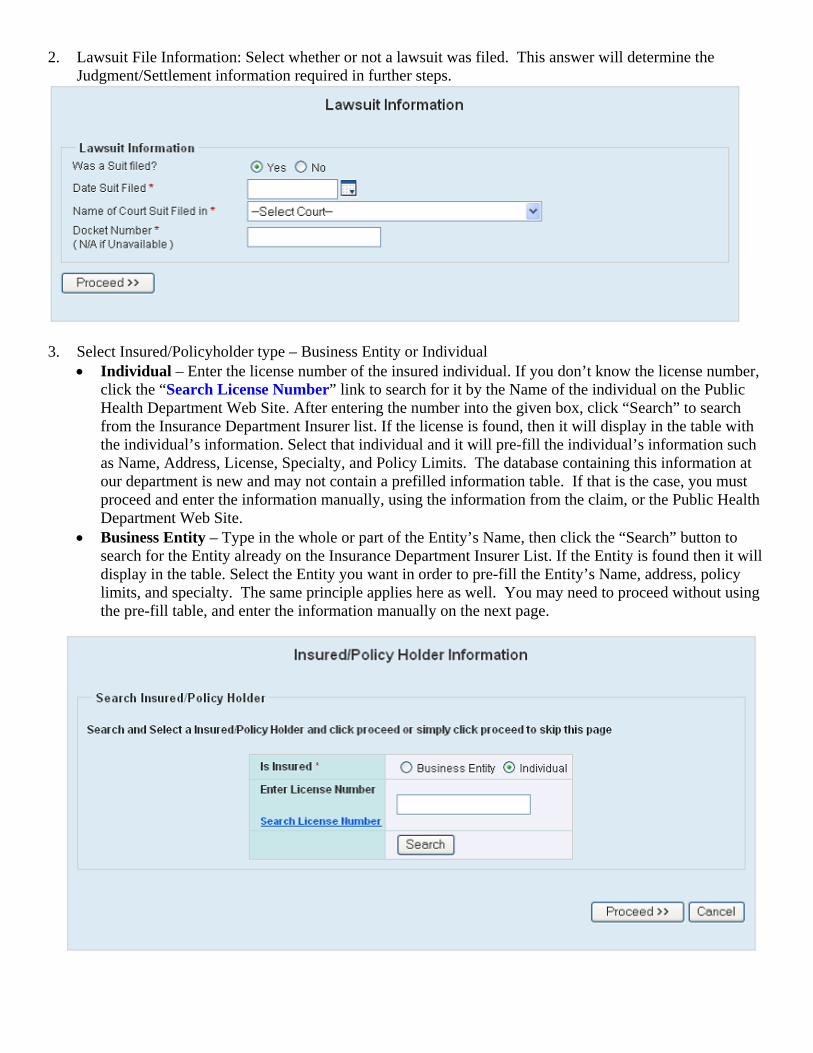
2. Lawsuit File Information: Select whether or not a lawsuit was filed. This answer will determine the Judgment/Settlement information required in further steps.
3. Select Insured/Policyholder type – Business Entity or Individual
• Individual – Enter the license number of the insured individual. If you don’t know the license number, click the “Search License Number” link to search for it by the Name of the individual on the Public Health Department Web Site. After entering the number into the given box, click “Search” to search from the Insurance Department Insurer list. If the license is found, then it will display in the table with the individual’s information. Select that individual and it will pre-fill the individual’s information such as Name, Address, License, Specialty, and Policy Limits. The database containing this information at our department is new and may not contain a prefilled information table. If that is the case, you must proceed and enter the information manually, using the information from the claim, or the Public Health Department Web Site.
• Business Entity – Type in the whole or part of the Entity’s Name, then click the “Search” button to search for the Entity already on the Insurance Department Insurer List. If the Entity is found then it will display in the table. Select the Entity you want in order to pre-fill the Entity’s Name, address, policy limits, and specialty. The same principle applies here as well. You may need to proceed without using the pre-fill table, and enter the information manually on the next page.
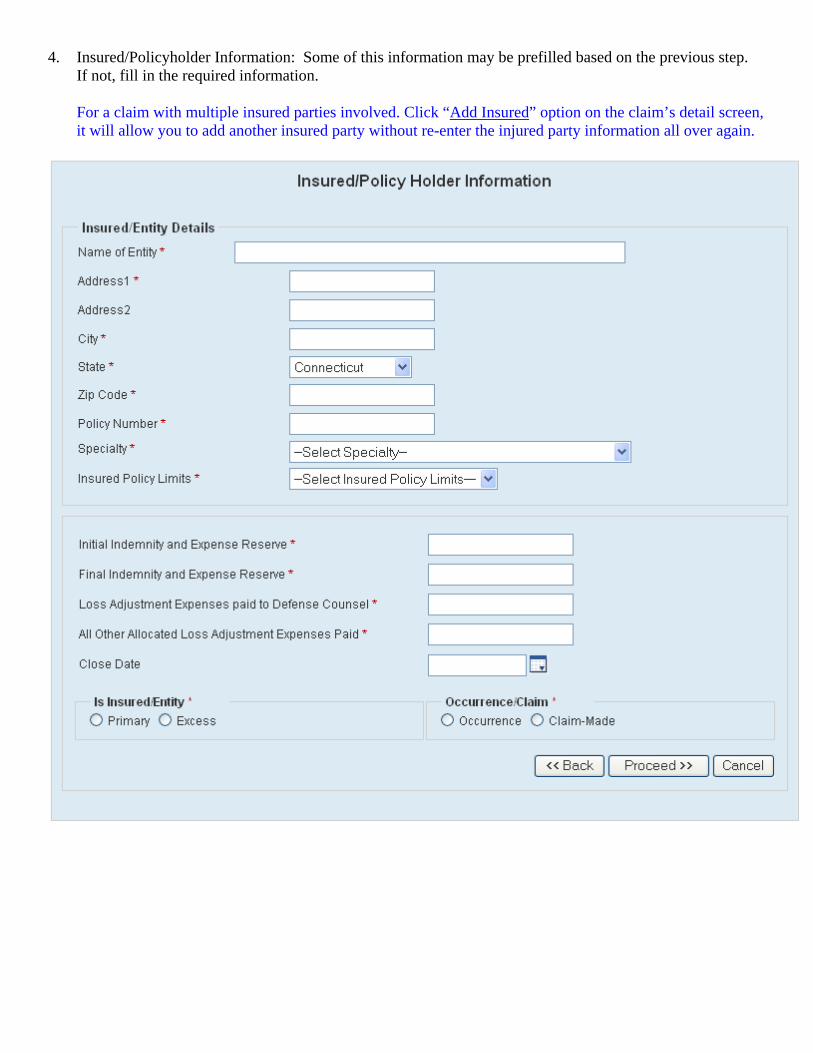
4. Insured/Policyholder Information: Some of this information may be prefilled based on the previous step. If not, fill in the required information. For a claim with multiple insured parties involved. Click “Add Insured” option on the claim’s detail screen, it will allow you to add another insured party without re-enter the injured party information all over again.
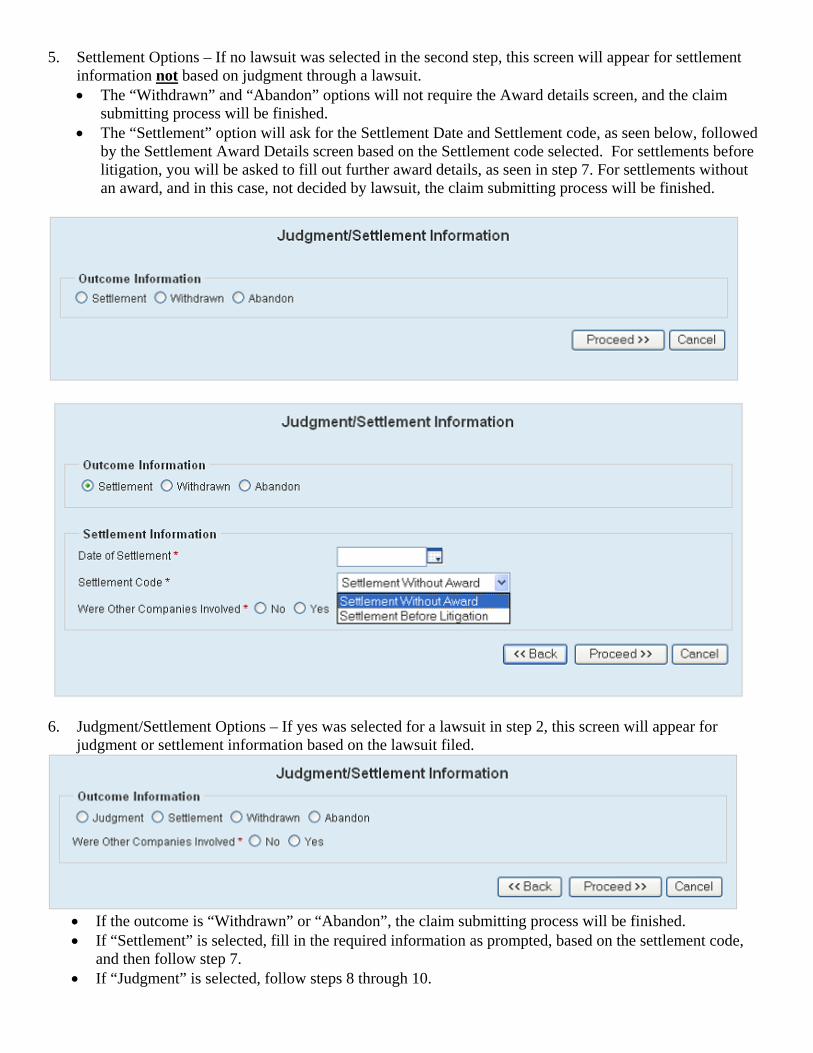
5. Settlement Options – If no lawsuit was selected in the second step, this screen will appear for settlement information not based on judgment through a lawsuit. • The “Withdrawn” and “Abandon” options will not require the Award details screen, and the claim
submitting process will be finished. • The “Settlement” option will ask for the Settlement Date and Settlement code, as seen below, followed
by the Settlement Award Details screen based on the Settlement code selected. For settlements before litigation, you will be asked to fill out further award details, as seen in step 7. For settlements without an award, and in this case, not decided by lawsuit, the claim submitting process will be finished.
6. Judgment/Settlement Options – If yes was selected for a lawsuit in step 2, this screen will appear for
judgment or settlement information based on the lawsuit filed.
• If the outcome is “Withdrawn” or “Abandon”, the claim submitting process will be finished. • If “Settlement” is selected, fill in the required information as prompted, based on the settlement code,
ow steps 8 through 10. and then follow step 7.
• If “Judgment” is selected, foll
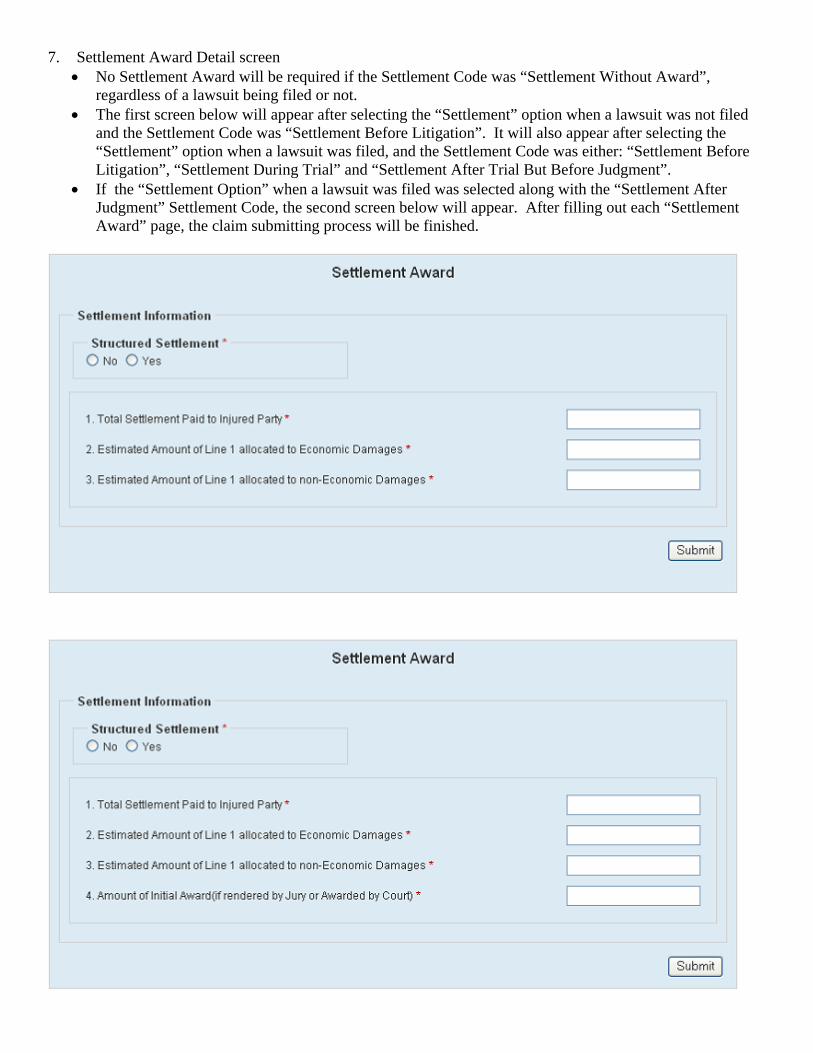
7. Settlement Award Detail screen • No Settlement Award will be required if the Settlement Code was “Settlement Without Award”,
regardless of a lawsuit being filed or not. • The first screen below will appear after selecting the “Settlement” option when a lawsuit was not filed
and the Settlement Code was “Settlement Before Litigation”. It will also appear after selecting the “Settlement” option when a lawsuit was filed, and the Settlement Code was either: “Settlement Before Litigation”, “Settlement During Trial” and “Settlement After Trial But Before Judgment”.
• If the “Settlement Option” when a lawsuit was filed was selected along with the “Settlement After Judgment” Settlement Code, the second screen below will appear. After filling out each “Settlement Award” page, the claim submitting process will be finished.
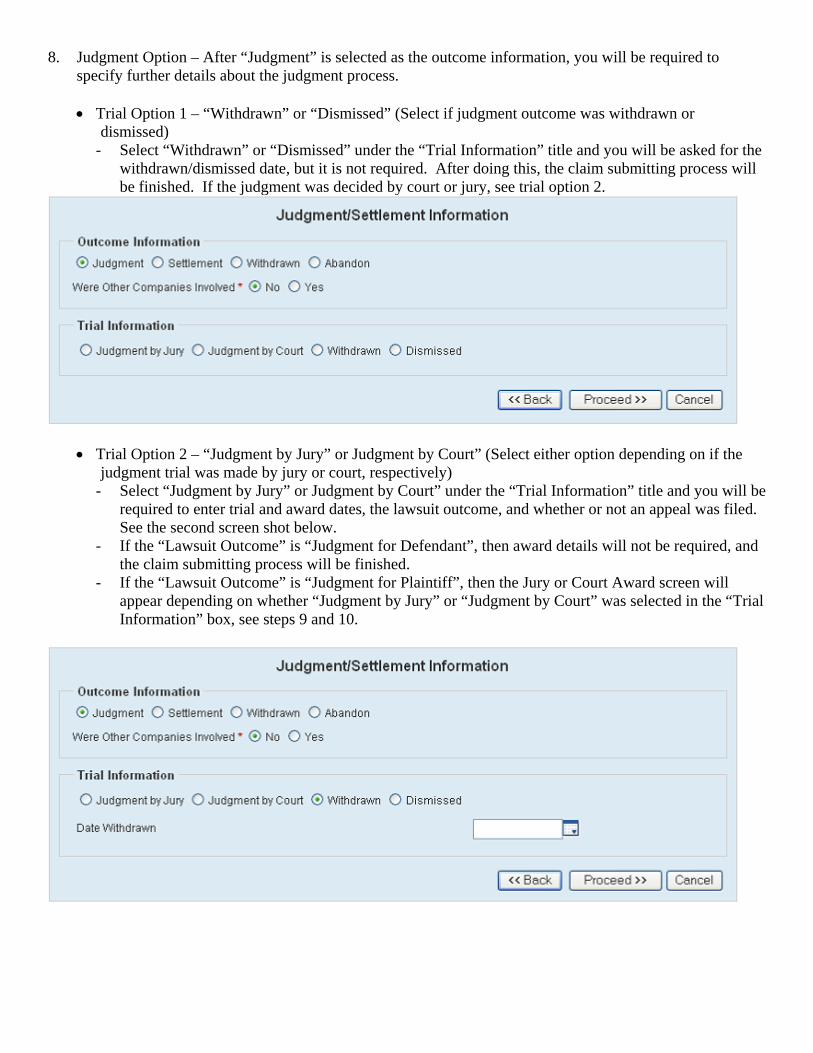
8. Judgment Option – After “Judgment” is selected as the outcome information, you will be required to specify further details about the judgment process.
• Trial Option 1 – “Withdrawn” or “Dismissed” (Select if judgment outcome was withdrawn or
dismissed) - Select “Withdrawn” or “Dismissed” under the “Trial Information” title and you will be asked for the
withdrawn/dismissed date, but it is not required. After doing this, the claim submitting process will be finished. If the judgment was decided by court or jury, see trial option 2.
• Trial Option 2 – “Judgment by Jury” or Judgment by Court” (Select either option depending on if the judgment trial was made by jury or court, respectively)
- Select “Judgment by Jury” or Judgment by Court” under the “Trial Information” title and you will be required to enter trial and award dates, the lawsuit outcome, and whether or not an appeal was filed. See the second screen shot below.
- If the “Lawsuit Outcome” is “Judgment for Defendant”, then award details will not be required, and the claim submitting process will be finished.
- If the “Lawsuit Outcome” is “Judgment for Plaintiff”, then the Jury or Court Award screen will appear depending on whether “Judgment by Jury” or “Judgment by Court” was selected in the “Trial Information” box, see steps 9 and 10.
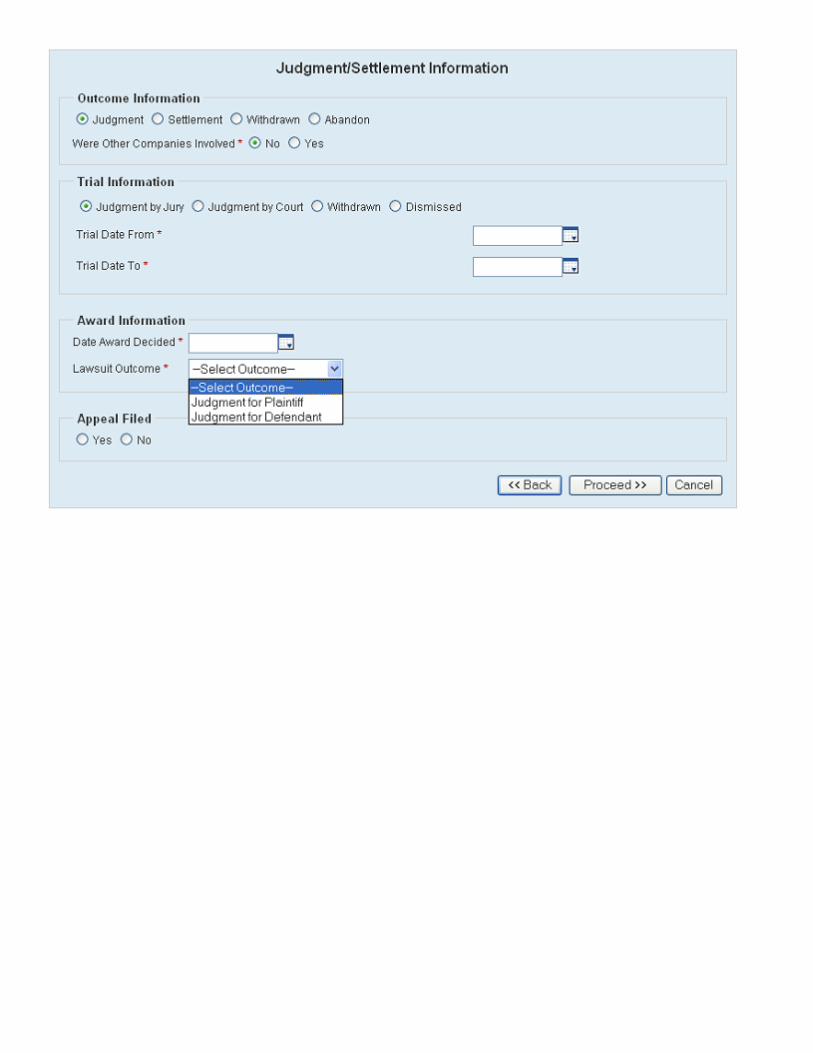
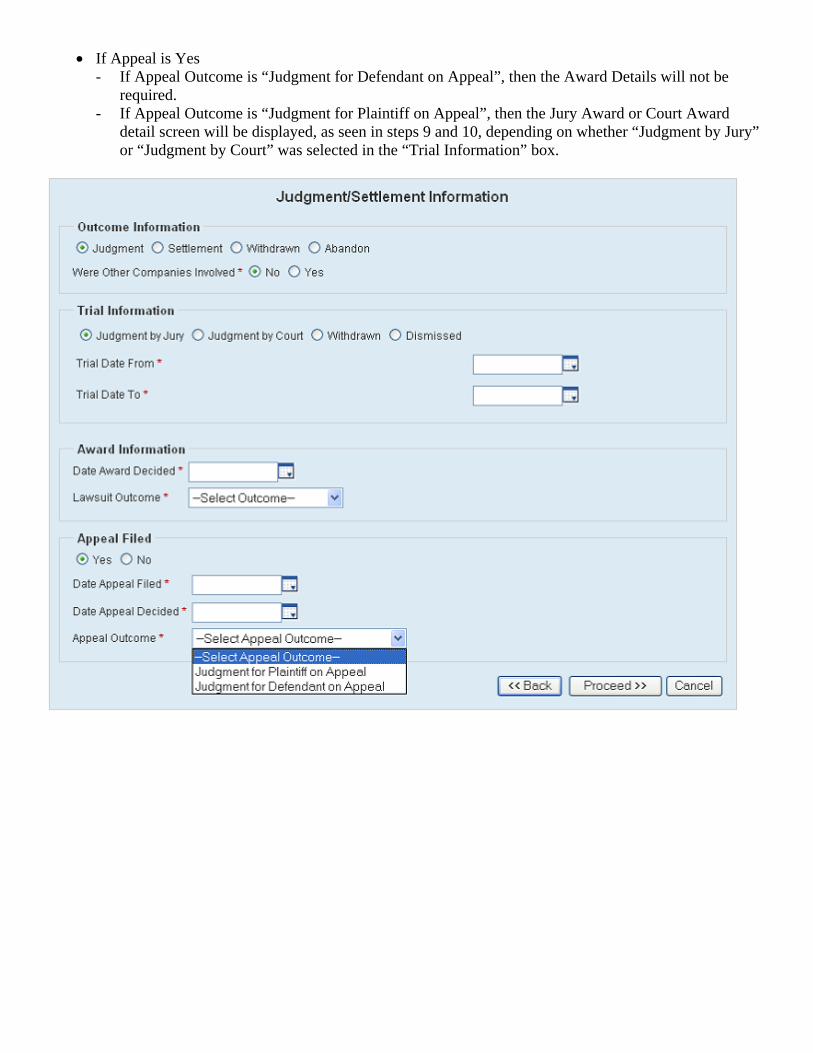
• If Appeal is Yes - If Appeal Outcome is “Judgment for Defendant on Appeal”, then the Award Details will not be
required. - If Appeal Outcome is “Judgment for Plaintiff on Appeal”, then the Jury Award or Court Award
detail screen will be displayed, as seen in steps 9 and 10, depending on whether “Judgment by Jury” or “Judgment by Court” was selected in the “Trial Information” box.
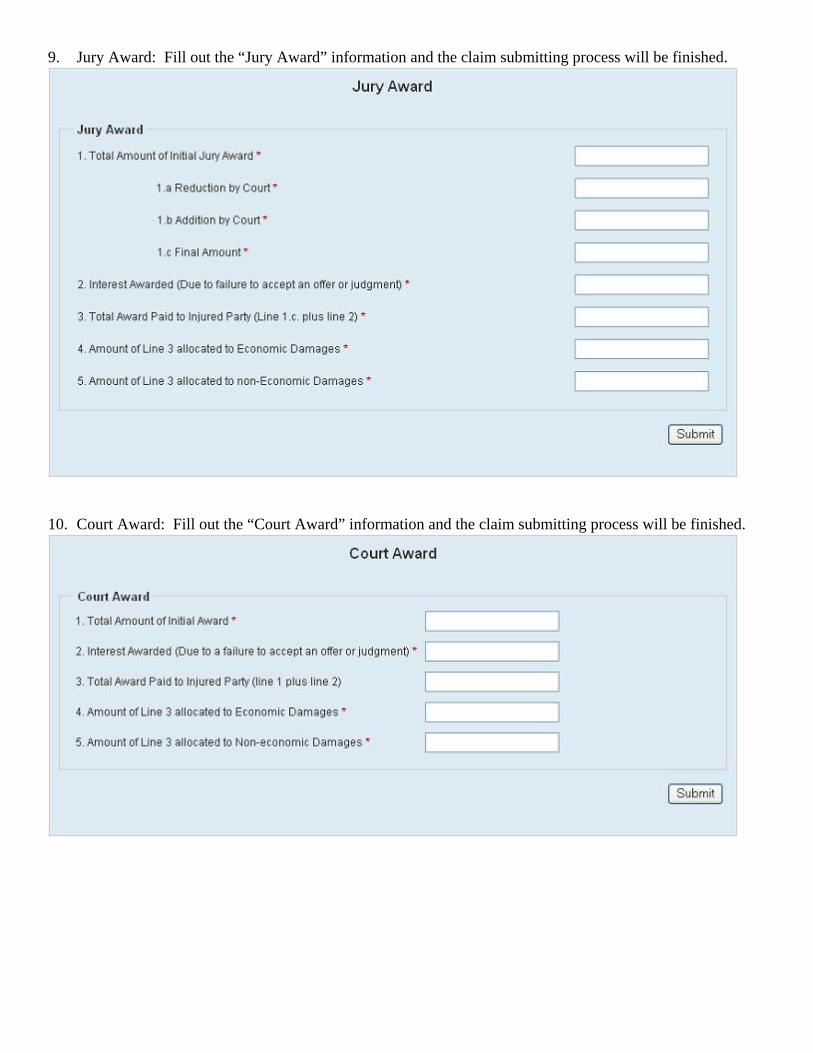
9. Jury Award: Fill out the “Jury Award” information and the claim submitting process will be finished.
10. Court Award: Fill out the “Court Award” information and the claim submitting process will be finished.
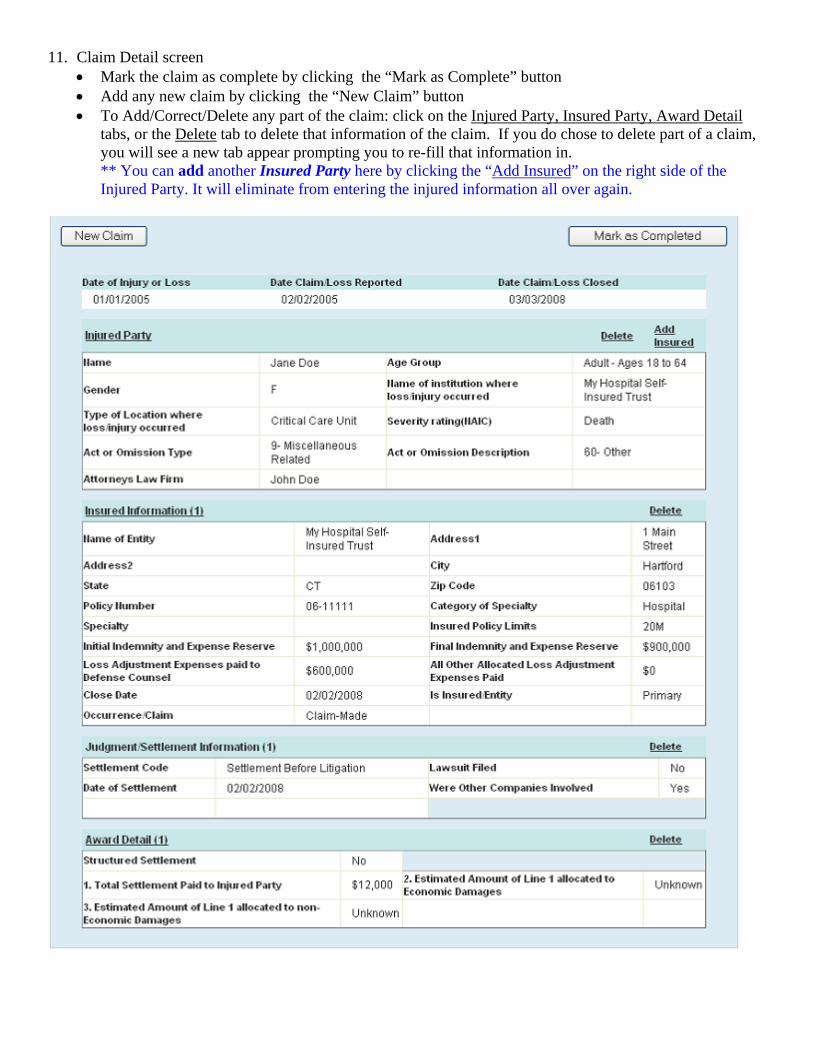
11. Claim Detail screen • Mark the claim as complete by clicking the “Mark as Complete” button • Add any new claim by clicking the “New Claim” button • To Add/Correct/Delete any part of the claim: click on the Injured Party, Insured Party, Award Detail
tabs, or the Delete tab to delete that information of the claim. If you do chose to delete part of a claim, you will see a new tab appear prompting you to re-fill that information in. ** You can add another Insured Party here by clicking the “Add Insured” on the right side of the Injured Party. It will eliminate from entering the injured information all over again.
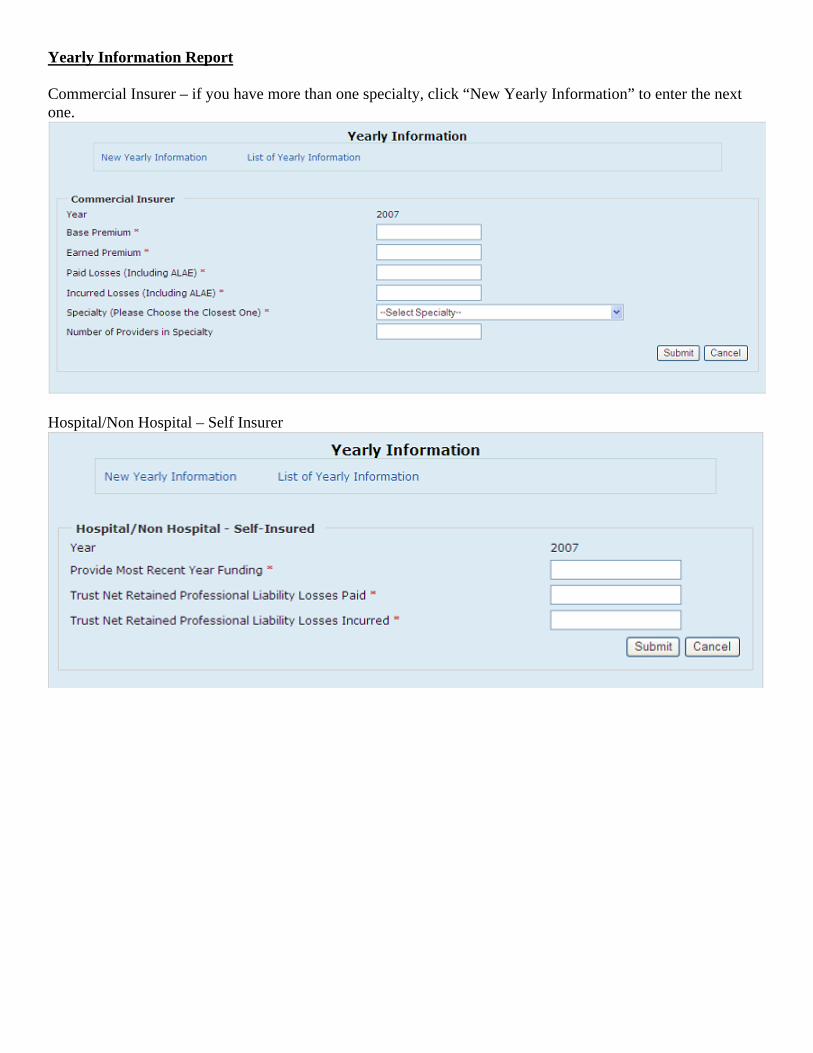
Yearly Information Report Commercial Insurer – if you have more than one specialty, click “New Yearly Information” to enter the next one.
Hospital/Non Hospital – Self Insurer
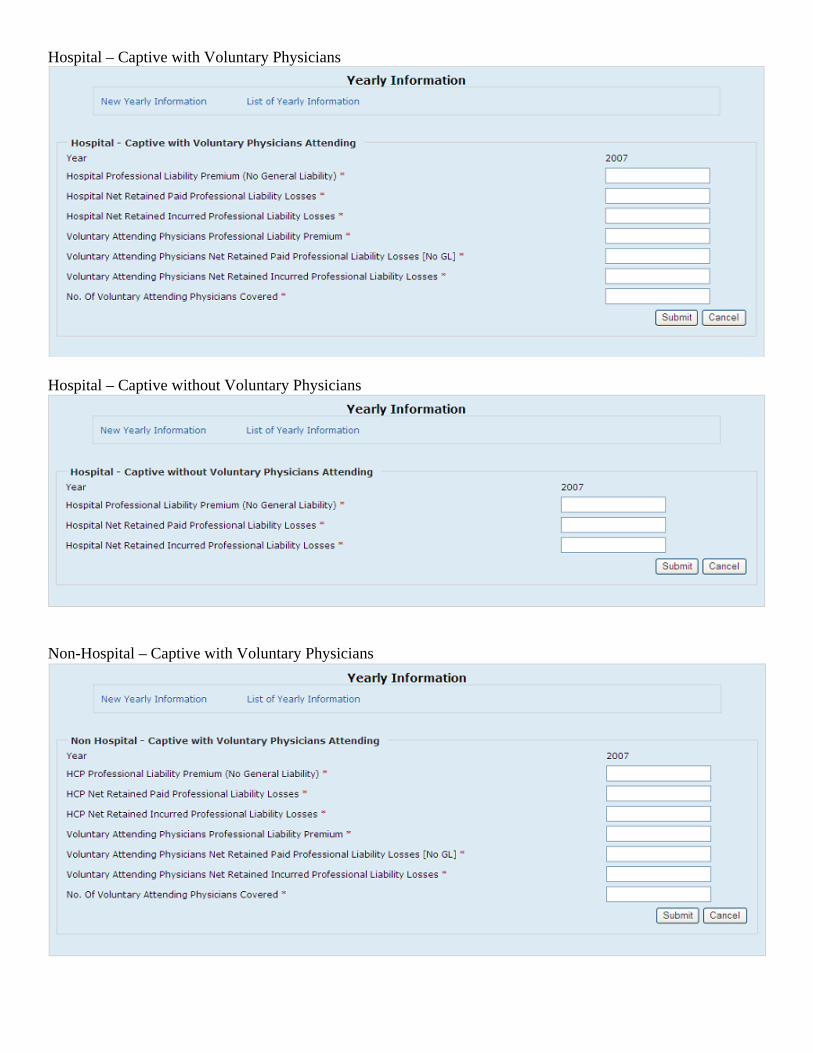
Hospital – Captive with Voluntary Physicians
Hospital – Captive without Voluntary Physicians
Non-Hospital – Captive with Voluntary Physicians
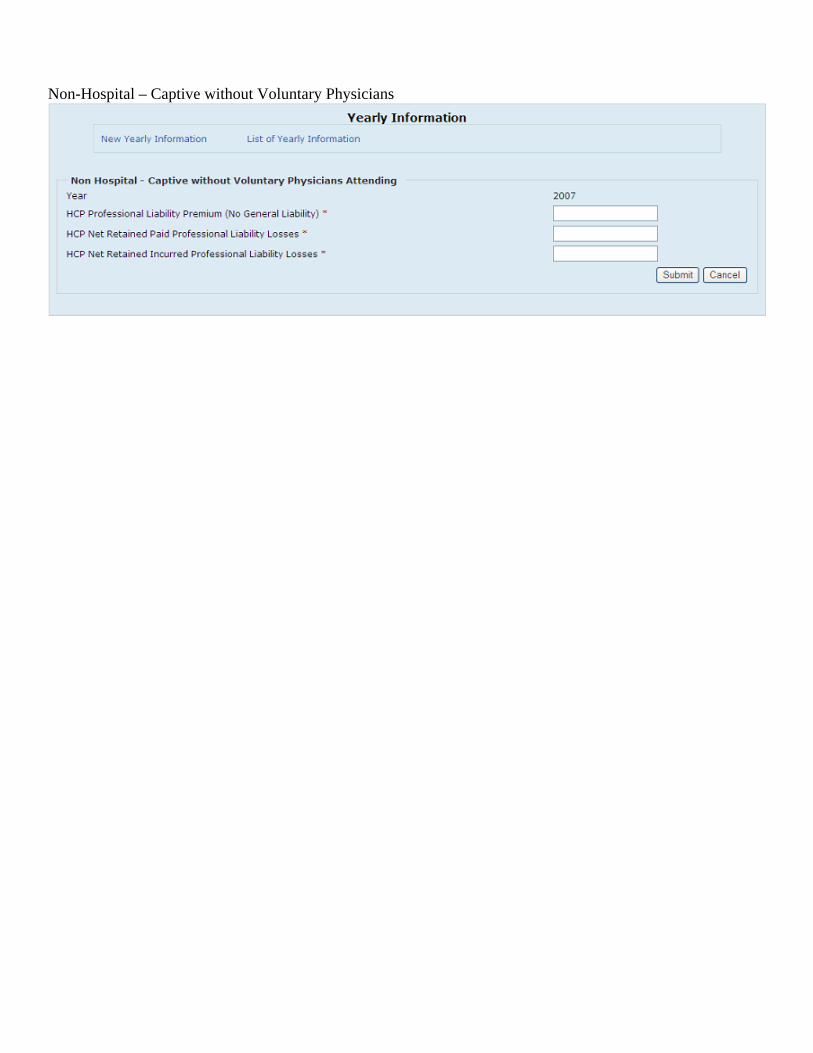
Non-Hospital – Captive without Voluntary Physicians