Embed Size (px)
Citation preview
Medical Statistics:Users’ Manual
Arash Etemadi, MD PhD
Department of Epidemiology and Biostatistics,School of Public Health, Tehran University of
Medical Sciences
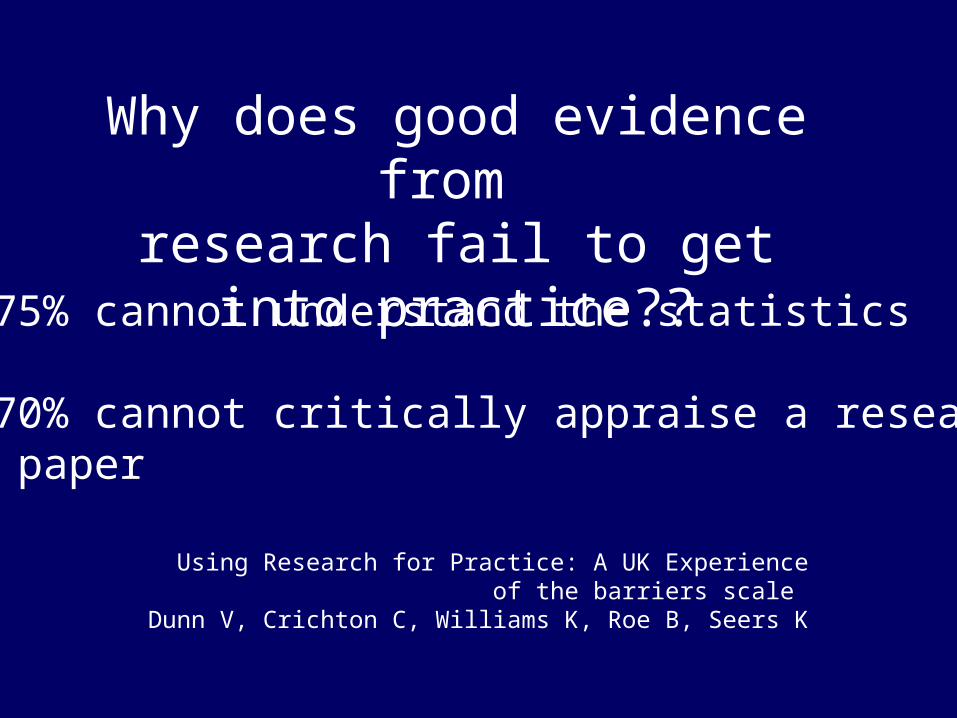
Why does good evidence from research fail to get into
practice??- 75% cannot understand the statistics
- 70% cannot critically appraise a research paper
Using Research for Practice: A UK Experience of the barriers scale Dunn V, Crichton C, Williams K, Roe B, Seers K


Do we have to build the car we drive?
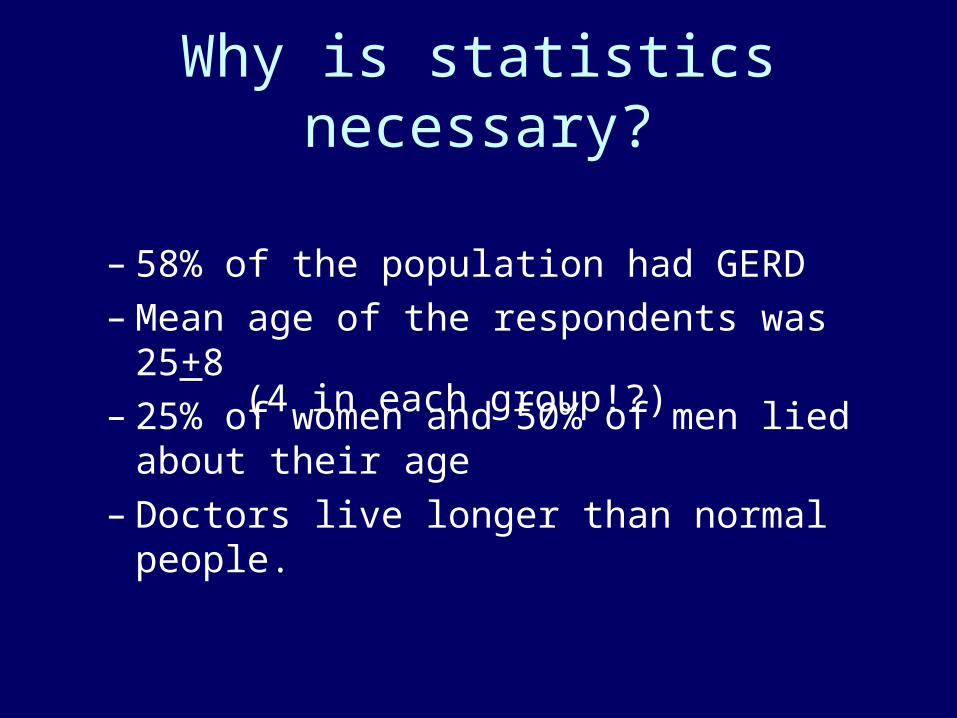
Why is statistics necessary?
– 58% of the population had GERD– Mean age of the respondents was 25+8– 25% of women and 50% of men lied about
their age– Doctors live longer than normal people.
(4 in each group!?)
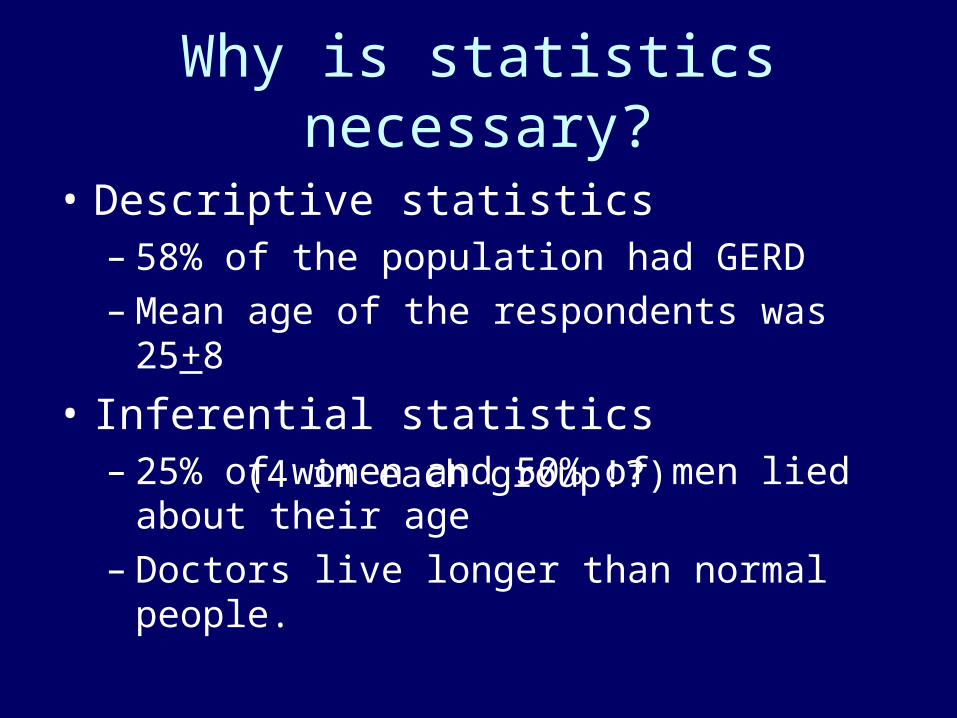
Why is statistics necessary?
• Descriptive statistics– 58% of the population had GERD– Mean age of the respondents was 25+8
• Inferential statistics– 25% of women and 50% of men lied about
their age– Doctors live longer than normal people.
(4 in each group!?)
Descriptive statistics
• Point estimates: Mean, median, mode, relative frequency
• Distribution: Standard deviation
Inferential statistics: exploring associations and differences
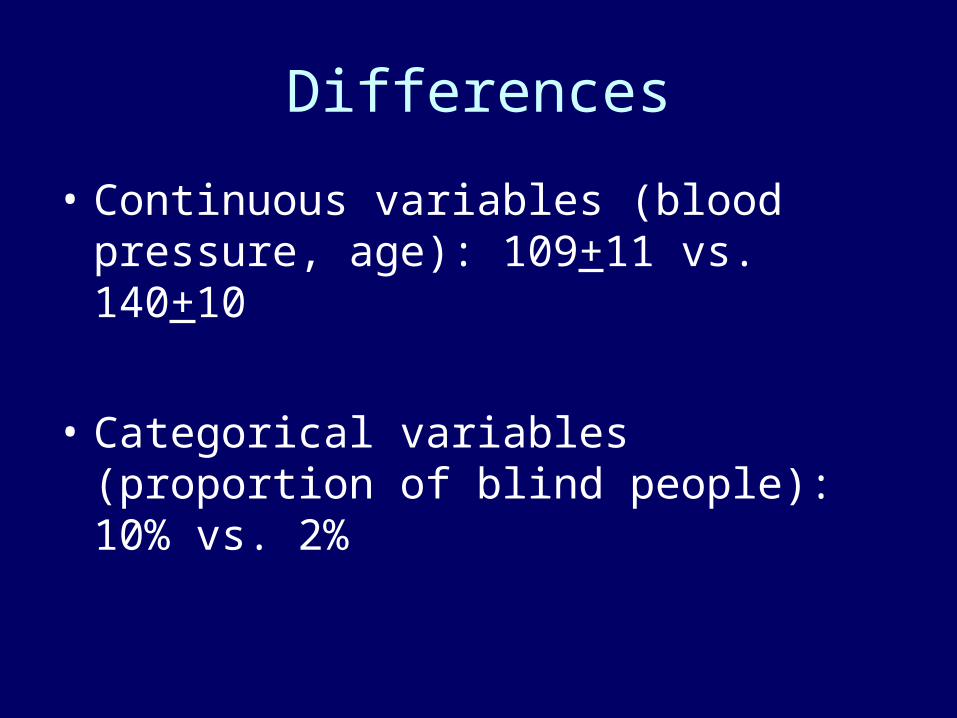
Differences
• Continuous variables (blood pressure, age): 109+11 vs. 140+10
• Categorical variables (proportion of blind people): 10% vs. 2%
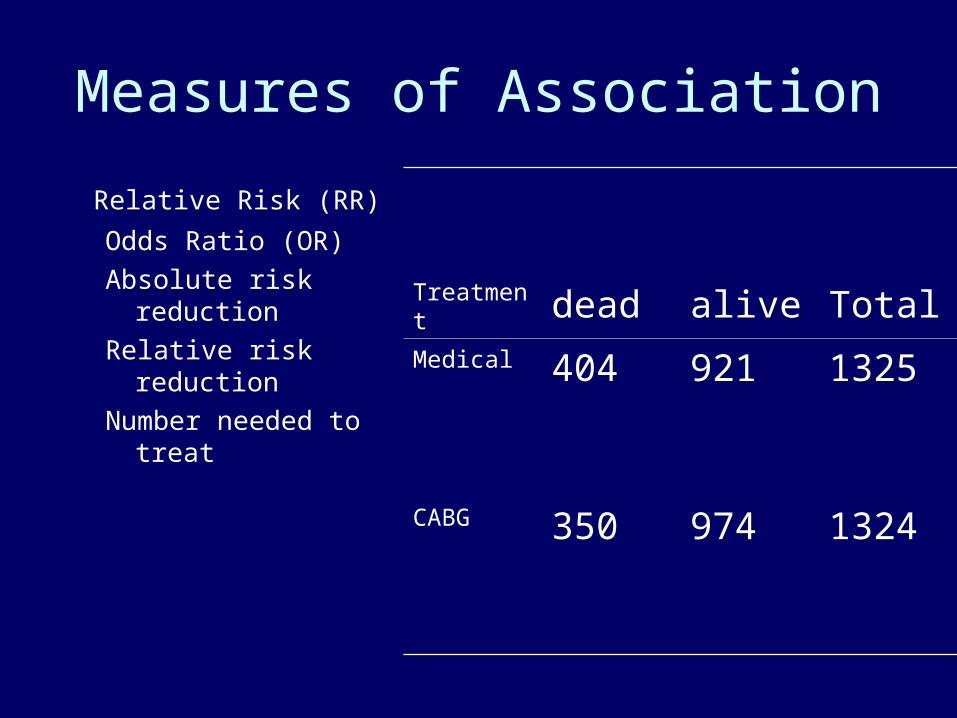
Measures of Association
Relative Risk (RR)
Odds Ratio (OR)
Absolute risk reduction
Relative risk reduction
Number needed to treat
Treatment dead alive TotalMedical 404 921 1325
CABG 350 974 1324
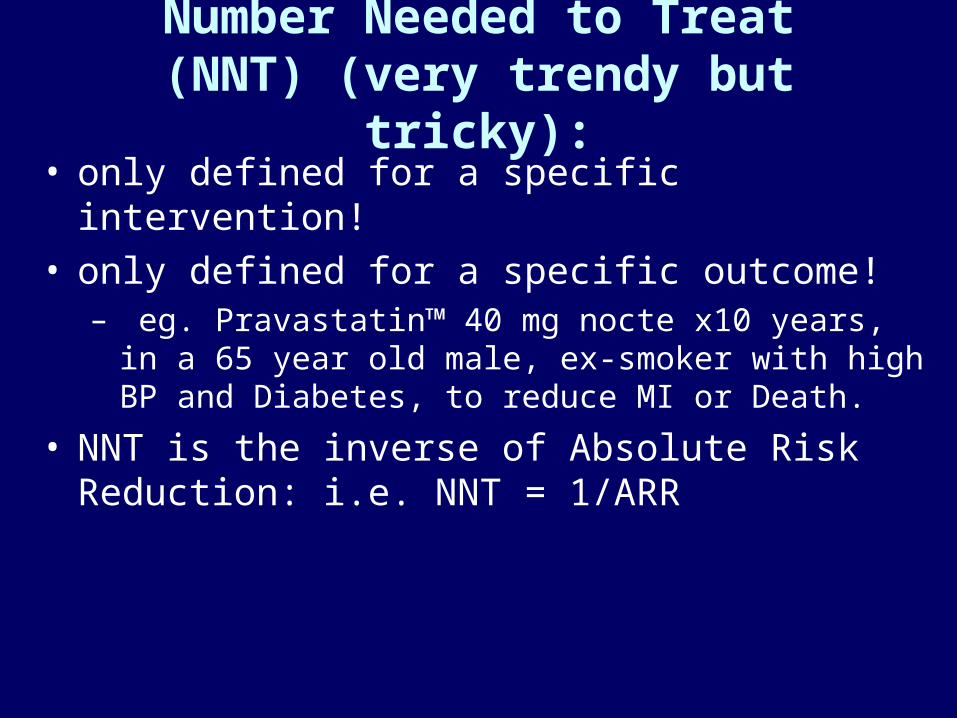
Number Needed to Treat (NNT) (very trendy but tricky):
• only defined for a specific intervention!• only defined for a specific outcome!
– eg. Pravastatin™ 40 mg nocte x10 years, in a 65 year old male, ex-smoker with high BP and Diabetes, to reduce MI or Death.
• NNT is the inverse of Absolute Risk Reduction: i.e. NNT = 1/ARR
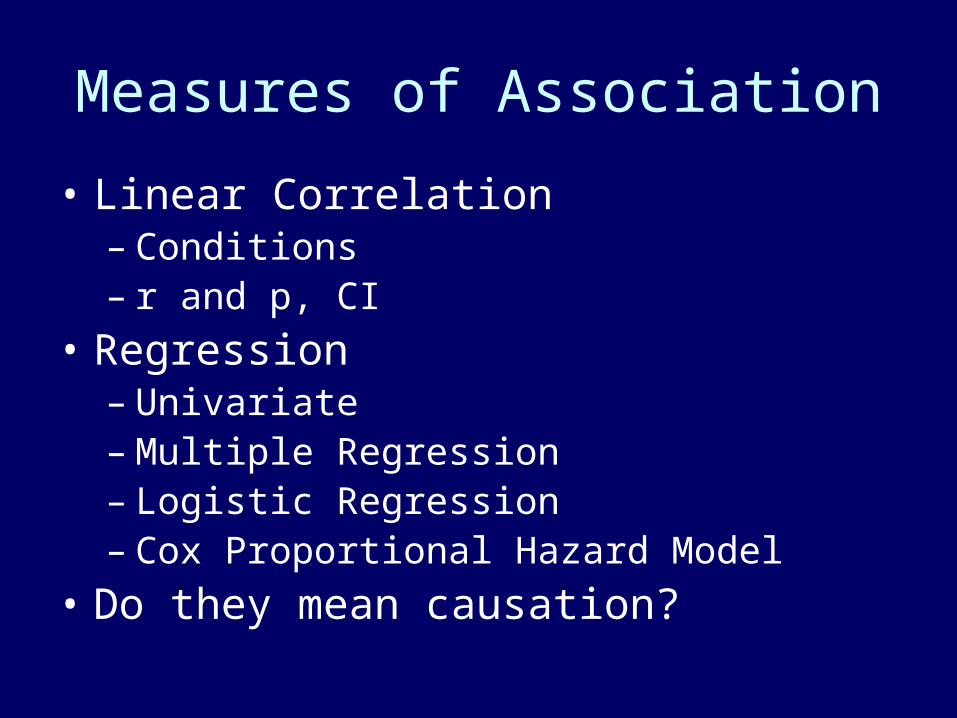
Measures of Association
• Linear Correlation – Conditions– r and p, CI
• Regression– Univariate– Multiple Regression– Logistic Regression– Cox Proportional Hazard Model
• Do they mean causation?

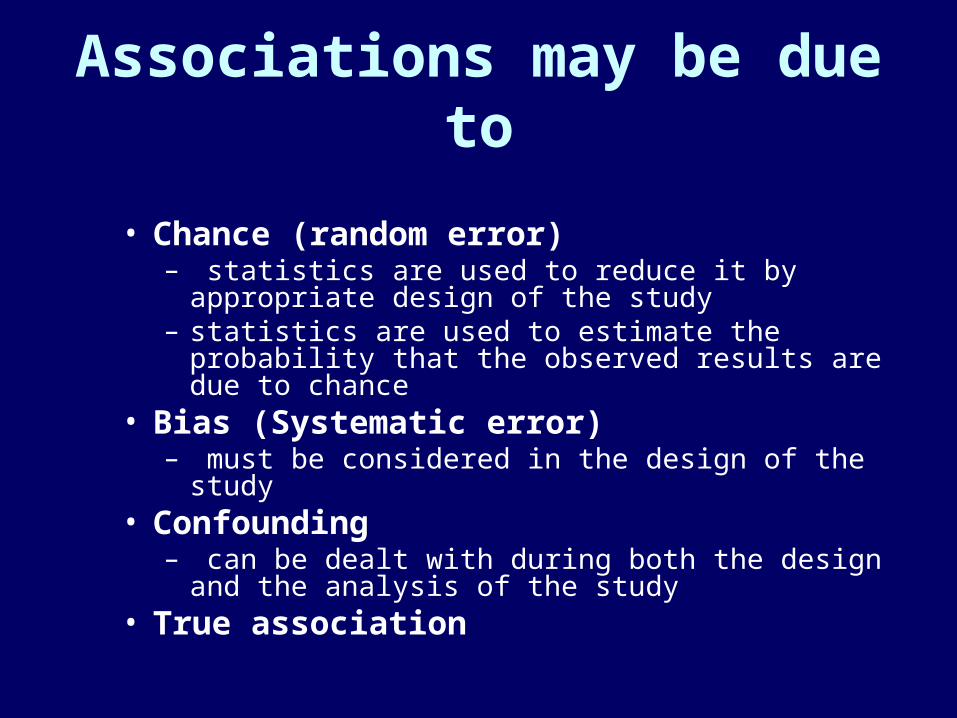
Associations may be due to
• Chance (random error)– statistics are used to reduce it by appropriate design
of the study– statistics are used to estimate the probability that the
observed results are due to chance• Bias (Systematic error)
– must be considered in the design of the study• Confounding
– can be dealt with during both the design and the analysis of the study
• True association
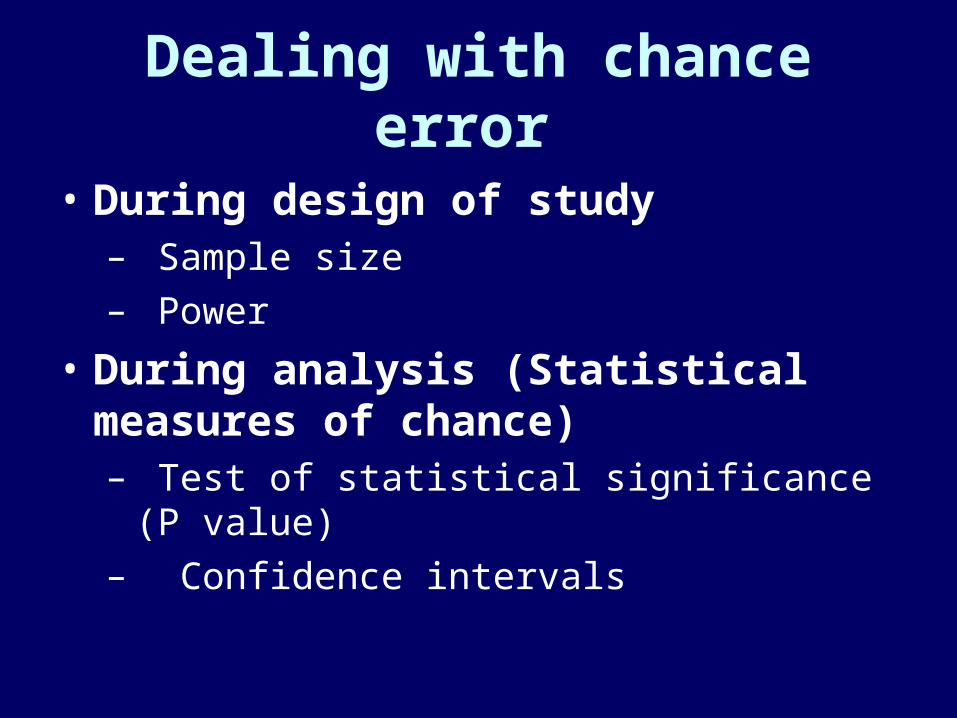
Dealing with chance error
• During design of study– Sample size– Power
• During analysis (Statistical measures of chance)– Test of statistical significance (P value)– Confidence intervals
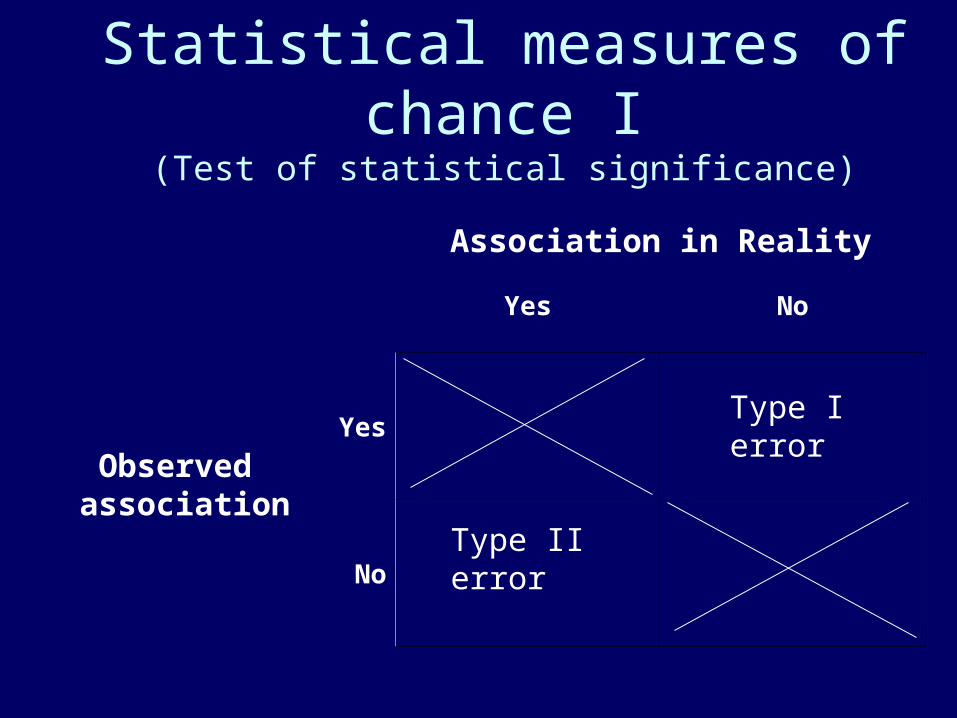
Statistical measures of chance I(Test of statistical significance)
Association in Reality
Yes No
Yes
No
Type I error
Type II error
Observed association
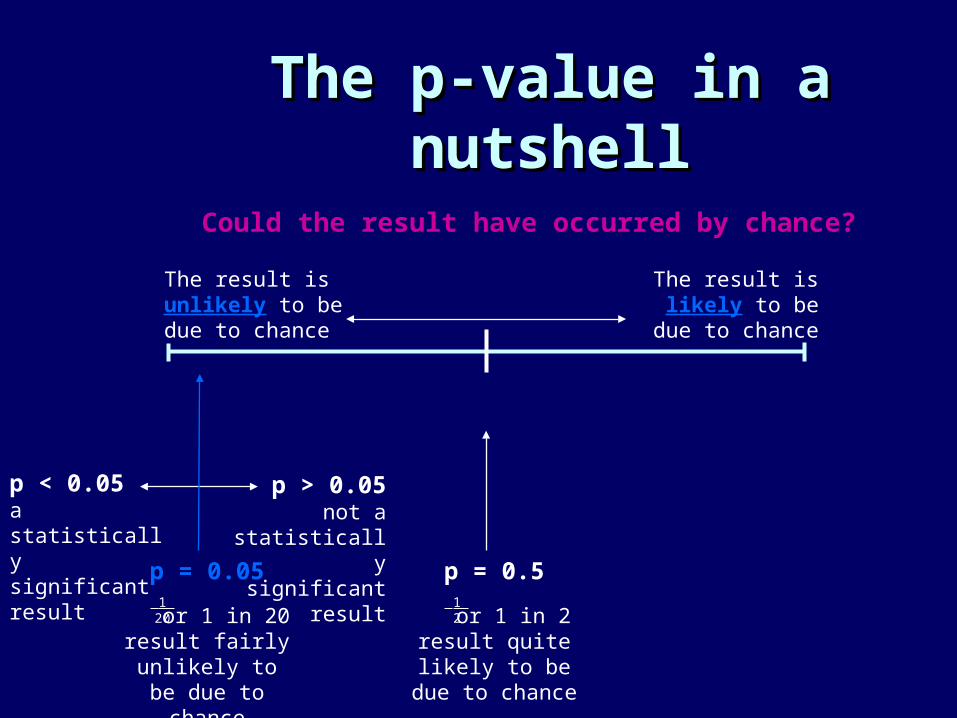
The p-value in a nutshellThe p-value in a nutshell
p < 0.05a statistically significant result p = 0.05
or 1 in 20result fairly
unlikely to be due to chance
0 1
Could the result have occurred by chance?
The result is unlikely to be due to chance
The result is likely to be
due to chance
1 20
p > 0.05not a
statistically significant
resultp = 0.5
or 1 in 2result quite
likely to be due to chance
1 2
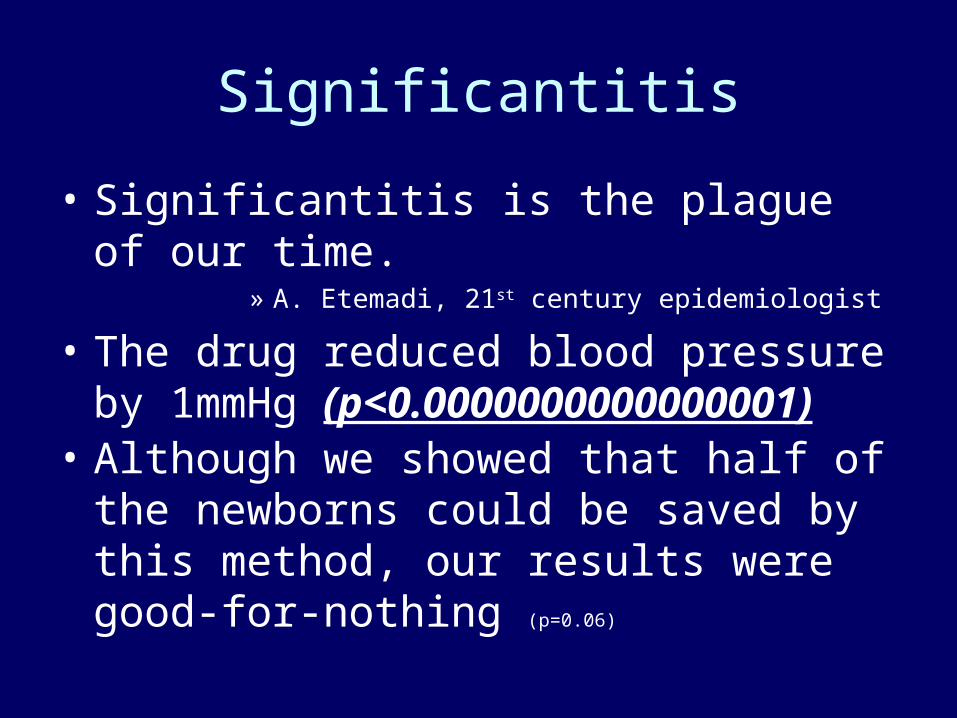
Significantitis
• Significantitis is the plague of our time.» A. Etemadi, 21st century epidemiologist
• The drug reduced blood pressure by 1mmHg (p<0.0000000000000001)
• Although we showed that half of the newborns could be saved by this method, our results were good-for-nothing (p=0.06)
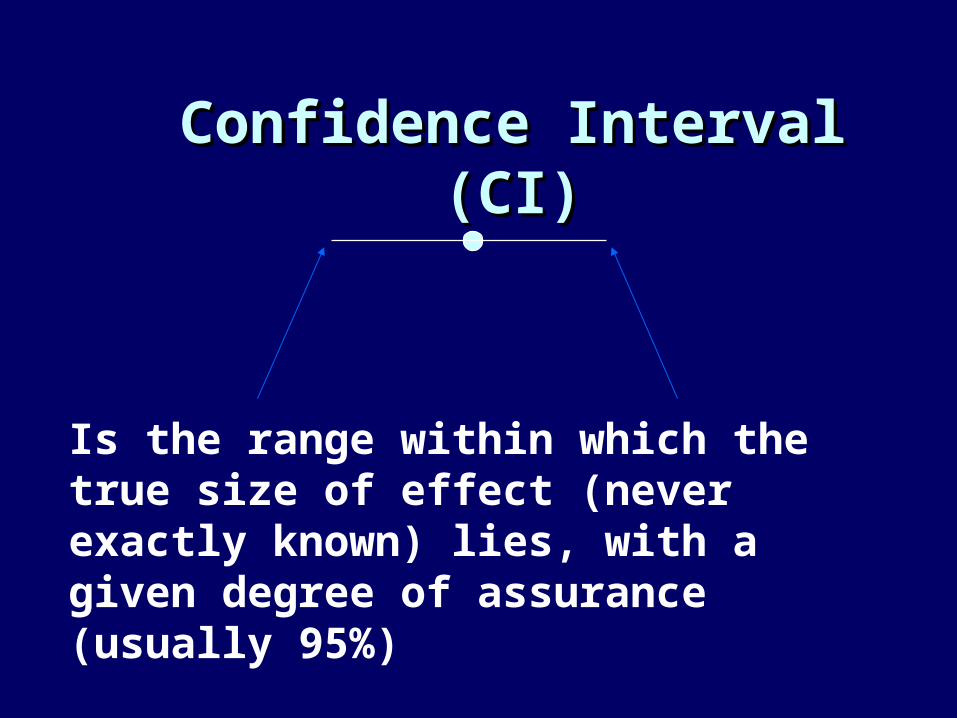
Confidence Interval (CI)Confidence Interval (CI)
Is the range within which the true size of effect (never exactly known) lies, with a given degree of assurance (usually 95%)
• The ACE inhibitor group had a 5%(95% CI: 1-9) higher survival.

Associations may be due to
• Chance (random error)– statistics are used to reduce it by appropriate design
of the study– statistics are used to estimate the probability that the
observed results are due to chance• Bias (Systematic error)
– must be considered in the design of the study• Confounding
– can be dealt with during both the design and the analysis of the study
• True association
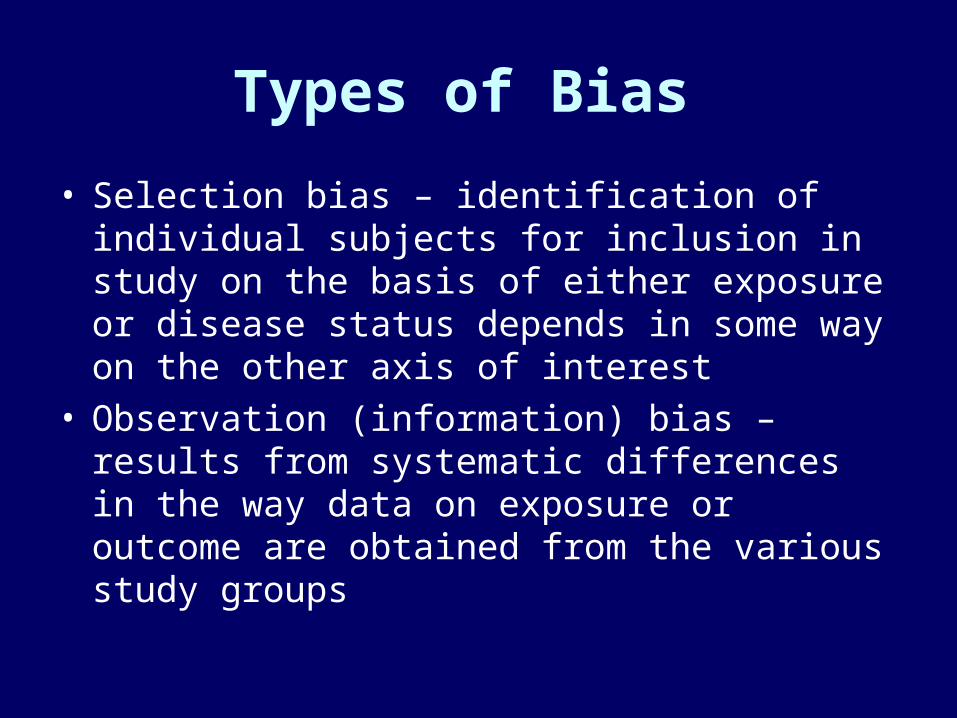
Types of Bias
• Selection bias – identification of individual subjects for inclusion in study on the basis of either exposure or disease status depends in some way on the other axis of interest
• Observation (information) bias – results from systematic differences in the way data on exposure or outcome are obtained from the various study groups

Associations may be due to
• Chance (random error)– statistics are used to reduce it by appropriate design
of the study– statistics are used to estimate the probability that the
observed results are due to chance• Bias (Systematic error)
– must be considered in the design of the study• Confounding
– can be dealt with during both the design and the analysis of the study
• True association
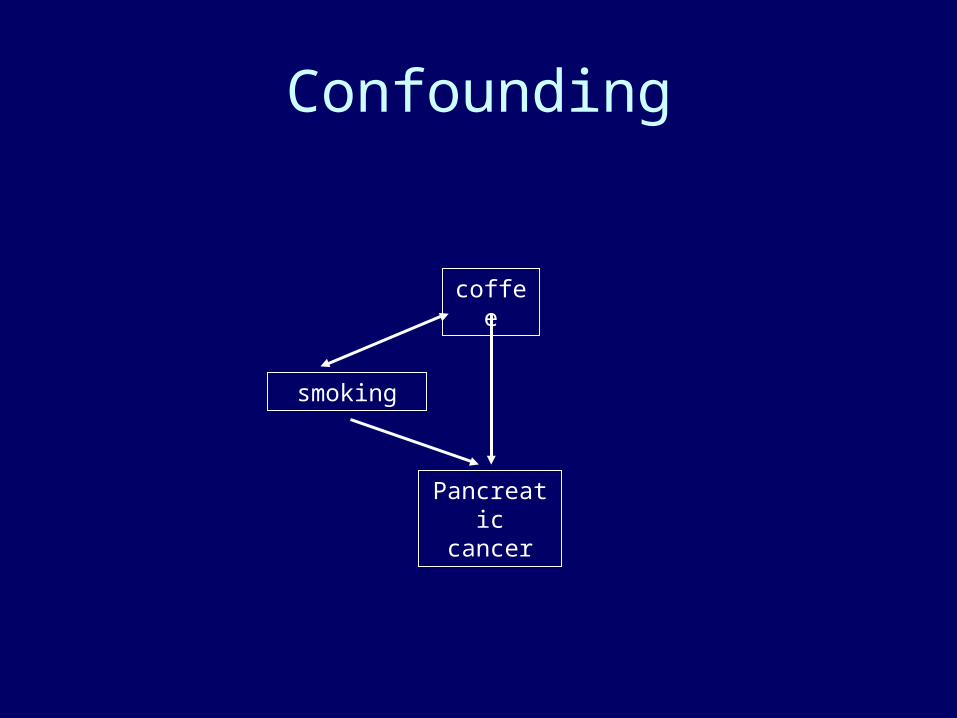
Confounding
coffee
Pancreatic cancer
smoking
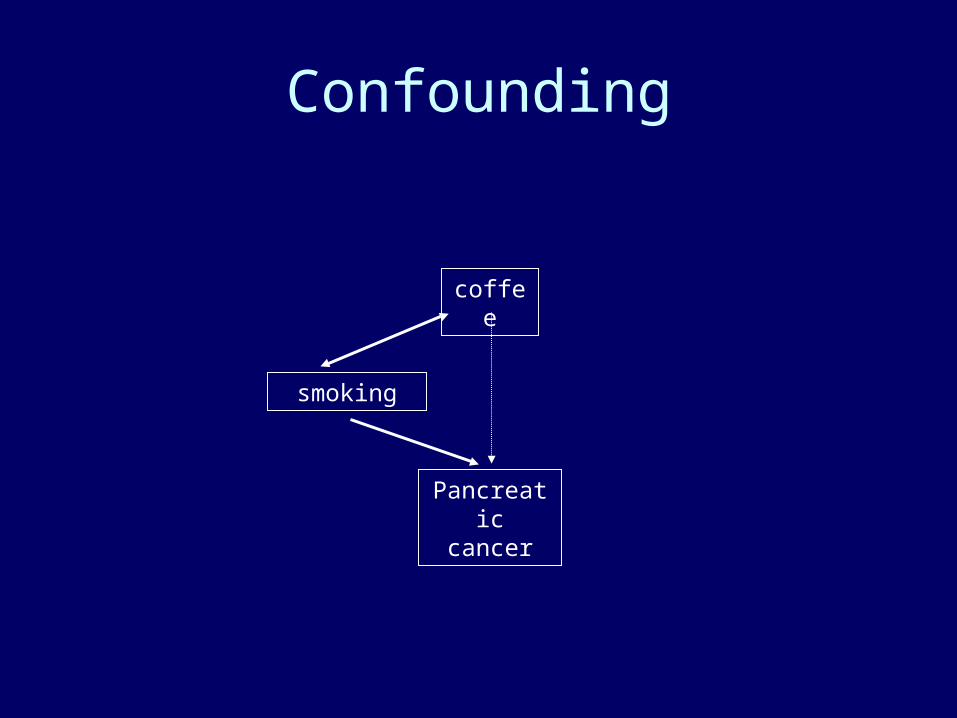
Confounding
smoking
coffee
Pancreatic cancer
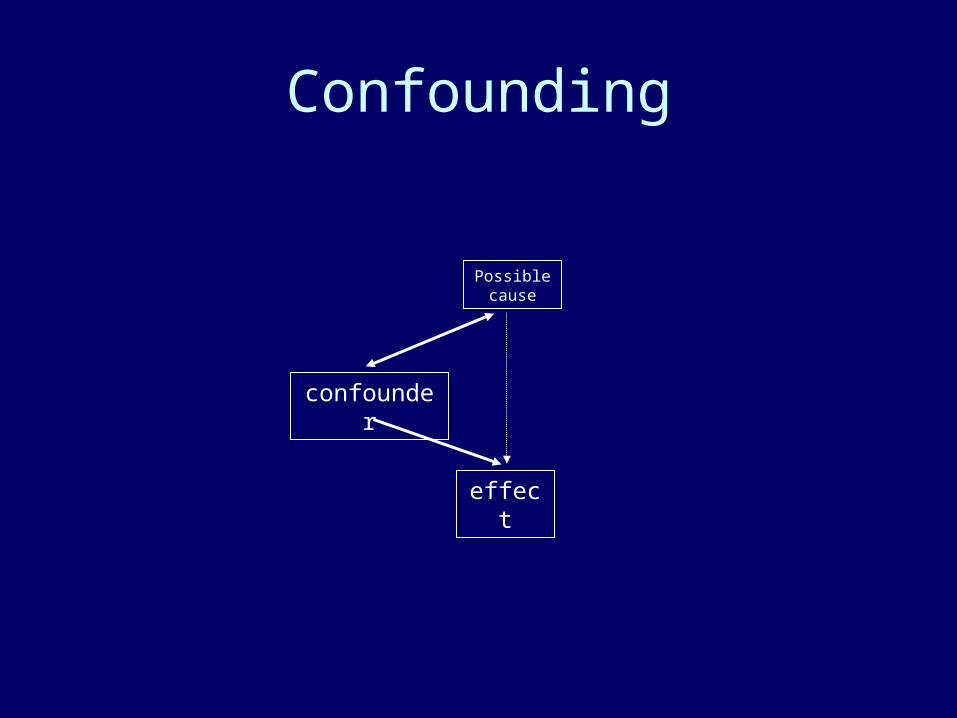
Confounding
confounder
effect
Possible cause
Associations may be due to
• Chance (random error)– statistics are used to reduce it by appropriate design
of the study– statistics are used to estimate the probability that the
observed results are due to chance• Bias (Systematic error)
– must be considered in the design of the study• Confounding
– can be dealt with during both the design and the analysis of the study
• True association
04/19/23
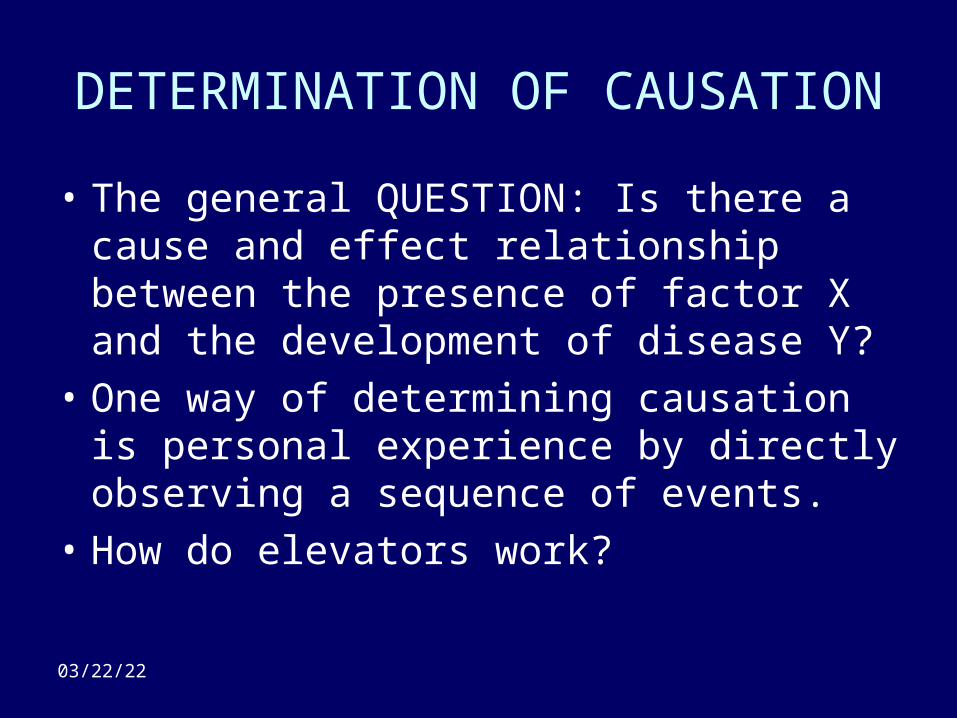
DETERMINATION OF CAUSATION
• The general QUESTION: Is there a cause and effect relationship between the presence of factor X and the development of disease Y?
• One way of determining causation is personal experience by directly observing a sequence of events.
• How do elevators work?
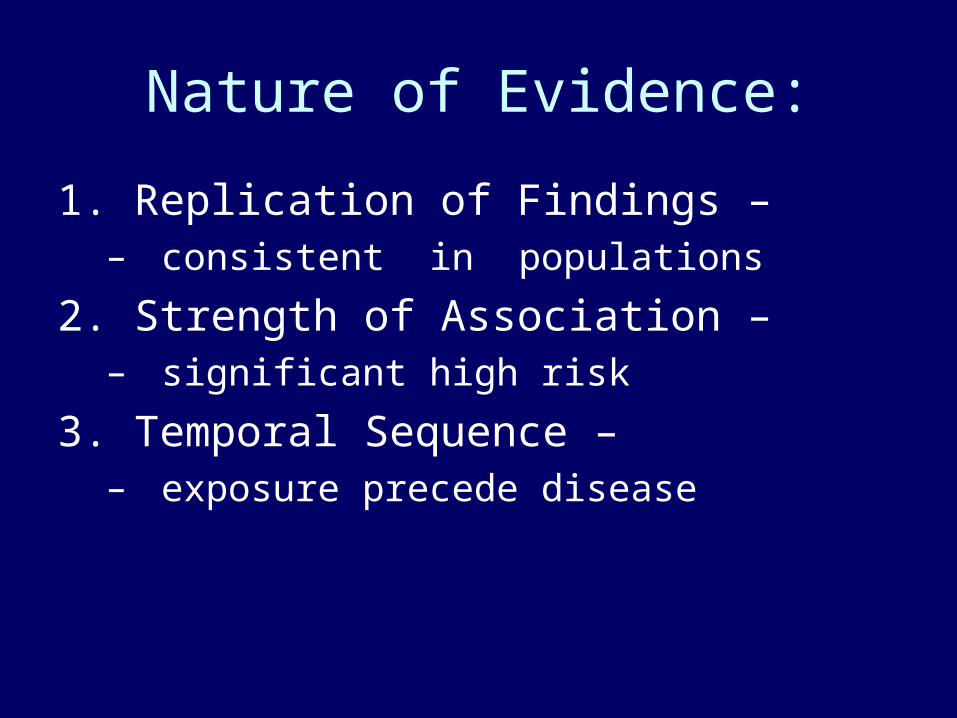
Nature of Evidence:
1. Replication of Findings – – consistent in populations
2. Strength of Association –– significant high risk
3. Temporal Sequence – – exposure precede disease
Nature of Evidence:
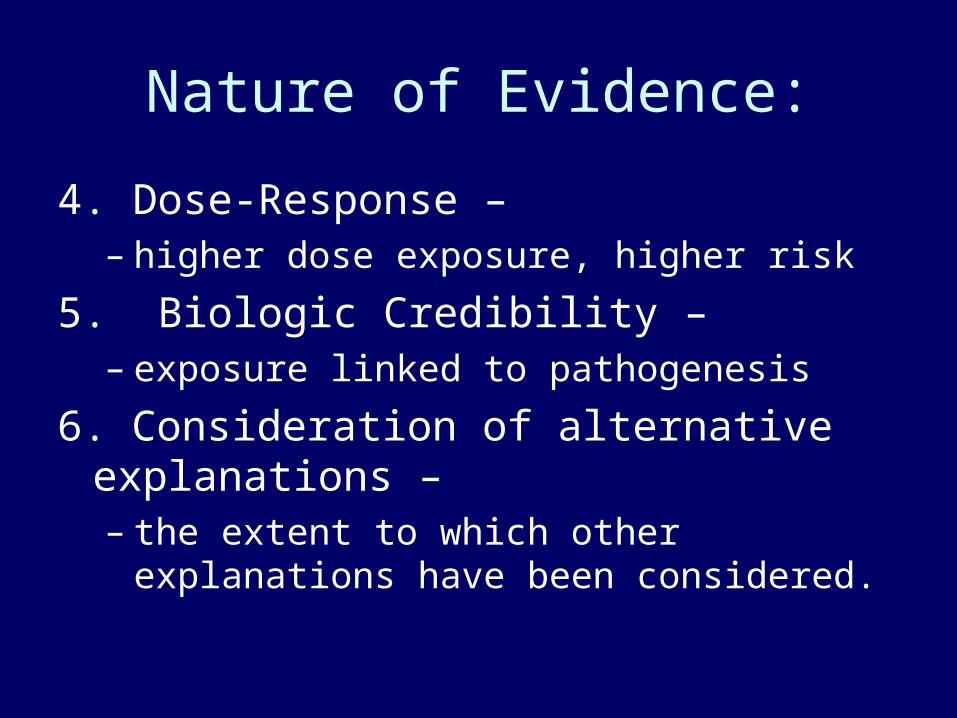
4. Dose-Response – – higher dose exposure, higher risk
5. Biologic Credibility – – exposure linked to pathogenesis
6. Consideration of alternative explanations – – the extent to which other explanations have
been considered.
Nature of Evidence
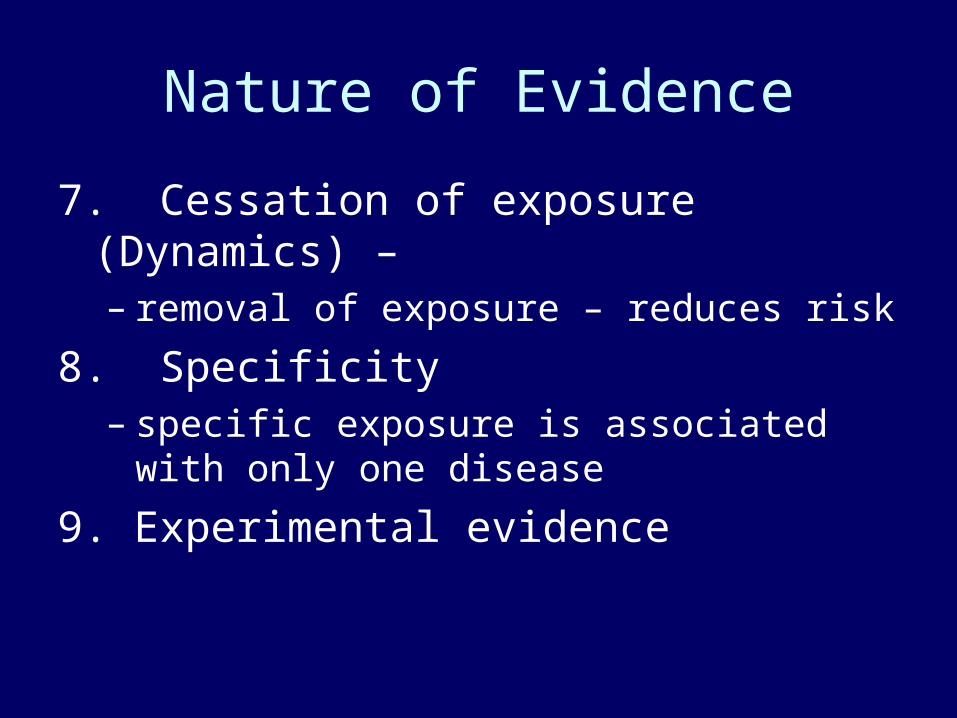
7. Cessation of exposure (Dynamics) – – removal of exposure – reduces risk
8. Specificity – specific exposure is associated with only one
disease
9. Experimental evidence
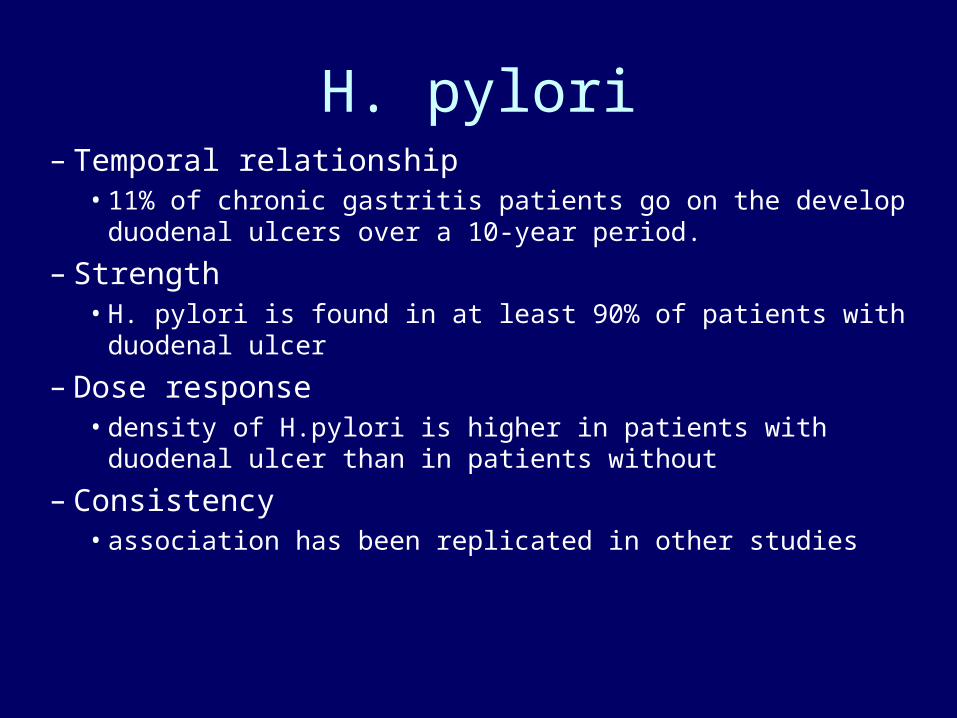
H. pylori– Temporal relationship
• 11% of chronic gastritis patients go on the develop duodenal ulcers over a 10-year period.
– Strength • H. pylori is found in at least 90% of patients with duodenal ulcer
– Dose response• density of H.pylori is higher in patients with duodenal ulcer than
in patients without
– Consistency• association has been replicated in other studies
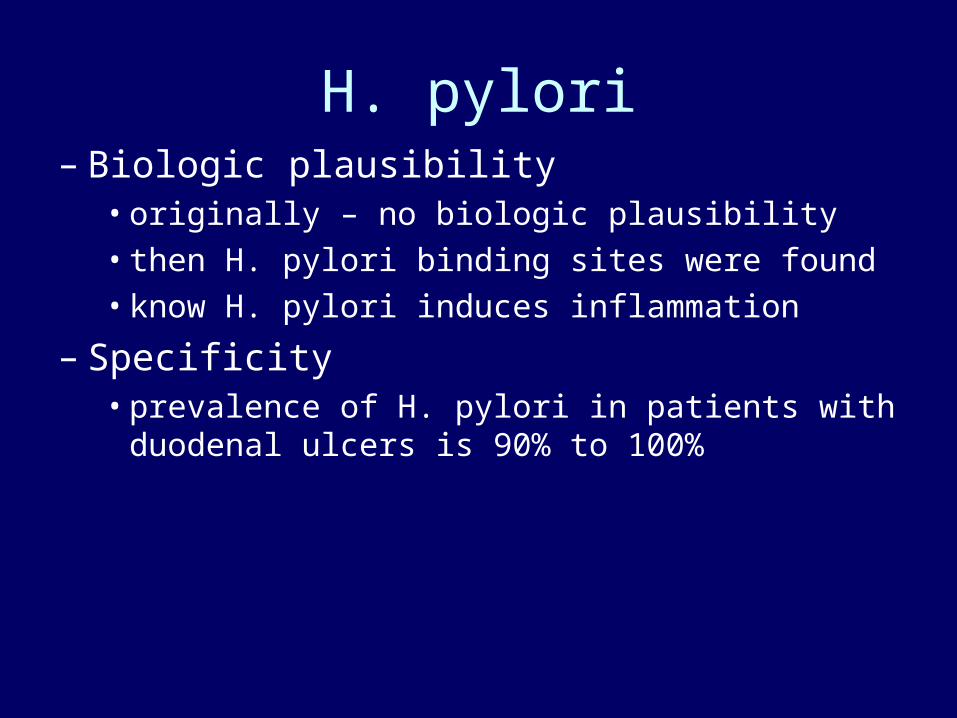
H. pylori– Biologic plausibility
• originally – no biologic plausibility• then H. pylori binding sites were found• know H. pylori induces inflammation
– Specificity• prevalence of H. pylori in patients with duodenal ulcers is
90% to 100%
First question to ask:
• Is there any statistics at all?– Is it necessary?
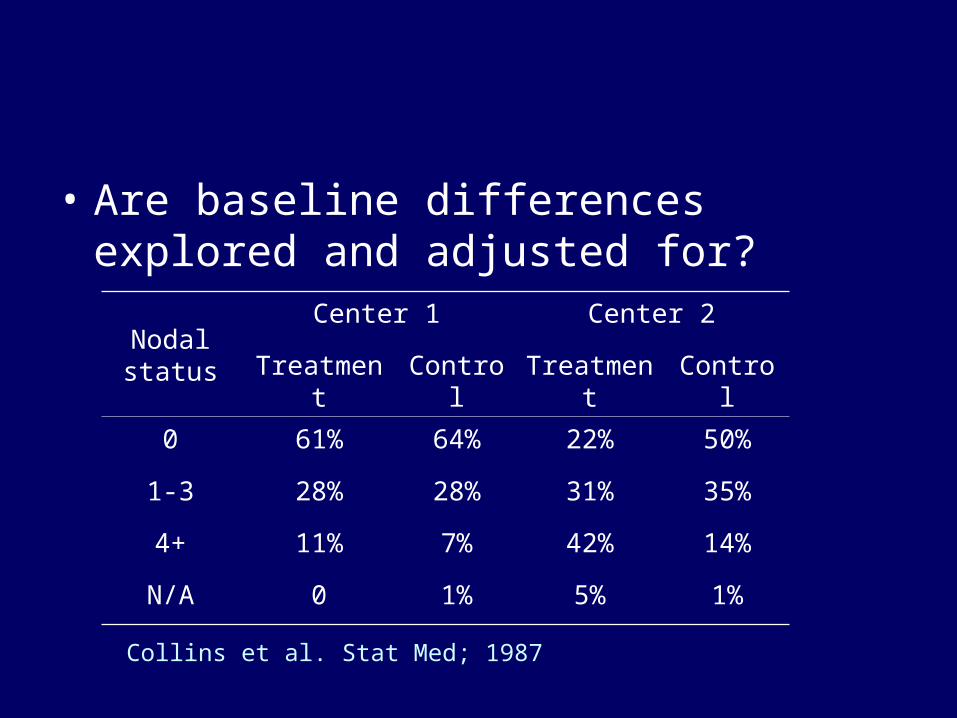
• Are baseline differences explored and adjusted for?
Collins et al. Stat Med; 1987
Nodal status
Center 1 Center 2
Treatment Control Treatment Control
0 61% 64% 22% 50%
1-3 28% 28% 31% 35%
4+ 11% 7% 42% 14%
N/A 0 1% 5% 1%
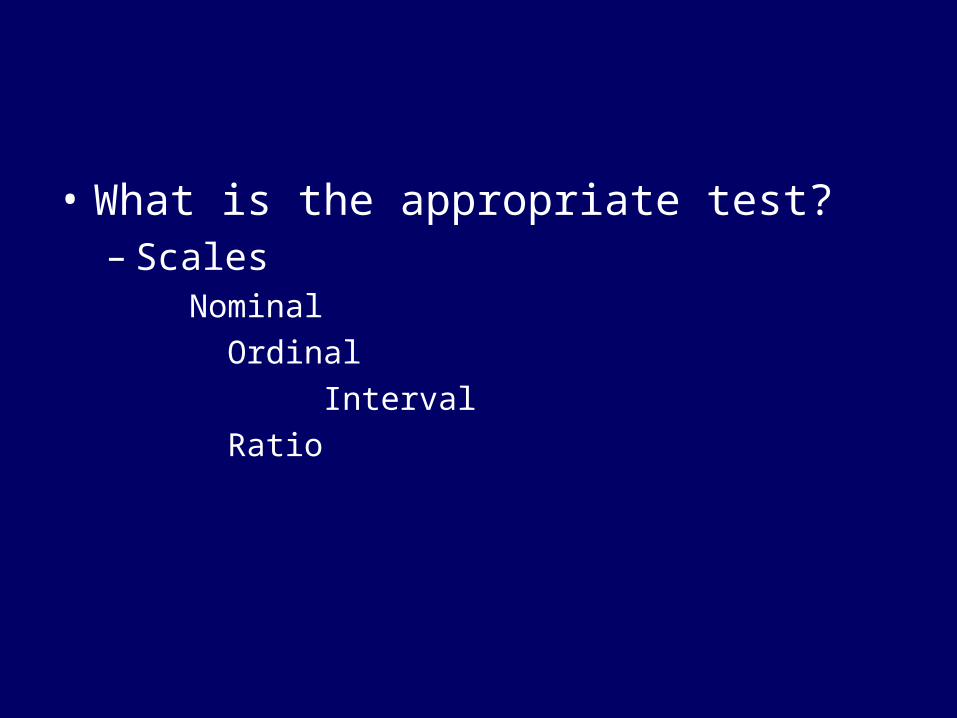
• What is the appropriate test?– Scales
Nominal
Ordinal
Interval
Ratio
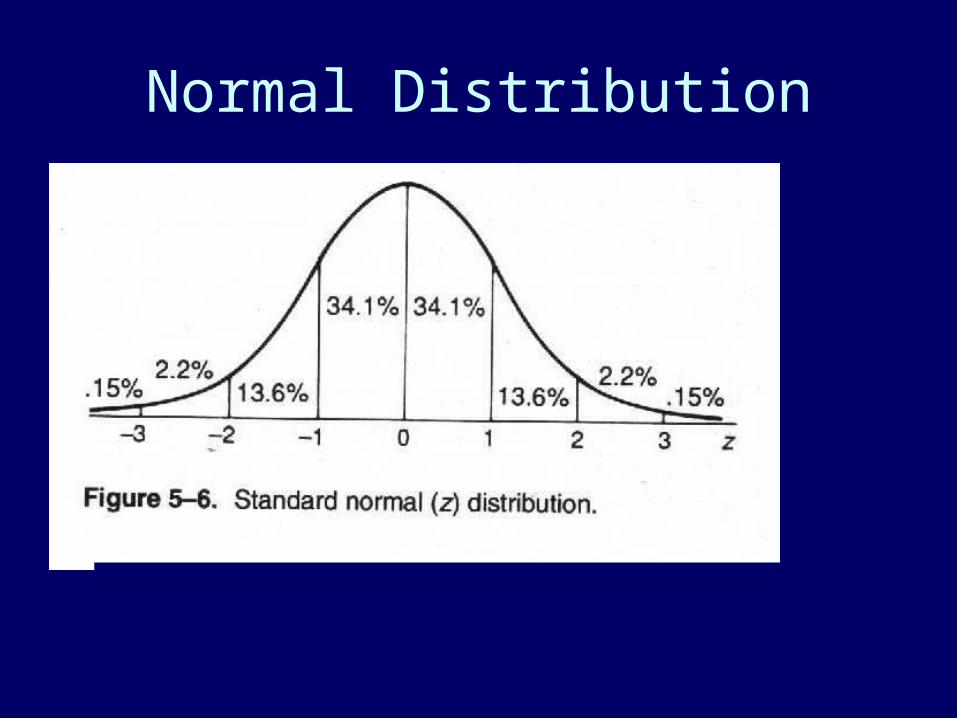
Normal Distribution
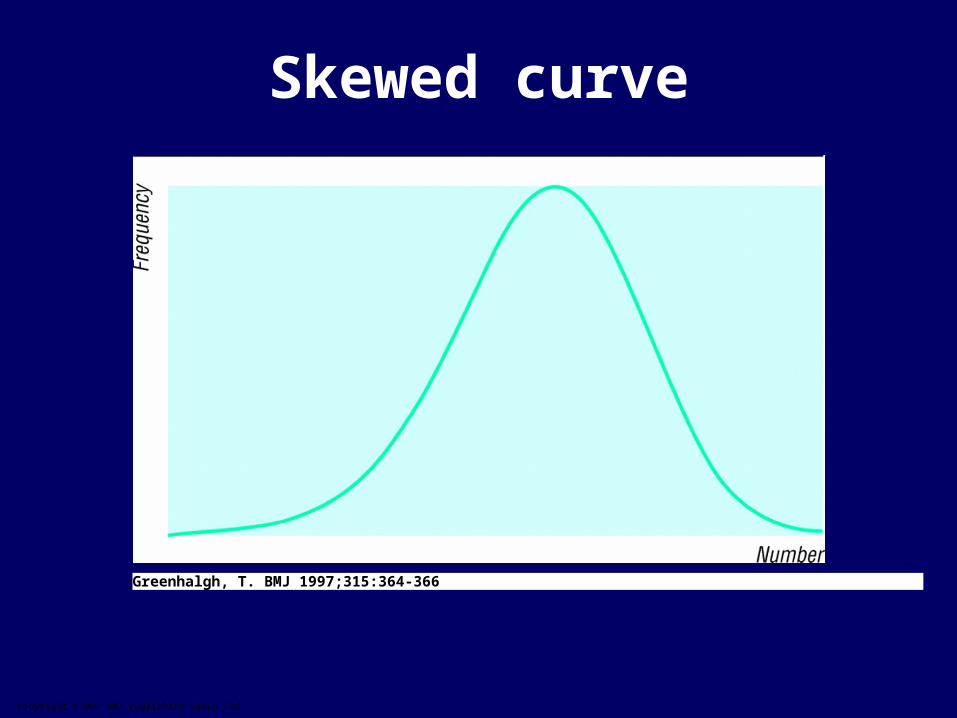
Copyright ©1997 BMJ Publishing Group Ltd.
Greenhalgh, T. BMJ 1997;315:364-366
Skewed curve
• Parametric versus non-parametric tests
• Transformation

• Jekyl-Frankenestein-Tarkovsky test of variances for unequal modes
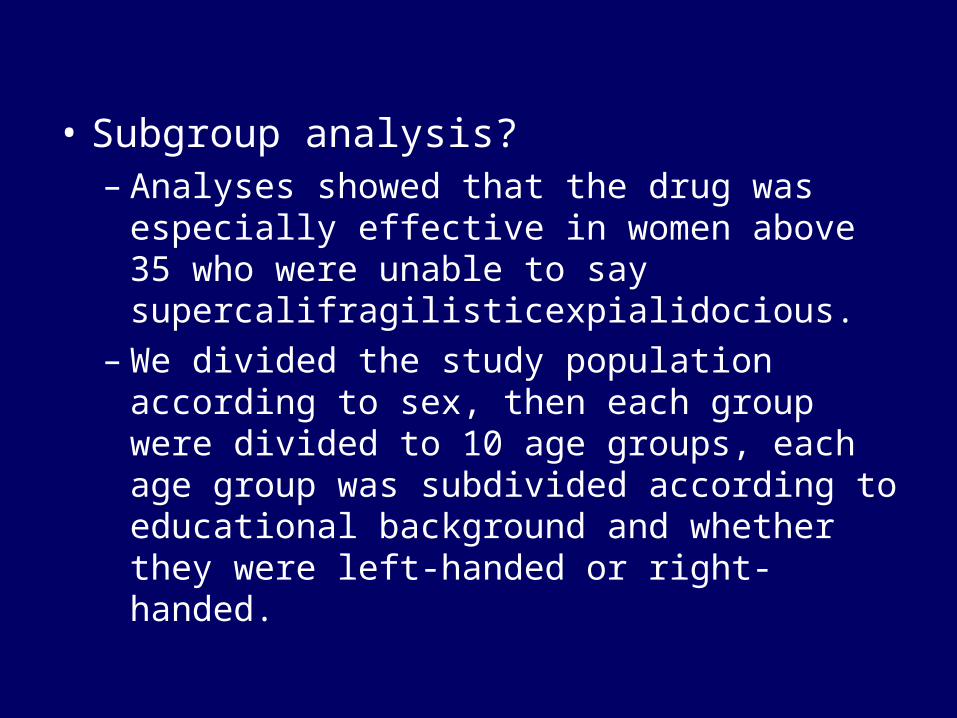
• Subgroup analysis?– Analyses showed that the drug was especially
effective in women above 35 who were unable to say supercalifragilisticexpialidocious.
– We divided the study population according to sex, then each group were divided to 10 age groups, each age group was subdivided according to educational background and whether they were left-handed or right-handed.
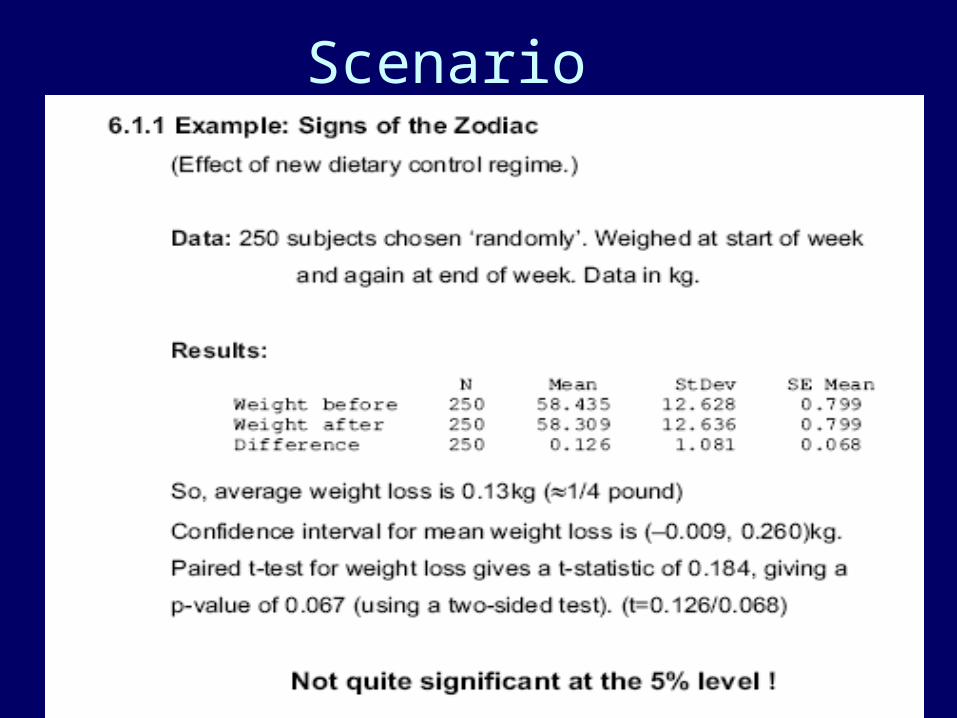
Scenario
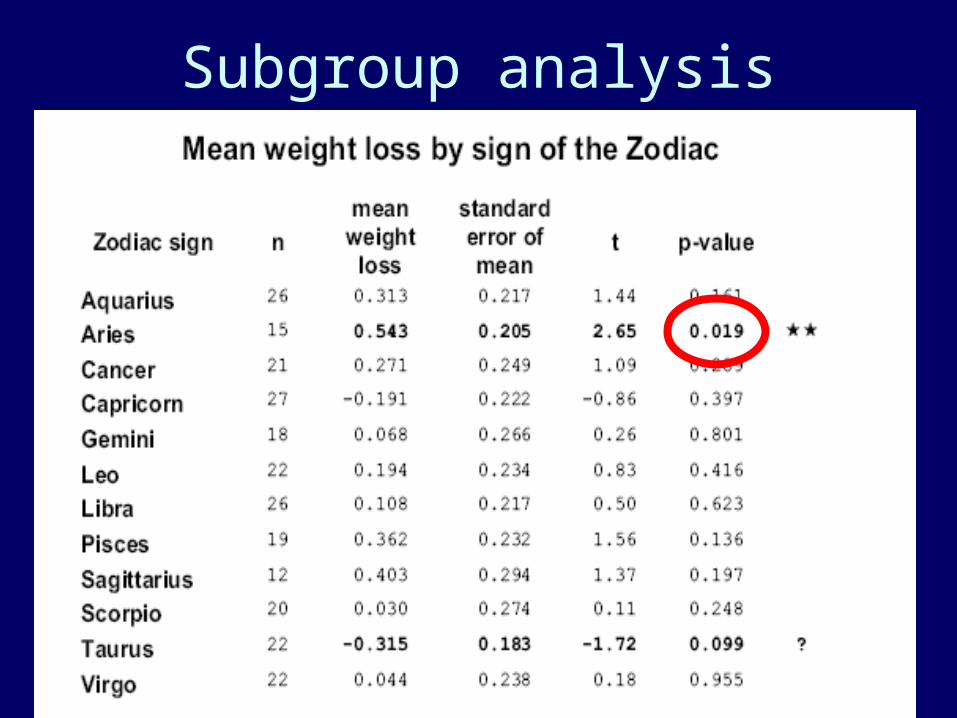
Subgroup analysis
Paired analysis?
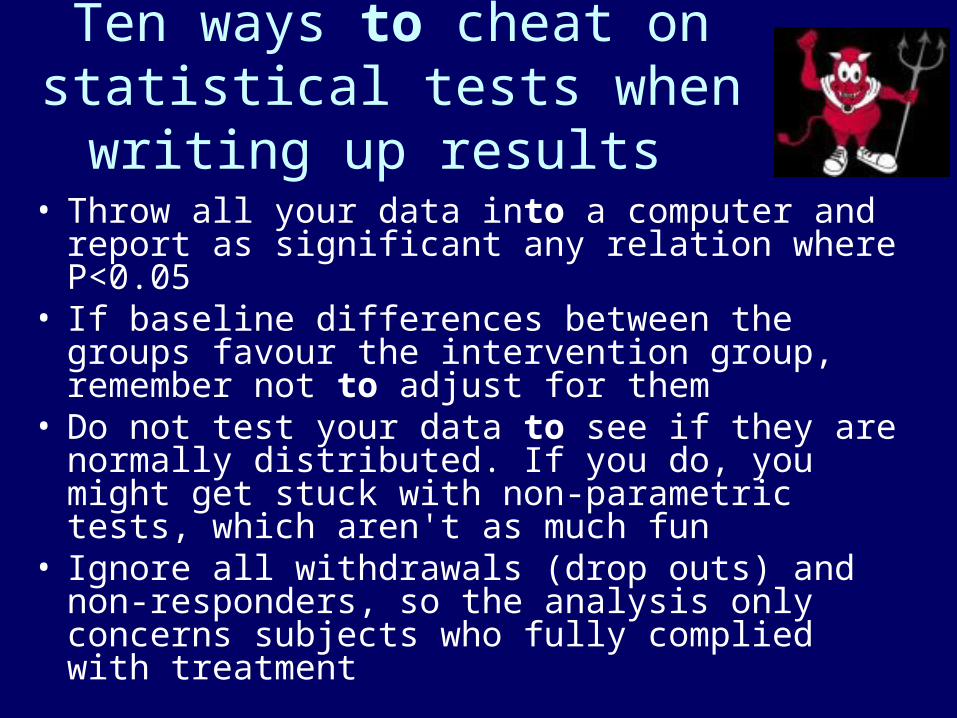
Ten ways to cheat on statistical tests when writing up results
• Throw all your data into a computer and report as significant any relation where P<0.05
• If baseline differences between the groups favour the intervention group, remember not to adjust for them
• Do not test your data to see if they are normally distributed. If you do, you might get stuck with non-parametric tests, which aren't as much fun
• Ignore all withdrawals (drop outs) and non-responders, so the analysis only concerns subjects who fully complied with treatment
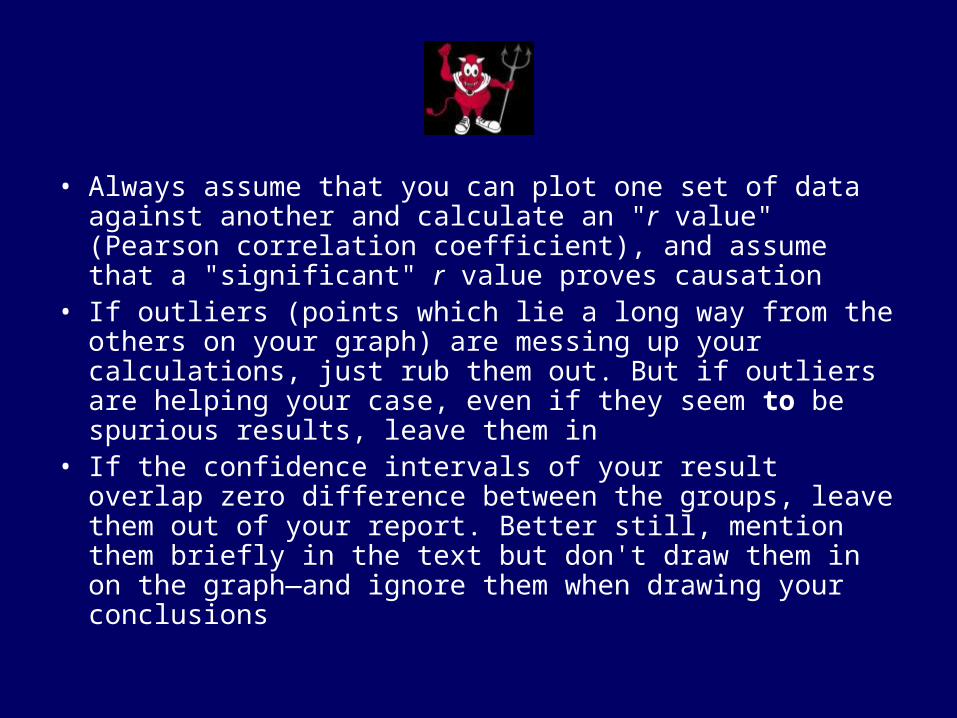
• Always assume that you can plot one set of data against another and calculate an "r value" (Pearson correlation coefficient), and assume that a "significant" r value proves causation
• If outliers (points which lie a long way from the others on your graph) are messing up your calculations, just rub them out. But if outliers are helping your case, even if they seem to be spurious results, leave them in
• If the confidence intervals of your result overlap zero difference between the groups, leave them out of your report. Better still, mention them briefly in the text but don't draw them in on the graph—and ignore them when drawing your conclusions
• If the difference between two groups becomes significant four and a half months into a six month trial, stop the trial and start writing up. Alternatively, if at six months the results are "nearly significant," extend the trial for another three weeks
• If your results prove uninteresting, ask the computer to go back and see if any particular subgroups behaved differently. You might find that your intervention worked after all in Chinese women aged 52-61
• If analysing your data the way you plan to does not give the result you wanted, run the figures through a selection of other tests
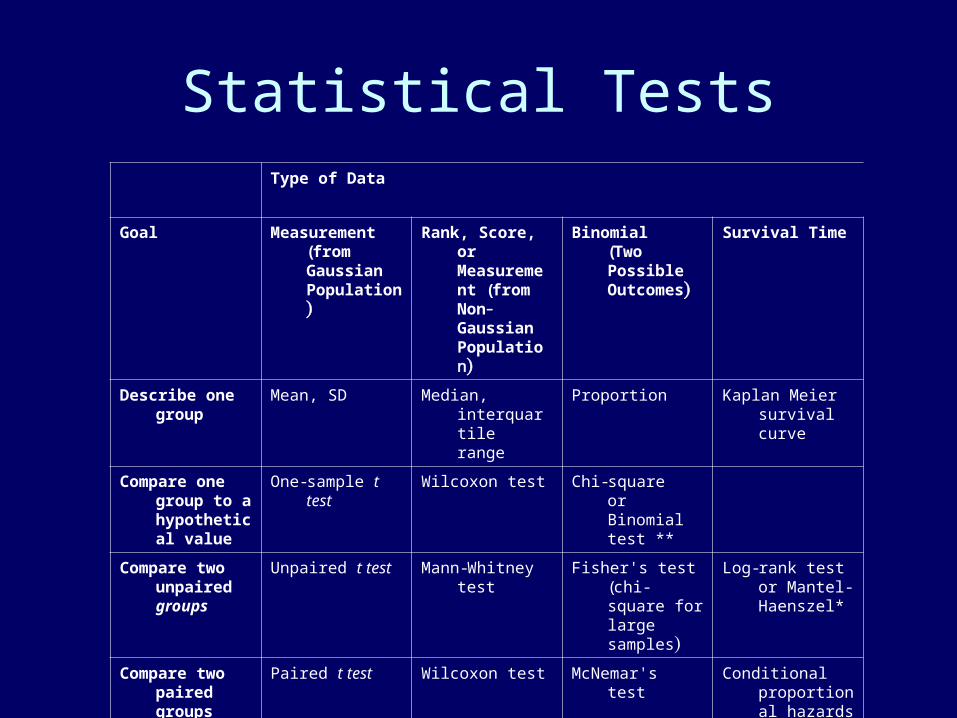
Statistical TestsType of Data
Goal Measurement (from Gaussian Population)
Rank, Score, or Measurement (from Non- Gaussian Population)
Binomial(Two Possible Outcomes)
Survival Time
Describe one group
Mean, SD Median, interquartile range
Proportion Kaplan Meier survival curve
Compare one group to a hypothetical value
One-sample t test Wilcoxon test Chi-squareorBinomial test **
Compare two unpaired groups
Unpaired t test Mann-Whitney test
Fisher's test(chi-square for large samples)
Log-rank test or Mantel-Haenszel*
Compare two paired groups
Paired t test Wilcoxon test McNemar's test Conditional proportional hazards regression*
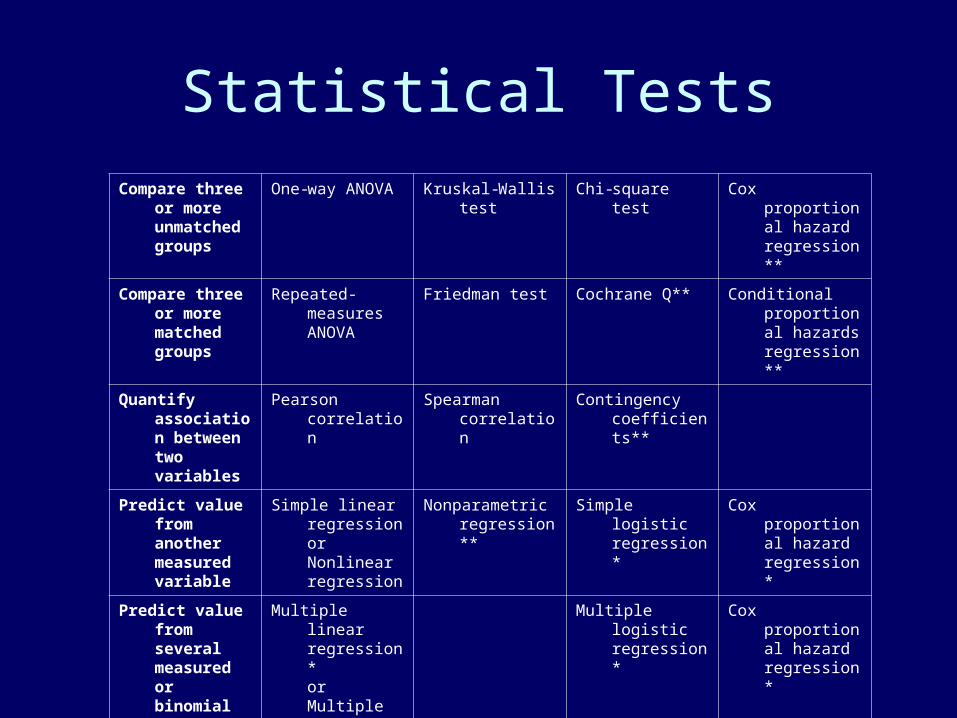
Statistical Tests
Compare three or more unmatched groups
One-way ANOVA Kruskal-Wallis test Chi-square test Cox proportional hazard regression**
Compare three or more matched groups
Repeated-measures ANOVA
Friedman test Cochrane Q** Conditional proportional hazards regression**
Quantify association between two variables
Pearson correlation
Spearman correlation
Contingency coefficients**
Predict value from another measured variable
Simple linear regressionorNonlinear regression
Nonparametric regression**
Simple logistic regression*
Cox proportional hazard regression*
Predict value from several measured or binomial variables
Multiple linear regression*orMultiple nonlinear regression**
Multiple logistic regression*
Cox proportional hazard regression*


![Arash Eslamdoost [ASSIGNMENT 1] - Chalmershani/kurser/OS_CFD_2009/assignment1... · Arash Eslamdoost, Chalmers / Shipping and Marine Technology / Computational Hydrodynamics 23 Moreover,](https://img.pdfslide.net/doc/110x75/5d65b55888c993d6308bb178/arash-eslamdoost-assignment-1-hanikurseroscfd2009assignment1-arash.jpg)