Embed Size (px)
Citation preview

Medicare Value Based Purchasing Overview
South Carolina Hospital Association
DataGen Susan McDonough
Bill Shyne October 29, 2015
Today’s Objectives
• Overview of Medicare Value Based Purchasing Program
• Review Methodologies
• Review South Carolina’s VBP Report

Medicare Quality Based Payment Reform (QBPR) Programs
• Mandated by the ACA of 2010
• VBP Program (redistributive w/ winners and losers) • Readmissions Reduction Program (remain whole or lose)
• HAC Reduction Program (remain whole or lose)
• National pay-for-performance programs
• Most acute care hospitals must participate; CAHs excluded
• Program rules, measures, and methodologies adopted well in advance (2013-2021)
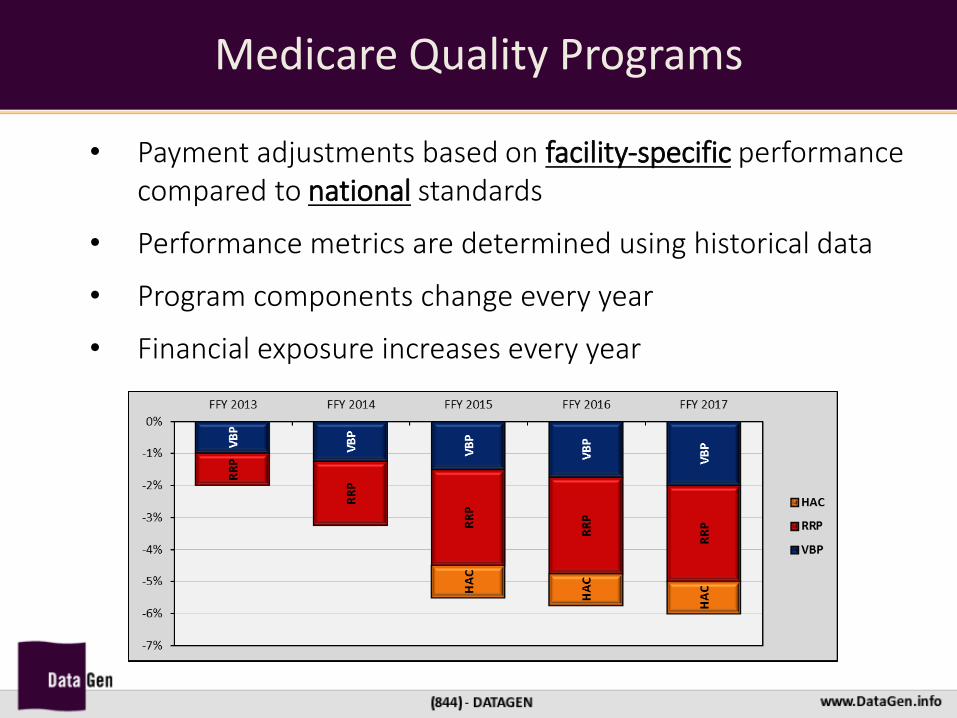
Medicare Quality Programs
• Payment adjustments based on facility-specific performance compared to national standards
• Performance metrics are determined using historical data
• Program components change every year
• Financial exposure increases every year
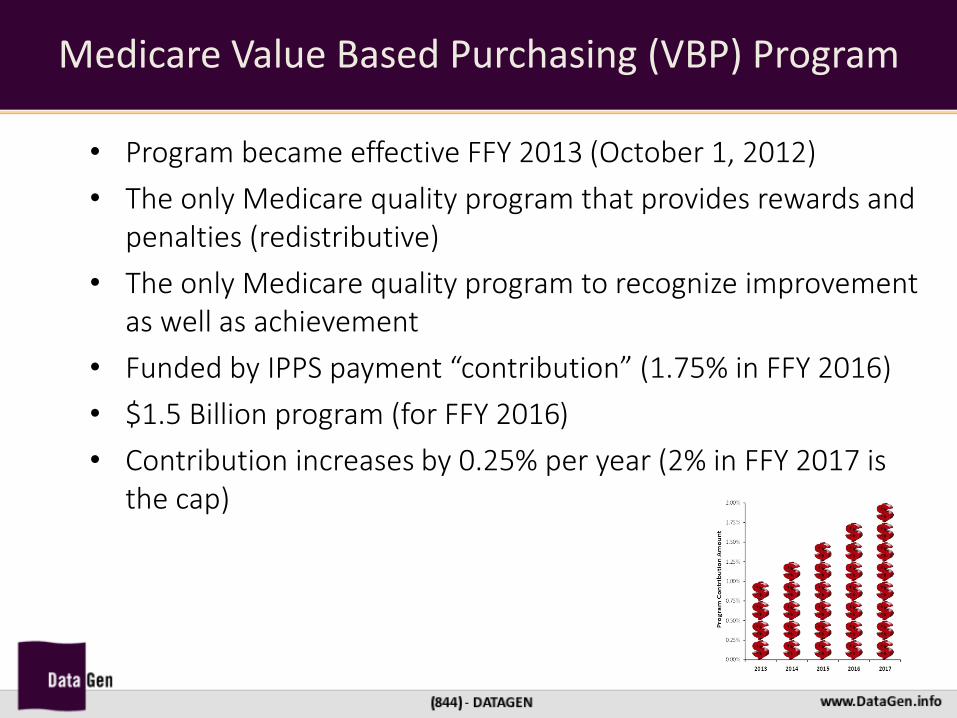
• Program became effective FFY 2013 (October 1, 2012)
• The only Medicare quality program that provides rewards and penalties (redistributive)
• The only Medicare quality program to recognize improvement as well as achievement
• Funded by IPPS payment “contribution” (1.75% in FFY 2016)
• $1.5 Billion program (for FFY 2016)
• Contribution increases by 0.25% per year (2% in FFY 2017 is the cap)
Medicare Value Based Purchasing (VBP) Program
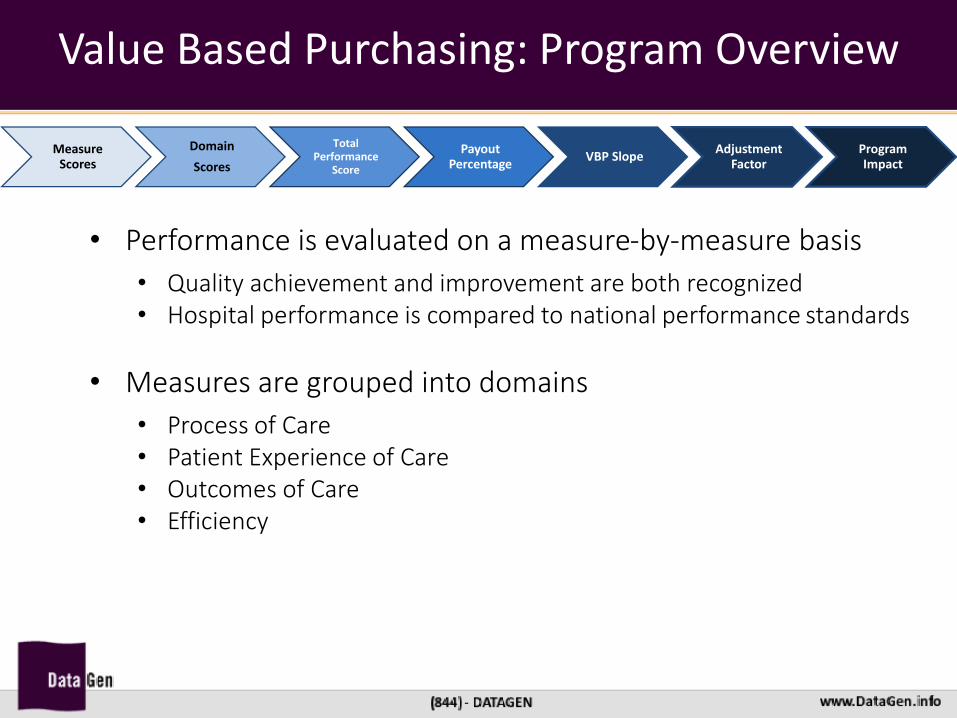
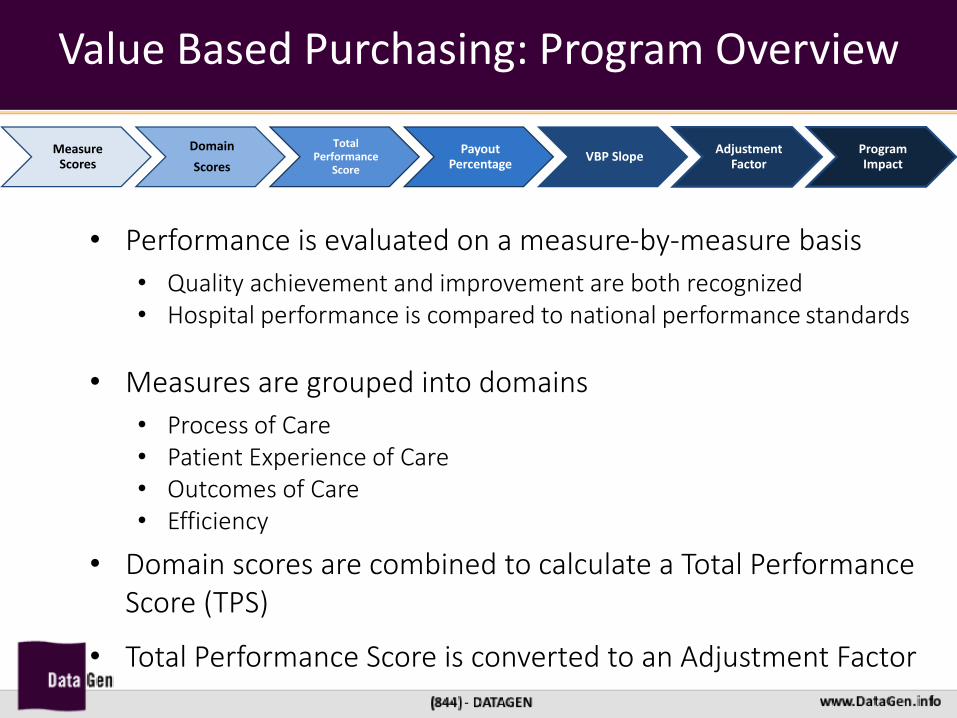
• Performance is evaluated on a measure-by-measure basis
• Quality achievement and improvement are both recognized • Hospital performance is compared to national performance standards
• Measures are grouped into domains
• Process of Care • Patient Experience of Care • Outcomes of Care • Efficiency
Value Based Purchasing: Program Overview
Measure Scores
Domain
Scores
Total Performance
Score
Payout Percentage
VBP SlopeAdjustment
FactorProgram Impact

VBP Efficiency Measure
Medicare Spending per Beneficiary:

South Carolina Medicare Spending per Beneficiary
• Performance is evaluated on a measure-by-measure basis
• Quality achievement and improvement are both recognized • Hospital performance is compared to national performance standards
• Measures are grouped into domains
• Process of Care • Patient Experience of Care • Outcomes of Care • Efficiency
• Domain scores are combined to calculate a Total Performance Score (TPS)
• Total Performance Score is converted to an Adjustment Factor
Value Based Purchasing: Program Overview
Measure Scores
Domain
Scores
Total Performance
Score
Payout Percentage
VBP SlopeAdjustment
FactorProgram Impact

VBP Program Trends
• Continually evolving
• Program rules established in advance
• The final 2016 IPPS rule establishes parameters through 2021
• Increasing emphasis on outcomes and efficiency
• Moving targets
70%
45%
20%10% 5%
25%
30%40%
25%
30% 30%
30% 25%
25%
25%
20% 25%
25%
25%
20%
25%
25%
0%
10%
20%
30%
40%
50%
60%
70%
80%
90%
100%
2013 2014 2015 2016 2017 2018
Process of Care Patient Outcomes Patient Experience of Care Efficiency Safety Clinical Care
+
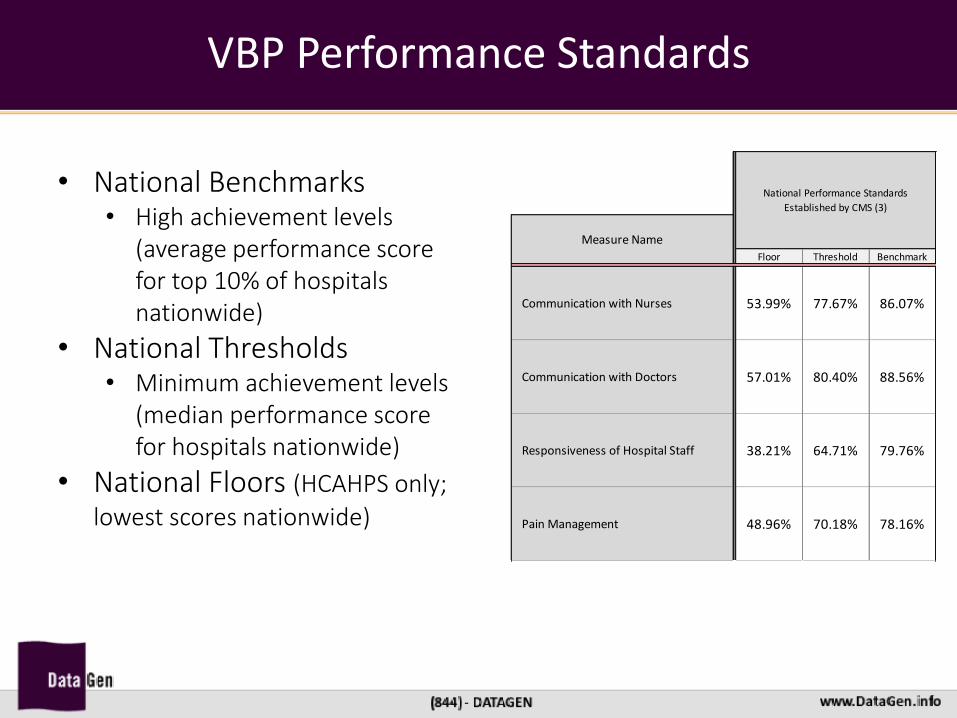
• National Benchmarks • High achievement levels
(average performance score for top 10% of hospitals nationwide)
• National Thresholds • Minimum achievement levels
(median performance score for hospitals nationwide)
• National Floors (HCAHPS only;
lowest scores nationwide)
VBP Performance Standards
Floor Threshold Benchmark
Communication with Nurses 53.99% 77.67% 86.07%
Communication with Doctors 57.01% 80.40% 88.56%
Responsiveness of Hospital Staff 38.21% 64.71% 79.76%
Pain Management 48.96% 70.18% 78.16%
Measure Name
National Performance Standards
Established by CMS (3)
VBP Measure Scoring: Achievement Points
Case Count Measure Score Case Count Measure Score Threshold Benchmark
SCIP_INF
_3
Prophylactic Antibiotics Discontinued Within 24
Hours After Surgery End Time392 99% 440 98% 97.494% 100% 6 5 6
Achievement
Points
Earned (4)
Measure Name
Hospital PerformanceMeasure
ID
Performance Period
Analyzed (1)
Baseline Period
Analyzed (2)
Hospital Performance
Final Points
Earned (6)
Improvement
Points
Earned (5)
National Performance
Standards Established
by CMS (3)
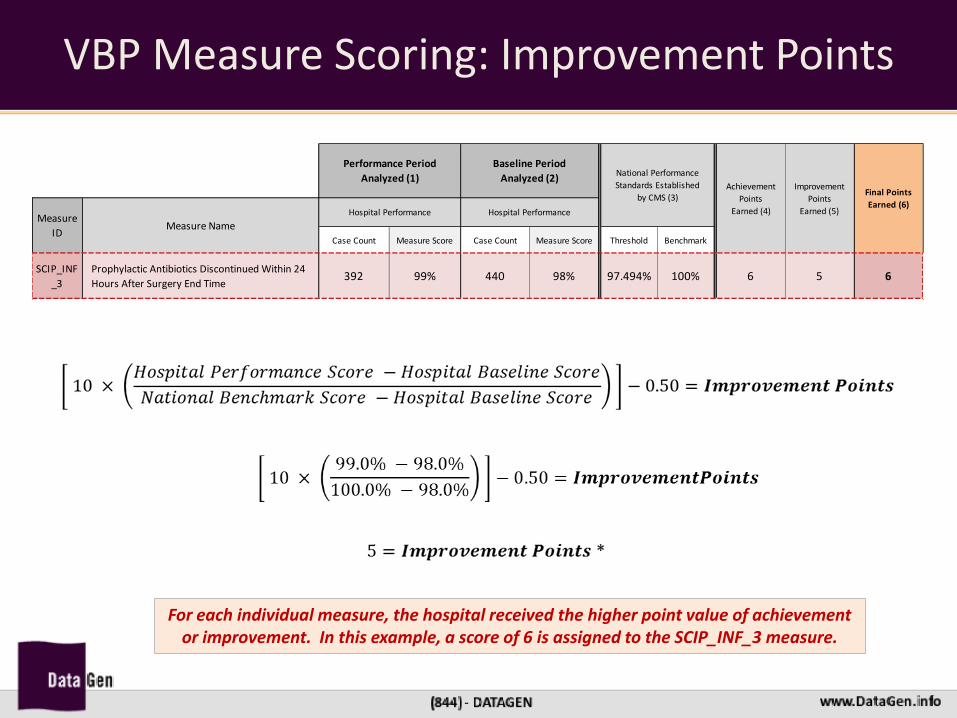
VBP Measure Scoring: Improvement Points
Case Count Measure Score Case Count Measure Score Threshold Benchmark
SCIP_INF
_3
Prophylactic Antibiotics Discontinued Within 24
Hours After Surgery End Time392 99% 440 98% 97.494% 100% 6 5 6
Achievement
Points
Earned (4)
Measure Name
Hospital PerformanceMeasure
ID
Performance Period
Analyzed (1)
Baseline Period
Analyzed (2)
Hospital Performance
Final Points
Earned (6)
Improvement
Points
Earned (5)
National Performance
Standards Established
by CMS (3)
For each individual measure, the hospital received the higher point value of achievement or improvement. In this example, a score of 6 is assigned to the SCIP_INF_3 measure.
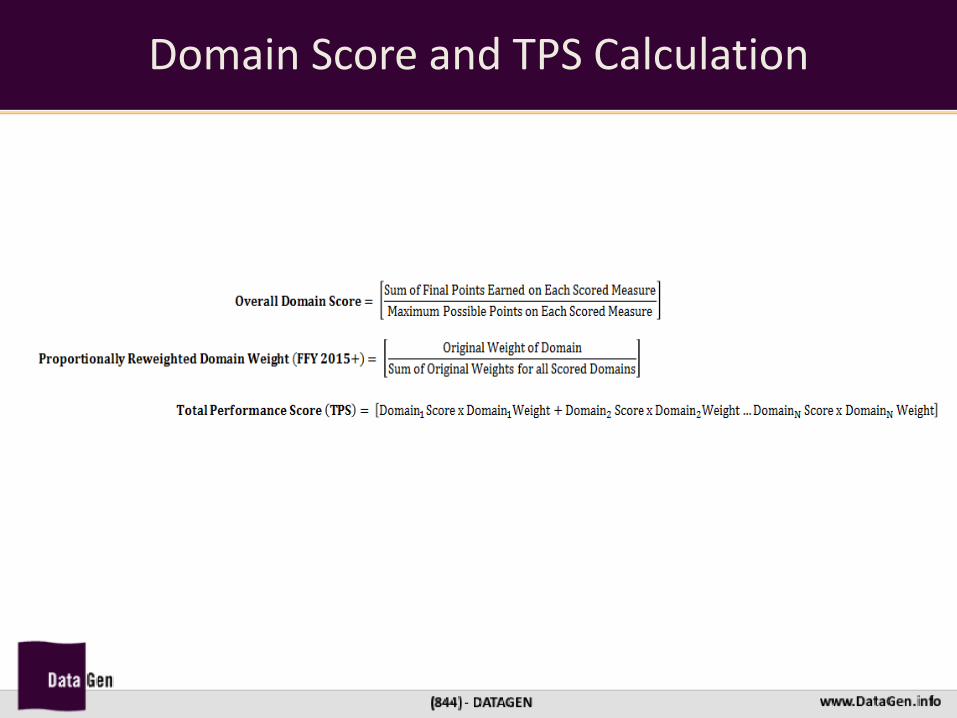
Domain Score and TPS Calculation

VBP Total Performance Score
Unweighted Domain
Score
Original Domain
Weight
Proportionally
Reweighted Domain
Weight *
Weighted Score(Unweighted Domain Score X
Reweighted Domain Weight)
68.57% 10.00% 10.00% 6.86%
58.00% 25.00% 25.00% 14.50%
24.29% 40.00% 40.00% 9.71%
20.00% 25.00% 25.00% 5.00%
36.07%
Patient Experience Domain
Efficiency Domain
Process Domain
Patient Outcomes Domain
Total VBP Performance Score (TPS) (Sum of weighted scores)
• Each domain score is calculated separately by adding measure components and taking percentage
• Domain scores are then weighted together
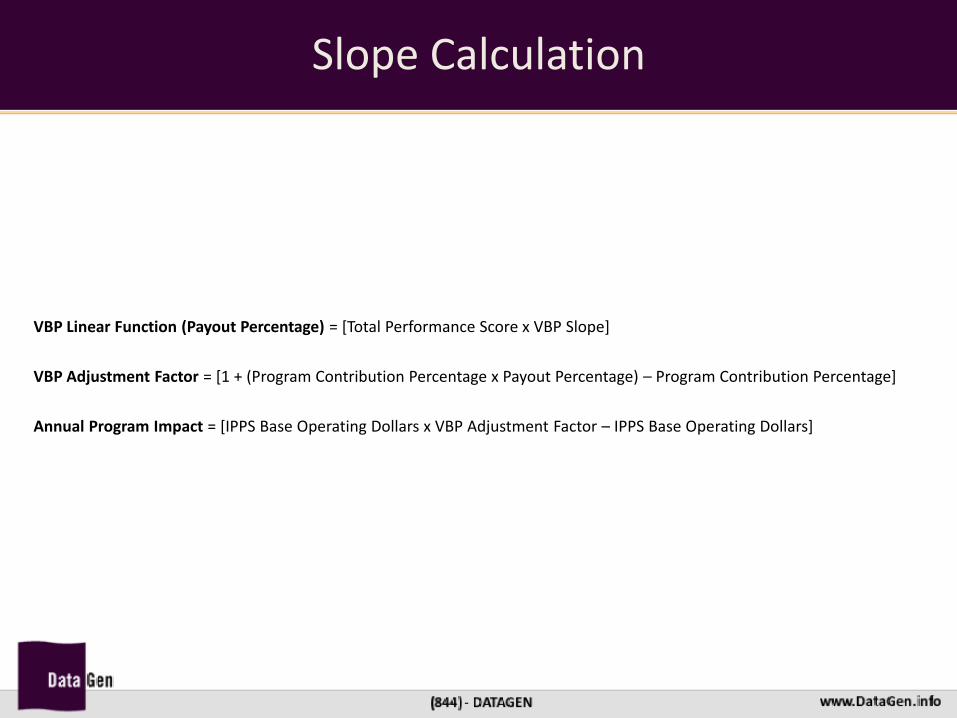
Slope Calculation
VBP Linear Function (Payout Percentage) = [Total Performance Score x VBP Slope]
VBP Adjustment Factor = [1 + (Program Contribution Percentage x Payout Percentage) – Program Contribution Percentage]
Annual Program Impact = [IPPS Base Operating Dollars x VBP Adjustment Factor – IPPS Base Operating Dollars]
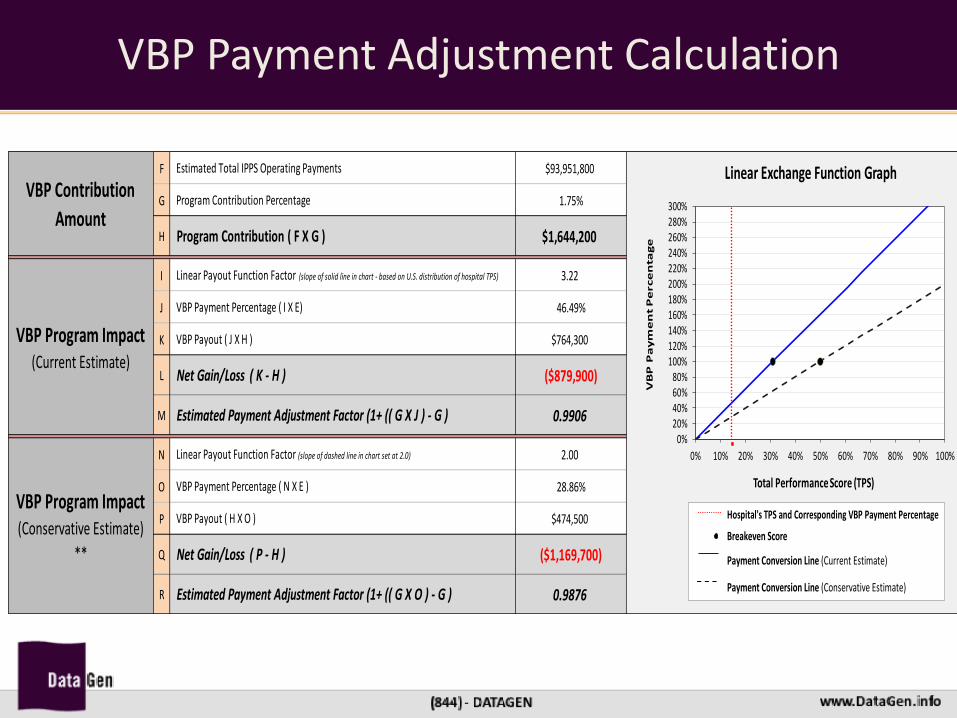
VBP Payment Adjustment Calculation
F $93,951,800
G 1.75%
H $1,644,200
I 3.22
J 46.49%
K $764,300
L ($879,900)
M 0.9906
N 2.00
O 28.86%
P $474,500
Q ($1,169,700)
R 0.9876
Estimated Payment Adjustment Factor (1+ (( G X J ) - G )
Program Contribution ( F X G )
VBP Payout ( H X O )
Linear Payout Function Factor (slope of dashed line in chart set at 2.0)
VBP Payment Percentage ( I X E)
Net Gain/Loss ( K - H )
Linear Payout Function Factor (slope of solid line in chart - based on U.S. distribution of hospital TPS)
VBP Program Impact (Current Estimate)
VBP Payout ( J X H )
Program Contribution Percentage
Estimated Total IPPS Operating Payments
Estimated Payment Adjustment Factor (1+ (( G X O ) - G )
VBP Contribution
Amount
Net Gain/Loss ( P - H )
VBP Program Impact (Conservative Estimate)
**
VBP Payment Percentage ( N X E )
0%20%40%60%80%
100%120%140%160%180%200%220%240%260%280%300%
0% 10% 20% 30% 40% 50% 60% 70% 80% 90% 100%
VB
P P
ay
me
nt
Pe
rce
nta
ge
Total Performance Score (TPS)
Linear Exchange Function Graph
Hospital's TPS and Corresponding VBP Payment Percentage
Breakeven Score
Payment Conversion Line (Current Estimate)
Payment Conversion Line (Conservative Estimate)
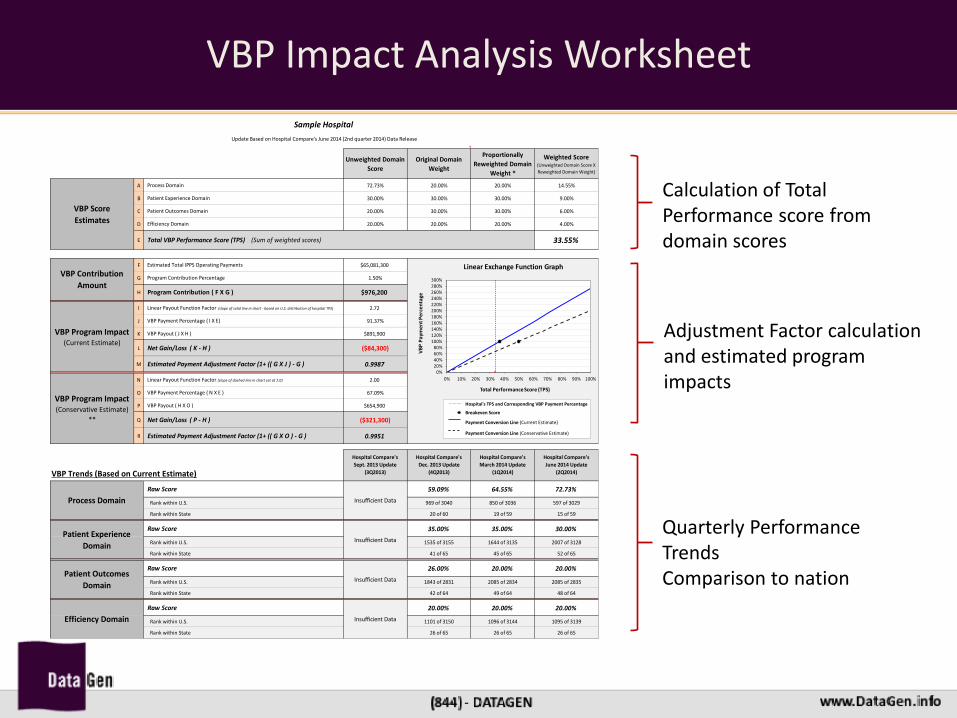
VBP Impact Analysis Worksheet
1
Unweighted Domain
Score
Original Domain
Weight
Proportionally
Reweighted Domain
Weight *
Weighted Score(Unweighted Domain Score X
Reweighted Domain Weight)
A 72.73% 20.00% 20.00% 14.55%
B 30.00% 30.00% 30.00% 9.00%
C 20.00% 30.00% 30.00% 6.00%
D 20.00% 20.00% 20.00% 4.00%
E 33.55%
F $65,081,300
G 1.50%
H $976,200
I 2.72
J 91.37%
K $891,900
L ($84,300)
M 0.9987
N 2.00
O 67.09%
P $654,900
Q ($321,300)
R 0.9951
VBP Trends (Based on Current Estimate)
Hospital Compare's
Sept. 2013 Update
(3Q2013)
Hospital Compare's
Dec. 2013 Update
(4Q2013)
Hospital Compare's
March 2014 Update
(1Q2014)
Hospital Compare's
June 2014 Update
(2Q2014)
59.09% 64.55% 72.73%
969 of 3040 850 of 3036 597 of 3029
20 of 60 19 of 59 15 of 59
35.00% 35.00% 30.00%
1535 of 3155 1644 of 3135 2007 of 3128
41 of 65 45 of 65 52 of 65
26.00% 20.00% 20.00%
1843 of 2831 2085 of 2834 2085 of 2835
42 of 64 49 of 64 48 of 64
20.00% 20.00% 20.00%
1101 of 3150 1096 of 3144 1095 of 3139
26 of 65 26 of 65 26 of 65
Efficiency Domain
Raw Score
Rank within State
Rank within U.S.
Patient Experience
Domain Rank within U.S.
Patient Outcomes
Domain
Raw Score
Rank within State
Rank within U.S.
Insufficient Data
Insufficient Data
Insufficient Data
Estimated Payment Adjustment Factor (1+ (( G X O ) - G )
Rank within State
Rank within State
Rank within U.S.
Raw Score
VBP Program Impact (Conservative Estimate)
**
VBP Program Impact (Current Estimate)
VBP Payout ( J X H )
Linear Payout Function Factor (slope of solid line in chart - based on U.S. distribution of hospital TPS)
VBP Payment Percentage ( I X E)
Net Gain/Loss ( K - H )
VBP Payment Percentage ( N X E )
Estimated Payment Adjustment Factor (1+ (( G X J ) - G )
Raw Score
Insufficient DataProcess Domain
Linear Payout Function Factor (slope of dashed line in chart set at 2.0)
VBP Payout ( H X O )
Net Gain/Loss ( P - H )
Patient Experience Domain
Program Contribution ( F X G )
Efficiency Domain
Estimated Total IPPS Operating Payments
Patient Outcomes Domain
Program Contribution Percentage
Medicare Hospital VBP Analysis
Estimated FFY 2015 Program Performance
Update Based on Hospital Compare's June 2014 (2nd quarter 2014) Data Release
VBP Contribution
Amount
Score, Impact, and Trend Estimates
VBP Score
Estimates
Total VBP Performance Score (TPS) (Sum of weighted scores)
Sample Hospital
Process Domain
0%20%40%60%80%
100%120%140%160%180%200%220%240%260%280%300%
0% 10% 20% 30% 40% 50% 60% 70% 80% 90% 100%
VB
P P
aym
en
t P
erc
en
tage
Total Performance Score (TPS)
Linear Exchange Function Graph
Hospital's TPS and Corresponding VBP Payment Percentage
Breakeven Score
Payment Conversion Line (Current Estimate)
Payment Conversion Line (Conservative Estimate)
Calculation of Total Performance score from domain scores
Adjustment Factor calculation and estimated program impacts
Quarterly Performance Trends Comparison to nation

VBP Performance Scorecard Worksheet
• Actual VBP scores and estimated scores
• Year-to-year improvement in performance on a measure does not guarantee improved score
AMI-7a N/A N/A N/A N/A N/A N/A N/A
AMI-8a N/A 87.5% 0 96.4% ▲ 3 ▲
SCIP-Inf-1 2 97.8% ▲ 5 ▲ 99.3% ▲ 8 ▲
SCIP-Inf-2 2 99.2% ▲ 6 ▲ 99.5% ▲ 7 ▲ 99.0% ▼ 0 ▼
SCIP-Inf-3 0 94.5% ▲ 2 ▲ 95.8% ▲ 5 ▲ 96.0% ▲ 2 ▼
SCIP-Inf-4 9 94.3% ▼ 0 ▼ 96.4% ▲ 2 ▲
SCIP-Inf-9 93.1% 5 95.5% ▲ 6 ▲ 96.0% ▲ 4 ▼
HF-1 4 92.0% ▲ 3 ▼ 93.9% ▲ 3 ▲
PN-3b 0 96.7% ▲ 2 ▲ 97.0% ▲ 4 ▲
PN-6 5 94.1% ▼ 0 ▼ 96.7% ▲ 2 ▲ 94.0% ▼ 0 ▼
SCIP-Card-2 3 98.3% ▲ 8 ▲ 98.6% ▲ 7 ▼ 99.0% ▲ 6 ▼
SCIP-VTE-1 5 99.3% ▲ 8 ▲
SCIP-VTE-2 2 95.9% ▲ 2 ▲ 98.2% ▲ 6 ▲ 99.0% ▲ 7 ▲
IMM-2 90.0% 1
Unweighted Domain Score ▲ ▲ ▼28.6%
gggggg
gg
gggggg
ggg
gggg
gg
ggggggg
ggg
gggggggg
ggggggg
ggggg
Measure Not Evaluated for VBP 2013
gg gg
34.2%
Measure Not Evaluated for VBP 2015
Measure Not Evaluated for VBP 2014
gggggggg gggggg
98.9%
90.6%
95.6%
95.8%
95.0%
gg
ggg
Measure Not Evaluated for VBP 2015
gg
gggg
Measure Not Evaluated for VBP 2016
Measure Not Evaluated for VBP 2016
Measure Not Evaluated for VBP 2016
g
ggggggg
Hospital
PerformanceVBP Measure Score
gg
gggggg
Measure Not Evaluated for VBP 2016ggggg
Projected to be Eligible
ggggg
FFY 2013 Program ACTUAL Performance FFY 2014 Program ACTUAL Performance
Measure and Domain Score Comparison
48.2%
ggg
97.6%
Hospital
Performance
N/A
gggggggg
Hospital
PerformanceHospital Performance
ggggg
93.6%
95.1% gg
gg
VBP Measure Score
Eligible Eligible
VBP Measure Score VBP Measure Score
Eligible
FFY 2016 Program ESTIMATED PerformanceFFY 2015 Program ACTUAL Performance
Pro
ce
ss o
f C
are
ggggggggg
94.1%
32.0%
Measure Not Evaluated for VBP 2013
ggggg
97.4%
gggg
N/A
Program Eligibility

Value Based Purchasing Program Trends
• Chasing a moving target
• Measures/Domains
• National Improvement Trends
• Performance Standards
Scheduled Quarterly Release June 2011 Sept. 2011 Dec. 2011 Mar. 2012 June 2012 Sept. 2012 Dec. 2012 Mar. 2013 June 2013 Sept. 2013 Dec. 2013 Mar. 2014 June 2014
Data Collection DatesOct. 1, 2009 - Sept.
30, 2010
Jan. 1, 2010 - Dec.
31, 2010
Apr. 1, 2010 - Mar.
31, 2011
Jul. 1, 2010 - June
30, 2011
Oct. 1, 2010 - Sept.
30, 2011
Jan. 1, 2011 - Dec.
31, 2011
Apr. 1, 2011 - Mar.
31, 2012
Jul. 1, 2011 - June
30, 2012
Oct. 1, 2011 - Sept.
30, 2012
Jan. 1, 2012 - Dec.
31, 2012
Apr. 1, 2012 - Mar.
31, 2013
Jul. 1, 2012 - June
30, 2013
Oct. 1, 2012 - Sept.
30, 2013
Hospital Performance 96% 97% 97% 97% 98% 98% 99% 99% 99% 99% 99% 99% 100%CASES 247 273 303 301 291 292 290 307 312 315 298 282 300
U.S. Top 10% 100% 100% 100% 100% 100% 100% 100% 100% 100% 100% 100% 100% 100%
U.S. Average 89% 90% 90% 91% 92% 92% 93% 93% 93% 94% 94% 94% 94%
U.S. Rank 943 of 3269 820 of 3264 876 of 3248 944 of 3243 772 of 3233 760 of 3209 586 of 3176 611 of 3169 619 of 3144 647 of 3131 683 of 3122 718 of 3133 1 of 3119
State Rank 3 of 8 2 of 7 3 of 8 2 of 7 3 of 8 3 of 8 2 of 7 2 of 7 2 of 6 2 of 6 1 of 7 1 of 7 1 of 7
Applicable to the 2013, 2014 and 2015 VBP Programs.
HF_1: Discharge Instructions
96%
100%100% 100%
89%
94%
88%
90%
92%
94%
96%
98%
100%
102%
Providence Alaska MedicalCenter
U.S. Top 10%
U.S. Average
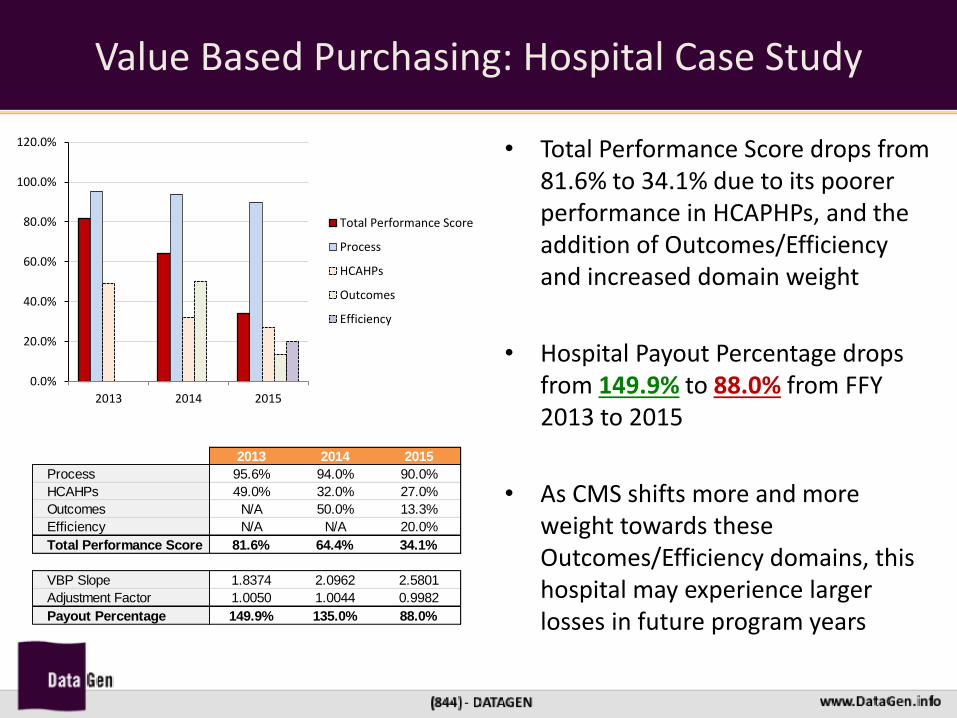
Value Based Purchasing: Hospital Case Study
• Total Performance Score drops from 81.6% to 34.1% due to its poorer performance in HCAPHPs, and the addition of Outcomes/Efficiency and increased domain weight
• Hospital Payout Percentage drops from 149.9% to 88.0% from FFY 2013 to 2015
• As CMS shifts more and more weight towards these Outcomes/Efficiency domains, this hospital may experience larger losses in future program years
0.0%
20.0%
40.0%
60.0%
80.0%
100.0%
120.0%
2013 2014 2015
Total Performance Score
Process
HCAHPs
Outcomes
Efficiency
2013 2014 2015
Process 95.6% 94.0% 90.0%
HCAHPs 49.0% 32.0% 27.0%
Outcomes N/A 50.0% 13.3%
Efficiency N/A N/A 20.0%
Total Performance Score 81.6% 64.4% 34.1%
VBP Slope 1.8374 2.0962 2.5801
Adjustment Factor 1.0050 1.0044 0.9982
Payout Percentage 149.9% 135.0% 88.0%
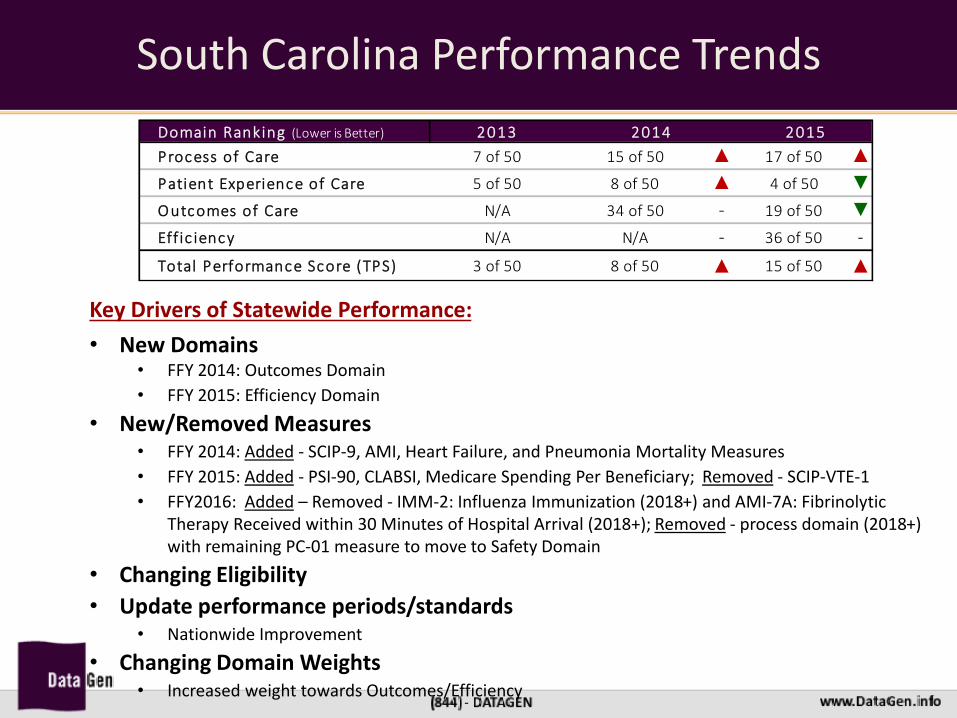
South Carolina Performance Trends
Key Drivers of Statewide Performance:
• New Domains • FFY 2014: Outcomes Domain
• FFY 2015: Efficiency Domain
• New/Removed Measures • FFY 2014: Added - SCIP-9, AMI, Heart Failure, and Pneumonia Mortality Measures
• FFY 2015: Added - PSI-90, CLABSI, Medicare Spending Per Beneficiary; Removed - SCIP-VTE-1
• FFY2016: Added – Removed - IMM-2: Influenza Immunization (2018+) and AMI-7A: Fibrinolytic Therapy Received within 30 Minutes of Hospital Arrival (2018+); Removed - process domain (2018+) with remaining PC-01 measure to move to Safety Domain
• Changing Eligibility
• Update performance periods/standards • Nationwide Improvement
• Changing Domain Weights • Increased weight towards Outcomes/Efficiency
Domain Ranking (Lower is Better) 2013
Process of Care 7 of 50 15 of 50 ▲ 17 of 50 ▲
Patient Experience of Care 5 of 50 8 of 50 ▲ 4 of 50 ▼
Outcomes of Care N/A 34 of 50 - 19 of 50 ▼
Effic iency N/A N/A - 36 of 50 -
Total Performance Score (TPS) 3 of 50 8 of 50 ▲ 15 of 50 ▲
2014 2015
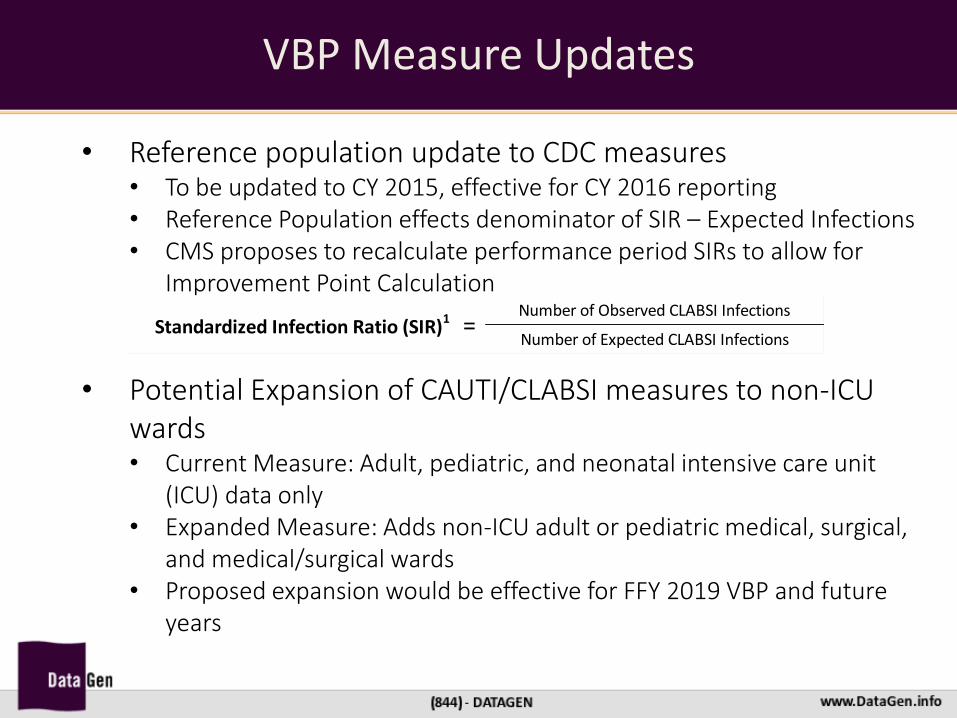
VBP Measure Updates
• Reference population update to CDC measures • To be updated to CY 2015, effective for CY 2016 reporting • Reference Population effects denominator of SIR – Expected Infections • CMS proposes to recalculate performance period SIRs to allow for
Improvement Point Calculation
• Potential Expansion of CAUTI/CLABSI measures to non-ICU wards • Current Measure: Adult, pediatric, and neonatal intensive care unit
(ICU) data only • Expanded Measure: Adds non-ICU adult or pediatric medical, surgical,
and medical/surgical wards • Proposed expansion would be effective for FFY 2019 VBP and future
years
=Standardized Infection Ratio (SIR)1
Number of Observed CLABSI Infections
Number of Expected CLABSI Infections
0.000
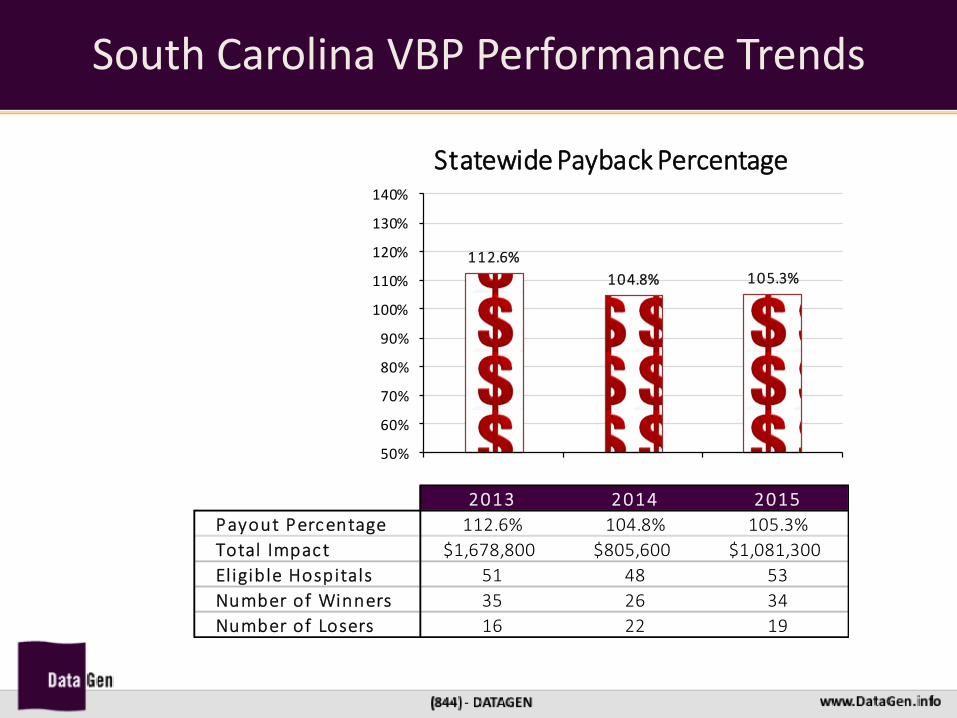
South Carolina VBP Performance Trends
2013 2014 2015
Payout Percentage 112.6% 104.8% 105.3%
Total Impact $1,678,800 $805,600 $1,081,300
Eligible Hospitals 51 48 53
Number of Winners 35 26 34
Number of Losers 16 22 19
112.6%
104.8% 105.3%
50%
60%
70%
80%
90%
100%
110%
120%
130%
140%
Statewide Payback Percentage

VBP Program Timeframes
FFY 2016 VBP Program Timeframes
J F M A M J J A S O N D J F M A M J J A S O N D J F M A M J J A S O N D J F M A M J J A S O N D J F M A M J J A S O N D J F M A M J J A S O N D J F M A M J J A S O N D
Outcomes of Care
(Mortality & PSI-90):
Baseline Period6
Outcomes of Care
(Mortality & PSI-90):
Performance Period7
Efficiency of Care:
Baseline Period6
Efficiency of Care:
Performance Period7
FFY 2016
Payment Adjustment
2014 2015 2016
Process of Care:
Baseline Period6
Process of Care:
Performance Period7
Outcomes of Care
(HAI Measures):
Baseline Period6
Outcomes of Care
(HAI Measures):
Performance Period7
Patient Experience of Care:
Baseline Period6
Patient Experience of Care:
Performance Period7
2010 2011 2012 2013

VBP Program Timeframes
FFY 2017 VBP Program Timeframes
J F M A M J J A S O N D J F M A M J J A S O N D J F M A M J J A S O N D J F M A M J J A S O N D J F M A M J J A S O N D J F M A M J J A S O N D J F M A M J J A S O N D J F M A M J J A S O N D
Efficiency and Cost Reduction:
Baseline Period
Efficiency and Cost Reduction:
Performance Period
2010
Clinical Care - Outcomes:
Baseline Period
Clinical Care - Outcomes:
Performance Period
Safety of Care (PSI-90):
Baseline Period
2015 2016 2017
Clinical Care - Process:
Baseline Period
Clinical Care - Process:
Performance Period
FFY 2017
Payment Adjustment
Patient Experience of Care:
Baseline Period
Patient Experience of Care:
Performance Period
Safety of Care (All other):
Performance Period
Safety of Care (All other):
Baseline Period
Safety of Care (PSI-90):
Performance Period
2011 2012 2013 2014
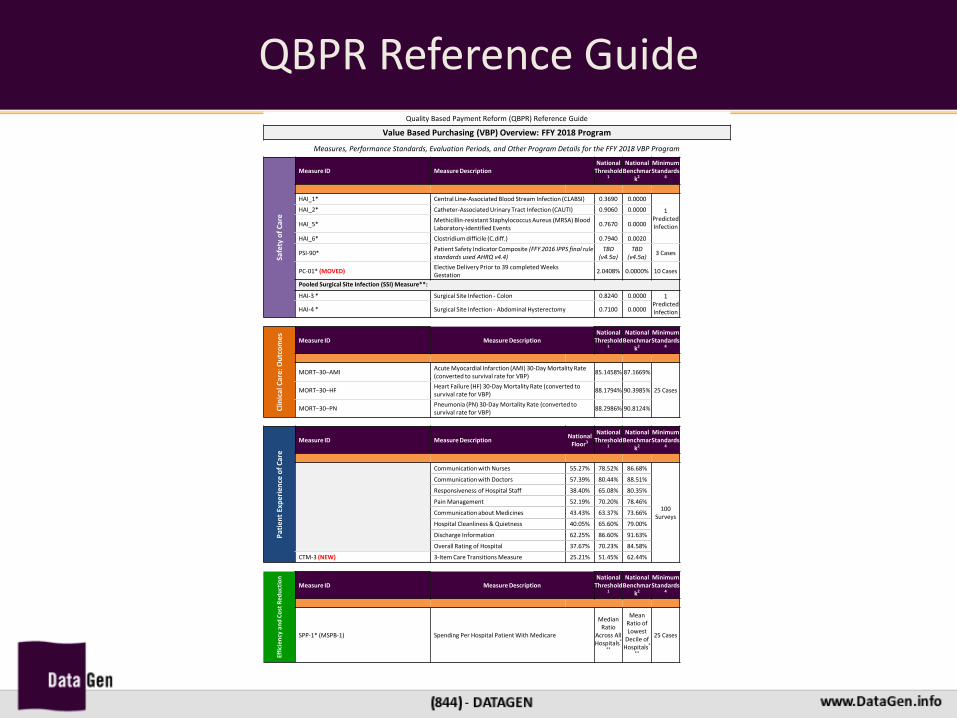
QBPR Reference Guide Quality Based Payment Reform (QBPR) Reference Guide
Value Based Purchasing (VBP) Overview: FFY 2018 Program
Measures, Performance Standards, Evaluation Periods, and Other Program Details for the FFY 2018 VBP Program
Safe
ty o
f C
are
Measure ID Measure Description National
Threshold1
National Benchmar
k2
Minimum Standards
4
HAI_1* Central Line-Associated Blood Stream Infection (CLABSI) 0.3690 0.0000
1 Predicted Infection
HAI_2* Catheter-Associated Urinary Tract Infection (CAUTI) 0.9060 0.0000
HAI_5* Methicillin-resistant Staphylococcus Aureus (MRSA) Blood Laboratory-identified Events
0.7670 0.0000
HAI_6* Clostridium difficile (C.diff.) 0.7940 0.0020
PSI-90* Patient Safety Indicator Composite (FFY 2016 IPPS final rule standards used AHRQ v4.4)
TBD (v4.5a)
TBD (v4.5a)
3 Cases
PC-01* (MOVED) Elective Delivery Prior to 39 completed Weeks Gestation
2.0408% 0.0000% 10 Cases
Pooled Surgical Site Infection (SSI) Measure**:
HAI-3 * Surgical Site Infection - Colon 0.8240 0.0000 1 Predicted Infection
HAI-4 * Surgical Site Infection - Abdominal Hysterectomy 0.7100 0.0000
Clin
ica
l Car
e: O
utc
om
es
Measure ID Measure Description National
Threshold1
National Benchmar
k2
Minimum Standards
4
MORT–30–AMI Acute Myocardial Infarction (AMI) 30-Day Mortality Rate (converted to survival rate for VBP)
85.1458% 87.1669%
25 Cases
MORT–30–HF Heart Failure (HF) 30-Day Mortality Rate (converted to survival rate for VBP)
88.1794% 90.3985%
MORT–30–PN Pneumonia (PN) 30-Day Mortality Rate (converted to survival rate for VBP)
88.2986% 90.8124%
Pat
ien
t Ex
per
ien
ce o
f C
are
Measure ID Measure Description National
Floor3
National Threshold
1
National Benchmar
k2
Minimum Standards
4
Communication with Nurses 55.27% 78.52% 86.68%
100 Surveys
Communication with Doctors 57.39% 80.44% 88.51%
Responsiveness of Hospital Staff 38.40% 65.08% 80.35%
Pain Management 52.19% 70.20% 78.46%
Communication about Medicines 43.43% 63.37% 73.66%
Hospital Cleanliness & Quietness 40.05% 65.60% 79.00%
Discharge Information 62.25% 86.60% 91.63%
Overall Rating of Hospital 37.67% 70.23% 84.58%
CTM-3 (NEW) 3-Item Care Transitions Measure 25.21% 51.45% 62.44%
Effi
cien
cy a
nd
Co
st R
edu
ctio
n
Measure ID Measure Description National
Threshold1
National Benchmar
k2
Minimum Standards
4
SPP-1* (MSPB-1) Spending Per Hospital Patient With Medicare
Median Ratio
Across All Hospitals*
**
Mean Ratio of Lowest
Decile of Hospitals*
**
25 Cases
0%
10%
20%
30%
40%
50%
60%
70%
80%
90%
100%
Total Performance Score: Original Domain Weighting5
Efficiency and Cost
Reduction 25%
Safety of Care 25%
Clinical Care:
Outcomes 25%
Clinical Care: Process 5%
Patient Experience
of Care 25%
Other SCHA / DataGen Quality Webinars
• Readmission Reduction Program – Nov 17 @ 1p.m.
• Invitation to all South Carolina hospitals
– Finance teams
– Quality teams
– Executive team
• Registration is required

Questions?